i-99 environmental research final report
TRANSCRIPT

I-99 Environmental Research
Final Report
Executive Summaries
Rafael Quimpo, Ronald Neufeld, Donald Spaeder, George Reese
Editor: Jason D. Monnell, Ph.D.
The University of Pittsburgh
Civil & Environmental Engineering Department
GAI Consultants
March 2007

Technical Report Documentation Page 1. Report No.
FHWA-PA-2007-003-030207
2. Government Accession No.
3. Recipient’s Catalog No.
5. Report Date
March 5, 2007
4. Title and Subtitle
I-99 Environmental Research
6. Performing Organization Code
7. Author(s)
R. G Quimpo, R. D. Neufeld, J. D. Monnell, D. Spaeder, and G. Reese
8. Performing Organization Report No.
UPGH-CEE-EWR-2007-1
10. Work Unit No. (TRAIS)
9. Performing Organization Name and Address
Department of Civil and Environmental Engineering University of Pittsburgh Pittsburgh, PA 15211
11. Contract or Grant No. 030207 13. Type of Report and Period Covered
Final Report, May 12, 2004 to March 5, 2007
12. Sponsoring Agency Name and Address
The Pennsylvania Department of Transportation Bureau of Planning and Research Commonwealth Keystone Building 400 North Street, 6
th Floor
Harrisburg, PA 17120-0064
14. Sponsoring Agency Code
15. Supplementary Notes
16. Abstract
Findings and recommendations are summarized from results of four tasks in the project. These covered the evaluation of erosion and sediment controls to determine Best Management Practice, the development of a runoff prediction model for watersheds engendered by highway construction, the assessment of hydro-biological indicators for land-use planning in highway corridors and the evaluation of the effectiveness of stream restoration, rehabilitation and relocation as part of the mitigation strategy. 17. Key Words
E&S Best Management practice, runoff prediction for highway watersheds, Hydro-biological indicators for land-use planning for highway corridors, stream restoration, rehabilitation and relocation
18. Distribution Statement
No restrictions. This document is available from the National Technical Information Service, Springfield, VA 22161
19. Security Classif. (of this report)
Unclassified
20. Security Classif. (of this page)
Unclassified
21. No. of Pages
37
22. Price
Form DOT F 1700.7 (8-72) Reproduction

I-99 Environmental Research – Executive Summaries
I-99 EVIRONMENTAL RESEARCH
This is a compilation of the Executive Summaries for each of the four tasks in the I-99
Environmental Research project. It being submitted to provide a concise document which
describes the scope of work, findings, conclusions and recommendations.
Introduction
The purpose of the research is to monitor and evaluate the effectiveness of various mitigation
techniques that were implemented during the construction of a section of I-99. Highway
construction causes changes in drainage patterns and disturbs the natural landscape. The
project’s objective is to conduct research during the construction phase to minimize and assess
the impacts of highway construction by establishing best management practices for erosion and
sedimentation, to monitor the hydrologic and biologic conditions in highway corridors and to
assess the effectiveness of wetland mitigation and stream restoration strategies.
This project involves four specific tasks:
A. Evaluation of approved erosion and sediment controls to determine Best Management
Practice
B. Hydrologic Monitoring and Modeling
C. Monitoring and assessment of wetland hydro-biological indicators for land-use planning in
highway corridors
D. Evaluation of the effectiveness and sustainability of stream restoration, rehabilitation and
relocation projects as part of mitigation for road construction
Because of the broad coverage of subjects treated under the project, detailed findings for each of
the above tasks are documented in separately-bound reports. In each report, recommendations
are also presented.
Only the executive summary for each of the above tasks are presented in this volume.
I-99 Environmental Research – Executive Summaries
I-99 EVIRONMENTAL RESEARCH 2
SECTION 1
EXECUTIVE SUMMARIES
Task A – Evaluation of Approved Erosion &Sediment Controls to Determine Best
Management Practice – Leader: Ronald D. Neufeld
The Pennsylvania Department of Environmental Protection (PADEP) requires the
implementation and maintenance of erosion and sediment control best management practices
(BMPs) to minimize the potential for accelerated erosion and sedimentation, including for those
activities (non-agricultural) which disturb less than 5,000 square feet (464.5 square meters). In
this project, we have compared and evaluated the implementation of current BMPs at the I-99
construction sites to proposed BMPs in regards to their applicability for highway construction.
The primary objective was to develop an evaluation of erosion and sediment controls existing at
the I-99 site and to suggest a set of BMPs best suited for future highway construction projects.
Best management practices for erosion and sediment control for highway construction sites are
measures designed to reduce the amount of sediment leaving a construction site and to prevent
them from entering nearby surface waters. Some of the BMPs commonly associated with land
disturbance and construction activities are sediment basins, sediment traps, silt fence, vegetative
filter strips, straw bale barriers, rock filters and erosion control blankets. In our assessment of
these key issues, we conducted periodic monitoring of selected sedimentation ponds and silt
fences for changes in condition and identified possible solutions to potential deficiencies or
problems as they were observed.
Sedimentation Ponds Current BMPs for controlling construction site runoff focus
primarily on reducing the quantity of runoff rather than the quality of runoff. Particle removal is
an environmentally critical criterion that is a large component of runoff quality which is not
considered in current designs. Sedimentation ponds were designed and installed along the I-99
corridor with two purposes in mind: (1) to initially contain sediment contained in run-off during
the construction process, and (2) to attenuate rainfall runoff and contain potential spills from
overturned tank trucks accidents during the longer-term operation of the highway. As a result of
our assessments, we suggest BMPs that control both the quantity and quality of runoff. These
BMPs are based on a more theory-based analytical procedure for arriving at SB volume,
sediment storage zone volume, sediment dredging frequency and basin drainage time while
taking into account rainfall intensity and frequency, and basin effluent suspended solids.
Procedural details for design are included in the final report. Sampling and associated laboratory
analysis showed a strong correlation of iron and aluminum with particulate effluent suspended
solids. The suggested BMPs incorporating designed control of effluent suspended solids will
concomitantly reduce metal loadings into receiving waters and down-slope game lands.
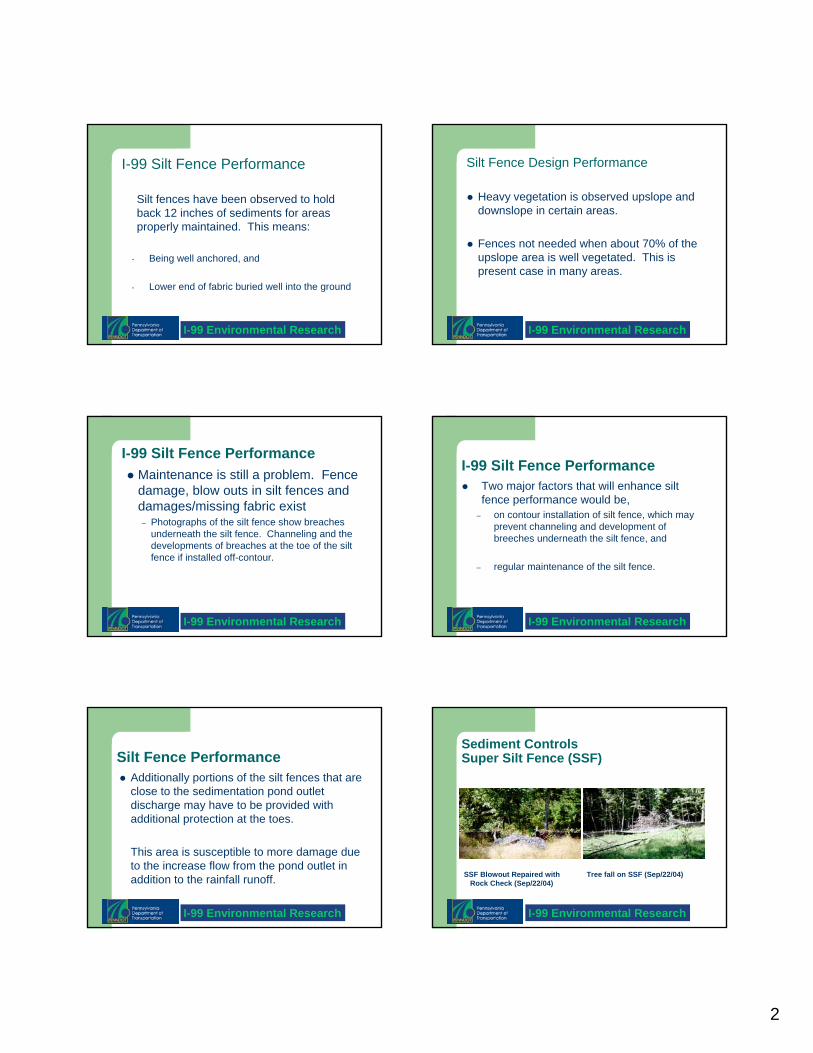
Silt Fences Super silt fences (fabric fencing backed with metal support) are employed along
the I-99 right of way boundary down slope from sedimentation basins to help control runoff.
The performance of these fences depends on several factors. For example it was observed that
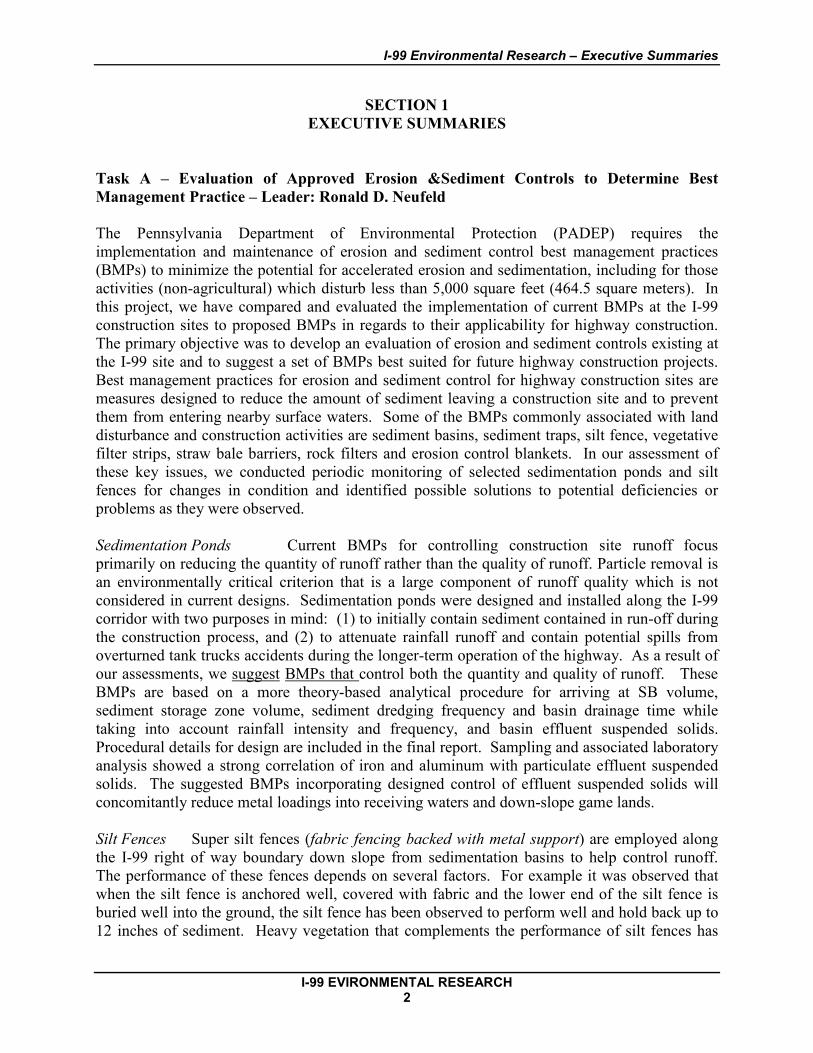
when the silt fence is anchored well, covered with fabric and the lower end of the silt fence is
buried well into the ground, the silt fence has been observed to perform well and hold back up to
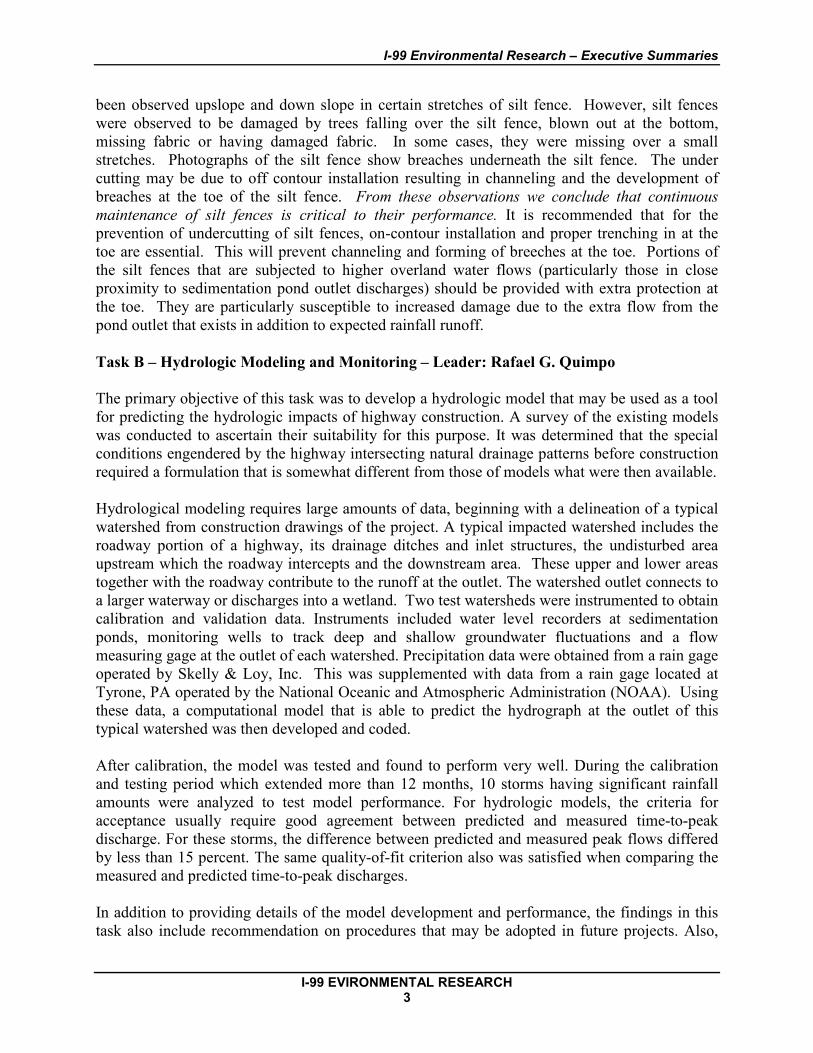
12 inches of sediment. Heavy vegetation that complements the performance of silt fences has
I-99 Environmental Research – Executive Summaries
I-99 EVIRONMENTAL RESEARCH 3
been observed upslope and down slope in certain stretches of silt fence. However, silt fences
were observed to be damaged by trees falling over the silt fence, blown out at the bottom,
missing fabric or having damaged fabric. In some cases, they were missing over a small
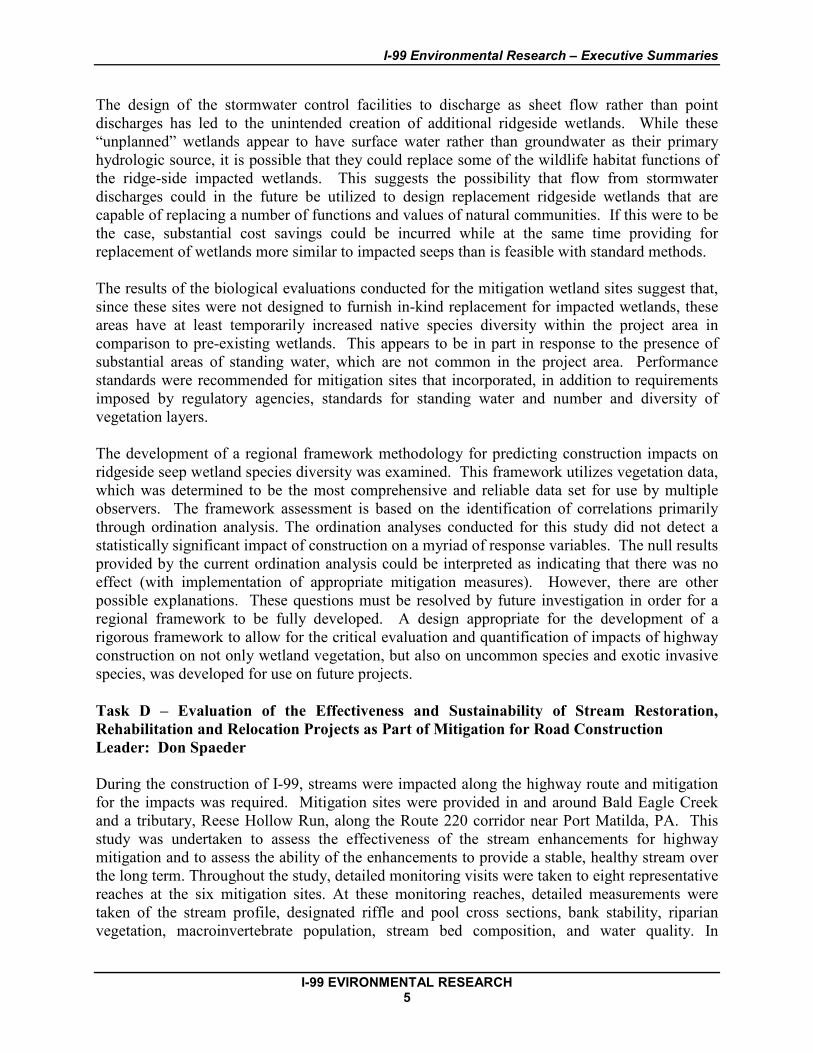
stretches. Photographs of the silt fence show breaches underneath the silt fence. The under
cutting may be due to off contour installation resulting in channeling and the development of
breaches at the toe of the silt fence. From these observations we conclude that continuous
maintenance of silt fences is critical to their performance. It is recommended that for the
prevention of undercutting of silt fences, on-contour installation and proper trenching in at the
toe are essential. This will prevent channeling and forming of breeches at the toe. Portions of
the silt fences that are subjected to higher overland water flows (particularly those in close
proximity to sedimentation pond outlet discharges) should be provided with extra protection at
the toe. They are particularly susceptible to increased damage due to the extra flow from the
pond outlet that exists in addition to expected rainfall runoff.
Task B – Hydrologic Modeling and Monitoring – Leader: Rafael G. Quimpo
The primary objective of this task was to develop a hydrologic model that may be used as a tool
for predicting the hydrologic impacts of highway construction. A survey of the existing models
was conducted to ascertain their suitability for this purpose. It was determined that the special
conditions engendered by the highway intersecting natural drainage patterns before construction
required a formulation that is somewhat different from those of models what were then available.
Hydrological modeling requires large amounts of data, beginning with a delineation of a typical
watershed from construction drawings of the project. A typical impacted watershed includes the
roadway portion of a highway, its drainage ditches and inlet structures, the undisturbed area
upstream which the roadway intercepts and the downstream area. These upper and lower areas
together with the roadway contribute to the runoff at the outlet. The watershed outlet connects to
a larger waterway or discharges into a wetland. Two test watersheds were instrumented to obtain
calibration and validation data. Instruments included water level recorders at sedimentation
ponds, monitoring wells to track deep and shallow groundwater fluctuations and a flow
measuring gage at the outlet of each watershed. Precipitation data were obtained from a rain gage
operated by Skelly & Loy, Inc. This was supplemented with data from a rain gage located at
Tyrone, PA operated by the National Oceanic and Atmospheric Administration (NOAA). Using
these data, a computational model that is able to predict the hydrograph at the outlet of this
typical watershed was then developed and coded.
After calibration, the model was tested and found to perform very well. During the calibration
and testing period which extended more than 12 months, 10 storms having significant rainfall
amounts were analyzed to test model performance. For hydrologic models, the criteria for
acceptance usually require good agreement between predicted and measured time-to-peak
discharge. For these storms, the difference between predicted and measured peak flows differed
by less than 15 percent. The same quality-of-fit criterion also was satisfied when comparing the
measured and predicted time-to-peak discharges.
In addition to providing details of the model development and performance, the findings in this
task also include recommendation on procedures that may be adopted in future projects. Also,

I-99 Environmental Research – Executive Summaries
I-99 EVIRONMENTAL RESEARCH 4
included in the report are the instrumentation and monitoring requirements to carry out similar
evaluations in the future. Data on the cost of instrumentation and monitoring are also provided.
Finally, a Users Guide for using the developed software is also included.
Task C – Monitoring and Assessment of Wetland Hydro-Biological Indicators for Land-
Use Planning in Highway Corridors – Leader: George Reese
The type and magnitude of potential impacts to wetlands were a source of considerable concern
during analyses prepared for permitting of the construction and operation of the I-99 Project. Of
particular concern were the hillside seep wetlands on the slopes of Bald Eagle Mountain. Post-
construction monitoring was undertaken to evaluate the type and extent of impacts that occurred
during construction and to evaluate the success of the mitigation designs that were incorporated
into the project.
Field monitoring was conducted in 2005 and 2006 to evaluate the current conditions. In
addition, pre-and post-construction monitoring data collected by PennDOT and the Pennsylvania
State University were reviewed and incorporated as appropriate. Parameters examined during
this investigation included water chemistry, hydrologic conditions, soil chemistry, soil condition,
vegetation communities, avian communities, amphibian and reptile communities, mammalian
communities, benthic macroinvertebrate populations, and adjacent land uses.
The regulatory agencies in Pennsylvania currently provide for the use of several wetland
assessment methodologies in regulatory procedures. Forty-three methodologies were reviewed
for their applicability for use in Pennsylvania. Three procedures were advanced for detailed
consideration and assessed as part of this Project. Based on this evaluation, the Ohio Rapid
Assessment Method (ORAM) appears to be the most comprehensive and effective assessment
technique currently available to determine wetland functional capacity for the purpose of impact
assessment. The Hydro-Geomorphic Methodology (HGM) would also fulfill this function, but
operational models are not yet available. The ability to provide for mitigation planning
parameters (i.e. design capabilities) was also reviewed. Methods were reviewed and several
were evaluated in the field. Based on this review, the combination of ORAM for rapid
functional assessment and Evaluation for Planned Wetlands (EPW) to address mitigation
planning functions provides for the most comprehensive assessment. Key functions and values
that were found to influence the success of the mitigation wetlands include hydroperiod,
presence and extent of standing water, characteristics of vegetation communities, and overall
wetland vegetation community size.
Pre- and post-construction wetland conditions were reviewed and assessed in relation to Erosion
and Sedimentation (E&S) controls and stormwater/groundwater facilities. Key components of
this system include infiltration galleries, sediment basins, and stormwater management channels.
This review indicated that wetland hydrology has been maintained to date. Groundwater flows
downslope of infiltration galleries have decreased but appear to remain sufficient to maintain
wetland hydrology and plant communities based on the available data. No substantial E&S
control failures or construction-related water quality problems were noted in the wetlands
evaluated.
I-99 Environmental Research – Executive Summaries
I-99 EVIRONMENTAL RESEARCH 5
The design of the stormwater control facilities to discharge as sheet flow rather than point
discharges has led to the unintended creation of additional ridgeside wetlands. While these
“unplanned” wetlands appear to have surface water rather than groundwater as their primary
hydrologic source, it is possible that they could replace some of the wildlife habitat functions of
the ridge-side impacted wetlands. This suggests the possibility that flow from stormwater
discharges could in the future be utilized to design replacement ridgeside wetlands that are
capable of replacing a number of functions and values of natural communities. If this were to be
the case, substantial cost savings could be incurred while at the same time providing for
replacement of wetlands more similar to impacted seeps than is feasible with standard methods.
The results of the biological evaluations conducted for the mitigation wetland sites suggest that,
since these sites were not designed to furnish in-kind replacement for impacted wetlands, these
areas have at least temporarily increased native species diversity within the project area in
comparison to pre-existing wetlands. This appears to be in part in response to the presence of
substantial areas of standing water, which are not common in the project area. Performance
standards were recommended for mitigation sites that incorporated, in addition to requirements
imposed by regulatory agencies, standards for standing water and number and diversity of
vegetation layers.
The development of a regional framework methodology for predicting construction impacts on
ridgeside seep wetland species diversity was examined. This framework utilizes vegetation data,
which was determined to be the most comprehensive and reliable data set for use by multiple
observers. The framework assessment is based on the identification of correlations primarily
through ordination analysis. The ordination analyses conducted for this study did not detect a
statistically significant impact of construction on a myriad of response variables. The null results
provided by the current ordination analysis could be interpreted as indicating that there was no
effect (with implementation of appropriate mitigation measures). However, there are other
possible explanations. These questions must be resolved by future investigation in order for a
regional framework to be fully developed. A design appropriate for the development of a
rigorous framework to allow for the critical evaluation and quantification of impacts of highway
construction on not only wetland vegetation, but also on uncommon species and exotic invasive
species, was developed for use on future projects.
Task D – Evaluation of the Effectiveness and Sustainability of Stream Restoration,
Rehabilitation and Relocation Projects as Part of Mitigation for Road Construction
Leader: Don Spaeder
During the construction of I-99, streams were impacted along the highway route and mitigation
for the impacts was required. Mitigation sites were provided in and around Bald Eagle Creek
and a tributary, Reese Hollow Run, along the Route 220 corridor near Port Matilda, PA. This
study was undertaken to assess the effectiveness of the stream enhancements for highway
mitigation and to assess the ability of the enhancements to provide a stable, healthy stream over
the long term. Throughout the study, detailed monitoring visits were taken to eight representative
reaches at the six mitigation sites. At these monitoring reaches, detailed measurements were
taken of the stream profile, designated riffle and pool cross sections, bank stability, riparian
vegetation, macroinvertebrate population, stream bed composition, and water quality. In

I-99 Environmental Research – Executive Summaries
I-99 EVIRONMENTAL RESEARCH 6
addition, several sediment sampling visits were performed to measure bedload and suspended
sediment transport through the project area.
Six stream reaches were utilized to provide mitigation for the impacts, with four located on Bald
Eagle Creek and two on Reese Hollow Run. Enhancement measures utilized at the various sites
included fencing of the riparian corridor to prevent livestock damage, construction of designated
livestock stream crossings, riparian plantings, rock toe protection of the stream banks, stream
bank / bed regrading, and bank protection / habitat creation using rock structures such as J-hooks
and cross vanes. From the detailed monitoring and analyses of the data, it was concluded that
the construction of electric fencing around the riparian corridor has been a major contributor to
improved stream conditions. The growth of riparian vegetation within the corridor has been
mostly successful and it is expected that damage to the stream banks will be reduced. However,
at several of the monitored sites, invasive vegetative species have become established. Multi-
flora rose has been observed to be the predominant invasive species followed by Japanese
knotweed.
It was observed that much of the mitigation work on Bald Eagle Creek involved bank protection
or redirection of flow away from the banks. As a result of the enhancements and stream plan and
profile, the stream’s energy is being redirected toward the stream bed, which was observed to
convert riffle reaches into pools through bed scour. While this is not likely to cause further
stream instability, an increase in pool lengths and occurrence may lead to a decrease in dissolved
oxygen, an increase in siltation of the stream bed, and other less desirable habitat impacts. In
contrast, erosion of the stream banks leading to overflow channel cuts has been observed
meandering portions of Reese Hollow Run. This observation is typically nothing more than a
natural propagation of meander patterns and as long as it is confined within the conservation
easement and does not impact any stream structures, roads, buildings, etc., such propagation is
not an adverse situation.
It was also observed that some installed rock structures did not function in quite the way they
were intended. Pools downstream of cross vanes have typically filled in, and many of the
structures have been buried by transported material. It was also learned through conversations
with the property owners that the livestock, and thus the farmers, prefer concrete slat livestock
crossings to the riprap and rock crossings. Additionally, one of the study mitigation reaches
passes through Port Matilda Park and is accessible by the public. Part of the enhancements in this
reach was the removal of artificial dams that had been used to create fishing pools, with the
construction of natural pools intended to replace them. These previously installed artificial dams
had caused siltation of the stream bed, covering the substrate and reducing the suitability of the
bed as a habitat and were reversed in the mitigation construction. However, by the end of the
monitoring period, rock and rubble dams had been reconstructed, presumably by the local
populace.
The techniques used for mitigation and enhancement at the I-99 sites have led to a significant
improvement in stream conditions when compared to the pre-construction situation. While some
mitigation measures are more successful than others, the data provided herein combined with the
recommendations for further technique improvement will allow future projects to have
substantial positive impacts on the environment. In addition, a monitoring methodology is

I-99 Environmental Research – Executive Summaries
I-99 EVIRONMENTAL RESEARCH 7
proposed that utilizes a detailed visual technique to provide a series of snapshots of the stream
system, enabling an assessment of enhancement effectiveness over time with a reduction in the
amount of data and associated analysis time.

1
I-99 Environmental Research
I-99 Environmental ResearchOVERVIEW
I-99 Environmental Research
Project Location
I-99 Environmental Research
Project Area
I-99 Environmental Research
Management
Task A: Team Leader: Ronald Neufeld, University of PittsburghTeam includes personnel from:
University of Pittsburgh, GAI ConsultantsGwin, Dobson & Foreman, Inc., Unitec Consulting
EngineersTask B:
Team Leader: Rafael G. Quimpo, University of PittsburghTeam includes personnel from: University of Pittsburgh (CEE and Geological Sciences), AWK Engineers, GwinDobson & Foreman, Inc.
I-99 Environmental Research
Management (Continued)
Task C:Team Leader: George Reese, GAI ConsultantsTeam Includes personnel from:
GAI ConsultantsUniversity of Pittsburgh
Task D:Team Leader: Don Spaeder, GAI Consultants Team Includes personnel from: GAI Consultants,
University of Pittsburgh (CEE and Biological Sciences), Western Pennsylvania Conservancy
I-99 Environmental Research
Objectives
Verification and development of Best Management Practices for Pennsylvania Highways
Develop of transferable models that can be used throughout Pennsylvania
Develop enhanced capabilities to predict impact of construction
Identify suitable mitigation measures for future projectsMonitor and evaluate effectiveness of mitigation
techniques implemented during construction of I-99 to provide improved management of corridor resources
Reduce need for extensive and expensive field monitoring through use of models

2
I-99 Environmental Research
Tasks
A. Evaluation of approved erosion and sediment controls to determine Best Management Practices
B. Hydrologic modeling and monitoringC. Monitoring and assessment of wetland hydro-
biological indicators for land-use planning in highway corridors
D. Evaluation of effectiveness and sustainability of stream restoration, rehabilitation and relocation as part of the mitigation program
I-99 Environmental Research
Overall Project:Web Page Development

1
I-99 Environmental Research
I-99 Task A:Summary and Conclusions
PennDOT PresentationDecember, 2006
University of PittsburghGAI
I-99 Environmental Research
Task A InvestigatorsTask Leader:
– Dr. Ronald D. Neufeld, P.E., DEEProfessor of Civil & Environmental Engineering
Research Associate:– Dr. Jason Monnell
Graduate Students:– Sujaya Kalainesan, Graduate Student– Emily Simms, Graduate Student – Kent Pu, Graduate Student
GAI technical staffUni-Tec Field Sampling Assistance
I-99 Environmental Research
Silt FencePurpose:
•To intercept and slow or detain flow of storm water to allow sediment to settle and be trapped.
REF: CALTRANS Construction Site Best Management Practices Manual 2003
I-99 Environmental Research
Silt Fences and Super Silt FenceA silt fence is made of a filter fabric that has been entrencher, attached to supporting poles, and sometimes backed by a plastic fence or wire mesh for support.
A super silt fence has metal poles, supporting a chain link fence. The woven synthetic filtration fabric is stretched across its length. A super silt fence is sturdier and less likely to be breached than a regular silt fence.
I-99 Environmental Research
1: Silt Fence Performance
Data collected from Uni-Tec periodic on-site walking survey, detailed comments and photographs.
A total of 10 walking surveys conducted through Summer 2005.
I-99 Environmental Research
Silt Fence-Design Concepts
Placed below the toe of exposed or erodiblesurfaces;Placed along the perimeter of the project;MUST be maintainedFabric Life generally limited to 5-8 months– Usually woven polypropylene or equivalent
REF: CALTRANS Construction Site Best Management Practices Manual 2003
2
I-99 Environmental Research
I-99 Silt Fence Performance
Silt fences have been observed to hold back 12 inches of sediments for areas properly maintained. This means:
- Being well anchored, and
- Lower end of fabric buried well into the ground
I-99 Environmental Research
Silt Fence Design Performance
Heavy vegetation is observed upslope and downslope in certain areas.
Fences not needed when about 70% of the upslope area is well vegetated. This is present case in many areas.
I-99 Environmental Research
I-99 Silt Fence PerformanceMaintenance is still a problem. Fence damage, blow outs in silt fences and damages/missing fabric exist– Photographs of the silt fence show breaches
underneath the silt fence. Channeling and the developments of breaches at the toe of the silt fence if installed off-contour.
I-99 Environmental Research
I-99 Silt Fence PerformanceTwo major factors that will enhance silt fence performance would be,
– on contour installation of silt fence, which may prevent channeling and development of breeches underneath the silt fence, and
– regular maintenance of the silt fence.
I-99 Environmental Research
Silt Fence PerformanceAdditionally portions of the silt fences that are close to the sedimentation pond outlet discharge may have to be provided with additional protection at the toes.
This area is susceptible to more damage due to the increase flow from the pond outlet in addition to the rainfall runoff.
I-99 Environmental Research
Sediment ControlsSuper Silt Fence (SSF)
SSF Blowout Repaired with Tree fall on SSF (Sep/22/04)Rock Check (Sep/22/04)
3
I-99 Environmental Research
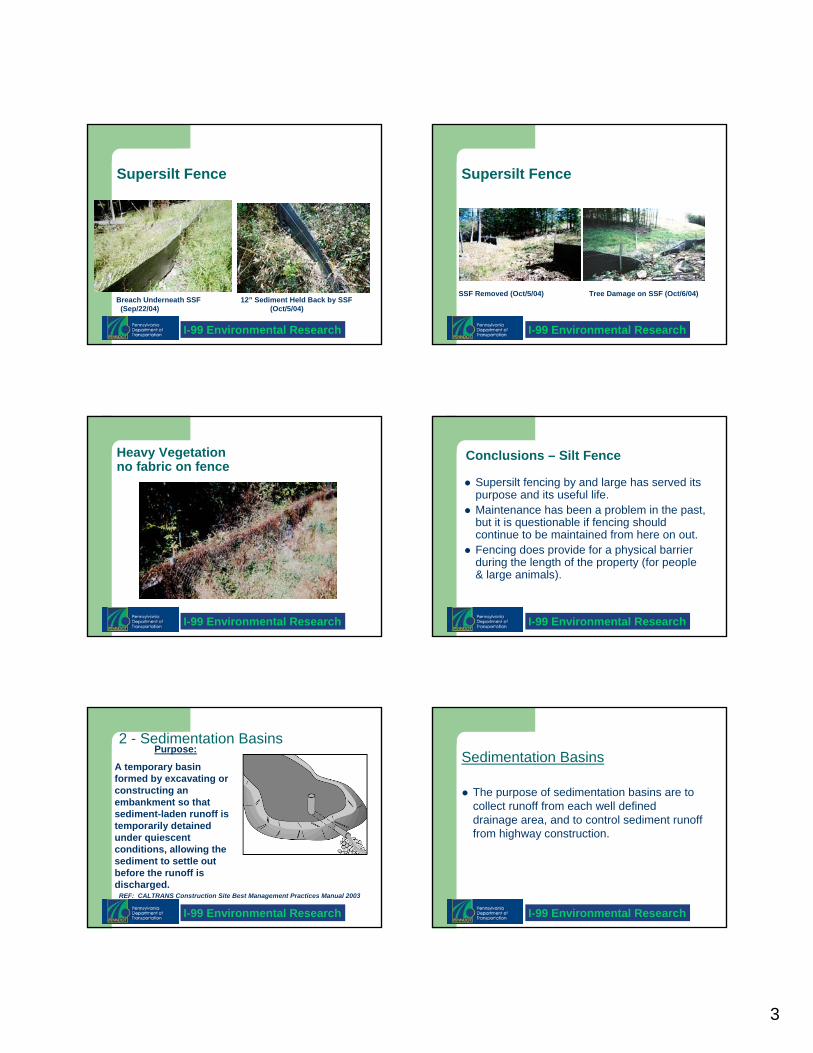
Supersilt Fence
Breach Underneath SSF 12” Sediment Held Back by SSF(Sep/22/04) (Oct/5/04)
I-99 Environmental Research
Supersilt Fence
SSF Removed (Oct/5/04) Tree Damage on SSF (Oct/6/04)
I-99 Environmental Research
Heavy Vegetationno fabric on fence
I-99 Environmental Research
Conclusions – Silt Fence
Supersilt fencing by and large has served its purpose and its useful life.Maintenance has been a problem in the past, but it is questionable if fencing should continue to be maintained from here on out.Fencing does provide for a physical barrier during the length of the property (for people & large animals).
I-99 Environmental Research
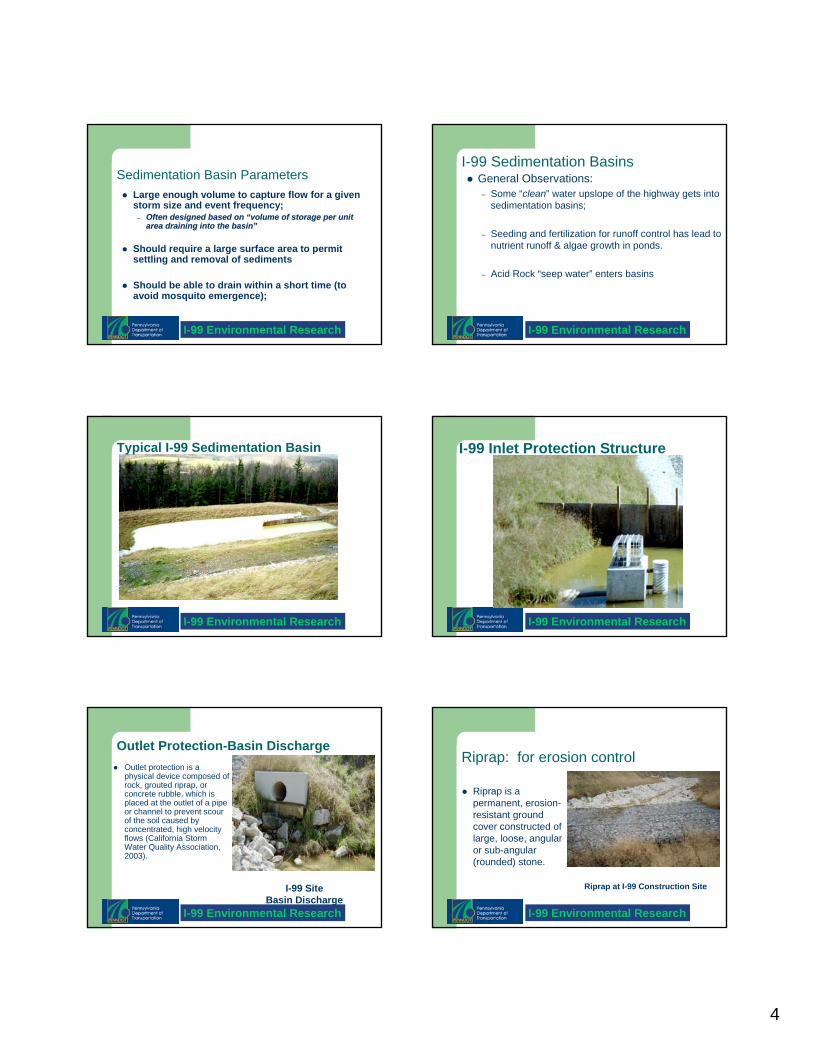
2 - Sedimentation BasinsPurpose:
A temporary basin formed by excavating or constructing an embankment so that sediment-laden runoff is temporarily detained under quiescent conditions, allowing the sediment to settle out before the runoff is discharged.
REF: CALTRANS Construction Site Best Management Practices Manual 2003
I-99 Environmental Research
Sedimentation Basins
The purpose of sedimentation basins are to collect runoff from each well defined drainage area, and to control sediment runoff from highway construction.
4
I-99 Environmental Research
Sedimentation Basin ParametersLarge enough volume to capture flow for a given storm size and event frequency;
–– Often designed based on Often designed based on ““volume of storage per unit volume of storage per unit area draining into the basinarea draining into the basin””
Should require a large surface area to permit settling and removal of sediments
Should be able to drain within a short time (to avoid mosquito emergence);
I-99 Environmental Research
General Observations: – Some “clean” water upslope of the highway gets into
sedimentation basins;
– Seeding and fertilization for runoff control has lead to nutrient runoff & algae growth in ponds.
– Acid Rock “seep water” enters basins
I-99 Sedimentation Basins
I-99 Environmental Research
Typical I-99 Sedimentation Basin
I-99 Environmental Research
I-99 Inlet Protection Structure
I-99 Environmental Research
Outlet Protection-Basin DischargeOutlet protection is a physical device composed of rock, grouted riprap, or concrete rubble, which is placed at the outlet of a pipe or channel to prevent scour of the soil caused by concentrated, high velocity flows (California Storm Water Quality Association, 2003).
I-99 Site Basin Discharge
I-99 Environmental Research
Riprap: for erosion control
Riprap is a permanent, erosion-resistant ground cover constructed of large, loose, angular or sub-angular (rounded) stone.
Riprap at I-99 Construction Site

5
I-99 Environmental Research
Erosion Control MatsMattings of natural materials used to cover soil surfaces to reduce erosion from rainfall impact, hold soil in place, and absorb and hold moisture near the soil surface.Matting may be used to stabilize soils until vegetation is established. I-99 Vegetated Erosion
Control Mat
I-99 Environmental Research
Other Erosion Control BMPsHydroseeding: to temporarily protect exposed soils.Vegetated Buffers: vegetation strip to remove sediment by filtration; used as a “polishing step” from sedimentation traps and basins.Straw-Bale Barriers: placed to intercept sheet flows
I-99 Environmental Research
I-99 Sedimentation Basins
Four Sedimentation Basins selected for detailed analysis:SB-11 (part of drainage basin for Task B)SB-14 (highly turbid discharge)SB-103 (receives acid mine constituents)SB-111 (highly disturbed drainage area)
I-99 Environmental Research
Sedimentation BasinsWater chemistry data shows that acidic seeps affect sedimentation pond water quality. Analysis of seep sample shows that seeps have elevated concentrations of Al, Fe, Ca, and Mn.
Correlation of rainfall data with water chemistry results shows that the concentration of pollutants in the sedimentation pond increase significantly with rainfall and the concentration peaks can be correlated to rainfall peaks.
I-99 Environmental Research
Acid Rock Seeps
(Oct/5/04) Seep near SB14 (pH = 5.0) (Oct/20/04) - Seep near SB111Seep Draining into Crack
I-99 Environmental Research
Sedimentation Basins
There is evidence of algae in the sedimentation ponds and the level of phosphate in the ponds supports the fact that eutrophication may result in the ponds in the future if existing conditions persist.
6
I-99 Environmental Research
Sedimentation BasinsThe level of aluminum in the ponds is elevated at times and may have adverse impacts on aquatic life.
Analysis of water samples from the streams shows an aluminum concentration similar to that of the ponds, the concentration of aluminum in the wetland samples is in the range of 3mg/L to 29mg/L. This may be evidence of aluminum accumulating in the wetlands. However, the physical connection between basins and wetlands is still tenuous.
I-99 Environmental Research
Sedimentation Basins
The design criteria of sedimentation ponds can be improved by using “overflow rate”as the design basis rather than using volume of sedimentation pond per unit acreage of drainage basin. This is the scientific basis for design of settling tanks for water treatment plants.
I-99 Environmental Research
Sedimentation BasinsTo improve sedimentation pond performance and control sediment release during wet weather events, addition of water soluble polymers to the sedimentation ponds may be considered. Such a system may improve settling during peak rainfall events and reduce the volume of sedimentation pond required for achieving a desired percentage removal.
I-99 Environmental Research
Sedimentation Basin Data (2004-2005)
Field surveys and monitoring of basinsPhotographs and sampling conducted of influent & effluent on each dateOn-site analysis conducted for pH and color on each dateSamples sent to the University for further analysis for each date.
I-99 Environmental Research
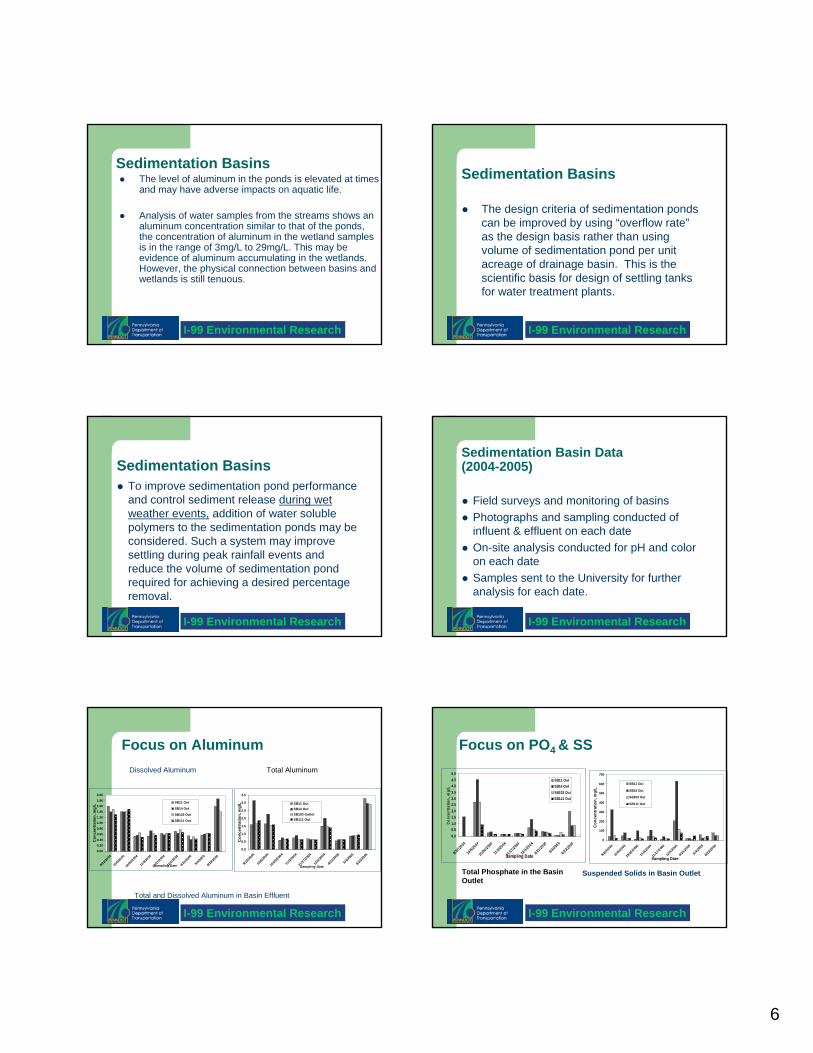
Focus on AluminumTotal AluminumDissolved Aluminum
Total and Dissolved Aluminum in Basin Effluent
0.0
0.5
1.0
1.5
2.0
2.5
3.0
3.5
9/22/2
004
10/5/
2004
10/20
/2004
11/3/
2004
11/17
/2004
12/1/
2004
4/21/2
005
5/4/20
05
6/23/2
005
Sampling Date
Con
cent
ratio
n, m
g/L SB11 Out
SB14 OutSB103 OutletSB111 Out
0.00
0.200.40
0.60
0.80
1.001.20
1.40
1.601.80
2.00
9/22/2
004
10/5/
2004
10/20
/2004
11/3/
2004
11/17
/2004
12/1/
2004
4/21/2
005
5/4/20
05
6/23/2
005
Sampling Date
Con
cent
ratio
n, m
g/L
SB11 Out
SB14 Out
SB103 Out
SB111 Out
I-99 Environmental Research
Focus on PO4 & SS
Total Phosphate in the Basin Outlet
Suspended Solids in Basin Outlet
0.00.51.01.52.02.53.03.54.04.55.0
9/22/2
004
10/5/2
004
10/20
/2004
11/3/2
004
11/17
/2004
12/1/2
004
4/21/2
005
5/4/20
05
6/23/2
005
Sampling Date
Conc
entra
tion,
mg/
L
SB11 OutSB14 OutSB103 OutSB111 Out
0
100
200
300
400
500
600
700
9/22/2
004
10/5/
2004
10/20
/2004
11/3/
2004
11/17
/2004
12/1/
2004
4/21/2
005
5/4/20
05
6/23/2
005
Sampling Dtae
Con
cent
ratio
n, m
g/L
SB11 Out
SB14 Out
SB103 Out
SB111 Out
7
I-99 Environmental Research
y = 1.1135x - 0.9074R2 = 0.952
0.00
0.50
1.00
1.50
2.00
2.50
3.00
3.50
0.00 1.00 2.00 3.00 4.00 5.00 6.00 7.00 8.00 9.00
(Ca+Al+Mg+Mn+Fe) Concentration, mmoles/L
Sulfa
te C
once
ntra
tion,
mm
oles
/L
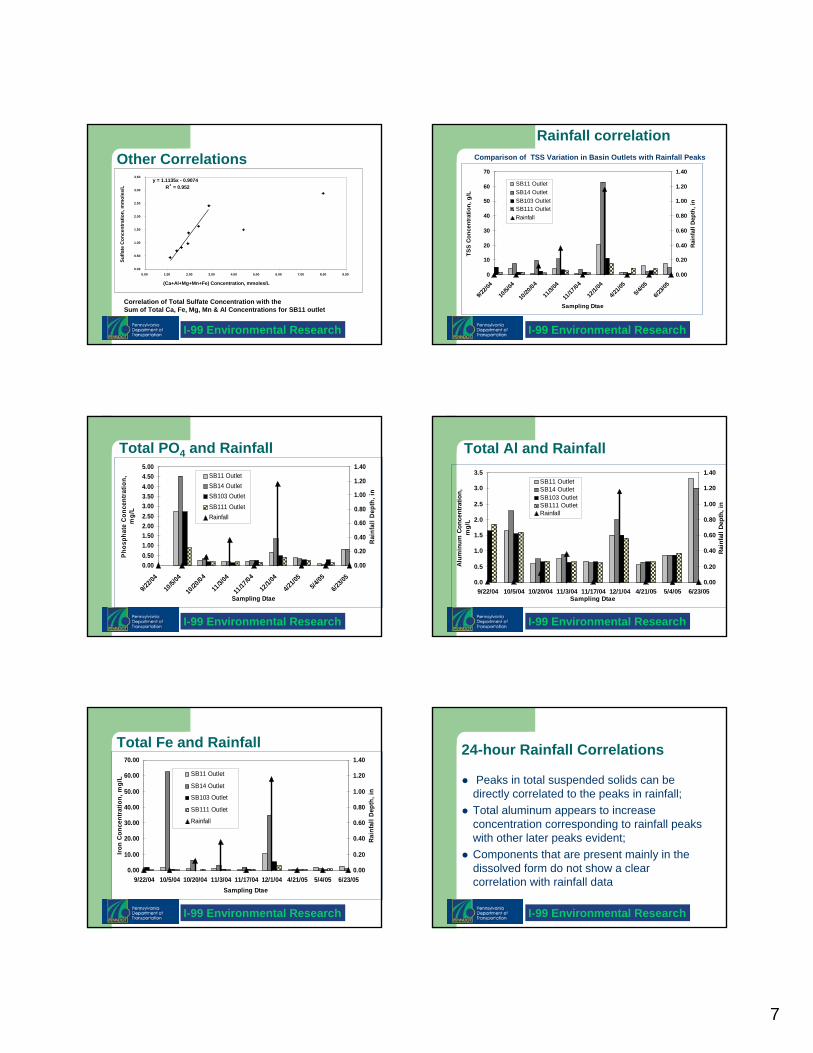
Other Correlations
Correlation of Total Sulfate Concentration with theSum of Total Ca, Fe, Mg, Mn & Al Concentrations for SB11 outlet
I-99 Environmental Research
0
10
20
30
40
50
60
70
9/22/0
4
10/5/
04
10/20
/04
11/3/
04
11/17
/04
12/1/
04
4/21/0
55/4
/05
6/23/0
5
Sampling Dtae
TSS
Con
cent
ratio
n, g
/L
0.00
0.20
0.40
0.60
0.80
1.00
1.20
1.40
Rai
nfal
l Dep
th, i
n
SB11 OutletSB14 OutletSB103 OutletSB111 OutletRainfall
Rainfall correlationComparison of TSS Variation in Basin Outlets with Rainfall Peaks
I-99 Environmental Research
Total PO4 and Rainfall
0.000.501.001.502.002.503.003.504.004.505.00
9/22/0
4
10/5/
04
10/20
/04
11/3/
04
11/17
/04
12/1/
04
4/21/0
55/4
/05
6/23/0
5
Sampling Dtae
Pho
spha
te C
once
ntra
tion,
m
g/L
0.00
0.20
0.40
0.60
0.80
1.00
1.20
1.40
Rai
nfal
l Dep
th, i
n
SB11 OutletSB14 OutletSB103 OutletSB111 OutletRainfall
I-99 Environmental Research
Total Al and Rainfall
0.0
0.5
1.0
1.5
2.0
2.5
3.0
3.5
9/22/04 10/5/04 10/20/04 11/3/04 11/17/04 12/1/04 4/21/05 5/4/05 6/23/05Sampling Dtae
Alu
min
um C
once
ntra
tion,
m
g/L
0.00
0.20
0.40
0.60
0.80
1.00
1.20
1.40
Rai
nfal
l Dep
th, i
n
SB11 OutletSB14 OutletSB103 OutletSB111 OutletRainfall
I-99 Environmental Research
0.00
10.00
20.00
30.00
40.00
50.00
60.00
70.00
9/22/04 10/5/04 10/20/04 11/3/04 11/17/04 12/1/04 4/21/05 5/4/05 6/23/05Sampling Dtae
Iron
Con
cent
ratio
n, m
g/L
0.00
0.20
0.40
0.60
0.80
1.00
1.20
1.40
Rai
nfal
l Dep
th, i
n
SB11 Outlet
SB14 Outlet
SB103 Outlet
SB111 Outlet
Rainfall
Total Fe and Rainfall
I-99 Environmental Research
24-hour Rainfall Correlations
Peaks in total suspended solids can be directly correlated to the peaks in rainfall;Total aluminum appears to increase concentration corresponding to rainfall peaks with other later peaks evident;Components that are present mainly in the dissolved form do not show a clear correlation with rainfall data
8
I-99 Environmental Research
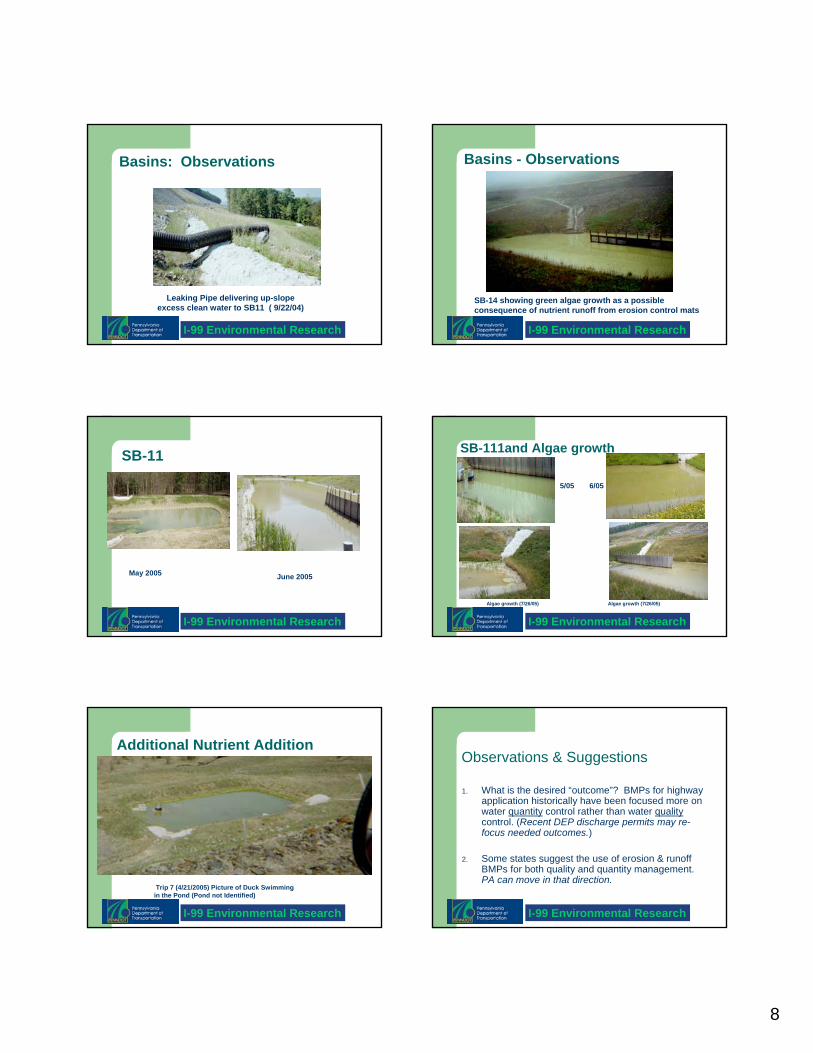
Basins: Observations
Leaking Pipe delivering up-slope excess clean water to SB11 ( 9/22/04)
I-99 Environmental Research
Basins - Observations
SB-14 showing green algae growth as a possibleconsequence of nutrient runoff from erosion control mats
I-99 Environmental Research
SB-11
May 2005 June 2005
I-99 Environmental Research
SB-111and Algae growth
Algae growth (7/26/05) Algae growth (7/26/05)
5/05 6/05
I-99 Environmental Research
Additional Nutrient Addition
Trip 7 (4/21/2005) Picture of Duck Swimming in the Pond (Pond not Identified)
I-99 Environmental Research
Observations & Suggestions
1. What is the desired “outcome”? BMPs for highway application historically have been focused more on water quantity control rather than water qualitycontrol. (Recent DEP discharge permits may re-focus needed outcomes.)
2. Some states suggest the use of erosion & runoff BMPs for both quality and quantity management. PA can move in that direction.
9
I-99 Environmental Research
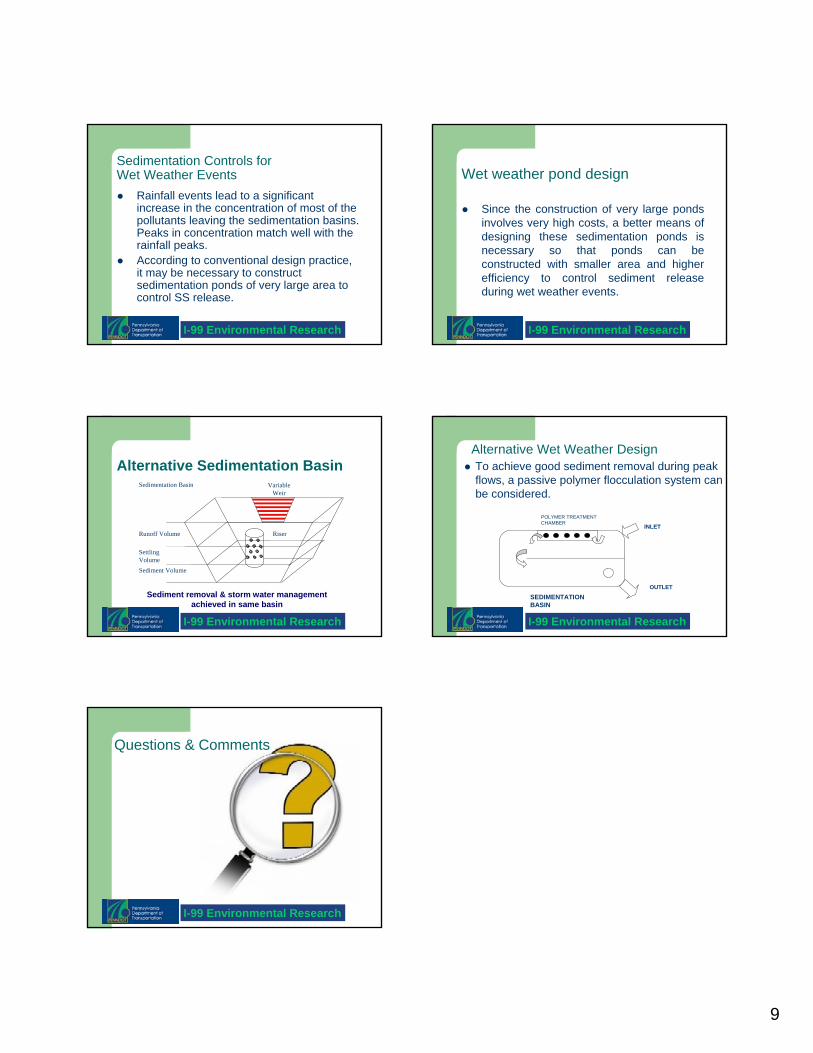
Sedimentation Controls forWet Weather Events
Rainfall events lead to a significant increase in the concentration of most of the pollutants leaving the sedimentation basins. Peaks in concentration match well with the rainfall peaks.According to conventional design practice, it may be necessary to construct sedimentation ponds of very large area to control SS release.
I-99 Environmental Research
Wet weather pond design
Since the construction of very large ponds involves very high costs, a better means of designing these sedimentation ponds is necessary so that ponds can be constructed with smaller area and higher efficiency to control sediment release during wet weather events.
I-99 Environmental Research
Alternative Sedimentation Basin
Runoff Volume
Settling VolumeSediment Volume
Variable Weir
Sedimentation Basin
Riser
Sediment removal & storm water management achieved in same basin
I-99 Environmental Research
Alternative Wet Weather DesignTo achieve good sediment removal during peak flows, a passive polymer flocculation system can be considered.
INLET
OUTLET
POLYMER TREATMENT CHAMBER
SEDIMENTATION BASIN
I-99 Environmental Research
Questions & Comments

1
I-99 Environmental Research
Task B- Hydrologic Modeling and Monitoring
Dr. Rafael G. QuimpoProfessor of Civil Engineering
University of PittsburghTask Leader
I-99 Environmental Research
Collaborators– Dr. William Harbert, Professor, Geology and
Planetary SciencesGraduate Students– Adam Scheller– Weizhe An– Majid Khazaei, AWK Engineers
I-99 Environmental Research
Tasks
Review of modelsModel selection and modificationInstrumentation Calibration and TestingModel ImplementationImpact Evaluation
I-99 Environmental Research
Topography Prior to Construction
I-99 Environmental Research
Location of Test Watersheds
I-99 Environmental Research
Surface Water Instrumentation
2
I-99 Environmental Research
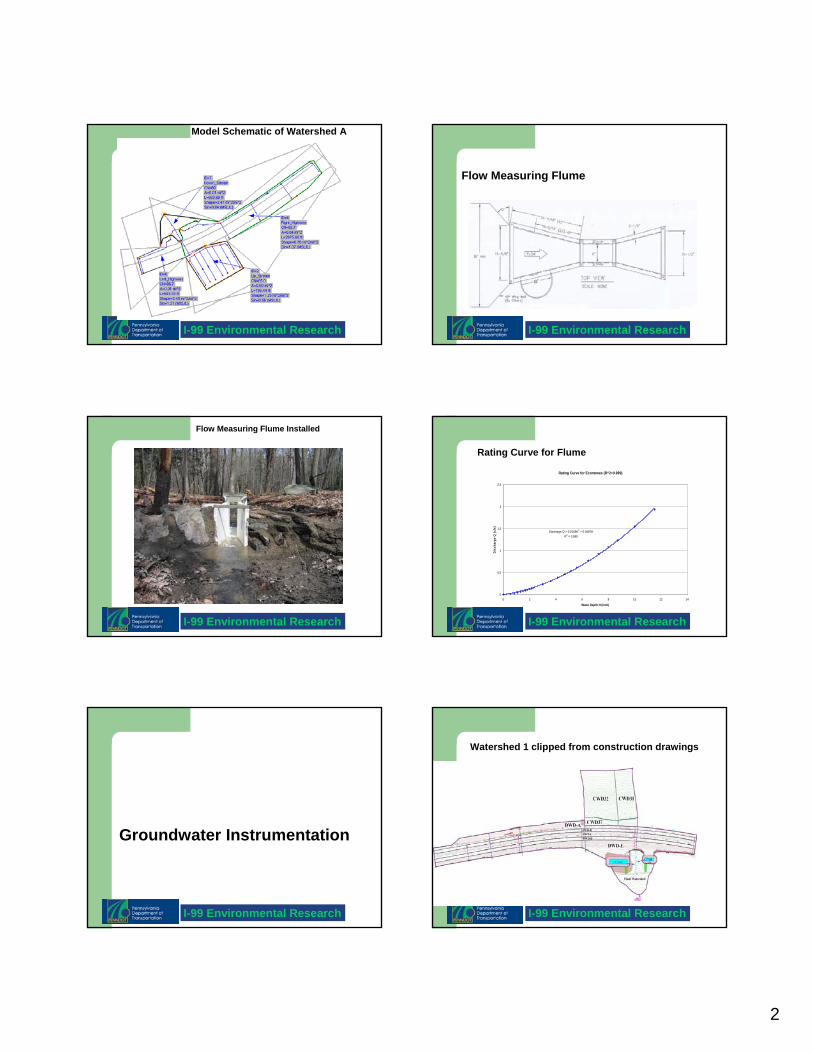
Model Schematic of Watershed A
I-99 Environmental Research
Flow Measuring Flume
I-99 Environmental Research
Flow Measuring Flume Installed
I-99 Environmental Research
Rating Curve for Flume
Rating Curve for Econtones (R^2=0.999)
Discharge Q = 0.0106H2 + 0.0487HR2 = 0.999
0
0.5
1
1.5
2
2.5
0 2 4 6 8 10 12 14
Water Depth H (inch)
Dis
char
ge Q
(cfs
)
I-99 Environmental Research
Groundwater Instrumentation
I-99 Environmental Research
Watershed 1 clipped from construction drawings
3
I-99 Environmental Research
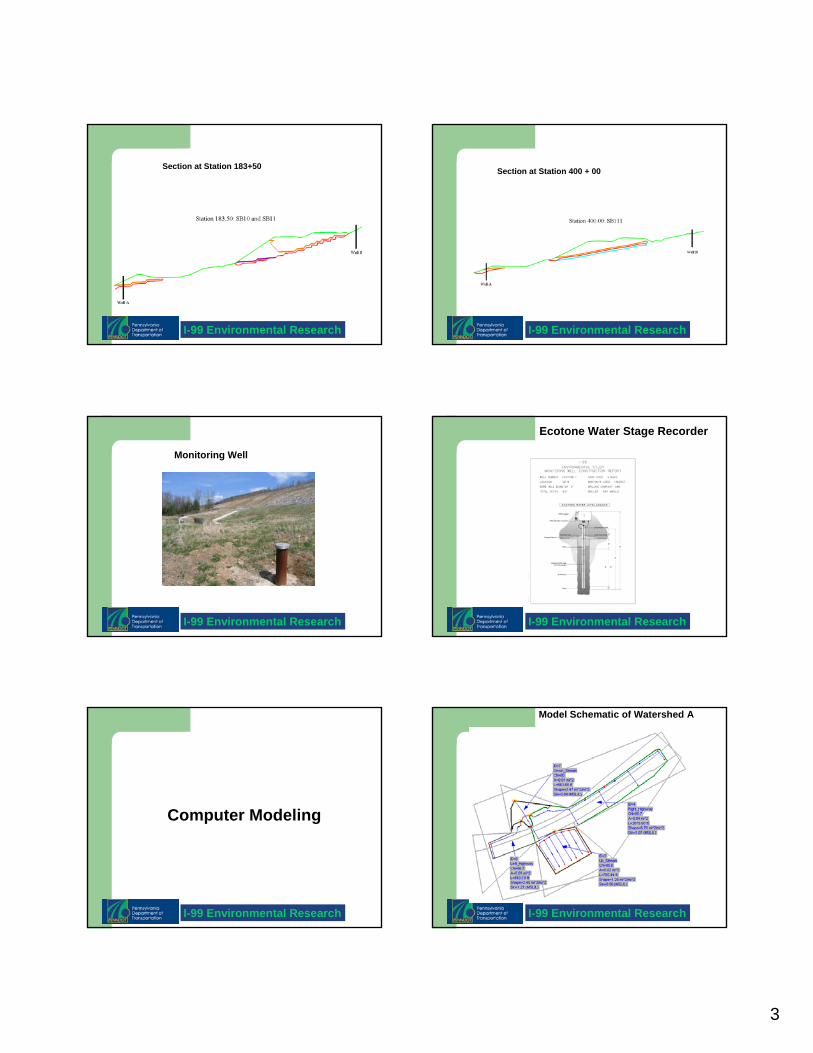
Section at Station 183+50
I-99 Environmental Research
Section at Station 400 + 00
I-99 Environmental Research
Monitoring Well
I-99 Environmental Research
Ecotone Water Stage Recorder
I-99 Environmental Research
Computer Modeling
I-99 Environmental Research
Model Schematic of Watershed A

4
I-99 Environmental Research
Model Flow Schematic Watershed A
Right_Highway4
Right_Highway3
Right_Highway2
Right_Highway1
Left_HighwayUp_Stream
Down_Stream
SB 10 SB 11
I-99 Environmental Research
Model Schematic Watershed B
I-99 Environmental Research
Flow Chart – Watershed B
Up_Stream
Up_Side
Highway
Down_Side
Down_Stream
SB111
I-99 Environmental Research
Data Collection and Processing
I-99 Environmental Research
Rainfall DataHalf hr incremental rainfall (Sept 30 2005 -- Mar 30 2006)
0
0.05
0.1
0.15
0.2
0.25
0.3
0.35
0.4
0.45
0 480 960 1440 1920 2400 2880 3360 3840 4320
Time (hr from 00:00 Sept 30 2005)
Hal
f hr i
ncre
men
tal r
ainf
all (
inch
)
I-99 Environmental Research
Runoff Data
Watershed 1 Flume Discharge (Sept 30 2005 -- Mar 30 2006)
0
0.5
1
1.5
2
2.5
3
3.5
0 480 960 1440 1920 2400 2880 3360 3840 4320
Time (hr from 00:00 Sept 30 2005)
Dis
char
ge (c
fs)
5
I-99 Environmental Research
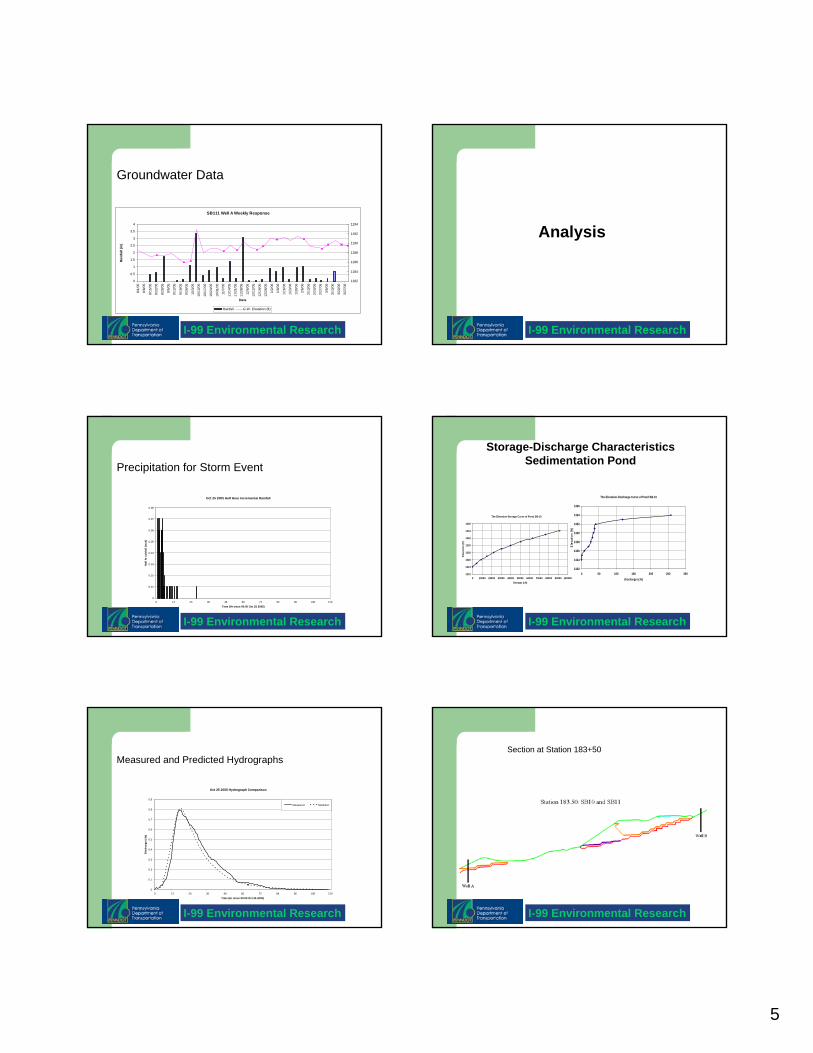
Groundwater Data
SB111 Well A Weekly Response
0
0.5
1
1.5
2
2.5
3
3.5
4
8/1/
05
8/8/
05
8/15
/05
8/22
/05
8/29
/05
9/5/
05
9/12
/05
9/19
/05
9/26
/05
10/3
/05
10/1
0/05
10/1
7/05
10/2
4/05
10/3
1/05
11/7
/05
11/1
4/05
11/2
1/05
11/2
8/05
12/5
/05
12/1
2/05
12/1
9/05
12/2
6/05
1/2/
06
1/9/
06
1/16
/06
1/23
/06
1/30
/06
2/6/
06
2/13
/06
2/20
/06
2/27
/06
3/6/
06
3/13
/06
3/20
/06
3/27
/06
Date
Rain
fall
(in)
1182
1184
1186
1188
1190
1192
1194
Rainfall G.W. Elevation (ft)
I-99 Environmental Research
Analysis
I-99 Environmental Research
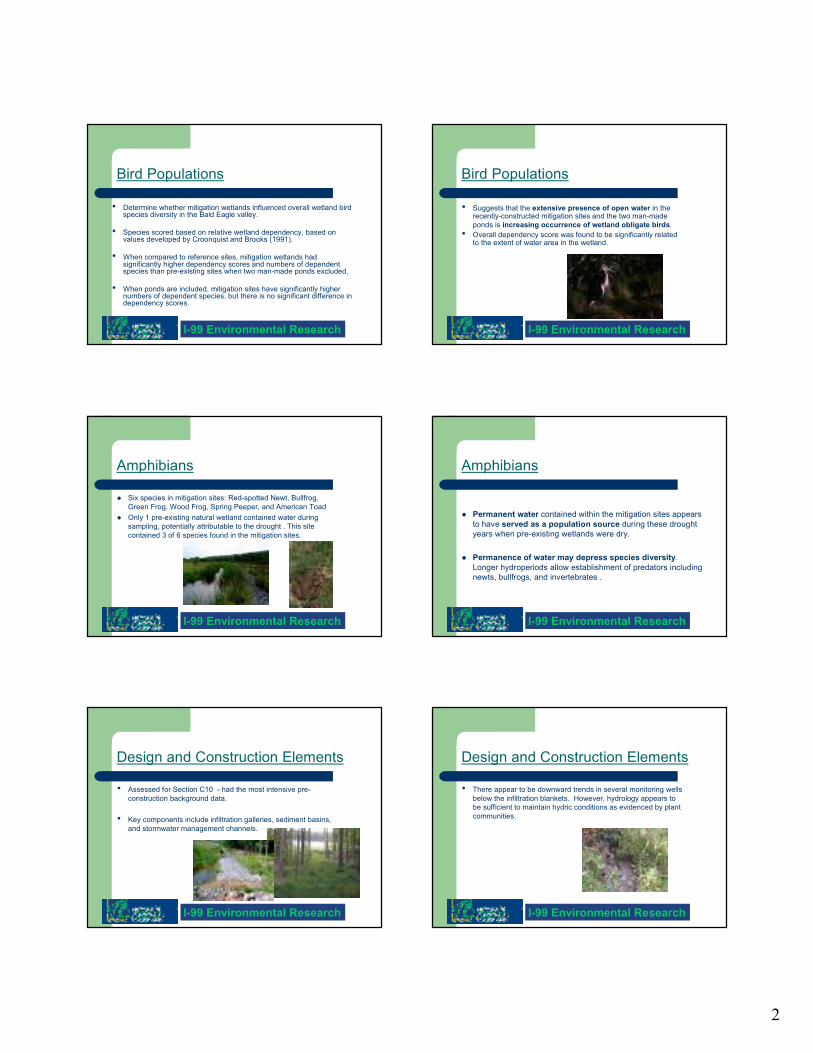
Precipitation for Storm Event
Oct 25 2005 Half Hour Incremental Rainfall
0
0.01
0.02
0.03
0.04
0.05
0.06
0.07
0.08
0 12 24 36 48 60 72 84 96 108 120
Time (Hr since 00:00 Oct 25 2005)
Hal
f hr r
ainf
all (
inch
)
I-99 Environmental Research
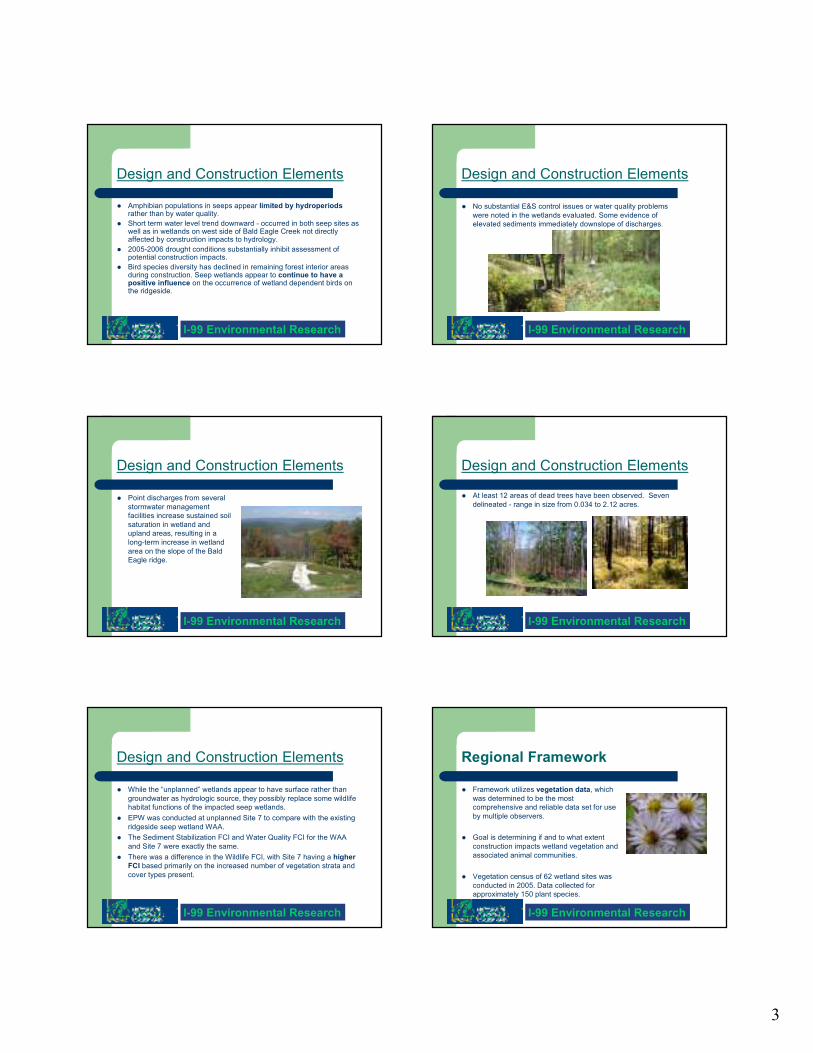
The Elevation-Discharge Curve of Pond SB-10
1322
1324
1326
1328
1330
1332
1334
1336
0 50 100 150 200 250 300Discharge (cfs)
Elev
atio
n (ft
)
Storage-Discharge CharacteristicsSedimentation Pond
The Elevation-Storage Curve of Pond SB-10
1322
1324
1326
1328
1330
1332
1334
1336
0 10000 20000 30000 40000 50000 60000 70000 80000 90000 100000Storage (cft)
Elev
atio
n (ft
)
I-99 Environmental Research
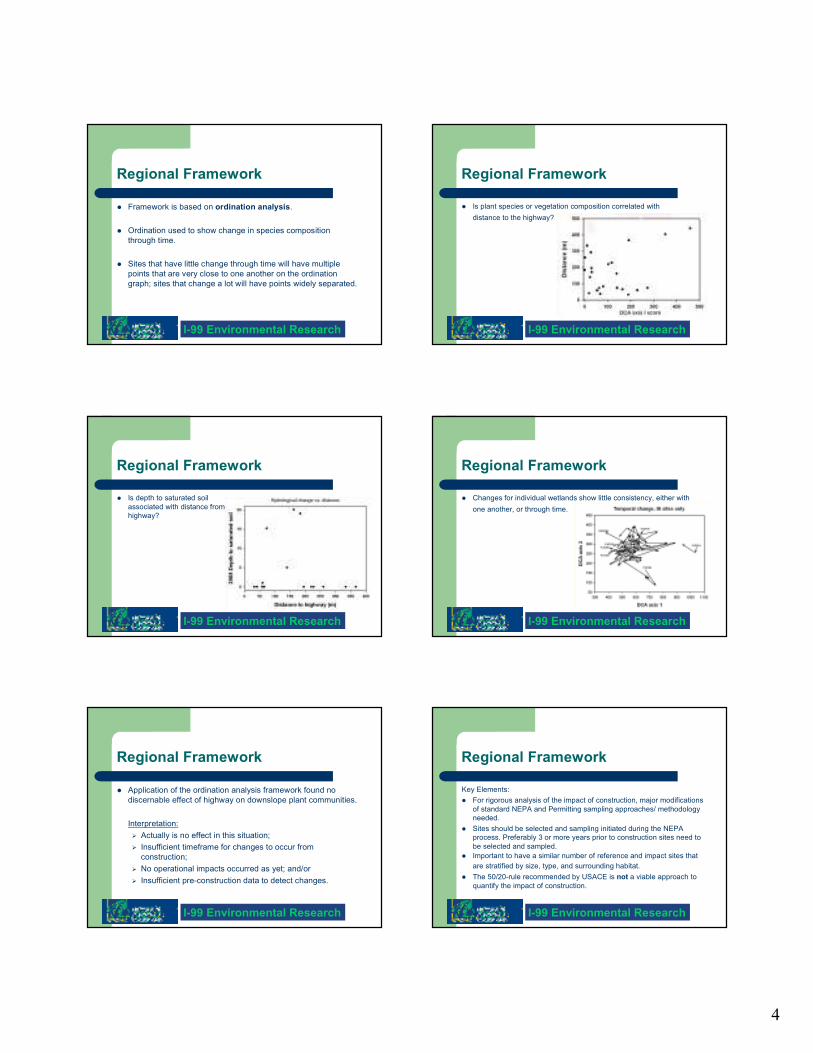
Measured and Predicted Hydrographs
Oct 25 2005 Hydrograph Comparison
0
0.1
0.2
0.3
0.4
0.5
0.6
0.7
0.8
0.9
0 12 24 36 48 60 72 84 96 108 120
Time (Hr since 00:00 Oct 25 2005)
Dis
char
ge (c
fs)
Measured Modeled
I-99 Environmental Research
Section at Station 183+50

6
I-99 Environmental Research
SB10-11 Well A Weekly Response
0
0.5
1
1.5
2
2.5
3
3.5
4
8/1/
05
8/15
/05
8/29
/05
9/12
/05
9/26
/05
10/1
0/05
10/2
4/05
11/7
/05
11/2
1/05
12/5
/05
12/1
9/05
1/2/
06
1/16
/06
1/30
/06
2/13
/06
2/27
/06
3/13
/06
3/27
/06
Date
Rain
fall
(in)
1288
1290
1292
1294
1296
1298
1300
1302
1304
Rainfall G.W. Elevation (ft)
I-99 Environmental Research
SB111 Well B Weekly Response
00.5
11.5
22.5
33.5
4
8/1/
05
8/15
/05
8/29
/05
9/12
/05
9/26
/05
10/1
0/05
10/2
4/05
11/7
/05
11/2
1/05
12/5
/05
12/1
9/05
1/2/
06
1/16
/06
1/30
/06
2/13
/06
2/27
/06
3/13
/06
3/27
/06
Date
Rai
nfal
l (in
)
1265127012751280128512901295130013051310
Rainfall G.W. Elevation (ft)
I-99 Environmental Research
Infiltration Gallery
I-99 Environmental Research
Relative Locations of Gallery and Wells
I-99 Environmental Research
Section at Station 400+00
I-99 Environmental Research
Effectiveness of Infiltration Gallery
0.030.0747153146.7DeepWell
0.030.08110297156.6SB-11
0.030.0359245036.7SB-10
Iron(mg/L)
Mn(mg/L)
Ca(mg/L)
Mg(mg/L)
Conductivity
pH

7
I-99 Environmental Research
Results and Conclusions
A model for predicting runoff from watersheds engendered by highway construction has been developed.The model has been tested using more than six months of rainfall-runoff data and found to perform satisfactorily. It may be used for environmental impact assessments.The computer code for the model can be adopted to other sites after adjustment for site-specificity.A Users’ Guide has been prepared for future use by PennDOT personnel.
I-99 Environmental Research
RECOMMENDATIONS
1. For a quantitative impact analysis it is necessary that measurements of water quantity and quality parameters be undertaken on a watershed basis so as to deduce cause-effect relationships between
adopted Best Management Practices and water quality.
2. As soon as the final alignment of the highway is decided upon, test watersheds should be identified so that they can be monitored. Only a few test watersheds can be instrumented for practical reasons.
I-99 Environmental Research
3. Instrumentation should provide for the measurement of hydro-meteorologic as well as hydro-geologic variables. These include deep wells and shallow water level recorders to measure deep groundwater and sub-surface moisture levels.
4. The installation of a local meteorological station to track precipitation, temperature and evapo-transpiration is also recommended. This local station should be close to the test watershed. For facility in data acquisition, provision must be made for automatic downloading.
5. After the test watershed has been delineated, a runoff gauging station should be installed at its outlet. Because the watershed is small, this requires a special flow measuring gage. Weirs or Venturi flumes would serve this purpose effectively.
I-99 Environmental Research
6. Regular inspection of the gages and their recording devices should be undertaken. Loss and interruption of power can affect the synchronization of rainfall-runoff events and make the calibration difficult. Power sources must be replaced regularly to minimize interruptions and erroneous readings.
7. Instrumentation may be staged to correspond with the progress of highway planning and construction. At the planning stage, both surface and groundwater flow measurements should be taken to provide the basis for preparing the Environmental Impact Analysis. The scope of instrumentation and data collection at this stage may not sufficient to carry out a quantitative analysis.
I-99 Environmental Research
8. After features such as sedimentation ponds, sub-surface drainage and flow routing junctions are identified, flow measuring devices should be installed. This are needed to collect benchmark data for use in flow prediction. For groundwater flow, monitoring wells must also be installed as soon as possible. A detailed record of the drilling log should be kept for subsequent subsurface flow analysis.
9. During construction, periodic checks must be made to determine if instruments are functioning as intended.
I-99 Environmental Research
Thank You

1
I-99 Environmental Research
Task CWETLAND HYDRO-BIOLOGICAL INDICATORS
TEAM:� GAI, Data Collection and Analysis
� Univ. of Pittsburgh, Dept. of Biological Sciences - Data Collection and Analysis
� Univ. of Pittsburgh, Dept. of Civil & Environmental Engineering –Project Management, Data Analysis
� Western PA Conservancy – Data Collection
� Gwin, Dobson, Foreman – Data Collection
I-99 Environmental Research
Task List
� Assessment of Wetland Methodologies
� Assessment of Baseline Data
� Site Selection/ Field Plan
� Data Collection
� Data Analysis
� Impact Assessment and
Corridor Planning Framework
I-99 Environmental Research
Report Tasks
� Assessment of key functions and characteristics that should be
included in considering mitigation efforts, including review of existing
methodologies for function/ value assessment.
� Identification of key functions/ values influencing success of
mitigation wetlands and development of performance standards.
� An assessment of influence of design and construction elements
on wetlands and recommendations for modifications to current
procedures.
� A regional framework for predicting construction impacts on
wetlands by type and setting based upon key indicators.
I-99 Environmental Research
Assessment Methodologies
� Forty-three methodologies reviewed for function/value
assessment:
� Ohio Rapid Assessment Method (ORAM) most
comprehensive currently available
� Hydro-Geomorphic Methodology (HGM) - operational models not yet available.
I-99 Environmental Research
Assessment Methodologies
� Ability to provide mitigation planning/ design capabilities also
reviewed.
� ORAM for rapid functional assessment and Evaluation for
Planned Wetlands (EPW) to address mitigation planning
functions provides most comprehensive assessment of key
functions and characteristics.� HGM - operational models not yet available.
I-99 Environmental Research
Key Functions/Values
� Factors influencing success of mitigation wetlands - evaluated
with EPW and statistical analyses.
� Key factors:
� Hydroperiod;
� Presence and extent of standing water;
� Spatial patterns of vegetation, and;
� Overall wetland vegetation community size.
2
I-99 Environmental Research
Bird Populations
• Determine whether mitigation wetlands influenced overall wetland bird species diversity in the Bald Eagle valley.
• Species scored based on relative wetland dependency, based on values developed by Croonquist and Brooks (1991).
• When compared to reference sites, mitigation wetlands had significantly higher dependency scores and numbers of dependent species than pre-existing sites when two man-made ponds excluded.
• When ponds are included, mitigation sites have significantly higher numbers of dependent species, but there is no significant difference in dependency scores.
I-99 Environmental Research
Bird Populations
• Suggests that the extensive presence of open water in the recently-constructed mitigation sites and the two man-made
ponds is increasing occurrence of wetland obligate birds.
• Overall dependency score was found to be significantly related to the extent of water area in the wetland.
I-99 Environmental Research
Amphibians
� Six species in mitigation sites: Red-spotted Newt, Bullfrog,
Green Frog, Wood Frog, Spring Peeper, and American Toad
� Only 1 pre-existing natural wetland contained water during
sampling, potentially attributable to the drought . This site
contained 3 of 6 species found in the mitigation sites.
I-99 Environmental Research
Amphibians
� Permanent water contained within the mitigation sites appears
to have served as a population source during these drought
years when pre-existing wetlands were dry.
� Permanence of water may depress species diversity.
Longer hydroperiods allow establishment of predators including
newts, bullfrogs, and invertebrates .
I-99 Environmental Research
Design and Construction Elements
• Assessed for Section C10 - had the most intensive pre-
construction background data.
• Key components include infiltration galleries, sediment basins,
and stormwater management channels.
I-99 Environmental Research
Design and Construction Elements
• There appear to be downward trends in several monitoring wells
below the infiltration blankets. However, hydrology appears to
be sufficient to maintain hydric conditions as evidenced by plant
communities.
3
I-99 Environmental Research
Design and Construction Elements
� Amphibian populations in seeps appear limited by hydroperiodsrather than by water quality.
� Short term water level trend downward - occurred in both seep sites as well as in wetlands on west side of Bald Eagle Creek not directly affected by construction impacts to hydrology.
� 2005-2006 drought conditions substantially inhibit assessment of potential construction impacts.
� Bird species diversity has declined in remaining forest interior areas during construction. Seep wetlands appear to continue to have a positive influence on the occurrence of wetland dependent birds on the ridgeside.
I-99 Environmental Research
Design and Construction Elements
� No substantial E&S control issues or water quality problems
were noted in the wetlands evaluated. Some evidence of
elevated sediments immediately downslope of discharges.
I-99 Environmental Research
Design and Construction Elements
� Point discharges from several
stormwater management
facilities increase sustained soil
saturation in wetland and
upland areas, resulting in a
long-term increase in wetland
area on the slope of the Bald
Eagle ridge.
I-99 Environmental Research
Design and Construction Elements
� At least 12 areas of dead trees have been observed. Seven
delineated - range in size from 0.034 to 2.12 acres.
I-99 Environmental Research
Design and Construction Elements
� While the “unplanned” wetlands appear to have surface rather than
groundwater as hydrologic source, they possibly replace some wildlife
habitat functions of the impacted seep wetlands.
� EPW was conducted at unplanned Site 7 to compare with the existing
ridgeside seep wetland WAA.
� The Sediment Stabilization FCI and Water Quality FCI for the WAA
and Site 7 were exactly the same.
� There was a difference in the Wildlife FCI, with Site 7 having a higher
FCI based primarily on the increased number of vegetation strata and
cover types present.
I-99 Environmental Research
Regional Framework
� Framework utilizes vegetation data, which
was determined to be the most
comprehensive and reliable data set for use
by multiple observers.
� Goal is determining if and to what extent
construction impacts wetland vegetation and
associated animal communities.
� Vegetation census of 62 wetland sites was
conducted in 2005. Data collected for
approximately 150 plant species.
4
I-99 Environmental Research
Regional Framework
� Framework is based on ordination analysis.
� Ordination used to show change in species composition
through time.
� Sites that have little change through time will have multiple
points that are very close to one another on the ordination
graph; sites that change a lot will have points widely separated.
I-99 Environmental Research
Regional Framework
� Is plant species or vegetation composition correlated with
distance to the highway?
I-99 Environmental Research
Regional Framework
� Is depth to saturated soil
associated with distance from
highway?
I-99 Environmental Research
Regional Framework
� Changes for individual wetlands show little consistency, either with
one another, or through time.
I-99 Environmental Research
Regional Framework
� Application of the ordination analysis framework found no
discernable effect of highway on downslope plant communities.
Interpretation:
� Actually is no effect in this situation;
� Insufficient timeframe for changes to occur from
construction;
� No operational impacts occurred as yet; and/or
� Insufficient pre-construction data to detect changes.
I-99 Environmental Research
Regional Framework
Key Elements:
� For rigorous analysis of the impact of construction, major modifications
of standard NEPA and Permitting sampling approaches/ methodology
needed.
� Sites should be selected and sampling initiated during the NEPA
process. Preferably 3 or more years prior to construction sites need to
be selected and sampled.
� Important to have a similar number of reference and impact sites that
are stratified by size, type, and surrounding habitat.
� The 50/20-rule recommended by USACE is not a viable approach to
quantify the impact of construction.

5
I-99 Environmental Research
Regional Framework
� Provide framework to conduct future ordination analysis.
Methodology provided to do this.
� Continue monitoring of I-99 through operation to refine and
calibrate would be of benefit.
� Framework needs to be implemented prior to construction
of another project and tracked through the project to refine,
calibrate, and verify to develop regional applicability.

1
I-99 Environmental Research
I-99 ENVIRONMENTAL RESEARCH
TASK D
EVALUATING THE EFFECTIVENESS AND
SUSTAINABILITY OF STREAM
RESTORATION, REHABILITATION, AND
RELOCATION
I-99 Environmental Research
Background
� 20,916 feet of impacted stream length
requiring mitigation
� 17,383 feet of stream mitigation (restoration,
stabilization, and relocation) at six completed
mitigation sites
� 4,054 feet of stream mitigation proposed at
two additional sites
I-99 Environmental Research
Mitigation area locations
I-99 Environmental Research
Project Goals
� Assess the effectiveness of stream restoration,
stabilization, and relocation practices for highway
mitigation
� Assess the ability of these practices to provide a
stable, healthy stream system that is sustainable
over the long term
� Identify key factors for rapid assessment of future
mitigation projects
I-99 Environmental Research
Task List
� Site Selection
� Parameter Selection
� Baseline Data Collection
� Post-Construction Monitoring
� Sediment Supply Rating Curve Development
� Project Sediment Transport Capacity Calculation
� Data Analysis and Report
� Literature Review
I-99 Environmental Research
Detailed Monitoring Locations
2
I-99 Environmental Research
Detailed Monitoring Locations
I-99 Environmental Research
Detailed Monitoring Locations
I-99 Environmental Research
Monitoring Parameters
Uniform list of data to be collected at each detailed monitoring location:
� General Site Overview
� Photographs
� Cross Section Survey
� Profile Survey
� Stream Pattern Assessment
� Substrate Composition
I-99 Environmental Research
Monitoring Parameters
� Bedload and Suspended Sediment Transport
� Water Chemistry and Quality (pH, dissolved oxygen, turbidity, nitrogen, phosphorus, color, total organic carbon)
� Riparian Vegetation
� Channel Stability Rating
� Bank Erosion Assessment
� Habitat Survey and Bioassessment
I-99 Environmental Research
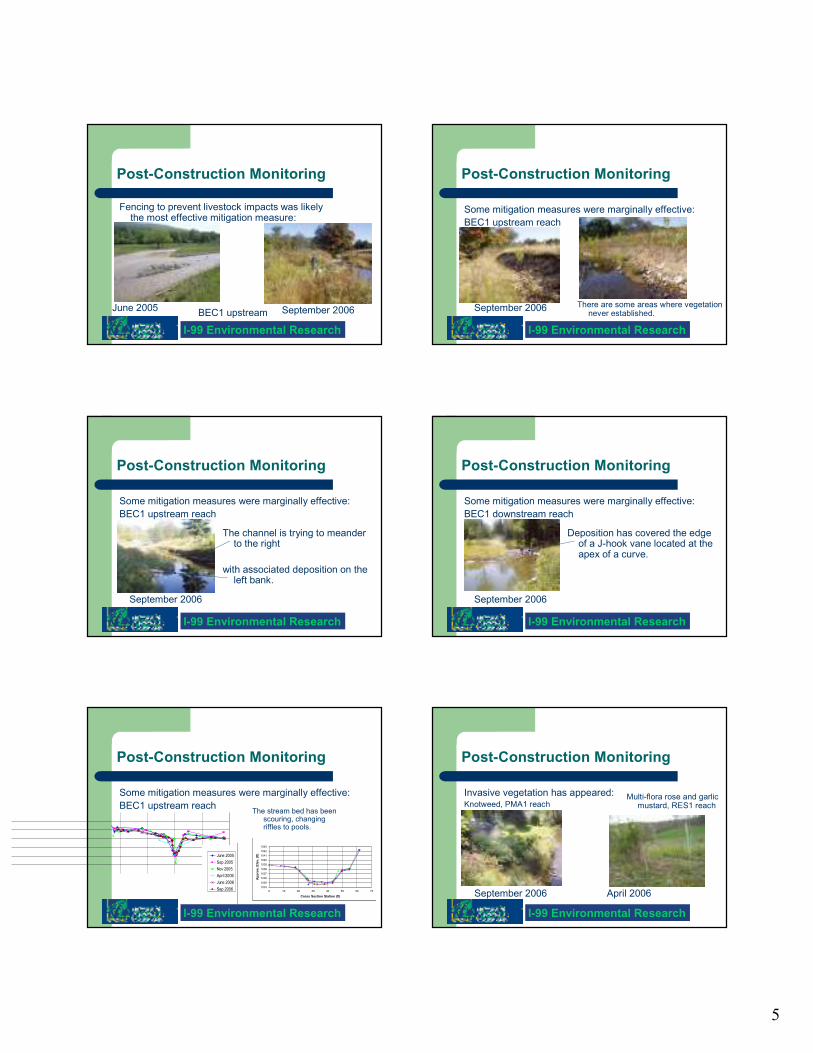
Post-Construction Monitoring
Six detailed monitoring trips have been
completed in 2005 and 2006.
Five event-based sediment sampling trips have
been completed in 2006.
I-99 Environmental Research
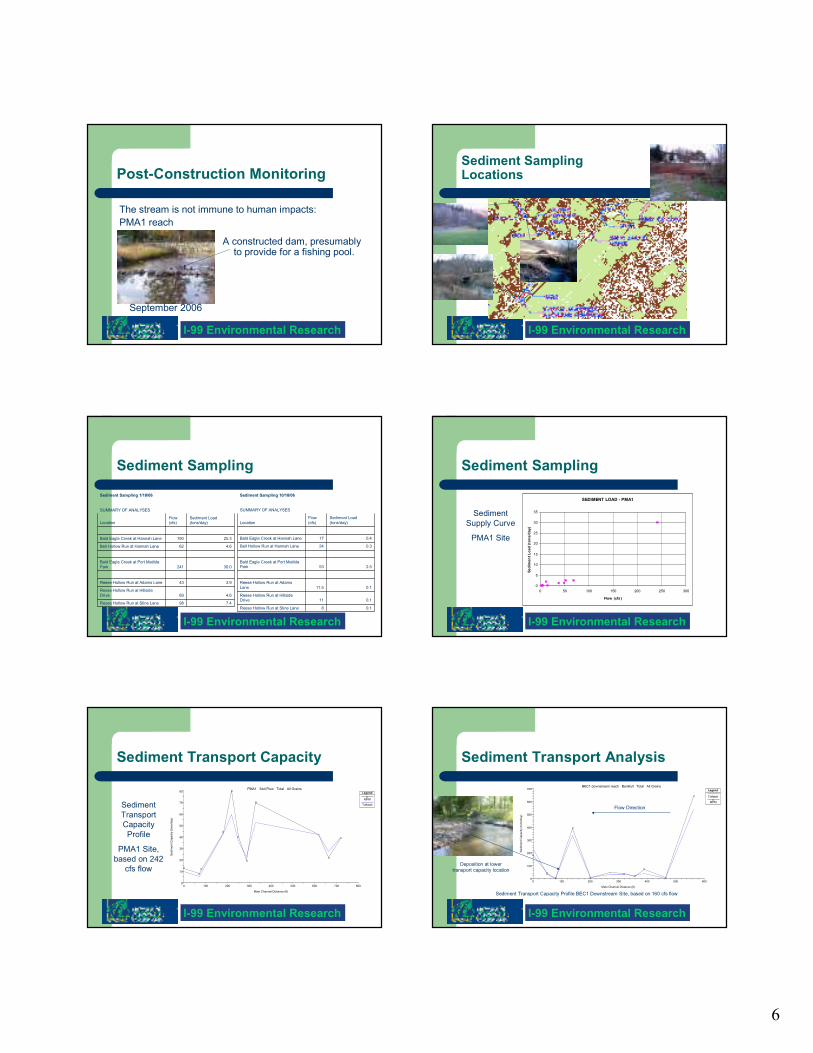
BEC1 Upstream Profile
1026
1028
1030
1032
1034
1036
1038
1040
400 500 600 700 800 900 1000 1100 1200
Stream Station (ft)
Approx. Elev. (ft)
June 2005
Sep 2005
Nov 2005
April 2006
June 2006
Sep 2006
Post-Construction Monitoring
Pool at undercut bank by tree
Monitor the profile by surveying
3
I-99 Environmental Research
Post-Construction Monitoring
Monitor cross sections by surveying
Cross section just upstream of deepest part
BEC1 Upstream Pool sta 9+96
1028
1030
1032
1034
1036
1038
1040
1042
1044
0 10 20 30 40 50 60 70
Cross Section Station (ft)
Approx. Elev. (ft)
June 2005
Sep 2005
Nov 2005
April 2006
June 2006
Sep 2006
I-99 Environmental Research
Post-Construction Monitoring
BED MATERIAL PEBBLE COUNT DATA -
BEC1 UPSTREAM 6/6/05
0%
20%
40%
60%
80%
100%
0.01 0.1 1 10 100 1000 10000
Particle Size (mm)
Percent Finer Than
d50
POINT BAR SAMPLE - BEC1 UPSTREAM
June 2005
0.0%
20.0%
40.0%
60.0%
80.0%
100.0%
0.01 0.1 1 10 100
Particle Size (mm)
Percent Finer Than
Analyze stream bed and point bar size distribution
I-99 Environmental Research
Bank Pin Performance
BEC1 Upstream
-6
-4
-2
0
2
4
6
Feb-05 May-05 Sep-05 Dec-05 Mar-06 Jul-06 Oct-06
Date
Rebar Exposed,
deviation from original
(inches)
Upper Bar
Lower Bar
Post-Construction Monitoring
Monitor erosion and deposition with bank pins
Decrease in lower bar exposed length with increase in upper bar likely means sloughing of upper bank.
I-99 Environmental Research
Post-Construction Monitoring
December 2004
Many mitigation measures were very effective:
BEC1 downstream monitoring reach
September 2006
I-99 Environmental Research
Post-Construction Monitoring
December 2004
Many mitigation measures were very effective:
BEC1 reach
September 2006
I-99 Environmental Research
Post-Construction Monitoring
December 2004
Many mitigation measures were very effective:
BEC1 upstream reach
September 2006

4
I-99 Environmental Research
Post-Construction Monitoring
June 2005
Many mitigation measures were very effective:
LIN1 reach
September 2006
I-99 Environmental Research
Post-Construction Monitoring
December 2004
Many mitigation measures were very effective:
PMA1 reach
September 2006
I-99 Environmental Research
Post-Construction Monitoring
December 2004
Many mitigation measures were very effective:
PMA1 reach
September 2006
I-99 Environmental Research
Post-Construction Monitoring
December 2004
Many mitigation measures were very effective:
RES2 reach
September 2006
I-99 Environmental Research
Post-Construction Monitoring
December 2004
Many mitigation measures were very effective:
VAH1 reach
September 2006
I-99 Environmental Research
Post-Construction Monitoring
June 2005
Fencing to prevent livestock impacts was likely the most effective mitigation measure:
September 2006BEC1 upstream
5
I-99 Environmental Research
Post-Construction Monitoring
June 2005
Fencing to prevent livestock impacts was likely the most effective mitigation measure:
September 2006BEC1 upstream
I-99 Environmental Research
Post-Construction Monitoring
September 2006
Some mitigation measures were marginally effective:
BEC1 upstream reach
There are some areas where vegetation never established.
I-99 Environmental Research
Post-Construction Monitoring
September 2006
Some mitigation measures were marginally effective:
BEC1 upstream reach
The channel is trying to meander to the right
with associated deposition on the left bank.
I-99 Environmental Research
Post-Construction Monitoring
September 2006
Some mitigation measures were marginally effective:
BEC1 downstream reach
Deposition has covered the edge of a J-hook vane located at the apex of a curve.
I-99 Environmental Research
Post-Construction Monitoring
June 2005
Sep 2005
Nov 2005
April 2006
June 2006
Sep 2006
Some mitigation measures were marginally effective:
BEC1 upstream reach The stream bed has been scouring, changing riffles to pools.
BEC1 Upstream Riffle (sta 9+50, below confluence)
1034
1035
1036
1037
1038
1039
1040
1041
1042
1043
0 10 20 30 40 50 60 70
Cross Section Station (ft)
Approx. Elev. (ft)
I-99 Environmental Research
Post-Construction Monitoring
September 2006 April 2006
Invasive vegetation has appeared:Knotweed, PMA1 reach
Multi-flora rose and garlic mustard, RES1 reach
6
I-99 Environmental Research
Post-Construction Monitoring
September 2006
The stream is not immune to human impacts:
PMA1 reach
A constructed dam, presumably to provide for a fishing pool.
I-99 Environmental Research
Sediment Sampling Locations
I-99 Environmental Research
Sediment Sampling
7.498Reese Hollow Run at Stine Lane
4.669
Reese Hollow Run at Hillside
Drive
3.943Reese Hollow Run at Adams Lane
30.0241
Bald Eagle Creek at Port Matilda
Park
4.662Bell Hollow Run at Hannah Lane
25.3190Bald Eagle Creek at Hannah Lane
Sediment Load (tons/day)
Flow (cfs)Location
SUMMARY OF ANALYSES
Sediment Sampling 1/18/06
0.18Reese Hollow Run at Stine Lane
0.111Reese Hollow Run at Hillside Drive
0.111.5
Reese Hollow Run at Adams
Lane
2.553Bald Eagle Creek at Port Matilda Park
0.324Bell Hollow Run at Hannah Lane
0.417Bald Eagle Creek at Hannah Lane
Sediment Load
(tons/day)
Flow
(cfs)Location
SUMMARY OF ANALYSES
Sediment Sampling 10/18/06
I-99 Environmental Research
Sediment Sampling
SEDIMENT LOAD - PMA1
0
5
10
15
20
25
30
35
0 50 100 150 200 250 300
Flow (cfs)
Sediment Load (tons/day)
Sediment
Supply Curve
PMA1 Site
I-99 Environmental Research
Sediment Transport Capacity
Sediment
Transport
Capacity
Profile
PMA1 Site,
based on 242
cfs flow
0 100 200 300 400 500 600 700 8000
10
20
30
40
50
60
70
80 PMA1 Sed Flow Total All Grains
Main Channel Distance (ft)
Sediment Capacity (tons/day)
Legend
MPM
Toffaleti
I-99 Environmental Research
Sediment Transport Analysis
Sediment Transport Capacity Profile BEC1 Downstream Site, based on 160 cfs flow
0 100 200 300 400 500 6000
100
200
300
400
500
600
700 BEC1 downstream reach Bankfull Total All Grains
Main Channel Distance (ft)
Sediment Capacity (tons/day)
Legend
Toffaleti
MPM
Deposition at lower
transport capacity location
Flow Direction

7
I-99 Environmental Research
Proposed Monitoring Technique
After construction, using a
visual assessment establish
the location of riffle and pool
reaches.
BEC1 Upstream Monitoring Reach
I-99 Environmental Research
Proposed Monitoring Technique
At subsequent monitoring
visits, document changes to
the riffle/pool distribution as
well as any other concerns.
BEC1 Upstream Monitoring Reach
I-99 Environmental Research
Any Questions?
Thank You!