i-95 interchange enhancement and reconstruction
TRANSCRIPT

I-95 Interchange Enhancement and Reconstruction
I-95 EXPRESSWAY INTERCHANGES SECTIONS GIR/VINE AND AFC TRAFFIC STUDY -
SUPPLEMENT NUMBER 3
October 2011
Prepared for Pennsylvania Department of Transportation
By Delaware Valley Regional Planning Commission
190 North Independence Mall West, 8th Floor Philadelphia, PA 19106-1520
it (3B) Template
The Delaware Valley Regional Planning Commission is dedicated to uniting the region’s elected
officials, planning professionals, and the public with a common vision of making a great region
even greater. Shaping the way we live, work, and play, DVRPC builds consensus on improving
transportation, promoting smart growth, protecting the environment, and enhancing the economy.
We serve a diverse region of nine counties: Bucks, Chester, Delaware, Montgomery, and
Philadelphia in Pennsylvania; and Burlington, Camden, Gloucester, and Mercer in New Jersey.
DVRPC is the federally designated Metropolitan Planning Organization for the Greater
Philadelphia Region leading the way to a better future.
The symbol in our logo is adapted from the official DVRPC
seal and is designed as a stylized image of the Delaware
Valley. The outer ring symbolizes the region as a whole
while the diagonal bar signifies the Delaware River. The
two adjoining crescents represent the Commonwealth of
Pennsylvania and the State of New Jersey.
DVRPC is funded by a variety of funding sources, including federal grants from the U.S.
Department of Transportation’s Federal Highway Administration (FHWA) and Federal Transit
Administration (FTA), the Pennsylvania and New Jersey departments of transportation, as well as
by DVRPC’s state and local member governments. The authors, however, are solely responsible
for the findings and conclusions herein, which may not represent the official views or policies of the
funding agencies.
DVRPC fully complies with Title VI of the Civil Rights Act of 1964 and related statutes and
regulations in all programs and activities. DVRPC’s website (www.dvrpc.org) may be translated
into multiple languages. Publications and other public documents can be made available in
alternative languages and formats, if requested. For more information, please call (215) 238-2871.
I-95 Expressway Interchanges Sections GIR/VINE and AFC Traffic Study - Supplement Number 3 i
TABLE OF CONTENTS
EXECUTIVE SUMMARY . . . . . . . . . . . . . . . . . . . . . . . . . . . . . . . . . . . . . . . . . . . . . . . . . . . . . 1
I. INTRODUCTION . . . . . . . . . . . . . . . . . . . . . . . . . . . . . . . . . . . . . . . . . . . . . . . . . . . . . . . 3
II. COORDINATED 2030 TRAFFIC VOLUME PROJECTIONS UNDER FHWA POINTOF ACCESS (POA) STUDY SECTION AFC ALTERNATIVES . . . . . . . . . . . . . . . . 5
A. No-Build (Alternative 1) . . . . . . . . . . . . . . . . . . . . . . . . . . . . . . . . . . . . . . . . . . . . . . . 5
B. Minimum Build (Alternative 8A) . . . . . . . . . . . . . . . . . . . . . . . . . . . . . . . . . . . . . . . . 5
C. Full Diamond at Allegheny Avenue (Alternative 2) . . . . . . . . . . . . . . . . . . . . . . . . . 5
D. Split Diamond (Alternative 10) . . . . . . . . . . . . . . . . . . . . . . . . . . . . . . . . . . . . . . . . . . 6
E. Coordinated 2030 Traffic Volume Projections under the FHWA (POA) Study Section AFC Alternatives . . . . . . . . . . . . . . . . . . . . . . . . . . . . . . . . . . . . . . . . . . . . . . 6
1. No-Build (Alternative 1) Traffic Forecasts . . . . . . . . . . . . . . . . . . . . . . . . . . . . . . 6
2. Minimum Build (Alternative 8A) Traffic Forecasts . . . . . . . . . . . . . . . . . . . . . . . 10
3. Full Diamond at Allegheny Avenue (Alternative 2) Traffic Forecasts . . . . . . . . 10
4. Split Diamond (Alternative 10) Traffic Forecasts . . . . . . . . . . . . . . . . . . . . . . . . 10
III. PEDESTRIAN CROSSWALK, BICYCLE, AND VEHICULAR COUNTS AND DESIGN HOUR DATA . . . . . . . . . . . . . . . . . . . . . . . . . . . . . . . . . . . . . . . . . . . . 21
A. Special Event Attendance, Travel Mode, Residence, and Demographic Data . . . . . 21
B. Crosswalk Pedestrian, Bicycle and Vehicular Turning Movement Count Data . . . . 22
C. Place of Residence and Penn Treaty Park Access Travel Mode . . . . . . . . . . . . . . . . 24
D. The Temporal Distribution of Shad Fest Entrances to Penn Treaty Park . . . . . . . . . 27
E. Design Hour Pedestrian Crosswalk and Bicycle Lane Volumes . . . . . . . . . . . . . . . . 29
F. Design Hour Counted and 2030 Forecasted Vehicular Turning Movement Volumes . . . . . . . . . . . . . . . . . . . . . . . . . . . . . . . . . . . . . . . . . . . . . . . . . . . . . . . . . . . 33
G. Shad Fest Turning Movement Counts . . . . . . . . . . . . . . . . . . . . . . . . . . . . . . . . . . . . 33
H. 2030 Projections of Saturday Afternoon Design Hour Vehicular Turning Movement . . . . . . . . . . . . . . . . . . . . . . . . . . . . . . . . . . . . . . . . . . . . . . . . . . 35
APPENDIX A SHAD FEST EVENT COUNTS – PARK ENTRANCES, PEDESTRIANCROSSWALKS, BICYCLE LANES, AND VEHICULAR TURNING MOVEMENTS . 39
LIST OF FIGURES
1. Section AFC Current and 2030 No-Build (Alternative 1) Average Daily Traffic Volumes. 72. Section AFC 2030 No-Build (Alternative 1) AM/PM Peak Hour Traffic Volumes . . . . . . 83. Section AFC 2030 No-Build (Alternative 1) AM/PM Peak Hour Traffic Volumes (Inset) . 94. Section AFC Current and 2030 Minimum Build (Alternative 8A) Average Daily
Traffic Volumes . . . . . . . . . . . . . . . . . . . . . . . . . . . . . . . . . . . . . . . . . . . . . . . . . . . . . . . . . 11
ii I-95 Expressway Interchanges Sections GIR/VINE and AFC Traffic Study - Supplement Number 3
5. Section AFC 2030 Minimum Build (Alternative 8A) AM/PM Peak Hour Traffic Volumes . . . . . . . . . . . . . . . . . . . . . . . . . . . . . . . . . . . . . . . . . . . . . . . . . . . . . . . . . . . . . . 12
6. Section AFC 2030 Minimum Build (Alternative 8A) AM/PM Peak Hour Traffic Volumes (Inset) . . . . . . . . . . . . . . . . . . . . . . . . . . . . . . . . . . . . . . . . . . . . . . . . . . . . . . . . . 13
7. Section AFC Current and 2030 Proposed Diamond (Alternative 2) Average Daily Traffic Volumes . . . . . . . . . . . . . . . . . . . . . . . . . . . . . . . . . . . . . . . . . . . . . . . . . . . . . . . 14
8. Section AFC 2030 Proposed Diamond (Alternative 2) AM/PM Peak Hour Traffic Volumes . . . . . . . . . . . . . . . . . . . . . . . . . . . . . . . . . . . . . . . . . . . . . . . . . . . . . . . . . . . . . . 15
9. Section AFC 2030 Proposed Diamond (Alternative 2) AM/PM Peak Hour Traffic Volumes (Inset) . . . . . . . . . . . . . . . . . . . . . . . . . . . . . . . . . . . . . . . . . . . . . . . . . . . . . . . . . 16
10. Section AFC Current and 2030 (Alternative 10) Average Daily Traffic Volumes . . . . 1711. Section AFC 2030 (Alternative 10) AM/PM Peak Hour Traffic Volumes . . . . . . . . . . . 1812. Section AFC 2030 (Alternative 10) AM/PM Peak Hour Traffic Volumes (Inset) . . . . . . 1913. Shad Fest Combined Intersection Complex . . . . . . . . . . . . . . . . . . . . . . . . . . . . . . . . . . . 2314. Philadelphia County Planning Areas (CPA) and Zip Codes . . . . . . . . . . . . . . . . . . . . . 2615. Shad Fest Penn Treaty Park Entrances 1 and 2 . . . . . . . . . . . . . . . . . . . . . . . . . . . . . . . . . 2816. Shad Fest Pedestrian Count Locations 1 through 6 . . . . . . . . . . . . . . . . . . . . . . . . . . . . . 3017. Shad Fest Bicycle Lane Locations A and B . . . . . . . . . . . . . . . . . . . . . . . . . . . . . . . . . . . 3418. Shad Fest Current and 2030 Projected Saturday Afternoon Design Hour Vehicular
Turning Movement Forecasts . . . . . . . . . . . . . . . . . . . . . . . . . . . . . . . . . . . . . . . . . . . . . . 37
LIST OF TABLES
1. County/State of Residence . . . . . . . . . . . . . . . . . . . . . . . . . . . . . . . . . . . . . . . . . . . . . . . . 242. CPA and Neighborhood of Residence of the Philadelphia Shad Fest Attendees . . . . . . . 253. Means of Transportation to Shad Fest by Place of Residence . . . . . . . . . . . . . . . . . . . . . 274. Design Hour Inbound Pedestrian Counts for Crosswalk Numbers1, 5, and 3 . . . . . . . . . 315. Design Hour Outbound Pedestrian Counts for Crosswalk Numbers 1, 5, and 3 . . . . . . . 316. Design Hour Pedestrian Counts for Crosswalk Numbers 4, 6, and 2 . . . . . . . . . . . . . . . 327. Summary of Design Hour Total Pedestrian Crosswalks Counts . . . . . . . . . . . . . . . . . . . 328. Summary of Design Hour Total Bicycle Counts for Locations A and B . . . . . . . . . . . . . 339. Counted Design Hour Vehicular Traffic Turning Movements . . . . . . . . . . . . . . . . . . . . . 3510. 2030 Saturday Afternoon Forecasted Design Hour Traffic Turning Movements . . . . . . 36
APPENDIX A LIST OF TABLES
A-1. Shad Fest Park Entrance Person Counts (walk) . . . . . . . . . . . . . . . . . . . . . . . . . . . . . . . . 39A-2. Pedestrian Crosswalk Volumes for Crosswalks Numbers 1 and 5 . . . . . . . . . . . . . . . . . . 40A-3. Pedestrian Crosswalk Volumes for Crosswalks Numbers 2 and 3 . . . . . . . . . . . . . . . . . . 41A-4. Pedestrian Crosswalk Volumes for Crosswalks Numbers 4 and 6 . . . . . . . . . . . . . . . . . . 42A-5. Pedestrian Crosswalk Volume Summaries . . . . . . . . . . . . . . . . . . . . . . . . . . . . . . . . . . . 43A-6. Bicycle Lane Volumes . . . . . . . . . . . . . . . . . . . . . . . . . . . . . . . . . . . . . . . . . . . . . . . . . . . 44A-7. Vehicular Traffic Turning Movement Counts . . . . . . . . . . . . . . . . . . . . . . . . . . . . . . . . . 45
I-95 Expressway Interchanges Sections GIR/VINE and AFC Traffic Study - Supplement Number 3 1
EXECUTIVE SUMMARY
This supplemental report prepared by the Delaware Valley Regional Planning Commission(DVRPC) presents updated and coordinated year 2030 traffic forecasts for the four Section AFC(Ann Street to Frankford Creek) alternatives still being considered in the Federal HighwayAdministration Point of Access (POA) Study for the I-95 Interchange and Mainline ReconstructionProject. These alternatives include: the No-Build, Minimum Build, Full Diamond at AlleghenyAvenue, and Split Diamond Interchange which includes southbound ramps to and from I-95 atAllegheny Avenue and northbound on-and off-ramps at Castor Avenue. These forecasts are basedon coordinated underlying assumptions: 1) 2030 design year based on Board adopted DVRPCsocioeconomic forecasts; 2) include Delaware Avenue/Christopher Columbus Boulevardcondominium and casino-generated volumes; and 3) eliminate the Delaware Avenue Extensiontemporary detour road.
For each alternative, three sets of forecasts are provided: 1) 2030 Average Daily Traffic Volumes,2) 2030 AM and PM peak hour freeway, ramp, and interchange turning movement volumes, and3) 2030 AM and PM peak hour turning movement volumes for selected study area intersections.
Also, the pedestrian crosswalk, bicycle, and vehicular turning movement counts within the NorthDelaware Avenue/Beach Street intersection at East Columbia Avenue taken during the 2010 ShadFest are included and analyzed in this report. Shad Fest was held in Penn Treaty Park on April 24,2010. These counts were taken to measure pedestrian crosswalk and bicycle volumes associatedwith a large attendance event at the park. These counts, when combined with 2030 projections ofthe vehicular intersection turning movements, will ensure that the pedestrian and bicycle provisionsin the Section GIR Phase 3 design for this critical intersection can safely serve large eventpedestrian street crossings and bicycle trips given casino trip generation and other vehicular trafficgrowth.

I-95 Expressway Interchanges Sections GIR/VINE and AFC Traffic Study - Supplement Number 3 3
I. INTRODUCTION
This supplemental technical report presents updated and coordinated year 2030 traffic forecastsfor the four Section AFC alternatives still being considered in the Federal Highway Administration(FHWA) Point of Access (POA) Study of the I-95 Section AFC (Ann Street to Frankford Creek)Interchange and Mainline Reconstruction Project. These alternatives include: the No-Build,Minimum Build, Full Diamond at Allegheny Avenue, and Split Diamond Interchange, whichincludes southbound ramps to and from I-95 at Allegheny Avenue and northbound on- and off-rampsat Castor Avenue. Year 2030 projections for all four of these alternatives had been previouslyprepared by DVRPC staff as part of the Section AFC traffic study. However, the underlyingassumptions for these projections evolved as the study progressed over time. FHWA requested thatDVRPC prepare supplemental traffic projections for these four alternatives based on the sameunderlying assumptions: 1) 2030 design year based on DVRPC Board adopted socioeconomicforecasts; 2) inclusion of the Delaware Avenue/Christopher Columbus Boulevard condominium andcasino generated traffic in the forecasts; and 3) elimination of the Delaware Avenue Extensiontemporary detour road.
Three sets of forecasts are provided for each alternative: 1) 2030 Average Daily Traffic Volumes,(AADT), 2) 2030 AM and PM peak hour freeway, ramp, and interchange turning movementvolumes, and 3) 2030 AM and PM peak hour turning movement forecasts for selected study areaintersections. This data is provided for input for the POA study being prepared by the designconsultant.
Also included in this report are pedestrian crosswalk, bicycle, and vehicular turning movementcounts taken within the North Delaware Avenue/Beach Street intersection with East ColumbiaAvenue during the 2010 Shad Fest. Shad Fest was held on April 24, 2010, in Penn Treaty Park,located adjacent to the Lower Kensington and Fishtown sections of Philadelphia. In addition, 2030projections of the vehicular intersection turning movements, representative of traffic generated bythe SugarHouse Casino and proposed condominium developments, are included. These forecastswill ensure that the pedestrian and bicycle provisions included in the Section GIR Phase 3 designfor this critical intersection can safely serve pedestrian crosswalk volumes and bicycle tripsassociated with large Penn Treaty Park events, given casino and other traffic growth on DelawareAvenue.
This report supplements the 2025 traffic forecasts in the initial traffic study reports for I-95 SectionGIR, entitled I-95 Girard Avenue and I-676 Vine Expressway Interchanges, Section GIR TrafficStudy, published in June 2005; and the initial report for Section AFC, entitled I-95 Section AFC (AnnStreet to Frankford Creek) Interchange Traffic Study, May 2006. It also supplements, I-95Expressway Interchanges Sections GIR/Vine and AFC Traffic Study - Supplement Number 1,published in November 2008 and I-95 Expressway Interchanges Sections GIR/Vine and AFC TrafficStudy - Supplement Number 2, published in February 2010. As described in the initial study andSupplement Numbers 1 and 2 reports, a focused simulation was conducted, where the traffic zonesin the study area were subdivided into smaller zones to better reflect the highway network and landuse characteristics of the study area. The model's highway network within the study area wasreviewed and enhanced as needed. These section GIR and AFC forecasts assume the opening of
4 I-95 Expressway Interchanges Sections GIR/VINE and AFC Traffic Study - Supplement Number 3
SugarHouse Casino, along with the proposed condominium and commercial developments alongthe Delaware Riverfront. The forecasts also assume the preferred I-95 Interchange designs forsections VINE, BSR/BRI, and CPR. The basic modeling assumptions and forecasting methodology,as well as 2025 traffic forecasts for seven GIR alternatives, are described in the June 2005 report.The May 2006 report also includes the modeling methodology and presents forecasts for nine AFCconstruction alternatives. These travel simulations were conducted with the TRANPLAN modelingsoftware.
The November 2008 Supplement Number 1 Report describes the casino, condominium, andcommercial developmental assumptions and the 2030 DVRPC Board adopted socioeconomicforecasts, presents the 2030 Traffic Forecasts for “Build Option 7 with proposed Delaware AvenueExtension” for Section GIR and “Alternative 5 – Diamond Interchange with proposed DelawareAvenue Extension” for Section AFC, and presents 2030 pedestrian and bicycle travel forecasts forNorth Christopher Columbus Boulevard and North Delaware Avenue. The 2010 SupplementNumber 2 report presents facility design assumptions for Sections GIR and AFC under Alternative10 AADT, AM and PM peak hour turning movement forecasts, and pedestrian forecasts arepresented.
Chapter II of this report includes a description of the four Section AFC alternatives included in theFHWA Point of Access (POA) Study and presents the updated 2030 forecasts for 2030 AADT linkand AM and PM peak hour roadway and neighborhood turning movements for signalizedintersections within the study area. These forecasts are presented on a series of 12 figures, three foreach alternative.
Chapter III of this supplemental report presents the results of the 2010 Shad Fest counting effort.Included is an overview of the place of residence and travel mode taken from a companion post cardsurvey of the 2010 Shad Fest conducted by the New Kensington Community DevelopmentCorporation. A detailed description of the traffic/pedestrian/bicycle counting methodology is alsopresented , together with an analysis of the counted pedestrian crosswalk, bicycle lane, and vehicularturning movements collected during the 2010 Shad Fest held in Penn Treaty Park. Also providedin Chapter III are projected 2030 peak hour intersection vehicular turning movements assumingconstruction of the preferred I-95 interchange designs for sections GIR and AFC and the openingof the SugarHouse Casino and proposed residential condominium developments along NorthDelaware Avenue and Christopher Columbus Boulevard. This data may be used for intersectiondesign purposes and eventual construction under Section GIR Phase 3. Appendix A of thissupplemental report includes the detailed counts of pedestrian crossings, park entrances, bicycle lanevolumes, and vehicular traffic turning movements summarized by 15-minute interval for the durationof Shad Fest event from 10:30 AM to 6:00 PM.
DVRPC uses state of the practice methods to determine the effect of various improvements ontraveler behavior and system function. These include highway volumes, travel times, and modalsplits of various alternatives. Alternative selection is a complex task including these and many otherfactors. This report does not endorse or recommend any specific alternative or project. Onlyprojects that are included in DVRPC’s Transportation Improvement Program (TIP) or Long-RangePlan are officially endorsed by DVRPC.

I-95 Expressway Interchanges Sections GIR/VINE and AFC Traffic Study - Supplement Number 3 5
II. COORDINATED 2030 TRAFFIC VOLUME PROJECTIONS UNDER FHWA POINT OF ACCESS (POA) STUDY SECTION AFCALTERNATIVES
This section presents a brief description of the four I-95 Section AFC (Ann Street to FrankfordCreek) interchange and mainline reconstruction alternatives included in the FHWA Point of Access(POA) study. The highway network model used to project 2030 Section AFC traffic volumes underthe four POA alternatives included the planned casinos and condominium developments along NorthDelaware Avenue and Christopher Columbus Boulevard and also assumed the preferred alternativemainline and ramp improvement in the other four I-95 interchange improvement study areas. Thatassumes major reconstructions of the Section GIR (Girard Avenue interchange without DelawareAvenue Extension), BRI (Betsy Ross Bridge), BSR (Bridge Street/Aramingo Avenue interchanges),and CPR (Cottman/Princeton). The exact improvements and specifications included in theseinterchange reconstructions are given in the POA studies for these I-95 interchanges.
Previously, 10 alternative interchange configurations for I-95 Section AFC were studied. The fouroptions for the Section AFC interchange reconstruction POA are No-Build (Alternative 1),Minimum Build (Alternative 8A), Full Diamond (Alternative 2), and Split Diamond (Alternative10). The proposed Delaware Avenue Extension across Conrail property (also called the “temporaryrelief road”) is removed from all four alternatives in favor of a temporary I-95 lane closure reliefroad immediately adjacent to the I-95 embankment. A brief description of each alternative follows:
A. No-Build (Alternative 1)
For Section AFC, the No-Build assumes reconstruction of the I-95 mainline, the existingAllegheny/Castor Avenue interchange ramps, and the Betsy Ross Bridge viaduct in the currentconfiguration. Exceptions include a fifth utility lane added to the I-95 mainline northbound fromthe Allegheny Avenue off-ramp to the Betsy Ross Bridge Viaduct off-ramp and a fifth utility laneadded to I-95 Southbound from the Allegheny Avenue southbound off-ramp to the Girard AvenueInterchange.
B. Minimum Build (Alternative 8A)
Within Section AFC, the Minimum Build Alternative 8A is the same as the No-Build, except thatthe fifth I-95 southbound utility lane is extended northwards to the Betsy Ross Bridge on-ramp. Inthis alternative, I-95 southbound also continues as five lanes all the way through the AlleghenyAvenue Interchange to the Girard Avenue Interchange. This widening of I-95 southbound is neededto better serve heavy traffic entering the expressway from the two lane combined Betsy RossBridge/Adams Avenue connector and the relocated Aramingo Avenue southbound on-ramp.
C. Full Diamond at Allegheny Avenue (Alternative 2)
The Full Diamond Interchange design relocates the existing I-95 northbound off-and on-rampsso that all movements to and from I-95 are consolidated onto a single diamond interchangeconnected to Allegheny Avenue between Richmond and Bath streets. The northbound off-rampterminus is relocated from Westmoreland Street to Allegheny Avenue and the northbound on-ramp is relocated from Castor to Allegheny Avenue. This alternative allows access to the BetsyRoss Bridge via the relocated Allegheny Avenue northbound on-ramp and encourages local streettraffic exiting from I-95 northbound to use Allegheny Avenue rather than Westmoreland Street.
6 I-95 Expressway Interchanges Sections GIR/VINE and AFC Traffic Study - Supplement Number 3
D. Split Diamond (Alternative 10)
The Split Diamond is the preferred interchange design for I-95 Section AFC. It was developedto mitigate projected Level of Service (LOS) problems associated with the I-95 northbound rampsat Allegheny Avenue under the Full Diamond Alternative and to avoid Conrail owned landacquisition problems associated with the Diamond Alternative’s I-95 NB off-ramp. The Full(widened) Diamond Alternative was studied previously in Supplement Number 1 of this reportseries, dated November 2008. The proposed I-95 Northbound off and on-ramps were moved fromAllegheny Avenue north to Castor Avenue. Access to the Betsy Ross Bridge will be redirectedto a slip ramp from the Castor Avenue on-ramp to the approaches to the Betsy Ross Bridge. Theproposed Delaware Avenue Extension across Conrail property (also called the “temporary reliefroad”) was removed from Alternative 10 in favor of a temporary I-95 lane closure relief roadimmediately adjacent to the I-95 embankment.
E. Coordinated 2030 Traffic Volume Projections under the FHWA (POA) Study SectionAFC Alternatives
This section of the report presents 12 figures that display forecasted 2030 traffic volumes for thefour Section AFC options being considered in the POA analysis. Three figures are provided foreach alternative: 1) current and 2030 forecasted Average Daily Traffic Volumes, 2) 2030 AM andPM peak hour freeway, ramp, and interchange turning movement volumes, and 3) 2030 AM and PMpeak hour turning movement volumes for 30 signalized arterial and local street roadwayintersections within the Section AFC Study Area.
These projected volumes reflect the 2030 DVRPC Board adopted population and employmentforecasts and trip generation from the proposed/existing SugarHouse, Foxwoods, Parx, and Harrah’sChester casinos, as well as proposed condominium and commercial developments along ChristopherColumbus Boulevard and North Delaware Avenue. The traffic forecasts assume construction of thetraffic improvements contained in the DVRPC Year 2030 Regional Transportation Plan, includingthe preferred I-95 improvement alternatives for the Girard Avenue, Betsy Ross Bridge/Bridge Street,and Cottman/Princeton interchanges.
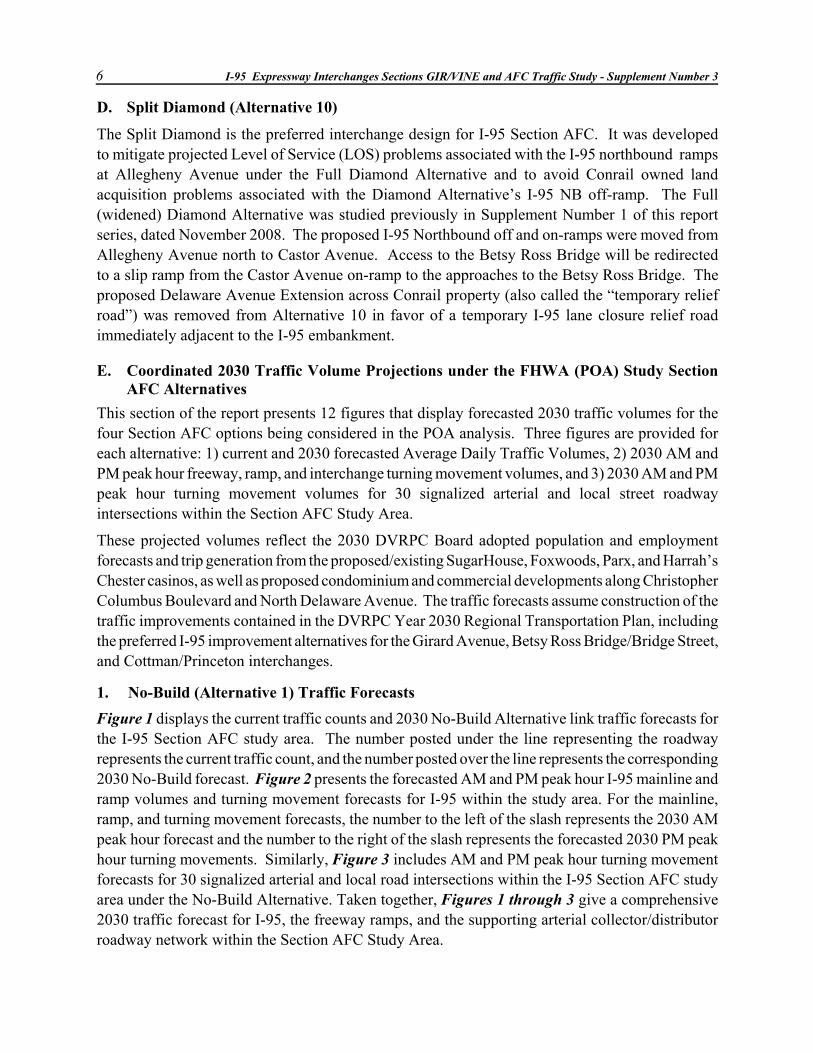
1. No-Build (Alternative 1) Traffic Forecasts
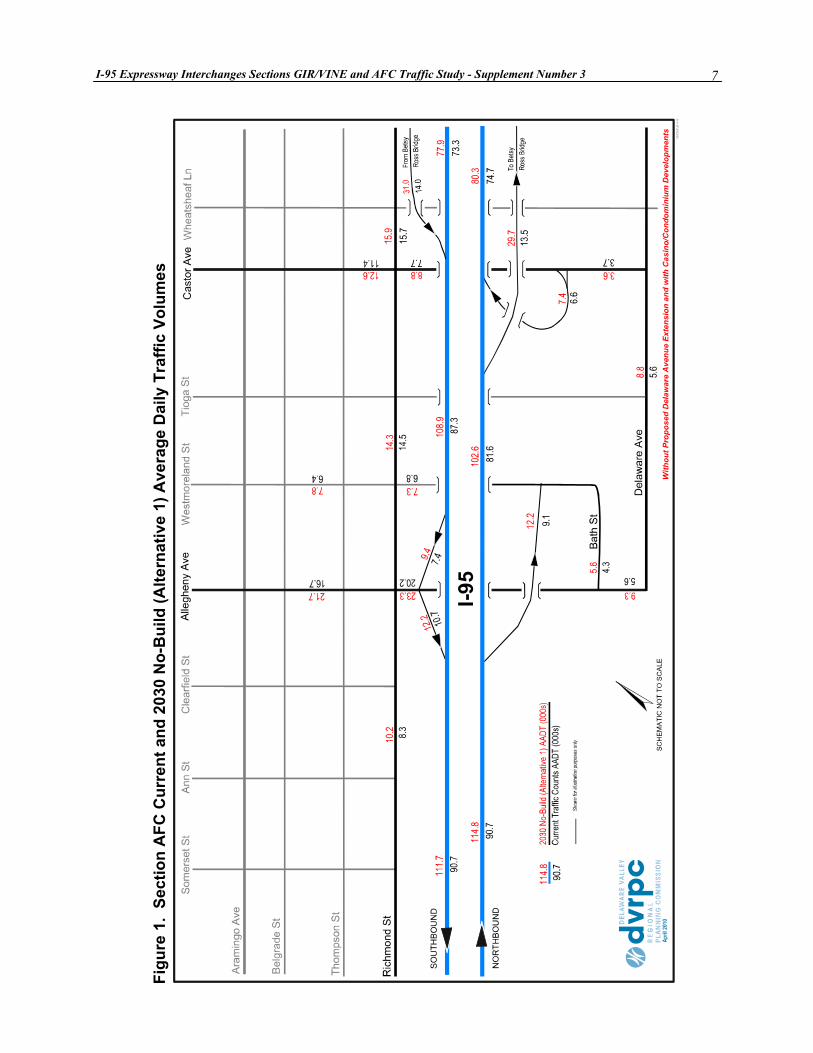
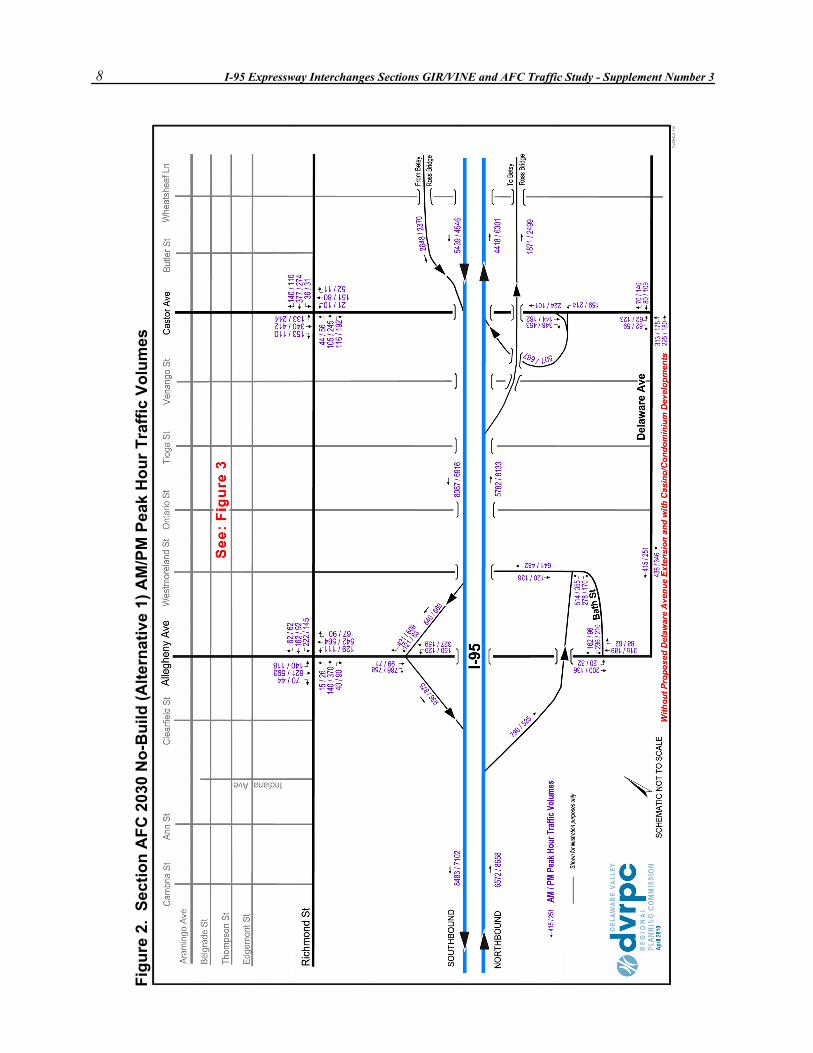
Figure 1 displays the current traffic counts and 2030 No-Build Alternative link traffic forecasts forthe I-95 Section AFC study area. The number posted under the line representing the roadwayrepresents the current traffic count, and the number posted over the line represents the corresponding2030 No-Build forecast. Figure 2 presents the forecasted AM and PM peak hour I-95 mainline andramp volumes and turning movement forecasts for I-95 within the study area. For the mainline,ramp, and turning movement forecasts, the number to the left of the slash represents the 2030 AMpeak hour forecast and the number to the right of the slash represents the forecasted 2030 PM peakhour turning movements. Similarly, Figure 3 includes AM and PM peak hour turning movementforecasts for 30 signalized arterial and local road intersections within the I-95 Section AFC studyarea under the No-Build Alternative. Taken together, Figures 1 through 3 give a comprehensive2030 traffic forecast for I-95, the freeway ramps, and the supporting arterial collector/distributorroadway network within the Section AFC Study Area.
I-95 Expressway Interchanges Sections GIR/VINE and AFC Traffic Study - Supplement Number 3
7
Fig
ure
1.
Sec
tio
n A
FC
Cu
rren
t an
d 2
030
No
-Bu
ild (
Alt
ern
ativ
e 1)
Ave
rag
e D
aily
Tra
ffic
Vo
lum
es
8 I-95 Expressway Interchanges Sections GIR/VINE and AFC Traffic Study - Supplement Number 3
F
igu
re 2
. S
ecti
on
AF
C 2
030
No
-Bu
ild (
Alt
ern
ativ
e 1)
AM
/PM
Pea
k H
ou
r T
raff
ic V
olu
mes
I-95 Expressway Interchanges Sections GIR/VINE and AFC Traffic Study - Supplement Number 3
9
Fig
ure
3.
Sec
tio
n A
FC
203
0 N
o-B
uild
(A
lter
nat
ive
1) A
M/P
M P
eak
Ho
ur
Tra
ffic
Vo
lum
es (
Inse
t)

10 I-95 Expressway Interchanges Sections GIR/VINE and AFC Traffic Study - Supplement Number 3
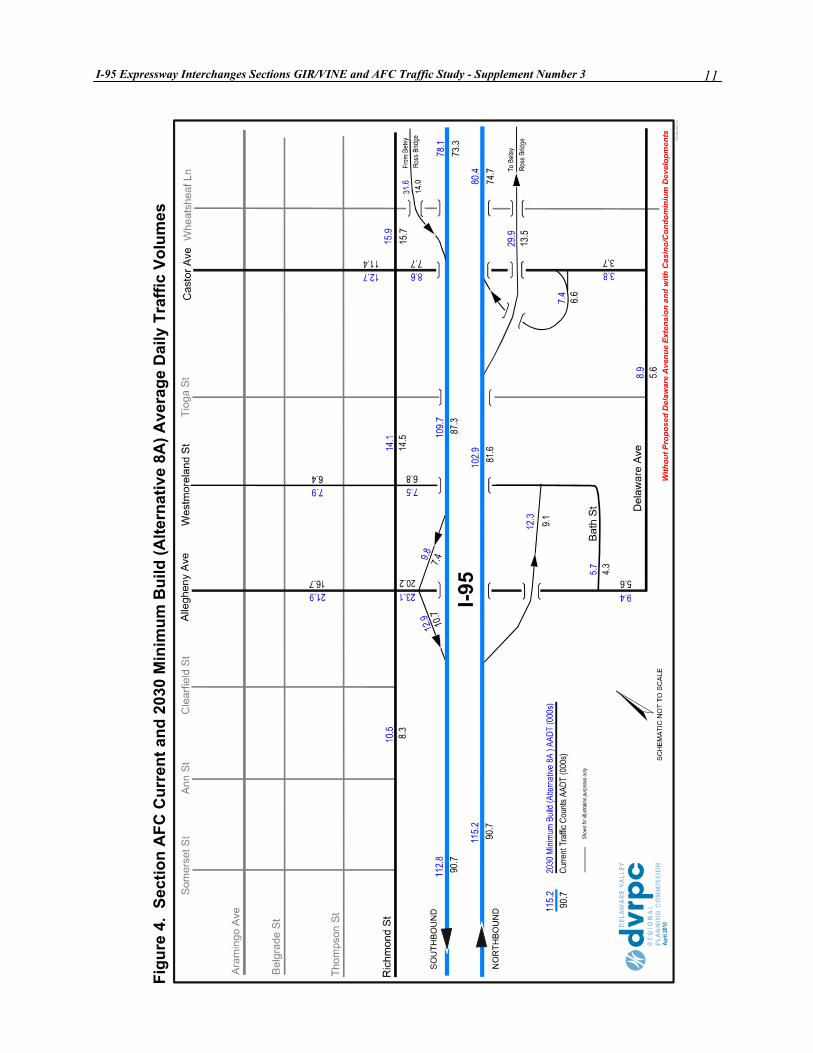
2. Minimum Build (Alternative 8A) Traffic Forecasts
Figures 4 through 6 present a comprehensive 2030 traffic forecast for I-95, the freeway ramps, andthe supporting arterial collector/distributor roadway network within the Section AFC Study Areaunder the Minimum Build Alternative
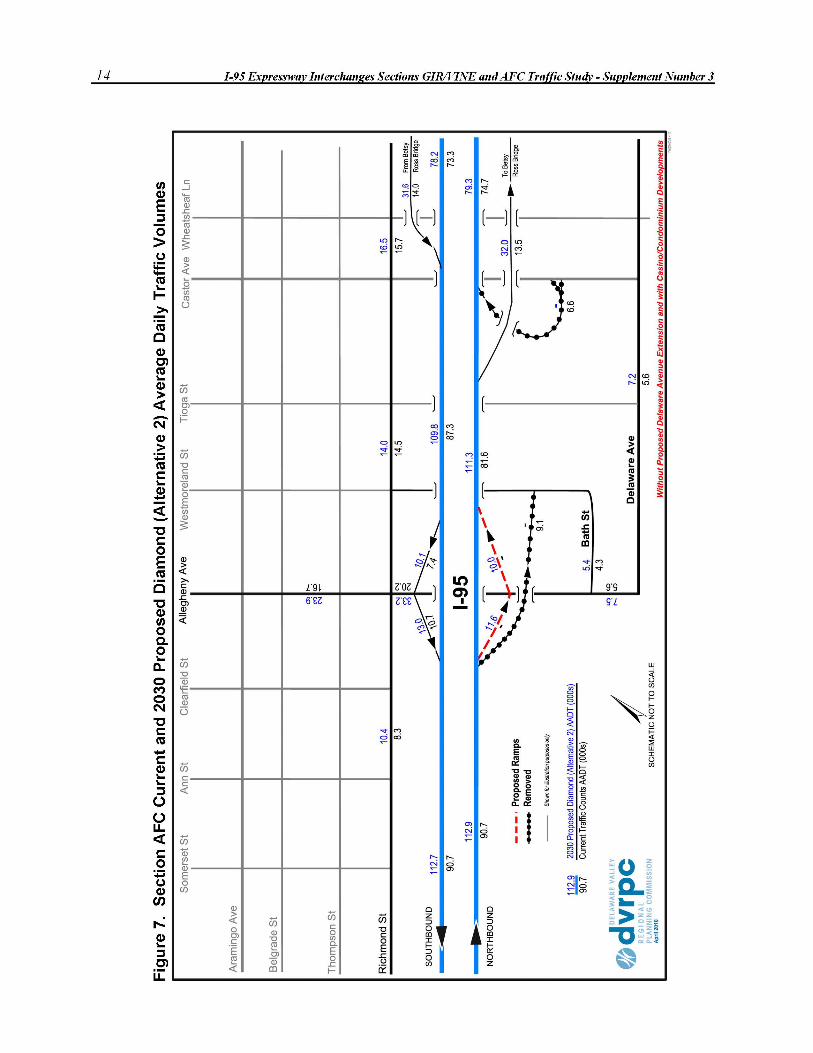
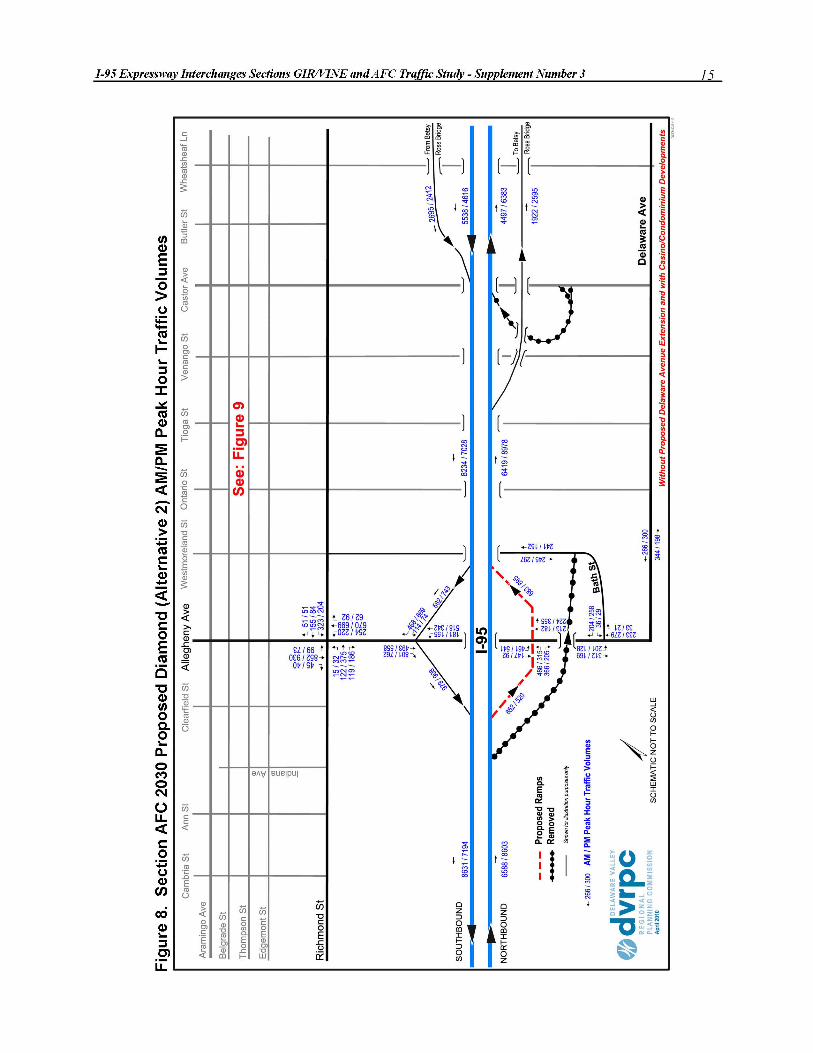
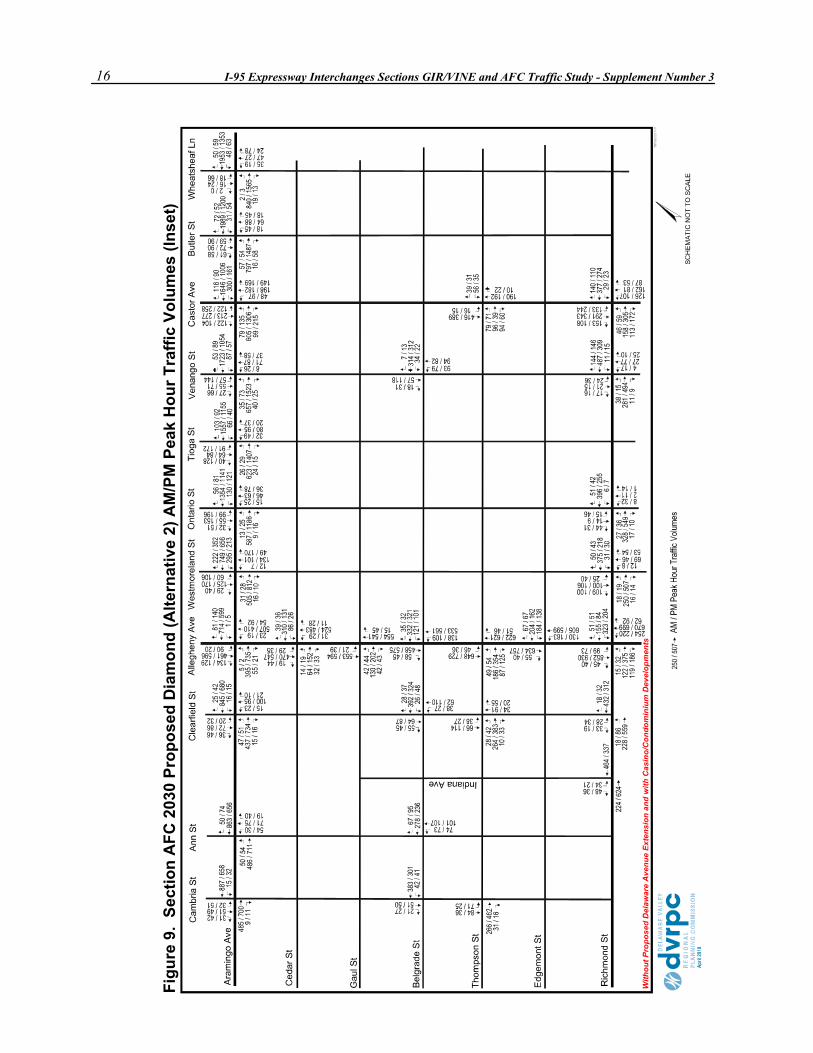
3. Full Diamond at Allegheny (Alternative 2) Traffic Forecasts
Figure 7 presents the current and forecasted 2030 Average Daily Traffic Volumes under the FullDiamond alternative. Figure 8 shows the 2030 AM and PM peak hour freeway ramp andinterchange turning movement volumes, and Figure 9 shows the 2030 AM and PM peak hourturning movement volumes for 30 signalized arterial and local roadway intersections within theSection AFC Study Area.
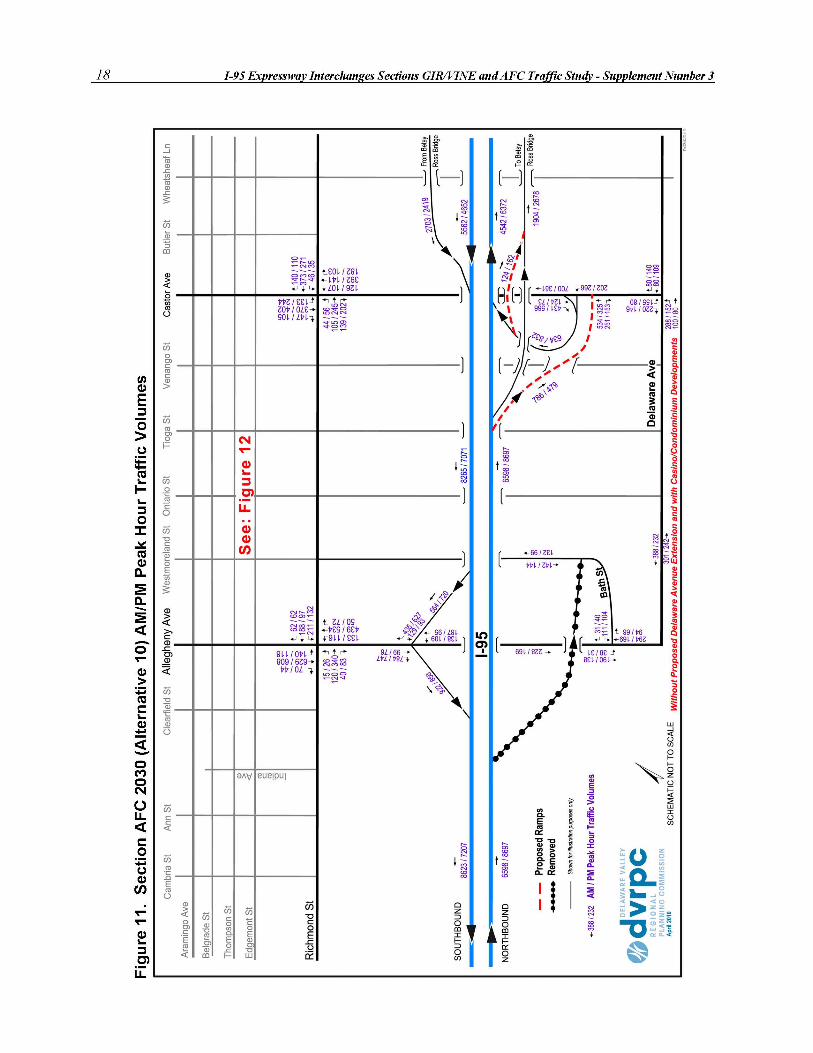
4. Split Diamond (Alternative 10) Traffic Forecasts
Figure 10 presents current and 2030 forecasted traffic volumes under Alternative 10 (SplitDiamond) for the Section AFC. Figure 11 presents AM and PM peak hour freeway, ramp, andinterchange volumes, and Figure 12 includes turning movement forecasts of 30 signalized streetintersections within the study area.
I-95 Expressway Interchanges Sections GIR/VINE and AFC Traffic Study - Supplement Number 3
11
Fig
ure
4.
Sec
tio
n A
FC
Cu
rren
t an
d 2
030
Min
imu
m B
uild
(A
lter
nat
ive
8A)
Ave
rag
e D
aily
Tra
ffic
Vo
lum
es

12 I-95 Expressway Interchanges Sections GIR/VINE and AFC Traffic Study - Supplement Number 3
Fig
ure
5.
Sec
tio
n A
FC
203
0 M
inim
um
Bu
ild (
Alt
ern
ativ
e 8
A)
AM
/PM
Pea
k H
ou
r T
raff
ic V
olu
mes

I-95 Expressway Interchanges Sections GIR/VINE and AFC Traffic Study - Supplement Number 3
13
Fig
ure
6.
Sec
tio
n A
FC
203
0 M
inim
um
Bu
ild (
Alt
ern
ativ
e 8
A)
AM
/PM
Pea
k H
ou
r T
raff
ic V
olu
mes
(In
set)
16 I-95 Expressway Interchanges Sections GIR/VINE and AFC Traffic Study - Supplement Number 3
Fig
ure
9.
Sec
tio
n A
FC
203
0 P
rop
ose
d D
iam
on
d (
Alt
ern
ativ
e 2)
AM
/PM
Pea
k H
ou
r T
raff
ic V
olu
mes
(In
set)

I-95 Expressway Interchanges Sections GIR/VINE and AFC Traffic Study - Supplement Number 3
17
Fig
ure
10.
S
ecti
on
AF
C C
urr
ent
and
203
0 (A
lter
nat
ive
10)
Ave
rag
e D
aily
Tra
ffic
Vo
lum
es

I-95 Expressway Interchanges Sections GIR/VINE and AFC Traffic Study - Supplement Number 3
19
043/021
147 / 105
043/021
2 45
/501
392 / 141
139
/ 20 2
Fig
ure
12.
S
ecti
on
AF
C 2
030
(Alt
ern
ativ
e 10
) A
M/P
M P
eak
Ho
ur
Tra
ffic
Vo
lum
es (
Inse
t)


I-95 Expressway Interchanges Sections GIR/VINE and AFC Traffic Study - Supplement Number 3 21
III. PEDESTRIAN CROSSWALK, BICYCLE, AND VEHICULARCOUNTS AND DESIGN HOUR DATA
Counts, taken during the 2010 Shad Fest, are required to ensure that the pedestrian/bicycle parkaccess designs are adequate to serve the large numbers of persons in attendance at Penn Treaty Parkduring special events. The pedestrian volume forecasts prepared by DVRPC in the “GIR/VINE andAFC Traffic Study Supplement Number 2” (February 2010) measure average weekday volumes,which are much smaller than those that occur during special events. This may lead to park accessproblems for pedestrians and bicyclists, especially crossing North Delaware Avenue, during large-attendance events. Also, North Delaware Avenue at this location is a major access route betweenthe I-95 Girard Avenue Interchange and the SugarHouse Casino. It is expected to sustain significantvolume increases from casino and new condominium traffic.
Two types of special event attendee data were identified at this meeting: 1) special event attendeecounts and travel/residence/demographic data and 2) pedestrian/bicycle crosswalk and vehicularturning movement count data for intersection design. The count data was collected on Saturday,April 24, 2010, continuously between the hours of 10:30 AM and 6:00 PM, summarized by 15-minute intervals.
A. Special Event Attendance, Travel Mode, Residence, and Demographic Data
The planning community, event organizers, and private-sector sponsors have interest in the totalattendance statistics, as well as breakdowns by residential location, travel mode, and otherdemographic data describing persons attending events. DVRPC staff collected total park entrancecounts and the New Kensington Community Development Corporation (NKCDC), the eventsponsors, conducted an on-site questionnaire-based survey to ascertain the distributions ofresidential location, travel mode, and other demographic and marketing information. In this report,which is focused on providing intersection design data for Penn Treaty Park access, tabulations ofthe NKCDC survey are focused on residence location and travel mode of those persons attendingShad Fest.
Concerts, festivals, and other organized activities of varying sizes occur at Penn Treaty Parkthroughout the spring, summer, and fall. Park entrance person counts may be useful to scale thedetailed crosswalk count information collected at Shad Fest to represent smaller or larger PennTreaty Park events, for purposes of evaluating the performance of traffic signal systems, crosswalks,bicycle lanes, and provisions for vehicular traffic. It is possible to count persons entering the parkby foot and bicycle at the two Beach Street gates, but a breakdown of those persons arriving bytransit and automobile cannot be directly ascertained because parking and transit access/egressoccurs off-site. The park entrances may overestimate attendees because some persons may enterand exit more than once and be double counted. The main focus of this effort is to collect detailedintersection pedestrian, bicycle, and vehicular movement count data for a large event to aid indesigning traffic signals, crosswalks, and provisions for vehicular movements for persons accessingthe park or passing by.

22 I-95 Expressway Interchanges Sections GIR/VINE and AFC Traffic Study - Supplement Number 3
B. Crosswalk Pedestrian, Bicycle, and Vehicular Turning Movement Counts Data
Crosswalk pedestrian and bicycle volumes by direction and vehicular (cars and trucks) turningmovement counts were collected for all crosswalks and approach/egress roadways included in thecombined North Delaware Avenue, Columbia Avenue, Beach Street, and East Allen Streetintersection complex depicted in Figure 13. Specifically, the following locations were counted:
1. Crosswalk Pedestrian Volumes by Direction:
! E. Columbia Avenue across N. Delaware Avenue on the south side
! E. Columbia Avenue across N. Delaware Avenue on the north side
! E. Allen Street/N. Delaware Avenue across E. Columbia Avenue
! E. Columbia Avenue across E. Allen Street
! N. Delaware Avenue across E. Columbia Avenue (on park side of street)
! Beach Street across Columbia Avenue
2. Bicycle Lanes: (See Figure 17)
! Northbound on the Delaware River side of N. Delaware Avenue into E. Columbia Avenue
! Southbound N. Delaware Avenue from the north into E. Columbia Avenue
3. Vehicular Turning Movement Counts:
(Please note that Beach Street between N. Delaware and E. Columbia Avenues (in front of the park was closedto through traffic during Shad Fest)
North Delaware Avenue northbound into:
! N. Delaware Avenue northbound (straight through)
! E. Columbia Avenue eastbound into park (right turn)
! Allen Street southbound (left turn)
N. Delaware Avenue southbound into:
! N. Delaware Avenue southbound (straight through)
! E. Columbia Avenue eastbound into park (left turn)
! Allen Street southbound (bear right)


24 I-95 Expressway Interchanges Sections GIR/VINE and AFC Traffic Study - Supplement Number 3
Table 1. County/State of Residence
Philadelphia 92%Other Pennsylvania Counties 4%New Jersey 2%New York 2%
Total 100%
Source: DVRPC April 2010
E. Columbia Avenue eastbound at N. Delaware Avenue into:
! E. Columbia Avenue eastbound (straight through)
! Allen Street southbound (hard right turn)
! N. Delaware Avenue southbound (right turn)
! N. Delaware Avenue northbound (left turn)
E. Columbia Avenue eastbound at Beach Street into:
! Beach Street northbound (left turn)
! Penn Treaty Park entrance (straight through)
! Beach Street southbound (right turn)
E. Columbia Avenue westbound at N. Delaware Avenue:
! Allen Street southbound (bear left)
! N. Delaware Avenue southbound (left turn)
! N. Delaware Avenue northbound (right turn)
C. Place of Residence and Penn Treaty Park Access Travel Mode
As noted above, the New Kensington Community Development Corporation (NKCDC) conductedan on-site postcard survey during the 2010 Shad Fest. Among the questions included in the surveywere zip code, residence, and the mode (walk, bicycle, SEPTA, or drive) used to travel to thefestival. These selected results are included in this DVRPC report to provide a larger perspectiveon the DVRPC counts that will be used to design the pedestrian access improvements to Penn TreatyPark.
Table 1 provides a tabulation of the county/state of residence from the NKCDC survey. The vastmajority (92 percent) Shad Fest attendees live in Philadelphia. About four percent live in otherPennsylvania counties and some two percent of Shad Fest attendees live in New Jersey and NewYork, each.

I-95 Expressway Interchanges Sections GIR/VINE and AFC Traffic Study - Supplement Number 3 25
CPA Neighborhood
7 Bridesburg - Kensington - Richmond* 59%1 Center City 13%6 Upper North Philadelphia 9%2 South Philadelphia 6%9 Germantown - Chestnut Hill 5%
11 Near Northeast Philadelphia 5%12 Far Northeast Philadelphia 2% - Other 1%
Total 100%
* Includes Fishtown neighborhood
Percentage
Table 2. CPA and Neighborhood of Residence of the PhiladelphiaShad Fest Attendees
Shad Fest postcard survey had 125 responses. This is not a big enough sample to performstatistically significant analysis of attendees by zip code. For this reason, the survey residenceresponses were tabulated by County Planning Area (CPA), which are shown in Figure 14. EachCPA comprises a number of individual zip codes, giving the tabulation more statistical significance,especially beyond the immediate area of Penn Treaty Park.
Table 2 provides a tabulation of the percentage of Shad Fest attendees by CPA, and neighborhoods.Almost 60 percent of Shad Fest attendees live in the immediate Philadelphia neighborhoods ofBridesburg, Kensington, Fishtown, and Richmond. Center City Philadelphia residences are asomewhat distant second, with 13 percent of event attendees. Five percent or more of Shad Festattendees reside in four additional CPAs – North Philadelphia (nine percent), South Philadelphia(six percent), Germantown/Chestnut Hill (five percent), and Near Northeast Philadelphia (fivepercent).
A breakdown of the transport modes used to travel to Shad Fest into walk, bicycle, SEPTA, anddrive is given in Table 3. Respondents are summarized by two categories: those who live in nearbyneighborhoods (CPA 7) and all survey responses. The motivation for this stratification is residentialdistance from Penn Treaty Park, a major determinant of the probability of walking. Some 58percent of nearby neighborhood residents walked to Shad Fest, compared to 35 percent overall. The23 percent reduction in walking is accounted for by increases in SEPTA (six to 16 percent) anddrive (22 to 35 percent). It is interesting to note that bicycle had the same percentage (14 percent)for immediate neighborhoods and overall. Travel distance is much less of a factor for bicycle travelwithin Shad Fest service area – about five miles or less radial distance from the Penn Treaty Park.
Source: DVRPC April 2010


I-95 Expressway Interchanges Sections GIR/VINE and AFC Traffic Study - Supplement Number 3 27
Table 3. Means of Transportation to Shad Fest by Place of Residence
Source: DVRPC April 2010
Virtually everyone who drove to Shad Fest parked on the street outside of the park or in one ofseveral nearby lots. Ease of access to the car promotes multiple entries to Penn Treaty Park becausethese persons may walk back and forth to the car several times to retrieve or drop off personal items.Each trip to the car generates an additional park walk entry that is counted by DVRPC staff locatedat the park entrances.
D. The Temporal Distribution of Shad Fest Entrances to Penn Treaty Park
DVRPC stationed two staff persons at the entrances to Penn Treaty Park to count the number ofpersons entering the park during Shad Fest. Park entrances were counted between 10:30 AM and6:00 PM and tabulated by 15 minute intervals. As noted above, there is the possibility of enteringthe park anywhere along Beach Street between the PECO power plant on the north and the southernentrance opposite Marlborough Street. Many, if not most, persons entered the park through the mainentrance opposite East Columbia Avenue. To more accurately count all persons entering the park,Beach Street was divided up into sectors, as shown in Figure 15. The staff person counting themain entrance (Entrance #1) was responsible for the sector between the fence on the south side ofthe park parking lot northwards to the fence around the power plant. Entrance #2 included the sectorfrom the Marlborough Street entrance to the parking lot fence. Due to the diversity of park entrancelocations and walk routes and the high volume of pedestrians during the peak periods, there istendency to over count park entrances. Some persons entering the park may be double counted. Itis not always possible to recognize each person distinctly and determine whether he/she has alreadybeen counted.
There are two sources of error when interpreting park entrance person counts and Shad Festattendance. As noted in Section C, persons who drive to Shad Fest may return to their car parkednearby two or more times, all of which are counted as park entrances. Second, counting personnelmay be somewhat overwhelmed by the numbers of persons approaching the park entrances,especially during peak periods, resulting in double counting some individuals while missing others.It is difficult to make an exact estimate of the resultant attendance over counting, although analysisof the event total pedestrian crosswalk and bicycle lane counted volumes given in Appendix Aindicates that about 8,000 to 9,000 persons in total attended Shad Fest. This is the attendanceestimate that should be used to scale the design hour crosswalk and bicycle lane volumes given inSection E to different sized Penn Treaty Park events.
Bridesburg/Kensington AllTravel Mode Richmond (CPA 7) Attendees
Walk 58% 35% Bicycle 14% 14% SEPTA 6% 16% Drive 22% 35%
Total 100% 100%

I-95 Expressway Interchanges Sections GIR/VINE and AFC Traffic Study - Supplement Number 3 29
Appendix A, Table A-1 presents tabulations by 15-minute intervals of the park entrance counts atEntrance #1 and Entrance #2 and the total for both entrances. From 10:30 AM to 6:00 PM, 7,158persons entering the park were counted at Entrance #1, and 4,066 at Entrance #2, for an event totalof 11, 224 park person entrances. This total includes double counting of about 2,500 persons.
E. Design Hour Pedestrian Crosswalk and Bicycle Lane Volumes
For the sum of both entrances, the peak hour (2,293 persons) occurred between 2:00 PM and 3:00PM. However, the design hour for the pedestrian crosswalk volumes both to and from the park,Tables 4 through 7, occurred between 3:00 PM and 4:00 PM. During this hour, significant numbersof persons were leaving Shad Fest, and this more than counterbalances the drop in park entrances(1,880 persons).
Hourly pedestrian crosswalk and vehicular turning movement count distributions were discussedwith the traffic design consultants, and 3:00 PM to 4:00 PM was selected as the design hour forintersection design purposes. The count tabulations that follow are for the design hour, although15-minute subtotals for the duration of Shad Fest are included in Appendix A.
The design for the combined East Columbia Avenue/North Delaware/East Allen Street/Beach Streetintersection is based primarily on safely accommodating pedestrian crosswalk volumes of personsdestined to and coming from Shad Fest given conflicting vehicular volumes.
Generally, pedestrian and bicycle crossings of North Delaware Avenue to/from the 2010 Shad Festwent well. The traffic signal, pedestrian phase, and countdown timers installed after the 2009 ShadFest were helpful, but large groups of pedestrians crossing North Delaware Avenue still could notcompletely clear the crosswalk in the 22 seconds allotted before the traffic light turned green forvehicular travel. This led to conflicts where aggressive motorists tried to maneuver around personsstill on the crosswalk.
A major factor in this relatively safe and trouble-free intersection performance is that Saturdayvehicular volumes are much less than (about half of) weekday peak hour traffic – mitigatingpotential pedestrian/traffic conflicts. Furthermore, the SugarHouse Casino was not opened forbusiness when the count data was collected. Additional casino-generated traffic on North DelawareAvenue must be considered in evaluating potential intersection designs. Counted and projected2030 vehicular turning movement volumes are included in Section G to assist in the design effort.
Crosswalks are indexed numerically in Figure 16. This figure provides a reference (CrosswalkNumbers 1 through 6) to the design hour count data in Tables 4 through 7. For purposes ofanalysis, the crosswalks are categorized by park access function – inbound to park, outbound frompark, and East Columbia Avenue (crossings orthogonal to park access).


I-95 Expressway Interchanges Sections GIR/VINE and AFC Traffic Study - Supplement Number 3 31
Table 4. Design Hour Inbound Pedestrian Counts for Crosswalk Numbers 1, 5 and 3
Source: DVRPC April 2010
Table 5. Design Hour Outbound Pedestrian Counts for Crosswalk Numbers 1, 5, and 3
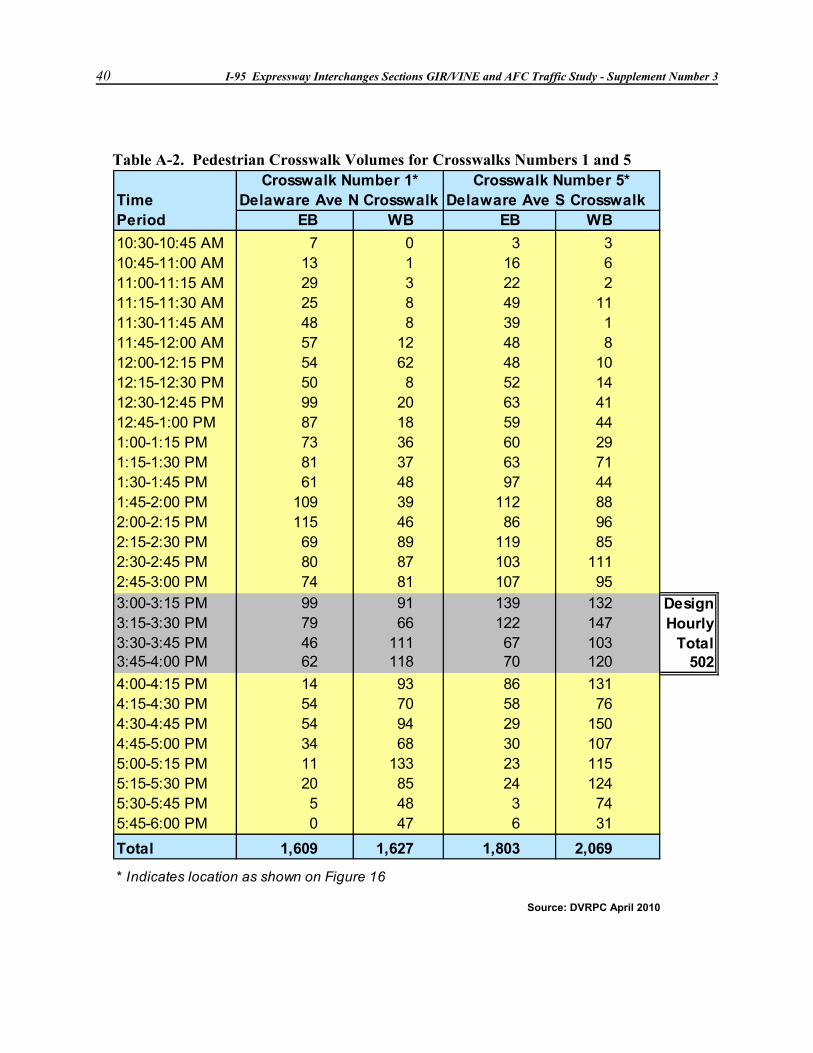
Table 4 presents design hour pedestrian crosswalk counts, tabulated by 15-minute increments, forcrosswalk movements inbound to Shad Fest (see Figure 16, Crosswalk Reference numbers 1, 5, and3). Inbound pedestrian crossings include North Delaware Avenue eastbound, both on the north andsouth sides of East Columbia Avenue and East Allen Street southbound. During the design hour,the south North Delaware Avenue crosswalk serves more eastbound person crossings than the northside (398 versus 286 persons), and the East Allen Street crosswalk another 224 persons, for a totalof 908 inbound person crossings that must be accommodated within the intersections during thedesign hour.
Outbound pedestrian street crossings (see Table 5) are somewhat larger than inbound volumes inthe design hour (1,075 versus 908 persons). Outbound volumes are the westbound movements onthe same three crosswalks as park inbound crossings. As with inbound volumes, the DelawareAvenue south crosswalk is favored over the north crosswalk (502 versus 386 pedestrians).
Taken together, the inbound and outbound crosswalk volumes constitute significant numbers ofpedestrians (almost 2,000) to be accommodated by the crosswalk design and signal system duringthe design hour.
TimePeriod EB EB SB
3:00-3:15 PM 99 139 68 3063:15-3:30 PM 79 122 47 2483:30-3:45 PM 46 67 52 1653:45-4:00 PM 62 70 57 189
Total 286 398 224 908
* Indicates location as shown on Figure 16
InboundCrosswalks
SubtotalCrosswalk Number 3*Allen St Crosswalk
Crosswalk Number 5*Crosswalk Number 1*Delaware Ave S CrosswalkDelaware Ave N Crosswalk
TimePeriod WB WB NB
3:00-3:15 PM 91 132 42 2653:15-3:30 PM 66 147 67 2803:30-3:45 PM 111 103 42 2563:45-4:00 PM 118 120 36 274
Total 386 502 187 1,075
* Indicates location as shown on Figure 16
Delaware Ave N Crosswalk Delaware Ave S CrosswalkCrosswalk Number 3* Subtotal
OutboundCrosswalks
Allen St Crosswalk Crosswalk Number 1* Crossswalk Number 5*
Source: DVRPC April 2010
32 I-95 Expressway Interchanges Sections GIR/VINE and AFC Traffic Study - Supplement Number 3
Columbia Ave Crosswalk TimePeriod NB SB NB SB NB SB
3:00-3:15 PM 23 20 17 3 7 2 723:15-3:30 PM 9 7 9 6 13 4 483:30-3:45 PM 18 16 14 18 14 11 913:45-4:00 PM 46 8 14 6 15 13 102
Total 96 51 54 33 49 30 313
** Indicates location as shown on Figure 16* Indicates location as shown on Figure 15
at Allen St Crosswalks
Columbia Ave Crosswalk at Delaware Ave NB
Crosswalk Number 4**Subtotal
Columbia Ave
Crosswalk Number 6** Crosswalk Number 2**
Op. Park Entrance 2*Columbia Ave Crosswalk
TimePeriod
3:00-3:15 PM 72 306 265 6433:15-3:30 PM 48 248 280 5763:30-3:45 PM 91 165 256 5123:45-4:00 PM 102 189 274 565
Total 313 908 1,075 2,296
Crosswalks
SubtotalOutbound
Crosswalks
Total All
SubtotalColumbia Ave
Crosswalks CrosswalksInboundSubtotal
Table 6. Design Hour Pedestrian Counts for Crosswalks Numbers 4, 6, and 2
Table 7. Summary of Design Hour Total Pedestrian Crosswalks Counts
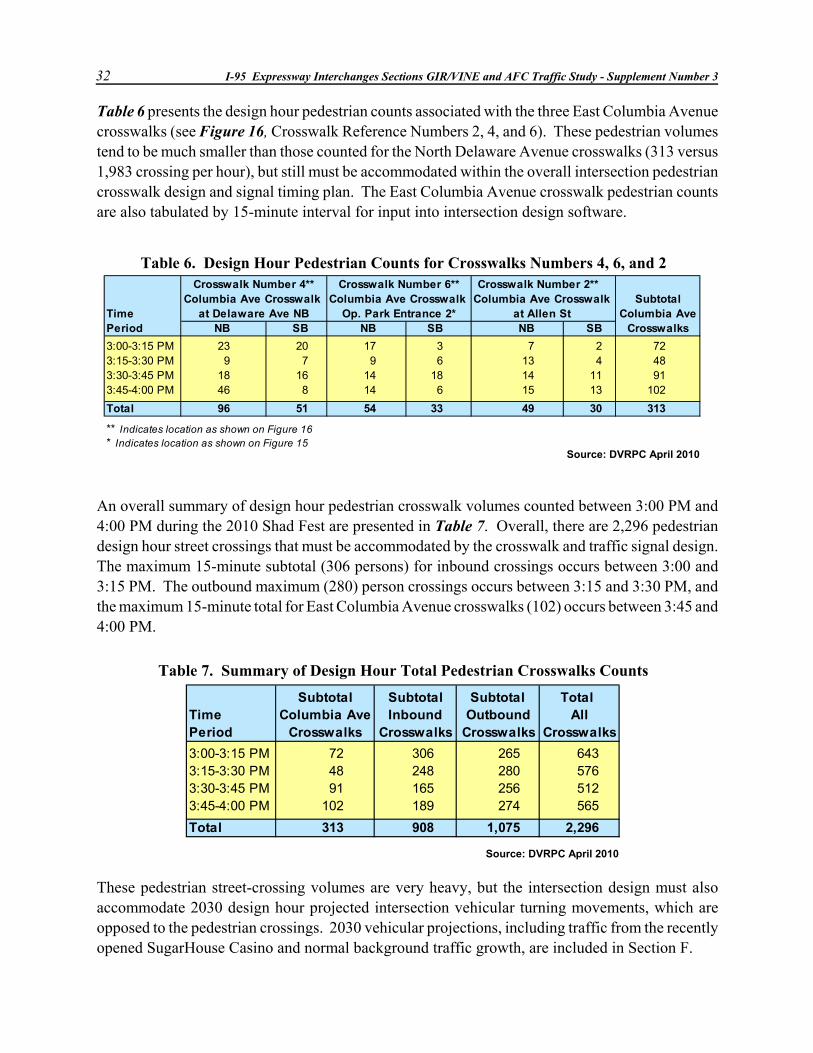
Table 6 presents the design hour pedestrian counts associated with the three East Columbia Avenuecrosswalks (see Figure 16, Crosswalk Reference Numbers 2, 4, and 6). These pedestrian volumestend to be much smaller than those counted for the North Delaware Avenue crosswalks (313 versus1,983 crossing per hour), but still must be accommodated within the overall intersection pedestriancrosswalk design and signal timing plan. The East Columbia Avenue crosswalk pedestrian countsare also tabulated by 15-minute interval for input into intersection design software.
An overall summary of design hour pedestrian crosswalk volumes counted between 3:00 PM and4:00 PM during the 2010 Shad Fest are presented in Table 7. Overall, there are 2,296 pedestriandesign hour street crossings that must be accommodated by the crosswalk and traffic signal design.The maximum 15-minute subtotal (306 persons) for inbound crossings occurs between 3:00 and3:15 PM. The outbound maximum (280) person crossings occurs between 3:15 and 3:30 PM, andthe maximum 15-minute total for East Columbia Avenue crosswalks (102) occurs between 3:45 and4:00 PM.
These pedestrian street-crossing volumes are very heavy, but the intersection design must alsoaccommodate 2030 design hour projected intersection vehicular turning movements, which areopposed to the pedestrian crossings. 2030 vehicular projections, including traffic from the recentlyopened SugarHouse Casino and normal background traffic growth, are included in Section F.
Source: DVRPC April 2010
Source: DVRPC April 2010
I-95 Expressway Interchanges Sections GIR/VINE and AFC Traffic Study - Supplement Number 3 33
Table 8. Summary of Design Hour Total Bicycle Counts for Locations A and B
TimePeriod
3:00-3:15 PM 12 4 163:15-3:30 PM 2 1 33:30-3:45 PM 1 2 33:45-4:00 PM 6 7 13
Total 21 14 35
* Indicates location as shown on Figure 17
TotalAll
Bicycle Lanes
Delaware AvenueNorthbound
Bicycle Count A* Bicycle Count B*Southbound
Delaware Avenue
Pedestrian crossings are not projected to 2030; rather, anticipated attendance for Penn Treaty Parkevents may be used to factor the crosswalk counts in Tables 4 through 7 above using the ratio ofanticipated attendees to the 8,500 Shad Fest attendance presented in Section E above.
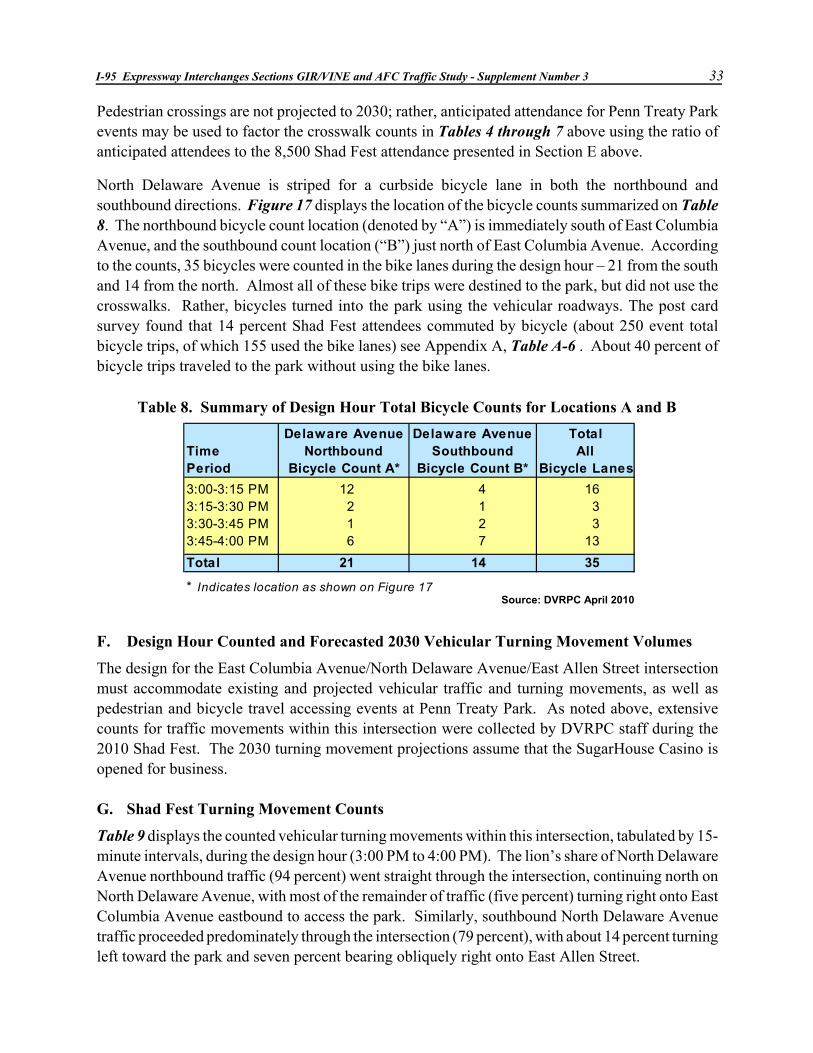
North Delaware Avenue is striped for a curbside bicycle lane in both the northbound andsouthbound directions. Figure 17 displays the location of the bicycle counts summarized on Table8. The northbound bicycle count location (denoted by “A”) is immediately south of East ColumbiaAvenue, and the southbound count location (“B”) just north of East Columbia Avenue. Accordingto the counts, 35 bicycles were counted in the bike lanes during the design hour – 21 from the southand 14 from the north. Almost all of these bike trips were destined to the park, but did not use thecrosswalks. Rather, bicycles turned into the park using the vehicular roadways. The post cardsurvey found that 14 percent Shad Fest attendees commuted by bicycle (about 250 event totalbicycle trips, of which 155 used the bike lanes) see Appendix A, Table A-6 . About 40 percent ofbicycle trips traveled to the park without using the bike lanes.
F. Design Hour Counted and Forecasted 2030 Vehicular Turning Movement Volumes
The design for the East Columbia Avenue/North Delaware Avenue/East Allen Street intersectionmust accommodate existing and projected vehicular traffic and turning movements, as well aspedestrian and bicycle travel accessing events at Penn Treaty Park. As noted above, extensivecounts for traffic movements within this intersection were collected by DVRPC staff during the2010 Shad Fest. The 2030 turning movement projections assume that the SugarHouse Casino isopened for business.
G. Shad Fest Turning Movement Counts
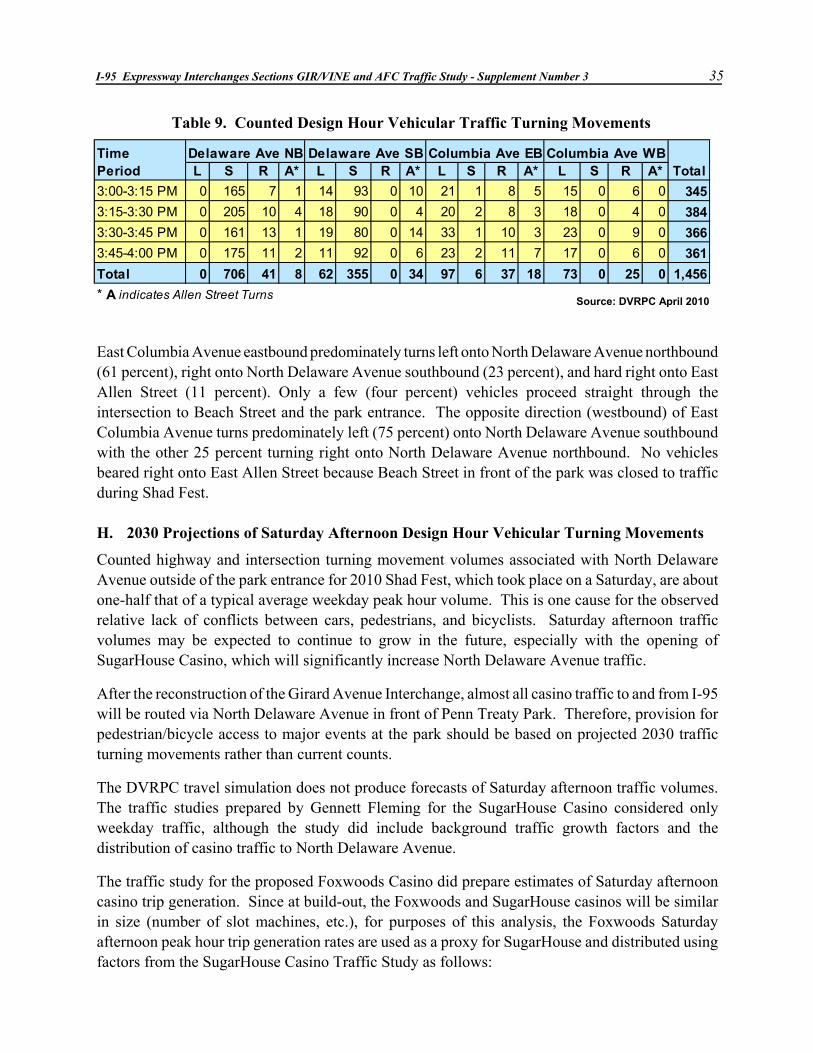
Table 9 displays the counted vehicular turning movements within this intersection, tabulated by 15-minute intervals, during the design hour (3:00 PM to 4:00 PM). The lion’s share of North DelawareAvenue northbound traffic (94 percent) went straight through the intersection, continuing north onNorth Delaware Avenue, with most of the remainder of traffic (five percent) turning right onto EastColumbia Avenue eastbound to access the park. Similarly, southbound North Delaware Avenuetraffic proceeded predominately through the intersection (79 percent), with about 14 percent turningleft toward the park and seven percent bearing obliquely right onto East Allen Street.
Source: DVRPC April 2010

I-95 Expressway Interchanges Sections GIR/VINE and AFC Traffic Study - Supplement Number 3 35
TimePeriod L S R A* L S R A* L S R A* L S R A* Total
3:00-3:15 PM 0 165 7 1 14 93 0 10 21 1 8 5 15 0 6 0 345
3:15-3:30 PM 0 205 10 4 18 90 0 4 20 2 8 3 18 0 4 0 384
3:30-3:45 PM 0 161 13 1 19 80 0 14 33 1 10 3 23 0 9 0 366
3:45-4:00 PM 0 175 11 2 11 92 0 6 23 2 11 7 17 0 6 0 361
Total 0 706 41 8 62 355 0 34 97 6 37 18 73 0 25 0 1,456
* A indicates Allen Street Turns
Delaware Ave NB Delaware Ave SB Columbia Ave EB Columbia Ave WB
Table 9. Counted Design Hour Vehicular Traffic Turning Movements
East Columbia Avenue eastbound predominately turns left onto North Delaware Avenue northbound(61 percent), right onto North Delaware Avenue southbound (23 percent), and hard right onto EastAllen Street (11 percent). Only a few (four percent) vehicles proceed straight through theintersection to Beach Street and the park entrance. The opposite direction (westbound) of EastColumbia Avenue turns predominately left (75 percent) onto North Delaware Avenue southboundwith the other 25 percent turning right onto North Delaware Avenue northbound. No vehiclesbeared right onto East Allen Street because Beach Street in front of the park was closed to trafficduring Shad Fest.
H. 2030 Projections of Saturday Afternoon Design Hour Vehicular Turning Movements
Counted highway and intersection turning movement volumes associated with North DelawareAvenue outside of the park entrance for 2010 Shad Fest, which took place on a Saturday, are aboutone-half that of a typical average weekday peak hour volume. This is one cause for the observedrelative lack of conflicts between cars, pedestrians, and bicyclists. Saturday afternoon trafficvolumes may be expected to continue to grow in the future, especially with the opening ofSugarHouse Casino, which will significantly increase North Delaware Avenue traffic.
After the reconstruction of the Girard Avenue Interchange, almost all casino traffic to and from I-95will be routed via North Delaware Avenue in front of Penn Treaty Park. Therefore, provision forpedestrian/bicycle access to major events at the park should be based on projected 2030 trafficturning movements rather than current counts.
The DVRPC travel simulation does not produce forecasts of Saturday afternoon traffic volumes.The traffic studies prepared by Gennett Fleming for the SugarHouse Casino considered onlyweekday traffic, although the study did include background traffic growth factors and thedistribution of casino traffic to North Delaware Avenue.
The traffic study for the proposed Foxwoods Casino did prepare estimates of Saturday afternooncasino trip generation. Since at build-out, the Foxwoods and SugarHouse casinos will be similarin size (number of slot machines, etc.), for purposes of this analysis, the Foxwoods Saturdayafternoon peak hour trip generation rates are used as a proxy for SugarHouse and distributed usingfactors from the SugarHouse Casino Traffic Study as follows:
Source: DVRPC April 2010
36 I-95 Expressway Interchanges Sections GIR/VINE and AFC Traffic Study - Supplement Number 3
Table 10. 2030 Saturday Afternoon Forecasted Design Hour Vehicular Traffic Turning Movements **
Time Delaware Ave SB Period L S R A* L S R A* L S R A* L S R A* Total
3:00-3:15 PM 0 277 12 2 17 228 0 12 25 1 20 6 37 0 7 0 643
3:15-3:30 PM 0 344 17 7 22 220 0 5 24 2 20 4 44 0 5 0 713
3:30-3:45 PM 0 270 22 2 23 196 0 17 40 1 24 4 56 0 11 0 665
3:45-4:00 PM 0 294 18 3 13 225 0 7 28 2 27 8 42 0 7 0 676
Total 0 1,186 69 13 74 869 0 41 116 7 91 22 179 0 30 0 2,697
* A indicates Allen Street Turns
**Assumes that SugarHouse Casino Phase II Development Plan is completed and opened for business
Delaware Ave NB Columbia Ave EB Columbia Ave WB
! Annual growth rate for background traffic – 1.00 percent per year.
! Saturday afternoon peak hour traffic (about 1:00 PM) – 966 vehicles entering thecasino parking lot and 595 vehicles exiting the casino.
! Sixty percent of SugarHouse Casino traffic will be to or from the north, or about 580peak hour vehicles to SugarHouse from the north, and 360 peak hour casino vehiclesexiting to the north.
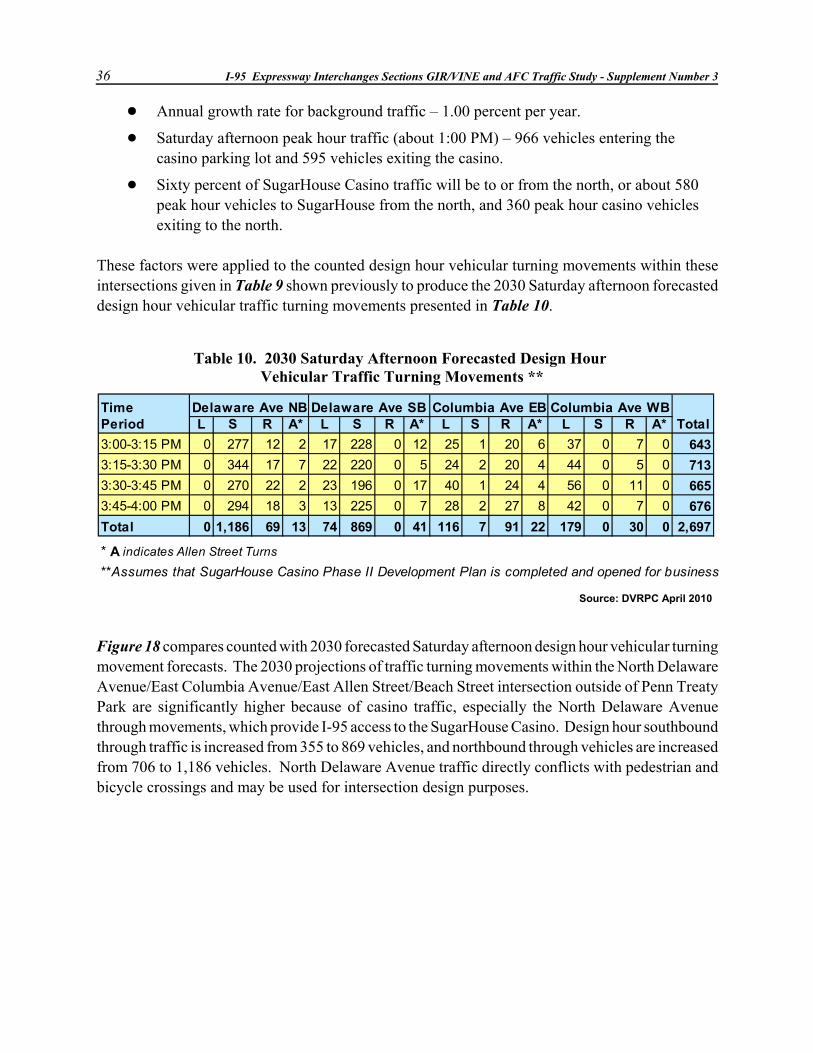
These factors were applied to the counted design hour vehicular turning movements within theseintersections given in Table 9 shown previously to produce the 2030 Saturday afternoon forecasteddesign hour vehicular traffic turning movements presented in Table 10.
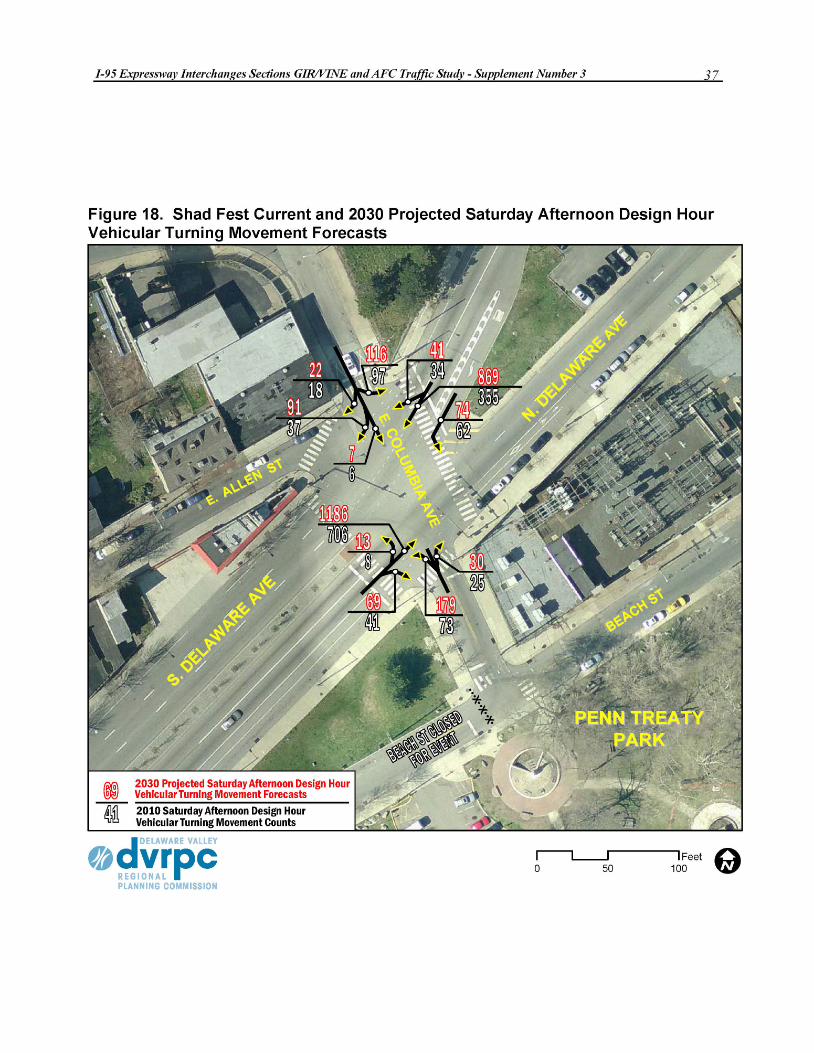
Figure 18 compares counted with 2030 forecasted Saturday afternoon design hour vehicular turningmovement forecasts. The 2030 projections of traffic turning movements within the North DelawareAvenue/East Columbia Avenue/East Allen Street/Beach Street intersection outside of Penn TreatyPark are significantly higher because of casino traffic, especially the North Delaware Avenuethrough movements, which provide I-95 access to the SugarHouse Casino. Design hour southboundthrough traffic is increased from 355 to 869 vehicles, and northbound through vehicles are increasedfrom 706 to 1,186 vehicles. North Delaware Avenue traffic directly conflicts with pedestrian andbicycle crossings and may be used for intersection design purposes.
Source: DVRPC April 2010


I-95 Expressway Interchanges Sections GIR/VINE and AFC Traffic Study - Supplement Number 3 39
APPENDIX A SHAD FEST EVENT COUNTS - PARK ENTRANCES,PEDESTRIAN CROSSWALKS, BICYCLE LANES, AND VEHICULARTURNING MOVEMENTS
TimePeriod
10:30-10:45 AM 42 26 6810:45-11:00 AM 132 68 20011:00-11:15 AM 133 153 28611:15-11:30 AM 256 186 44211:30-11:45 AM 243 249 49211:45-12:00 AM 319 220 53912:00-12:15 PM 240 247 48712:15-12:30 PM 275 86 36112:30-12:45 PM 277 83 36012:45-1:00 PM 323 68 3911:00-1:15 PM 284 101 3851:15-1:30 PM 297 159 4561:30-1:45 PM 302 188 4901:45-2:00 PM 417 109 5262:00-2:15 PM 410 163 5732:15-2:30 PM 426 203 6292:30-2:45 PM 371 153 5242:45-3:00 PM 373 194 567
3:00-3:15 PM 403 168 5713:15-3:30 PM 297 199 4963:30-3:45 PM 241 156 3973:45-4:00 PM 246 170 416 1,880
4:00-4:15 PM 239 156 3954:15-4:30 PM 211 159 3704:30-4:45 PM 103 123 2264:45-5:00 PM 107 105 2125:00-5:15 PM 61 73 1345:15-5:30 PM 49 56 1055:30-5:45 PM 44 33 775:45-6:00 PM 37 12 49
Total 7,158 4,066 11,224
* Indicates location as shown on Figure 15
S. Columbia AvenuePark Entrance 1*
TotalEntrancesPark Entrance 2*
Beach Street
Design Hourly
Total
Table A-1. Shad Fest Park Entrance Person Counts (walk)
Source: DVRPC April 2010
40 I-95 Expressway Interchanges Sections GIR/VINE and AFC Traffic Study - Supplement Number 3
Time Delaware Ave N Crosswalk Delaware Ave S CrosswalkPeriod EB WB EB WB
10:30-10:45 AM 7 0 3 310:45-11:00 AM 13 1 16 611:00-11:15 AM 29 3 22 211:15-11:30 AM 25 8 49 1111:30-11:45 AM 48 8 39 111:45-12:00 AM 57 12 48 812:00-12:15 PM 54 62 48 1012:15-12:30 PM 50 8 52 1412:30-12:45 PM 99 20 63 4112:45-1:00 PM 87 18 59 441:00-1:15 PM 73 36 60 291:15-1:30 PM 81 37 63 711:30-1:45 PM 61 48 97 441:45-2:00 PM 109 39 112 882:00-2:15 PM 115 46 86 962:15-2:30 PM 69 89 119 852:30-2:45 PM 80 87 103 1112:45-3:00 PM 74 81 107 953:00-3:15 PM 99 91 139 132 Design 3:15-3:30 PM 79 66 122 147 Hourly 3:30-3:45 PM 46 111 67 103 Total3:45-4:00 PM 62 118 70 120 502
4:00-4:15 PM 14 93 86 1314:15-4:30 PM 54 70 58 764:30-4:45 PM 54 94 29 1504:45-5:00 PM 34 68 30 1075:00-5:15 PM 11 133 23 1155:15-5:30 PM 20 85 24 1245:30-5:45 PM 5 48 3 745:45-6:00 PM 0 47 6 31
Total 1,609 1,627 1,803 2,069
* Indicates location as shown on Figure 16
Crosswalk Number 1* Crosswalk Number 5*Table A-2. Pedestrian Crosswalk Volumes for Crosswalks Numbers 1 and 5
Source: DVRPC April 2010
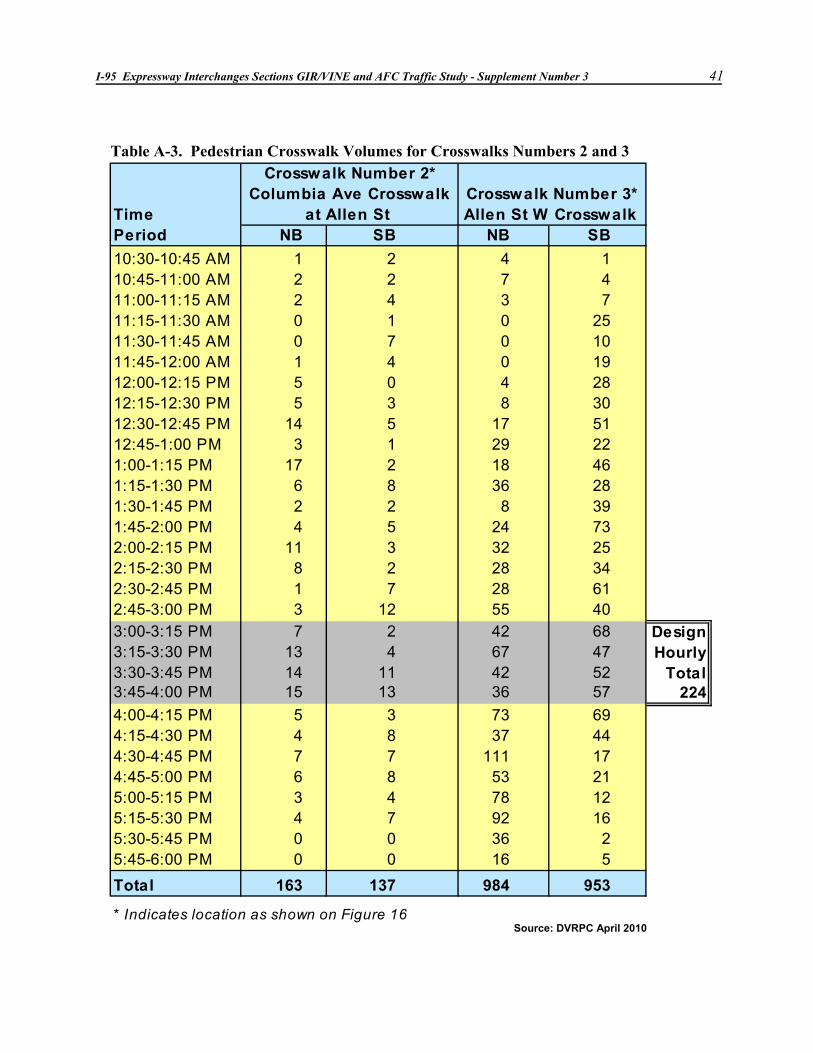
I-95 Expressway Interchanges Sections GIR/VINE and AFC Traffic Study - Supplement Number 3 41
TimePeriod NB SB NB SB
10:30-10:45 AM 1 2 4 110:45-11:00 AM 2 2 7 411:00-11:15 AM 2 4 3 711:15-11:30 AM 0 1 0 2511:30-11:45 AM 0 7 0 1011:45-12:00 AM 1 4 0 1912:00-12:15 PM 5 0 4 2812:15-12:30 PM 5 3 8 3012:30-12:45 PM 14 5 17 5112:45-1:00 PM 3 1 29 221:00-1:15 PM 17 2 18 461:15-1:30 PM 6 8 36 281:30-1:45 PM 2 2 8 391:45-2:00 PM 4 5 24 732:00-2:15 PM 11 3 32 252:15-2:30 PM 8 2 28 342:30-2:45 PM 1 7 28 612:45-3:00 PM 3 12 55 403:00-3:15 PM 7 2 42 68 Design 3:15-3:30 PM 13 4 67 47 Hourly 3:30-3:45 PM 14 11 42 52 Total3:45-4:00 PM 15 13 36 57 224
4:00-4:15 PM 5 3 73 694:15-4:30 PM 4 8 37 444:30-4:45 PM 7 7 111 174:45-5:00 PM 6 8 53 215:00-5:15 PM 3 4 78 125:15-5:30 PM 4 7 92 165:30-5:45 PM 0 0 36 25:45-6:00 PM 0 0 16 5
Total 163 137 984 953
* Indicates location as shown on Figure 16
Columbia Ave Crosswalk Crosswalk Number 3*Crosswalk Number 2*
at Allen St Allen St W Crosswalk
Table A-3. Pedestrian Crosswalk Volumes for Crosswalks Numbers 2 and 3
Source: DVRPC April 2010

42 I-95 Expressway Interchanges Sections GIR/VINE and AFC Traffic Study - Supplement Number 3
Table A-4. Pedestrian Crosswalk Volumes for Crosswalks Numbers 4 and 6
Columbia Ave Crosswalk Columbia Ave Crosswalk TimePeriod NB SB NB SB
10:30-10:45 AM 1 2 1 210:45-11:00 AM 0 5 2 311:00-11:15 AM 0 4 0 011:15-11:30 AM 5 4 2 211:30-11:45 AM 0 4 11 511:45-12:00 AM 4 3 1 512:00-12:15 PM 2 5 6 212:15-12:30 PM 5 1 2 012:30-12:45 PM 6 4 1 212:45-1:00 PM 12 2 2 51:00-1:15 PM 4 8 0 11:15-1:30 PM 21 4 5 111:30-1:45 PM 6 6 14 71:45-2:00 PM 8 7 0 82:00-2:15 PM 12 12 8 122:15-2:30 PM 11 11 13 182:30-2:45 PM 12 15 8 142:45-3:00 PM 27 10 8 13:00-3:15 PM 23 20 17 3 Design 3:15-3:30 PM 9 7 9 6 Hourly 3:30-3:45 PM 18 16 14 18 Total3:45-4:00 PM 46 8 14 6 33
4:00-4:15 PM 17 9 18 74:15-4:30 PM 17 13 17 84:30-4:45 PM 26 12 41 54:45-5:00 PM 20 5 22 35:00-5:15 PM 43 7 32 25:15-5:30 PM 9 6 20 65:30-5:45 PM 19 0 23 55:45-6:00 PM 7 1 17 5
Total 390 211 328 172
* Indicates location as shown on Figure 16
Crosswalk Number 4*
at Delaware Ave NB
Crosswalk Number 6*
Opposite Park Entrance
Source: DVRPC April 2010

I-95 Expressway Interchanges Sections GIR/VINE and AFC Traffic Study - Supplement Number 3 43
Table A-5. Pedestrian Crosswalk Volume Summaries
TimePeriod10:30-10:45 AM 9 11 7 2710:45-11:00 AM 14 33 14 6111:00-11:15 AM 10 58 8 7611:15-11:30 AM 14 99 19 13211:30-11:45 AM 27 97 9 13311:45-12:00 AM 18 124 20 16212:00-12:15 PM 20 130 76 22612:15-12:30 PM 16 132 30 17812:30-12:45 PM 32 213 78 32312:45-1:00 PM 25 168 91 2841:00-1:15 PM 32 179 83 2941:15-1:30 PM 55 172 144 3711:30-1:45 PM 37 197 100 3341:45-2:00 PM 32 294 151 4772:00-2:15 PM 58 226 174 4582:15-2:30 PM 63 222 202 4872:30-2:45 PM 57 244 226 5272:45-3:00 PM 61 221 231 5133:00-3:15 PM 72 306 265 643 Design 3:15-3:30 PM 48 248 280 576 Hourly 3:30-3:45 PM 91 165 256 512 Total3:45-4:00 PM 102 189 274 565 2,296
4:00-4:15 PM 59 169 297 5254:15-4:30 PM 67 156 183 4064:30-4:45 PM 98 100 355 5534:45-5:00 PM 64 85 228 3775:00-5:15 PM 91 46 326 4635:15-5:30 PM 52 60 301 4135:30-5:45 PM 47 10 158 2155:45-6:00 PM 30 11 94 135
Total 1,401 4,365 4,680 10,446
Inbound
Crosswalks
Outboundfrom Park
CrosswalksColumbia Ave
Crosswalksto Park
All CrosswalksTotal
Source: DVRPC April 2010

44 I-95 Expressway Interchanges Sections GIR/VINE and AFC Traffic Study - Supplement Number 3
Table A-6. Bicycle Lane Volumes
TimePeriod10:30-10:45 AM 0 1 110:45-11:00 AM 0 0 011:00-11:15 AM 2 1 311:15-11:30 AM 5 1 611:30-11:45 AM 0 1 111:45-12:00 AM 6 0 612:00-12:15 PM 2 4 612:15-12:30 PM 4 2 612:30-12:45 PM 0 2 212:45-1:00 PM 4 2 61:00-1:15 PM 3 1 41:15-1:30 PM 2 3 51:30-1:45 PM 0 3 31:45-2:00 PM 6 2 82:00-2:15 PM 7 3 102:15-2:30 PM 4 4 82:30-2:45 PM 7 3 102:45-3:00 PM 0 0 03:00-3:15 PM 12 4 16 Design 3:15-3:30 PM 2 1 3 Hourly 3:30-3:45 PM 1 2 3 Total3:45-4:00 PM 6 7 13 35
4:00-4:15 PM 6 3 94:15-4:30 PM 4 0 44:30-4:45 PM 3 1 44:45-5:00 PM 0 1 15:00-5:15 PM 5 1 65:15-5:30 PM 3 5 85:30-5:45 PM 1 1 25:45-6:00 PM 1 0 1
Total 96 59 155
* Indicates location as shown on Figure 17
Bicycle Lanes
Delaware AvenueNorthbound
Bicycle Count A*
Delaware AvenueSouthbound
Bicycle Count B*
Total
Source: DVRPC April 2010
I-95 Expressway Interchanges Sections GIR/VINE and AFC Traffic Study - Supplement Number 3 45
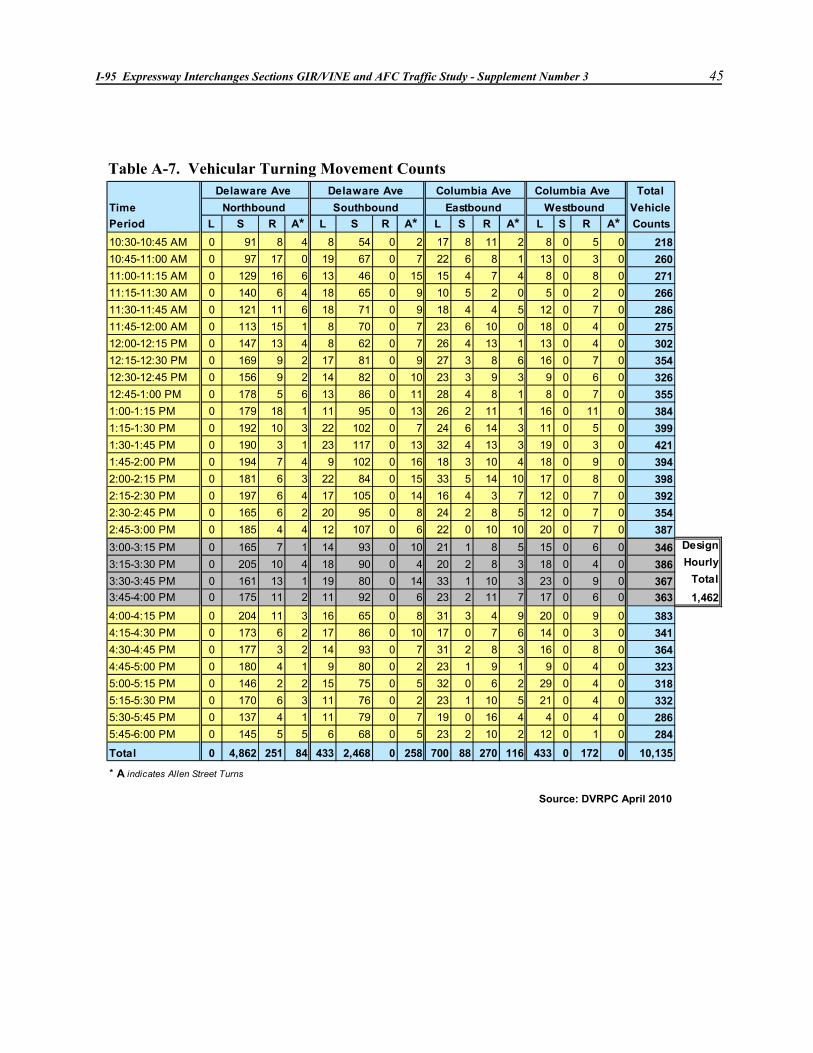
Table A-7. Vehicular Turning Movement Counts
Source: DVRPC April 2010
Total
Time Vehicle
Period L S R A* L S R A* L S R A* L S R A* Counts
10:30-10:45 AM 0 91 8 4 8 54 0 2 17 8 11 2 8 0 5 0 218
10:45-11:00 AM 0 97 17 0 19 67 0 7 22 6 8 1 13 0 3 0 260
11:00-11:15 AM 0 129 16 6 13 46 0 15 15 4 7 4 8 0 8 0 271
11:15-11:30 AM 0 140 6 4 18 65 0 9 10 5 2 0 5 0 2 0 266
11:30-11:45 AM 0 121 11 6 18 71 0 9 18 4 4 5 12 0 7 0 286
11:45-12:00 AM 0 113 15 1 8 70 0 7 23 6 10 0 18 0 4 0 275
12:00-12:15 PM 0 147 13 4 8 62 0 7 26 4 13 1 13 0 4 0 302
12:15-12:30 PM 0 169 9 2 17 81 0 9 27 3 8 6 16 0 7 0 354
12:30-12:45 PM 0 156 9 2 14 82 0 10 23 3 9 3 9 0 6 0 326
12:45-1:00 PM 0 178 5 6 13 86 0 11 28 4 8 1 8 0 7 0 355
1:00-1:15 PM 0 179 18 1 11 95 0 13 26 2 11 1 16 0 11 0 384
1:15-1:30 PM 0 192 10 3 22 102 0 7 24 6 14 3 11 0 5 0 399
1:30-1:45 PM 0 190 3 1 23 117 0 13 32 4 13 3 19 0 3 0 421
1:45-2:00 PM 0 194 7 4 9 102 0 16 18 3 10 4 18 0 9 0 394
2:00-2:15 PM 0 181 6 3 22 84 0 15 33 5 14 10 17 0 8 0 398
2:15-2:30 PM 0 197 6 4 17 105 0 14 16 4 3 7 12 0 7 0 392
2:30-2:45 PM 0 165 6 2 20 95 0 8 24 2 8 5 12 0 7 0 354
2:45-3:00 PM 0 185 4 4 12 107 0 6 22 0 10 10 20 0 7 0 387
3:00-3:15 PM 0 165 7 1 14 93 0 10 21 1 8 5 15 0 6 0 346 Design
3:15-3:30 PM 0 205 10 4 18 90 0 4 20 2 8 3 18 0 4 0 386 Hourly
3:30-3:45 PM 0 161 13 1 19 80 0 14 33 1 10 3 23 0 9 0 367 Total
3:45-4:00 PM 0 175 11 2 11 92 0 6 23 2 11 7 17 0 6 0 363 1,462
4:00-4:15 PM 0 204 11 3 16 65 0 8 31 3 4 9 20 0 9 0 383
4:15-4:30 PM 0 173 6 2 17 86 0 10 17 0 7 6 14 0 3 0 341
4:30-4:45 PM 0 177 3 2 14 93 0 7 31 2 8 3 16 0 8 0 364
4:45-5:00 PM 0 180 4 1 9 80 0 2 23 1 9 1 9 0 4 0 323
5:00-5:15 PM 0 146 2 2 15 75 0 5 32 0 6 2 29 0 4 0 318
5:15-5:30 PM 0 170 6 3 11 76 0 2 23 1 10 5 21 0 4 0 332
5:30-5:45 PM 0 137 4 1 11 79 0 7 19 0 16 4 4 0 4 0 286
5:45-6:00 PM 0 145 5 5 6 68 0 5 23 2 10 2 12 0 1 0 284
Total 0 4,862 251 84 433 2,468 0 258 700 88 270 116 433 0 172 0 10,135
Delaware Ave Delaware Ave Columbia Ave Columbia Ave
* A indicates Allen Street Turns
Northbound Southbound Eastbound Westbound

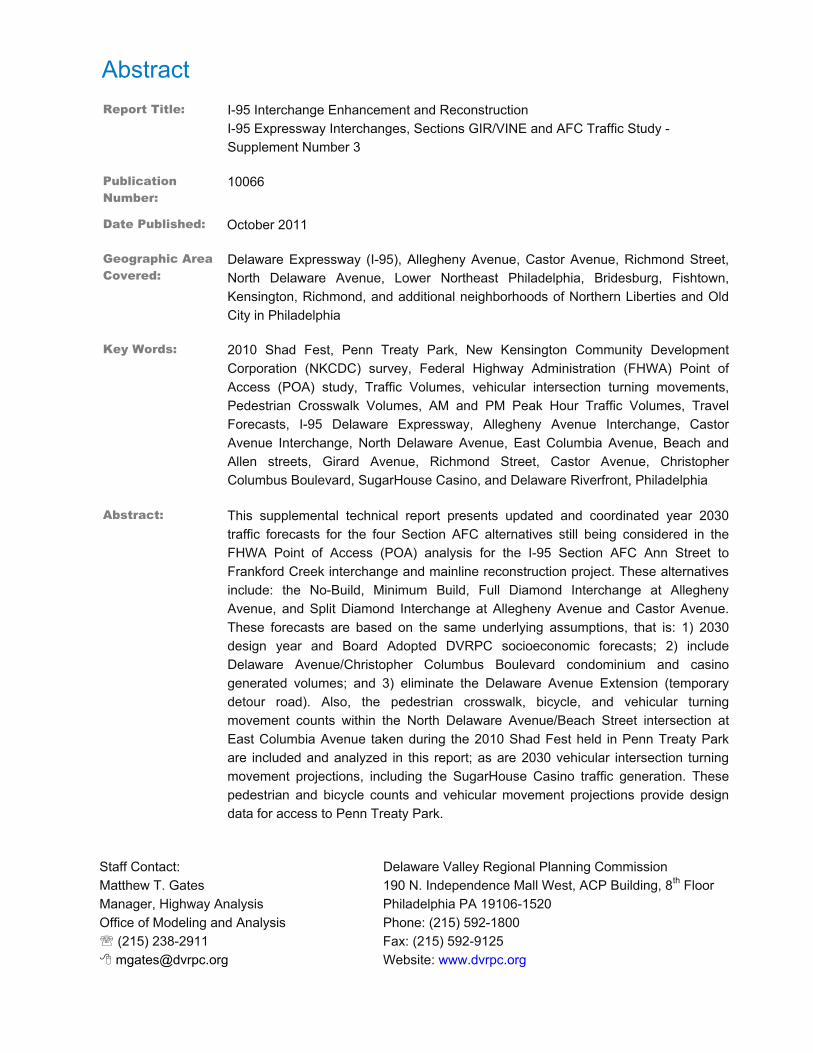
Abstract
Report Title: I-95 Interchange Enhancement and Reconstruction
I-95 Expressway Interchanges, Sections GIR/VINE and AFC Traffic Study -
Supplement Number 3
Publication Number:
10066
Date Published: October 2011
Geographic Area Covered:
Delaware Expressway (I-95), Allegheny Avenue, Castor Avenue, Richmond Street,
North Delaware Avenue, Lower Northeast Philadelphia, Bridesburg, Fishtown,
Kensington, Richmond, and additional neighborhoods of Northern Liberties and Old
City in Philadelphia
Key Words: 2010 Shad Fest, Penn Treaty Park, New Kensington Community Development
Corporation (NKCDC) survey, Federal Highway Administration (FHWA) Point of
Access (POA) study, Traffic Volumes, vehicular intersection turning movements,
Pedestrian Crosswalk Volumes, AM and PM Peak Hour Traffic Volumes, Travel
Forecasts, I-95 Delaware Expressway, Allegheny Avenue Interchange, Castor
Avenue Interchange, North Delaware Avenue, East Columbia Avenue, Beach and
Allen streets, Girard Avenue, Richmond Street, Castor Avenue, Christopher
Columbus Boulevard, SugarHouse Casino, and Delaware Riverfront, Philadelphia
Abstract: This supplemental technical report presents updated and coordinated year 2030
traffic forecasts for the four Section AFC alternatives still being considered in the
FHWA Point of Access (POA) analysis for the I-95 Section AFC Ann Street to
Frankford Creek interchange and mainline reconstruction project. These alternatives
include: the No-Build, Minimum Build, Full Diamond Interchange at Allegheny
Avenue, and Split Diamond Interchange at Allegheny Avenue and Castor Avenue.
These forecasts are based on the same underlying assumptions, that is: 1) 2030
design year and Board Adopted DVRPC socioeconomic forecasts; 2) include
Delaware Avenue/Christopher Columbus Boulevard condominium and casino
generated volumes; and 3) eliminate the Delaware Avenue Extension (temporary
detour road). Also, the pedestrian crosswalk, bicycle, and vehicular turning
movement counts within the North Delaware Avenue/Beach Street intersection at
East Columbia Avenue taken during the 2010 Shad Fest held in Penn Treaty Park
are included and analyzed in this report; as are 2030 vehicular intersection turning
movement projections, including the SugarHouse Casino traffic generation. These
pedestrian and bicycle counts and vehicular movement projections provide design
data for access to Penn Treaty Park.
Staff Contact: Delaware Valley Regional Planning Commission
Matthew T. Gates 190 N. Independence Mall West, ACP Building, 8th Floor
Manager, Highway Analysis Philadelphia PA 19106-1520
Office of Modeling and Analysis Phone: (215) 592-1800
(215) 238-2911 Fax: (215) 592-9125
[email protected] Website: www.dvrpc.org
