i-405 express toll lanes three month update...i-405 express toll lanes three month update 3 i....
TRANSCRIPT

I-405 Express Toll Lanes Three Month Update
1 Million+ trips inexpress toll lanes each month since Sept. 2015
600,000+unique users
chose to use the express toll lanes for a faster trip
Carpools with Flex Pass24% weekdays
45% weekendsexperiencing faster commutes
92% drivers pay $4 or less
75% drivers pay minimum rateof 75¢
170,000Flex Passes distributedsince March 2015 launch
7
14minutes southboundtravel time savings in the regular lanes
minutes average time savings for drivers in express toll lanes
Months 1-3 (Sept. 27, 2015 - Dec. 26, 2015)The Washington State Department of Transportation launched 17 miles of express toll lanes on Interstate 405 between Bellevue and Lynnwood on Sept. 27, 2015. This update includes data and observations from the first three months of operations. In addition to this three-month update, WSDOT will provide a six-month update in spring 2016 and a one-year report in fall 2016. Data that requires a longer timeframe to monitor such as revenue, transit, and how the number of people moving through the corridor has changed, will be provided in future reports as they become available.
Background: Traffic volumes are steadily increasing throughout the Puget Sound region. Between 2012 and 2014, the average weekday delay increased 46 percent. In 2011, the state Legislature authorized express toll lanes on I-405 between NE 6th Street in Bellevue and I-5 in Lynnwood to provide a more reliable trip for transit, vanpools and carpools; to provide a choice for non-carpool drivers to pay a toll for a faster trip when they need it; and to create a sustainable solution for congestion relief.
Express toll lanes are a big change for commuters in the region. Based on the experience of other tolled facilities in the country, WSDOT anticipated it could take up to a year for drivers to adjust and traffic to stabilize.
While the early results are promising, there have also been challenges:
• Traffic on northbound I-405 after SR 522 is more congested than it was before in both the regular lanes and express toll lanes due to limited capacity. Travel times are four minutes slower during the peak evening commute for general purpose lane drivers. While recent improvements fixed a previous bottleneck in Kirkland, additional capacity is needed between SR 522 and I-5.
• Weekend traffic volumes in the express toll lanes have not yet reached previous HOV volumes. Weekend speeds in the regular lanes are slower than last year. This could be the result of a variety of factors, including drivers with less familiarity with the express toll lanes.
• WSDOT is listening to feedback from drivers and is implementing a series of operational improvements. See section XI.
Three-month performance summary: In the first three months of operations, the I-405 express toll lanes are providing a faster, more reliable trip for users. Those in the regular lanes are seeing travel times improve or remain the same for the full 17 mile trip. However, those traveling shorter distances may experience shifts in congestion, resulting in longer travel times.
Demand for the express toll lanes is high, with drivers taking over 1 million trips each month, representing over 600,000 unique vehicles in total. Drivers choosing to use the express toll lanes are saving an average of 14 minutes on each trip.
Carpoolers are experiencing faster commutes during peak hours. More drivers are using a Flex Pass to travel as a toll-free carpool since opening, and this trend is expected to continue as drivers become more familiar with the system. People who use transit, vanpools and carpools received an immediate benefit of a reliable trip, especially during peak periods. Transit ridership increased, and benefited from reduced travel times.
SEPT. 27, 2015 – DEC. 26, 2105

2
Washington State Department of Transportation
Where are the express toll lanes?The newly implemented 17 miles of I-405 express toll lanes are between Northeast 6th Street in Bellevue and I-5 in Lynnwood. There are two express toll lanes in each direction between Bellevue and Bothell (dual-lane section) and one express toll lane in each direction between Bothell and I-5 in Lynnwood (single-lane section).
Why express toll lanes?Prior to express toll lanes, commuters on I-405 experienced some of the worst traffic in the state—up to seven hours of congestion each day. The HOV lanes were often as congested as the regular lanes during peak periods. Today, commuters make 450,000 daily trips between Bellevue and Lynnwood. In the next 25 years, it is projected that over one million people will move to the Puget Sound region. This projected growth is almost double the population of Portland. WSDOT continues to work on sustainable solutions to address congestion and provide reliability.
The I-405 express toll lanes are the result of more than a decade of planning and coordination between the state and local communities along the I-405 corridor. In 1999, WSDOT began work with the public, employers, cities, counties, and regional planning agencies to develop the I-405 Master Plan, a balanced, multimodal transportation plan for the Eastside, which identified more than 150 improvement projects to local streets, park and rides and transit improvements. The I-405 Master Plan gained regional consensus and was adopted by the I-405 Executive Advisory Group in 2002, which included representatives from cities along the corridor. The state Legislature funded a portion of the I-405 Master Plan through the Nickel and Transportation Partnership programs in 2003 and 2005. In 2011, the state Legislature authorized express toll lanes on this stretch of I-405, between Bellevue and Lynnwood.
1 express toll lane
2 express toll lanes99
99
5
405
90
520
522
Lynnwood
Shoreline
Seattle
Bellevue
Kirkland
SNOHOMISH
KING Bothell
How do express toll lanes work? Express toll lanes use dynamic pricing to manage volume and performance across all lanes. Non-carpools can pay a toll to enter the lane, and tolls automatically adjust to keep the express toll lanes moving. Drivers pay the rate they see upon entering the lanes. In March 2015, the Washington State Transportation Commission approved a minimum toll rate of 75 cents and a maximum of $10.
Transit, vanpools, motorcycles, and carpools with a Flex Pass in HOV mode and the correct number of passengers can use the express toll lanes toll-free. The Washington State Transportation Commission decided three passengers are required to travel toll-free during peak travel times on weekdays (5 to 9 a.m. and 3 to 7 p.m.) and two passengers at all other times including mid-day, evenings and weekends.

I-405 Express Toll Lanes Three Month Update
3
I. Performance expectations in the first three months
More than 30 express toll lane systems have been successfully implemented around the United States, and in each case, it has been shown that it can take up to a year for drivers to adjust and for traffic patterns to reach a new normal. This adjustment period is referred to as a ramp-up. The length of a ramp-up period will typically vary in relationship to both complexity of the express toll lane system and how familiar drivers are with similar toll facilities. WSDOT predicted a ramp-up period of up to one year after the launch of the I-405 express toll lanes.
Reporting periodThis three-month update for I-405 express toll lane operations addresses the trends observed from Sept. 27 through Dec. 26, 2015 (fall 2015). This will be compared to an equivalent baseline period of Sept. 28 through Dec. 27, 2014 (fall 2014). It’s important to keep in mind, the first three months of express toll lanes operations included irregular holiday traffic patterns in late November and December.
II. Legislative performance measures
While the initial results are promising, more time is needed to evaluate the performance of the express toll lanes. The Legislature authorized tolling on this stretch of I-405 in 2011 (RCW 47.56.880) and directed WSDOT to monitor and report on seven performance metrics on an annual basis. These performance metrics are listed below with the corresponding reference for this three-month update.
LEGISLATIVE MONITORING REQUIREMENT REPORT SECTION REFERENCE
a. Whether the express toll lanes maintain speeds of 45 miles per hour at least 90 percent of the time during peak periods
Not included.*
b. Whether the average traffic speed changed in the general purpose lanes
See Section V – includes average speed and travel time trends for the general purpose lanes.
c. Whether transit ridership changedSee Section IX – includes preliminary transit ridership and travel time findings.
d. Whether the actual use of the express toll lanes is consistent with the projected use
See Section IV – includes comparison of forecasted and reported express toll lane trips.
e. Whether the express toll lanes generated sufficient revenue to pay for all I-405 express toll lane operating costs
Not included.*
f. Whether travel times and volumes have increased or decreased on adjacent local streets and state highways and
See Section VI – includes overview of local agency coordination and arterial traffic monitoring.
g. Whether the actual gross revenues are consistent with projected gross revenues as identified in the fiscal note for Engrossed House Bill No. 1382 distributed by the office of financial management on March 15, 2011.
Not included.
*Requirements (a) and (e) above must be achieved within two years of operations, as directed by the Legislature.

4
Washington State Department of Transportation
III. Express toll lane trip trends
Transactions are categorized into three types of trips:
• HOV Exempt: Carpools traveling toll-free with a Flex Pass set to HOV mode.
• Photo Toll: Non-carpools can pay a toll by having a photo taken of their license plate. License plates can be registered to a Good To Go! account, called Pay By Plate, for an additional 25 cents per trip. Drivers without a Good To Go! account can also choose to receive a bill in the mail for an additional $2 per trip, called Pay By Mail.
• Good To Go! Pass: Non-carpools can pay a toll using any Good To Go! pass installed in their vehicle, which is the cheapest way to pay a toll.
On average, non-carpools paying a toll using a Good To Go! pass has been the most common trip, however, the number of carpools using the express toll lanes as HOV Exempt is steadily increasing. As more Flex Passes are distributed to drivers, the proportion of Photo Toll trips is decreasing.
In comparison with other cities that have implemented express toll lanes, the initial ramp-up on I-405 has been faster than anticipated with more drivers using the express toll lanes. A contributing factor is likely that WSDOT is one of the first agencies to offer a Pay By Mail option for express toll lanes. This means drivers have the option to use the lanes without a pre-paid Good To Go! account. It is likely that the Pay By Mail option has sped up ramp-up as it makes it easier for drivers to use the lanes. While a pre-paid pass is required to use express toll lanes on almost every other facility across the country, Pay By Mail on I-405 allows anyone to use the lanes.
Total Weekly Trips by Type
0
50,000
100,000
150,000
200,000
250,000
300,000
350,000
Trip Transactions Photo Toll Good To Go! Pass HOV Exempt
* Holiday weeks with decreased traf�c
Week 1 2 3 4 5 6 7 8 9 10 11 12 13*

I-405 Express Toll Lanes Three Month Update
5
Average Weekend Trips by Type (Oct 3 to Dec 26)
Average Weekday Trips by Type (Sept 28 to Dec 26)
Express toll lanes trips by type – weekdays and weekendsThe charts below compare the split of express toll lane trip types relative to the average daily total, for both weekdays and weekends. Month by month, the proportion of Photo Toll trips has decreased, while carpools making HOV Exempt trips have increased.
On average during the first three months of operations, carpools making HOV Exempt trips made up about 24 percent of weekday express toll lane trips. The remaining trips could include vehicles with one or two people because during weekday peak periods, three people are required to travel toll-free as a carpool. WSDOT will conduct vehicle occupancy counts this summer to determine the actual numbers of occupants in vehicles. On weekends, HOV Exempt make up 45 percent of trips in the express toll lanes, when only two people are required to travel toll free.
Overall, Good To Go! pass-based trips (both HOV Exempt and Good To Go! pass combined) made up about 70 percent of weekday and 68 percent of weekend express toll lane trips. As of November, HOV Exempt trips have become the most common trip on the weekends.
0
10,000
20,000
30,000
40,000
50,000
60,000
Daily Trips
Sept Oct Nov Dec
Photo Toll Good To Go! Pass Total Trips HOV Exempt
0
10,000
20,000
30,000
40,000
50,000
60,000Daily Trips
Oct Nov Dec
Photo Toll Good To Go! Pass Total Trips HOV Exempt

6
Washington State Department of Transportation
Express toll lanes – hourly trip trendsThe majority of southbound trips occur during the morning peak period and northbound trips during the evening peak period.
On weekends, the express toll lanes carry less volume than weekdays. The majority of trips in both directions occur during midday.
Average Weekday Express Toll Lane Trips by Hour Sept 28 to Dec 25
Average Weekend Express Toll Lane Trips by Hour Sept 28 to Dec 25
IV. Forecast versus actual use
Traffic volumes in the I-405 express toll lanes exceeded the three-month forecast. Initial ramp-up occurred quicker than expected, with monthly total trips in the express toll lanes closer to the six-month forecast. Toll trips (with and without a Good To Go! pass) were much higher than expected, while toll-free carpool trips were lower than expected. Toll trips may be higher than expected due to the fact that there is no pass requirement to use the express toll lanes. Toll-free carpool trips may be lower than expected as drivers are still obtaining and installing Flex Passes in their vehicles.
0500
1,0001,5002,0002,5003,000
3,500
4,0004,500Hourly Trips Northbound Express Toll Lane Trips Southbound Express Toll Lane Trips
12AM PM
1 2 3 4 5 6 7 8 9 10 11 12 1 2 3 4 5 6 7 8 9 10 11
0
500
1,000
1,500
2,000
2,500 Hourly Trips Northbound Express Toll Lane Trips Southbound Express Toll Lane Trips
12AM PM
1 2 3 4 5 6 7 8 9 10 11 12 1 2 3 4 5 6 7 8 9 10 11

I-405 Express Toll Lanes Three Month Update
7
V. Bellevue to Lynnwood corridor traffic volume, speed and travel times
Before the I-405 express toll lanes launched, the 2+ HOV lanes were failing approximately 200 days each year. The goal of the express toll lanes is to keep traffic flowing at a speed of at least 45 miles per hour 90 percent of the time during peak periods, giving drivers an option for a reliable trip when they need it most.
For this three-month update, volume, speed, and travel time data were analyzed and compared to fall 2014. (Note: No adjustments for holidays or irregular traffic events have been made for the purposes of these comparisons.)
The Bellevue to Lynnwood project added capacity with a second express toll lane south of SR 522 and made improvements at the SR 522 and I-405 interchange. This corrected a previous bottleneck, allowing drivers to travel faster northbound near Kirkland, but shifted the bottleneck north to the section where five lanes now reduce to three lanes between SR 522 and I-5.
Weekday and weekend volumesWSDOT is monitoring traffic volumes along the I-405 corridor from Bellevue to Lynnwood. Engineers use equipment in the roadway to collect traffic counts on I-405 and at on and off ramps.
Volumes are reported at eight sample locations, four in the northbound direction, four in the southbound direction.
WSDOT observed the following trends for weekday peak period traffic volumes, comparing fall 2015 to fall 2014.
• In most areas more vehicles are moving through the corridor, during peak periods. Express toll lanes are moving more vehicles, and while corresponding general purpose lane volumes are similar or slightly lower in several locations, overall there is increase in volumes in most locations. Lower general purpose lane volumes are likely explained by more vehicles in those areas choosing to use the express toll lanes.
• More vehicles are using the express toll lanes than the previous HOV lane. The increase in express toll lane volumes is most pronounced between Bellevue and Bothell, where capacity was added with a dual express toll lane, replacing a single HOV lane.
• The exception is northbound I-405, between SR 522 and I-5, where traffic volumes decreased due to limited capacity. Traffic on northbound I-405 after SR 522 is more congested than it was before. While WSDOT added capacity with a second express toll lane south of SR 522, additional capacity is needed between SR 522 and I-5, where five lanes funnel into three lanes.
While peak period volumes were used as the standard for volume analysis, the most congested peak hour was also analyzed. The highest percentage of combined volume increase occurred during the peak hour. For example, near NE 53rd St, during the peak hour in the northbound direction combined volume increased 22 percent.

8
Washington State Department of Transportation
The graphic below illustrates the peak period, peak direction trends for the eight sample volume locations.
I-405 Peak Period Traffic Volumes at Sample Locations – Fall 2014 vs Fall 2015
Weekend traffic volumes in the express toll lanes have increased in the first three months, but have still not returned to the HOV lane volumes of fall 2014.
NE 160th St
Lynnwood
BothellWoodinville
Kirkland
Bellevue
NE 195th St
NE 116th St
NE 124th St
NE 128th St
NE 85th St
NE 70th Pl
TOLL BRIDGE
NE 8th St
NE 6th St
NE 4th St
5
405
405
405 522
520
527
520
1 Express toll lane
2 Express toll lanes
Direct accesss ramps
Map not to scale
0
5,000
10,000
15,000
20,000
25,000 Volume
GP HOV/ ETL
Southbound – SR 527
0
5,000
10,000
15,000
20,000
25,000
GP HOV/ ETL
Volume Southbound – SR 522
0
5,000
10,000
15,000
20,000
25,000
GP HOV/ ETL
Volume Southbound – NE 100th St.
0
5,000
10,000
15,000
20,000
25,000
GP HOV/ ETL
Volume Southbound – NE 53rd St.
0
5,000
10,000
15,000
20,000
25,000
GP HOV/ ETL
Volume Northbound – SR 527
0
5,000
10,000
15,000
20,000
25,000
GP HOV/ ETL
Volume Northbound – SR 522
!!
0
5,000
10,000
15,000
20,000
25,000
GP HOV/ ETL
Volume Northbound – NE 100th St.
))
0
5,000
10,000
15,000
20,000
25,000
GP HOV/ ETL
Volume Northbound – NE 53rd St.
))))
SouthboundMorning Peak (5-9am)
NorthboundEvening Peak (3-7pm)
ãCOMBINEDVOLUME 9%
ãCOMBINEDVOLUME 16%
ãCOMBINEDVOLUME 5%
ãCOMBINEDVOLUME 6%
ãCOMBINEDVOLUME 2%
ãCOMBINEDVOLUME 3%
ãCOMBINEDVOLUME 4%
ãCOMBINEDVOLUME 11%

I-405 Express Toll Lanes Three Month Update
9
Corridor travel times and average speedsIn most areas, I-405 is moving more vehicles at faster speeds during peak periods. Overall, the express toll lanes continue to provide travel time savings relative to the general purpose lanes. Benefits in peak period, peak direction travel time and average speed have been observed for both the general purpose lanes and express toll lanes particularly between Bellevue and Bothell. In the single-lane section, speeds have decreased in both the general purpose and express toll lanes northbound during the evening peak. This is related to the lack of additional capacity between SR 522 and I-5 where five lanes now reduce to three lanes.
Corresponding with the improvements in travel times, weekday average peak period speeds in the peak directions have also improved for the general purpose and express toll lanes compared to fall 2014 for the full corridor trip. The table below compares peak period full corridor average speeds from fall 2014 to fall 2015.
Peak Period Average Speeds
Southbound Morning Peak
Northbound Evening Peak
Fall 2014 Fall 2015 Change Fall 2014 Fall 2015 Change
General Purpose average speed (mph)
25 31 £25% 27 28 £3%
Express toll lanes average speed (mph)
45 54 £20% 38 54 £40%
The travel time charts that follow compare travel time by time of day between fall 2015 and fall 2014. Both the average and the 95th percentile travel times are shown. The 95th percentile travel time shows some of the worst travel times for the weekday commute period. The 95th percentile is often reported as a measure of reliability because it allows commuters to plan how much time will be required to make a trip and be on time 19 days a month on average and late one of 20 days. Ninety-five percent of travel times are shorter than this duration. This will vary further from the average when more variable traffic patterns occur.

10
Washington State Department of Transportation
15
20
25
30
35
40
45
50
55
60
65
70
75
80
Travel Time(minutes)
OCT-DEC 2014 (5%-95%) OCT-DEC 2014 (AVG) OCT-DEC 2015 (AVG) OCT-DEC 2015 (95%)
12 AM PM
10 11 1 2 3 4 5 6 7 8 9 12 10 11 1 2 3 4 5 6 7 8 9
15 20 25 30 35 40 45 50 55 60 65 70 75 80
Travel Time(minutes)
OCT-DEC 2014 (5%-95%) OCT-DEC 2014 (AVG) OCT-DEC 2015 (AVG) OCT-DEC 2015 (95%)
12 AM PM
10 11 1 2 3 4 5 6 7 8 9 12 10 11 1 2 3 4 5 6 7 8 9
Weekday travel times for southbound general purpose lanes and express toll lanesDuring the weekdays, both the southbound general purpose and express toll lanes experience faster travel times during the morning peak period compared to fall 2014. Drivers experienced an average travel time of 29 minutes in the general purpose lanes and 17 minutes in the express toll lanes, a travel time savings of 20 and 17 percent, respectively.
The 95th percentile travel time improved for the southbound lanes during the weekday morning peak period.
General Purpose LanesSOUTHBOUND Weekdays Full Corridor average
Express Toll LanesSOUTHBOUND Weekdays Full Corridor average
Morning commute is 3 minutes faster than 2014 (17% improvement)
Express toll lane trips saved 12 minutes over general purpose lane trips.
Morning commute is 7 minutes faster than 2014 (20% improvement)
I-405 Express Toll Lanes Three Month Update
11
5
10
15
20
25
30
35
40
45
50
55
Travel Time(minutes) OCT-DEC 2014 (5%-95%) OCT-DEC 2014 (AVG) OCT-DEC 2015 (AVG) OCT-DEC 2015 (95%)
12 AM PM
10 11 1 2 3 4 5 6 7 8 9 12 10 11 1 2 3 4 5 6 7 8 9
5
10
15
20
25
30
35
40
45
50
55
Travel Time(minutes) OCT-DEC 2014 (5%-95%) OCT-DEC 2014 (AVG) OCT-DEC 2015 (AVG) OCT-DEC 2015 (95%)
12 AM PM
10 11 1 2 3 4 5 6 7 8 9 12 10 11 1 2 3 4 5 6 7 8 9
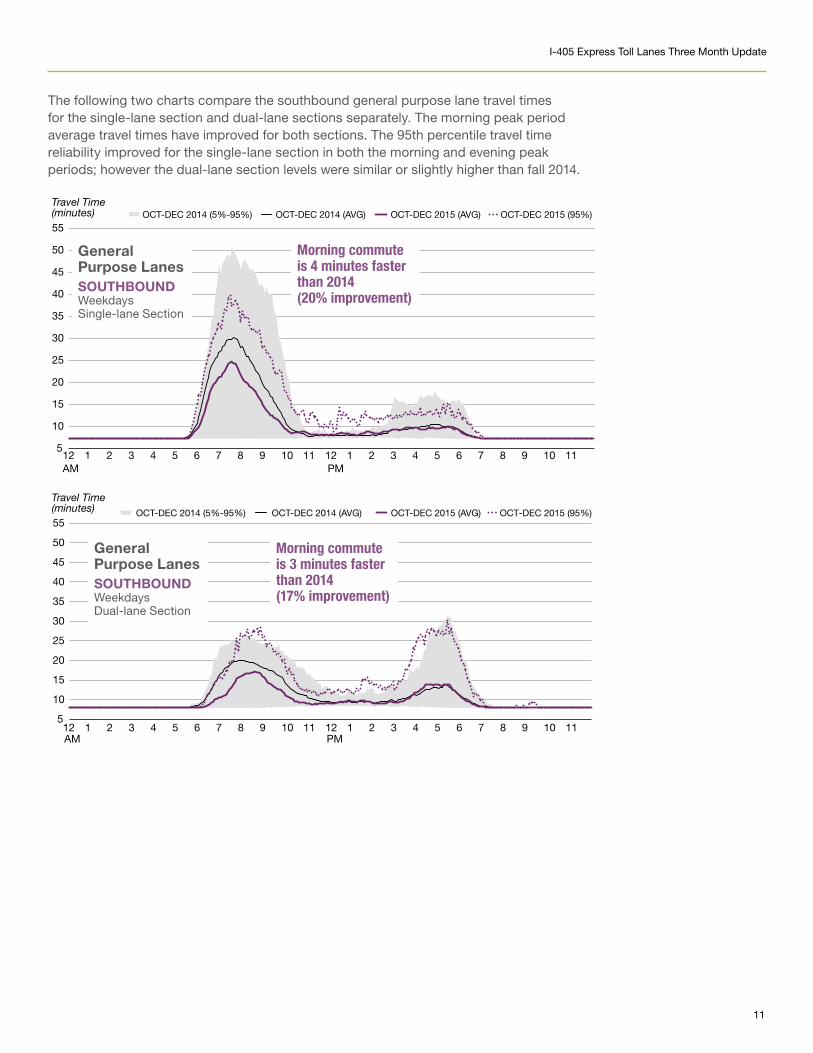
The following two charts compare the southbound general purpose lane travel times for the single-lane section and dual-lane sections separately. The morning peak period average travel times have improved for both sections. The 95th percentile travel time reliability improved for the single-lane section in both the morning and evening peak periods; however the dual-lane section levels were similar or slightly higher than fall 2014.
General Purpose LanesSOUTHBOUND Weekdays Single-lane Section
General Purpose LanesSOUTHBOUND Weekdays Dual-lane Section
Morning commute is 4 minutes faster than 2014 (20% improvement)
Morning commute is 3 minutes faster than 2014 (17% improvement)

12
Washington State Department of Transportation
15
20
25
30
35
40
45
50
55
60
65
70
75
80
Travel Time(minutes) OCT-DEC 2014 (5%-95%) OCT-DEC 2014 (AVG) OCT-DEC 2015 (AVG) OCT-DEC 2015 (95%)
12 AM PM
10 11 1 2 3 4 5 6 7 8 9 12 10 11 1 2 3 4 5 6 7 8 9
15
20
25
30
35
40
45
50
55
60
65
70
75
80
Travel Time(minutes) OCT-DEC 2014 (5%-95%) OCT-DEC 2014 (AVG) OCT-DEC 2015 (AVG) OCT-DEC 2015 (95%)
12 AM PM
10 11 1 2 3 4 5 6 7 8 9 12 10 11 1 2 3 4 5 6 7 8 9
Weekday travel times for northbound general purpose lanes and express toll lanesThe northbound general purpose lane travel times for the full corridor are generally the same, when compared with fall 2014. However, the express toll lanes experience faster travel times in the evening peak period. Drivers averaged 33 minute travel times in the general purpose lanes and 17 minutes in the express toll lanes, a travel time savings of 3 and 29 percent, respectively.
The 95th percentile travel time reliability did not significantly change for the northbound general purpose lanes, however the express toll lanes did see an improvement.
General Purpose LanesNORTHBOUND Weekdays Full Corridor average
Express Toll LanesNORTHBOUND Weekdays Full Corridor average
Evening commute is 1 minute faster than 2014 (3% improvement)
Evening commute is 7 minutes faster than 2014 (29% improvement)
Express toll lane trips saved 16 minutes over general purpose lane trips.
Construction lane closures

I-405 Express Toll Lanes Three Month Update
13
5
10
15
20
25
30
35
40
45
50
55
Travel Time(minutes) OCT-DEC 2014 (5%-95%) OCT-DEC 2014 (AVG) OCT-DEC 2015 (AVG) OCT-DEC 2015 (95%)
12 AM PM
10 11 1 2 3 4 5 6 7 8 9 12 10 11 1 2 3 4 5 6 7 8 9
5
10
15
20
25
30
35
40
45
50
55
Travel Time(minutes) OCT-DEC 2014 (5%-95%) OCT-DEC 2014 (AVG) OCT-DEC 2015 (AVG) OCT-DEC 2015 (95%)
12 AM PM
10 11 1 2 3 4 5 6 7 8 9 12 10 11 1 2 3 4 5 6 7 8 9
The following two charts compare the northbound general purpose travel times for the single-lane and dual-lane sections separately. During the weekdays, the northbound general purpose lane travel times have not significantly changed overall, however the travel times increased in the single-lane section and decreased in the dual-lane section. Speeds and travel times worsened in the single-lane section due to the limited capacity and the transition from five lanes of traffic into three lanes. Where capacity was added and improved in the dual-lane section, speeds have improved.
The 95th percentile travel time reliability improved for the dual-lane section, but worsened for the single-lane section compared to fall 2014.
General Purpose LanesNORTHBOUND Weekdays Single-lane Section
General Purpose LanesNORTHBOUND Weekdays Dual-lane Section
Evening commute is 4 minutes slower than 2014 (31% worse)
Evening commute is 5 minutes faster than 2014 (22% improvement)
Construction lane closures
14
Washington State Department of Transportation
15
20
25
30
35
40
45
50
55
60
65
70
75
80 Travel Time (minutes) OCT-DEC 2014 (AVG) OCT-DEC 2015 (AVG)
12 AM PM
10 11 1 2 3 4 5 6 7 8 9 12 10 11 1 2 3 4 5 6 7 8 9
15
20
25
30
35
40
45
50
55
60
65
70
75
80 Travel Time (minutes) OCT-DEC 2014 (AVG) OCT-DEC 2015 (AVG)
12 AM PM
10 11 1 2 3 4 5 6 7 8 9 12 10 11 1 2 3 4 5 6 7 8 9
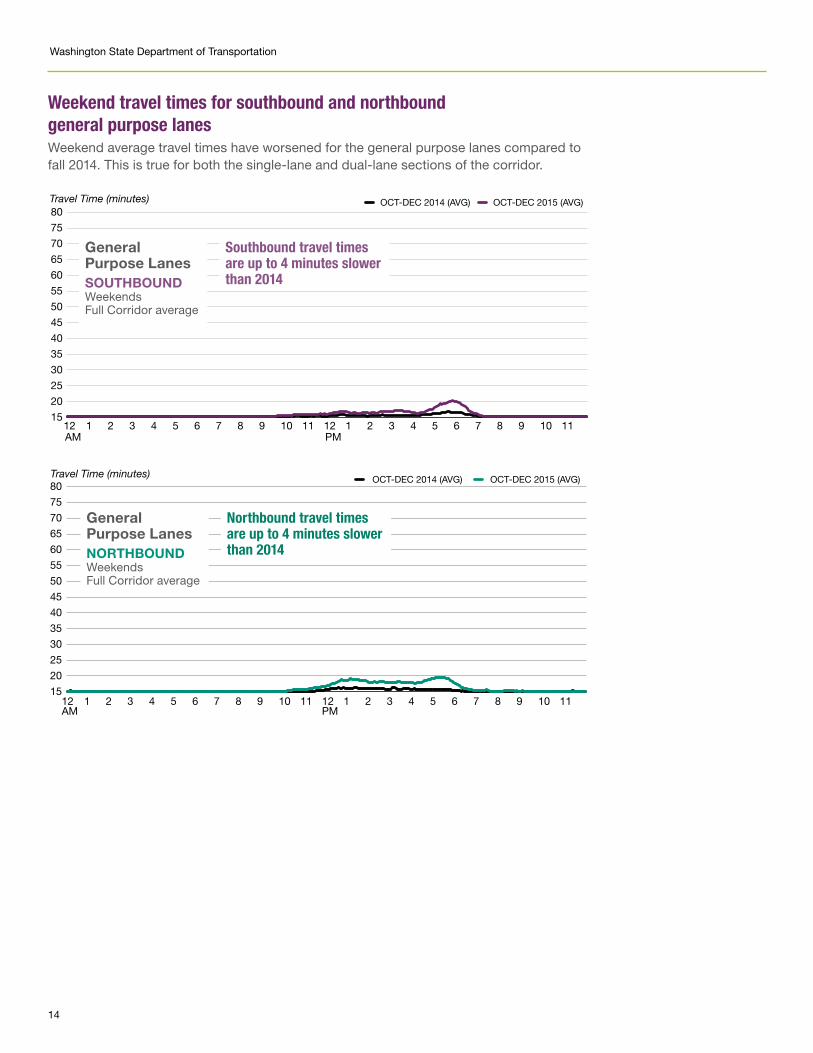
Weekend travel times for southbound and northbound general purpose lanesWeekend average travel times have worsened for the general purpose lanes compared to fall 2014. This is true for both the single-lane and dual-lane sections of the corridor.
General Purpose LanesSOUTHBOUND Weekends Full Corridor average
General Purpose LanesNORTHBOUND Weekends Full Corridor average
Southbound travel times are up to 4 minutes slower than 2014
Northbound travel times are up to 4 minutes slower than 2014

I-405 Express Toll Lanes Three Month Update
15
VI. Local arterial traffic
WSDOT has been working with local jurisdictions in the corridor to gather information about the effects of express toll lanes on local streets. Arterial travel times and volumes were collected along representative locations that are potential parallel routes for I-405 traffic, as annotated in the map to the right. This data was collected during August 2015 and will be collected again in August 2016 for comparison. Interim volumes were collected in November 2015 and showed very similar volumes compared to pre-tolling. The cities of Kenmore, Kirkland, Bellevue, and Redmond reported no noticeable changes to the local networks. North end congestion between SR 522 and I-5 may have secondary impacts around Bothell and Woodinville.
Additional interim volumes and travel times are planned for collection in February 2016.
VII. Toll rates
Toll rate algorithm overviewThe toll rates on the express toll lanes are calculated by an algorithm designed to keep the lanes moving at 45 miles per hour or faster, 90 percent of the time during peak periods. The toll rate algorithm takes real-time congestion and speed information and calculates a toll rate every 5 minutes. WSDOT is monitoring operations and will continue to tune the algorithm as necessary to improve operations.
405
405
5
202
522
9
524527
104
522
520
SNOHOMISH
KING
Woodinville
BothellKenmore
LakeForest Park
Lynnwood
KirklandRedmond
BellevueLake Washington Lake
Sammamish
116th Ave N
E
108th Ave N
E
84th Ave N
E
112th Ave NE
Bothell W
ay NEBallinger W
ay NE
Bot
hell
Way
NE
132nd A
ve NE
134th Ave N
E
Northup WayBel-Red Rd
NE 8th St
SE 8th St
NE 24th St
148th Ave N
E 156th Ave N
E
Willow
s Rd NE
140th Ave N
E
NE 85th St
NE 70th St
NE 80th St
NE 116th St
Slat
er A
ve
NE 116th St
NE 124th St NE 124th St
228th St SE
180th St SE
Maltby Rd
Simonds Rd N
E
100th Ave N
E
44th Ave W
35th Ave S
E
80th Ave N
E
61st
Ave
NE
Locust Way
124th Ave N
E124th A
ve NE
Market S
t
NE 128th St
Avo
ndal
e R
d N
E
NE Woodinville Duvall Rd
NE 132nd St
Redmond WayLake Washington B
lvd NE
West L
k Sam
ma
mis
h Pk
wy NE
San
d Po
int
Way
NE
Wa ynita W
ay NE
LegendWSDOT Collected Volume Count
WSDOT Collected Travel TimeSegment
Local Agency Collected VolumeCount
WSDOT
I-405 VicinityLocal Agency Travel Time and Volume StudiesI-405 vicinity local agency travel time and volume studies
16
Washington State Department of Transportation
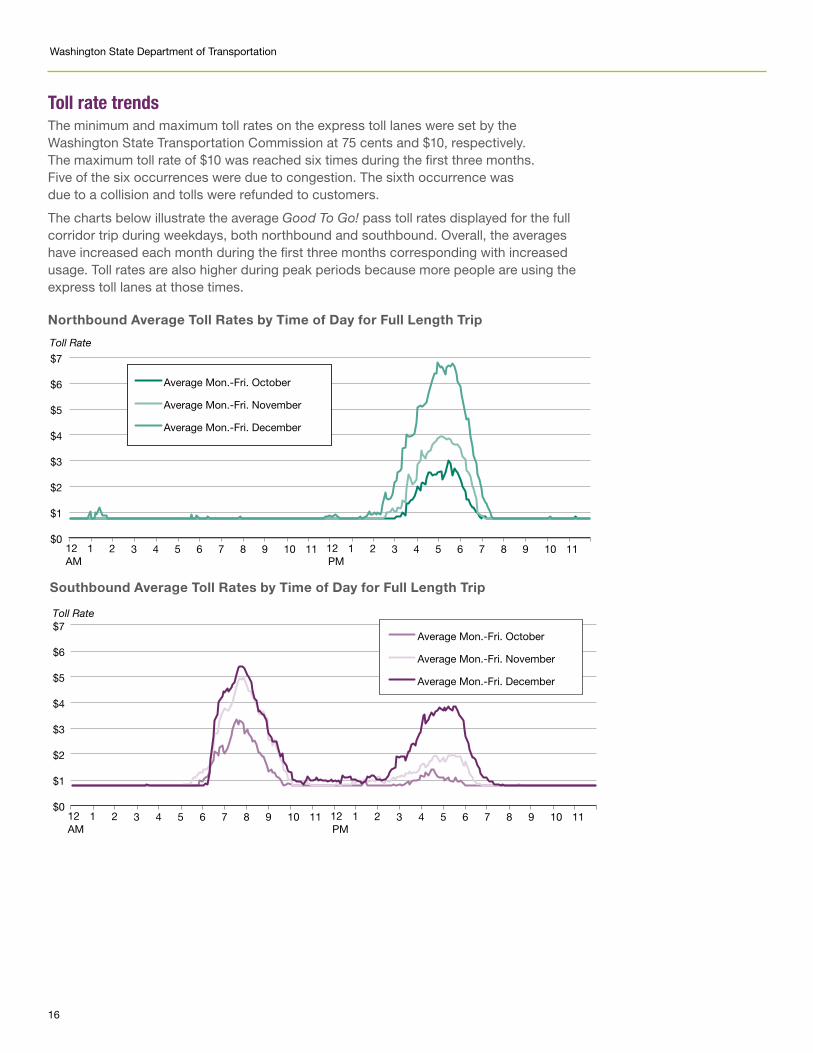
Toll rate trendsThe minimum and maximum toll rates on the express toll lanes were set by the Washington State Transportation Commission at 75 cents and $10, respectively. The maximum toll rate of $10 was reached six times during the first three months. Five of the six occurrences were due to congestion. The sixth occurrence was due to a collision and tolls were refunded to customers.
The charts below illustrate the average Good To Go! pass toll rates displayed for the full corridor trip during weekdays, both northbound and southbound. Overall, the averages have increased each month during the first three months corresponding with increased usage. Toll rates are also higher during peak periods because more people are using the express toll lanes at those times.
Southbound Average Toll Rates by Time of Day for Full Length Trip
Northbound Average Toll Rates by Time of Day for Full Length Trip
$0
$1
$2
$3
$4
$5
$6
$7
Average Mon.-Fri. October
Average Mon.-Fri. November
Average Mon.-Fri. December
Toll Rate
12 1 2 3 4 5 6 7 8 9 10 11 12 1 2 3 4 5 6 7 8 9 10 11AM PM
Toll Rate for NB I-405 Trip From NE 4th St To I-5
Toll Rate
$0
$1
$2
$3
$4
$5
$6
$7 Average Mon.-Fri. October
Average Mon.-Fri. November
Average Mon.-Fri. December
Toll Rate for SB I-405 Trip From Damson Rd To NE 6th St
12 1 2 3 4 5 6 7 8 9 10 11 12 1 2 3 4 5 6 7 8 9 10 11AM PM

I-405 Express Toll Lanes Three Month Update
17
While we’ve seen higher toll rates during times of heavy congestion, most drivers (92 percent) have paid $4 or less and three out of four paid 75 cents as seen in the graph below.
VIII. Customer service
The Good To Go! customer service center began preparation for I-405 express toll lane operations in March 2015 with the launch of Flex Pass sales. The information below includes 2015 statistics and shows the trends before and after express toll lanes opened.
Walk-in center customer activityWSDOT operates three customer service center locations in the Puget Sound region: Bellevue, Gig Harbor, and Seattle. The Bellevue walk-in center experienced a spike in customer activity when the express toll lanes opened, with record visits during September and October.
Percent of I-405 Toll Trips by Rate Category Sept. 27, 2015 through Dec. 24, 2015
Customers Served – 2015 Monthly Totals
75.8%
6.4% 5.6% 3.8% 4.4% 1.9% 1.4% 0.7%
0%
10%
20%
30%
40%
50%
60%
70%
80%
90%
100%
$0.75 Toll Rate $1-2 $2-3 $3-4 $4-5 $5-6 $6-8 $8-10
0
2,000
4,000
6,000
8,000
10,000
12,000
14,000
16,000
18,000
Customers
Customers Served
Bellevue Gig Harbor Seattle
Jan Feb Mar Apr May Jun Jul Aug Sep Oct Nov Dec

18
Washington State Department of Transportation
New accounts and passesIn the months leading up to the launch of express toll lanes, and through October, the number of customers opening new Good To Go! accounts was higher than average and has since begun to level off. The Flex Pass remains the most common Good To Go! pass sold since September. During the months of September, October and November, customers purchased a record number of Good To Go! passes.
Call center activityTotal calls to Good To Go! customer service increased in the months leading up to toll commencement on I-405 and the first month of operations. Since the peak in October, monthly totals dropped to levels similar to the summer. The average weekday call wait time for customers rose sharply with the ramp-up to toll commencement and remained near or above the 20 minute mark during the first three months of operations.
Active Accounts & Passes Sold – 2015 Monthly Totals
Call Center Statistics – 2015 Monthly Totals
0
20,000
40,000
60,000
80,000
100,000
120,000
140,000 Minutes Calls Total Calls Average Call Wait Time
0
5
10
15
20
25
30
35
Jan Feb Mar Apr May Jun Jul Aug Sep Oct Nov Dec
500,000
525,000
550,000
575,000
600,000
625,000
650,000
0
10,000
20,000
30,000
40,000
50,000
60,000 Accounts Passes
Flex Pass Free Flex Pass Sticker
License Plate Motorcycle Switchable
Active Accounts
Jan Feb Mar Apr May Jun Jul Aug Sep Oct Nov Dec

I-405 Express Toll Lanes Three Month Update
19
IX. Transit
In 2009, WSDOT started working with Sound Transit, King County Metro, and Community Transit on the details of the I-405 express toll lanes. In the first three months of express toll lane operations, each transit agency reported increased predictability, faster travel times, and increased ridership on routes operating on I-405.
Community-Transit-reported routes showed an increase in average daily ridership of approximately four percent when compared to fall 2014 levels until mid-November and then ridership started to drop off leading into the holiday season. Travel times for Community-Transit-operated routes showed an improvement for most routes, averaging up to six minute travel time savings overall for the October to November 2015 period compared to the equivalent months in 2014.
King County Metro reported an increase of approximately six percent in peak period ridership for the October to November 2015 period relative to fall 2014, based on a sample of trips. Travel times for King County Metro showed an improvement for most routes, averaging up to eight minute travel time savings between fall 2014 and fall 2015. King County Metro also made reliability improvements for many routes over the past year.
X. Enforcement
The Washington State Patrol (WSP) provides enforcement along the I-405 express toll lanes. During early operations, they assisted in educating drivers who may not have known the proper way to use the facility by passing out nearly 1,200 informational maps which explain how express toll lanes work, payment options, and access points. During the three-month reporting period, troopers made more than 4,800 traffic stops and issued more than 1,500 citations, including citations for crossing over the double white lines, incorrect HOV declaration, and swerving out of the lane to avoid paying the toll.
CollisionsExpress toll lanes have significantly changed in how I-405 operates. WSDOT is monitoring collision patterns for overall trends and input to operational adjustments for potential safety improvements.
Driver safety is WSDOT’s top priority. WSDOT is closely monitoring traffic to see how drivers are adjusting and will continue to partner with WSP in collision data collection.

20
Washington State Department of Transportation
XI: Operational Improvements
WSDOT is closely monitoring the operations of express toll lanes and listening to driver feedback. Based on this feedback, WSDOT made several adjustments in the first three months to striping and access to improve driver’s experience when using the express toll lanes.
Some drivers reported confusion with where the system starts and stops, so WSDOT added additional express toll lane stenciling to the pavement in two locations:
• Southbound I-405 at NE 160th Street – Added southbound pavement markings to address driver confusion where the second express toll lane begins.
• Northbound I-405 at NE 6th Street – Added northbound pavement markings to provide more notice.
After drivers suggested more room was needed to enter or exit the express toll lanes at several locations, WSDOT extended the access points to give drivers more room to merge:
• Northbound I-405 at NE 6th Street – Lengthened the access point to give drivers more time to enter the express toll lane.
• Southbound I-405 at SR 527 – Lengthened the access point to give drivers more time to enter and exit the express toll lanes.
In addition to these roadway changes, WSDOT also made adjustments to the algorithm which calculates toll rates based on traffic volumes and speeds after drivers reported slower express toll lane speeds during the morning commute on southbound I-405 near SR 527. WSDOT made changes to increase toll rates earlier to keep the express toll lanes moving during heavy congestion.
WSDOT will continue to monitor how drivers are adjusting to express toll lanes and make additional improvements.
XII. Next steps
Over the next few months, WSDOT will:
• Provide quarterly financial statements for the I-405 express toll lanes www.wsdot.wa.gov/Tolling/405/library.htm.
• Develop an I-405 express toll lanes six-month update.
• Continue to evaluate additional operational improvements such as striping changes and algorithm refinement.
• Repeat vehicle occupancy counts in summer 2016 to compare both occupancy observations with typical driver declarations and to measure the number of people moving through the corridor.
• Continue to work with local jurisdictions to gather information about the effects of express toll lanes on local streets.
• Coordinate with the Legislature during Legislative session to provide updates on I-405 operations and collaborate on improvements.

I-405 Express Toll Lanes Three Month Update
21
Title VI Notice to Public It is the Washington State Department of Transportation’s (WSDOT) policy to assure that no person shall, on the grounds of race, color, national origin or sex, as provided by Title VI of the Civil Rights Act of 1964, be excluded from participation in, be denied the benefits of, or be otherwise discriminated against under any of its federally funded programs and activities. Any person who believes his/her Title VI protection has been violated, may file a complaint with WSDOT’s Office of Equal Opportunity (OEO). For additional information regarding Title VI complaint procedures and/or information regarding our non-discrimination obligations, please contact OEO’s Title VI Coordinator at (360) 705-7082
Americans with Disabilities Act (ADA) Information This material can be made available in an alternate format by emailing the WSDOT Diversity/ADA Affairs team at [email protected] or by calling toll free, 855-362-4ADA(4232). Persons who are deaf or hard of hearing may make a request by calling the Washington State Relay at 711.
16-01-0056
FOR MORE INFORMATIONVisit GoodToGo405.org or contact us at [email protected]