hypertension in adults (update)
TRANSCRIPT

National Institute for Health and Care Excellence
Draft for consultation
Hypertension in adults: diagnosis and management B. Evidence review for monitoring
NICE guideline
Intervention evidence review
March 2019
Draft for Consultation
This evidence review was developed by the National Guideline Centre


Hypertension in adults: DRAFT FOR CONSULTATION Contents
Hypertension in adults: DRAFT FOR CONSULTATION
Disclaimer
The recommendations in this guideline represent the view of NICE, arrived at after careful consideration of the evidence available. When exercising their judgement, professionals are expected to take this guideline fully into account, alongside the individual needs, preferences and values of their patients or service users. The recommendations in this guideline are not mandatory and the guideline does not override the responsibility of healthcare professionals to make decisions appropriate to the circumstances of the individual patient, in consultation with the patient and, where appropriate, their carer or guardian.
Local commissioners and providers have a responsibility to enable the guideline to be applied when individual health professionals and their patients or service users wish to use it. They should do so in the context of local and national priorities for funding and developing services, and in light of their duties to have due regard to the need to eliminate unlawful discrimination, to advance equality of opportunity and to reduce health inequalities. Nothing in this guideline should be interpreted in a way that would be inconsistent with compliance with those duties.
NICE guidelines cover health and care in England. Decisions on how they apply in other UK countries are made by ministers in the Welsh Government, Scottish Government, and Northern Ireland Executive. All NICE guidance is subject to regular review and may be updated or withdrawn.
Copyright © National Institute for Health and Care Excellence, 2019

Hypertension in adults: DRAFT FOR CONSULTATION Contents
4
Contents 1 Monitoring blood pressure .......................................................................................... 6
1.1 Review question: In adults with treated primary hypertension, what is the best method of measuring blood pressure (home, ambulatory or clinic measurement) to assess the response to treatment and prevent cardiovascular events? .......................................................................................... 6
1.2 Introduction ........................................................................................................... 6
1.3 PICO table ............................................................................................................. 6
1.4 Methods and process ............................................................................................ 7
1.5 Clinical evidence ................................................................................................... 7
1.5.1 Included studies ......................................................................................... 7
1.5.2 Excluded studies ........................................................................................ 8
1.5.3 Summary of clinical studies included in the evidence review ...................... 9
1.5.4 Quality assessment of clinical studies included in the evidence review .... 17
1.6 Economic evidence ............................................................................................. 28
1.6.1 Included studies ....................................................................................... 28
1.6.2 Excluded studies ...................................................................................... 28
1.6.3 Summary of studies included in the economic evidence review ............... 29
1.6.4 Resource costs ........................................................................................ 30
1.7 Evidence statements ........................................................................................... 30
1.7.1 Clinical evidence statements .................................................................... 30
1.7.2 Health economic evidence statements ..................................................... 32
1.8 Recommendations .............................................................................................. 32
1.9 The committee’s discussion of the evidence ........................................................ 33
1.9.1 Interpreting the evidence .......................................................................... 33
1.9.2 Cost effectiveness and resource use ....................................................... 34
Appendices ........................................................................................................................ 49
Appendix A: Review protocols ................................................................................... 49
Appendix B: Literature search strategies ................................................................... 54
B.1 Clinical search literature search strategy ...................................................... 54
B.2 Health Economics literature search strategy ................................................. 60
Appendix C: Clinical evidence selection ..................................................................... 63
Appendix D: Clinical evidence tables ......................................................................... 64
Appendix E: Forest plots ............................................................................................ 87
Appendix F: GRADE tables ....................................................................................... 97
Appendix G: Health economic evidence selection .................................................... 108
Appendix H: Health economic evidence tables ........................................................ 109
Appendix I: Excluded studies.................................................................................. 112
I.1 Excluded clinical studies ............................................................................. 112
I.2 Excluded health economic studies .............................................................. 115

Hypertension in adults: DRAFT FOR CONSULTATION Contents
5
Appendix J: Research recommendations ................................................................ 116

Hypertension in adults: DRAFT FOR CONSULTATION Monitoring blood pressure
© National Institute for Health and Care Excellence, 2019 6
1 Monitoring blood pressure 1
1.1 Review question: In adults with treated primary 2
hypertension, what is the best method of measuring blood 3
pressure (home, ambulatory or clinic measurement) to 4
assess the response to treatment and prevent 5
cardiovascular events? 6
1.2 Introduction 7
Once an individual has been diagnosed with hypertension, the person will be started on a 8 treatment programme (both pharmacological and non-pharmacological) to lower blood 9 pressure (BP). Individuals respond differently to different treatments and often combinations 10 of multiple treatments are required to achieve the target blood pressure. It is therefore 11 necessary to assess an individual’s response to treatment to identify those who might need 12 additional or alternative treatment strategies. 13
Current practice for monitoring response is variable and involves a combination of home, 14 ambulatory and clinic blood pressure measurements. Clinic blood pressure measurements 15 are often higher than those observed with ambulatory or home measurements and are not 16 necessarily a true representation of an individual’s day-to-day blood pressure. Ambulatory or 17 home measurements may therefore provide a more accurate estimation of response to 18 treatment and consequent reduction in cardiovascular events. 19
1.3 PICO table 20
For full details, see the review protocol in appendix A. 21
Table 1: PICO characteristics of review question 22
Population Adults (over 18 years) with treated primary hypertension
Interventions Different methods of measuring blood pressure followed by appropriate treatment* based on the blood pressure measurement (test plus treatment):
• Home measurement (HBPM) without telemonitoring
• Home measurement with telemonitoring
• Ambulatory measurement (ABPM)
• Clinic/office measurement (CBPM)
• Pharmacy measurement
Comparisons Compared against each other
Outcomes All outcomes to be measured at a minimum of 12 months. Where multiple time points are reported within each study, the longest time point only will be extracted.
Critical
• All-cause mortality
• Health-related quality of life
• Stroke (ischaemic or haemorrhagic)
• Myocardial infarction
Important
• Reduction in clinic BP

Hypertension in adults: DRAFT FOR CONSULTATION Monitoring blood pressure
© National Institute for Health and Care Excellence, 2019 7
• Proportion of people controlled to a target
• Average daily dose of antihypertensive medication
• Average number of visits
• Side effect 1: Intolerance to device
• Side effect 2: Hypotension (dizziness)
• [Combined cardiovascular disease outcomes in the absence of MI and stroke data]
• [Coronary heart disease outcome in the absence of MI data]
Study design Randomised control trials (RCT) and systematic reviews (SR)
Non-randomised studies in the absence of RCT and SR evidence
1.4 Methods and process 1
This evidence review was developed using the methods and process described in 2 Developing NICE guidelines: the manual.31 Methods specific to this review question are 3 described in the review protocol in appendix A. 4
Declarations of interest were recorded according to NICE’s 2018 conflicts of interest policy. 5
1.5 Clinical evidence 6
1.5.1 Included studies 7
Eight studies were included in the review46, 69, 80, 81, 117, 126, 130, 131; these are summarised in 8 Table 2 below. Evidence from these studies is summarised in the clinical evidence summary 9 below (Table 3). 10
There were 8 comparisons extracted from the included studies: 11
• Home monitoring without telemonitoring compared to clinic monitoring (n=2), 12
• Home monitoring with telemonitoring compared to clinical monitoring (n=3), 13
• Home monitoring with telemonitoring and pharmacist care compared to clinical monitoring 14 (n=1) 15
• Home monitoring without telemonitoring compared to ambulatory/clinic monitoring (n=1) 16
• Home monitoring without telemonitoring compared to home monitoring with telemonitoring 17 (n=2) 18
• Home monitoring with telemonitoring compared to home monitoring with telemonitoring 19 and pharmacist care (n=1) 20
• Pharmacy monitoring compared to clinical monitoring (n=2) 21
• Home monitoring (with self-titration) and telemonitoring compared to clinic monitoring 22 (n=1). 23
An individual patient data (IPD) meta-analysis was included Tucker 2017130 and all the 24 remaining included studies were open-label RCTs. As an IPD is the highest quality design, 25 any trials prior and up to the date it was published were only included if they had any 26 additional outcomes that were not found in the IPD. The IPD reported outcomes for reduction 27 in clinic blood pressure and proportion controlled to a target. Any studies published after 28 2017 were included if they met the protocol for this review and all relevant outcomes were 29 extracted. 30
See also the study selection flow chart in appendix C, study evidence tables in appendix D, 31 forest plots in appendix E and GRADE tables in appendix F. 32

Hypertension in adults: DRAFT FOR CONSULTATION Monitoring blood pressure
© National Institute for Health and Care Excellence, 2019 8
1.5.2 Excluded studies 1
The guideline committee identified 3 systematic reviews as key papers during the 2 development of this evidence review protocol.130, 132, 95 3
Omboni 201395 could not be incorporated as it included trials which deviated from this review 4 protocol, that is, indirect populations without primary hypertension, populations not receiving 5 antihypertensive treatment and follow-up times of less than 12 months. All the trials included 6 in Omboni 201395 were individually assessed for relevance for inclusion in this evidence 7 review. 8
Uhlig 2013132 was also excluded as it consisted of trials comparing blood pressure monitoring 9 methods to usual care; the description of which was either not given or participants were told 10 not to have their blood pressure measured for the duration of the trials (in these trials, the 11 investigator measured all participants’ blood pressure at specified time-points). Also, the 12 treatments given within trials were not standardised for all the participants. 13
See the excluded studies list in appendix I. 14

Mon
itorin
g b
lood p
ressure
Hyp
erte
nsio
n in
adu
lts: D
RA
FT
FO
R C
ON
SU
LT
AT
ION
© N
atio
nal In
stitu
te fo
r He
alth
an
d C
are
Exce
llence
, 201
9
9
1.5.3 Summary of clinical studies included in the evidence review 1
Table 2: Summary of studies included in the evidence review 2
Study Intervention and comparison
Details Population Outcomes Comments
Green 200846
Home monitoring with telemonitoring, n=259
versus Home monitoring with telemonitoring with pharmacist care in addition to physician contact, n=261
versus Usual Care, n=258
HBPM with telemonitoring: OmronHem-705 device used. Blood pressure measured for at least 2 days per week with a minimum of 2 measurements at a time (duration not specified). HBPM target of 135/85mmHg, CBPM target of 140/90mmHg. Readings sent via email. Number of GP visits or communications not specified.
HBPM with telemonitoring and pharmacist care: Those assigned to home BP monitoring and Web training plus pharmacist care had the same strategy as home blood pressure monitoring with telemonitoring plus a pharmacist assisting them to improve their BP through telephone calls. HBPM target of 135/85mmHg, CBPM target of 140/90mmHg. The communication occurred every 2 weeks until BP was controlled. Number of GP visits not specified.
Usual care: Those assigned to usual care were told their BP was not in control and were encouraged to work with their physician to improve it. No further details given for number of GP visits and communication.
Adults without Type 2 diabetes (n=778)
Mean age =59.1 years (SD =8.5 years)
At 12 months:
• Mortality
• Non-fatal cardiovascular events
• Change in blood pressure
• Proportion controlled to a target
• Quality of life
Downgraded for intervention indirectness as it was comparing with usual care not clearly stating clinic measurement

Mon
itorin
g b
lood p
ressure
Hyp
erte
nsio
n in
adu
lts: D
RA
FT
FO
R C
ON
SU
LT
AT
ION
© N
atio
nal In
stitu
te fo
r He
alth
an
d C
are
Exce
llence
, 201
9
10
Study Intervention and comparison
Details Population Outcomes Comments
Logan 201269
Home monitoring with telemonitoring, n=55
versus
Home monitoring without telemonitoring, n=55
HBPM with telemonitoring: Validated Bluetooth-enabled home BP device used. Guideline target of <130/80mmHg. BP readings were automatically transmitted by a smartphone to application servers. Messages instructed people whose BP fell outside the target range to take additional BP readings, which were then used to provide advice on the urgency to make a follow-up visit with their physician. No further details given for number of measurements, GP visits or how often measurements were taken.
HBPM without telemonitoring: Subjects were issued with an identical appearing home BP device but without built-in Bluetooth capability for use during the study. No further details given for GP visits, communications or how often measurements were taken.
Adults with diabetes (n=110)
Mean age =62.9 years (SD=8.4 years)
At 12 months:
• Number of GP visits
Downgraded for population indirectness, as it did not specify type of diabetes present
McManus 201080
Home monitoring (with self-titration) and telemonitoring, n=263
versus Clinic monitoring, n=264
Home monitoring (HM) with telemonitoring: Participants were trained to monitor their own blood pressure for the first week of each month, with 2 self-measurements being made each morning with a 5-min interval and the second reading acted upon. A validated automated sphygmomanometer (Omron
705IT) was used to transmit blood pressure readings to the research team by means of an automated modem device, which was connected to the sphygmomanometer and plugged into a
Adults with diabetes (n=527)
Mean age =66.4 years (SD=8.8 years)
At 12 months:
• Quality of life
• Change in clinic blood pressure
Downgraded for population indirectness, as it did not specify type of diabetes
Participants receiving more than 2 antihypertensive drugs at baseline were excluded

Mon
itorin
g b
lood p
ressure
Hyp
erte
nsio
n in
adu
lts: D
RA
FT
FO
R C
ON
SU
LT
AT
ION
© N
atio
nal In
stitu
te fo
r He
alth
an
d C
are
Exce
llence
, 201
9
11
Study Intervention and comparison
Details Population Outcomes Comments
telephone socket. If participants had 2 consecutive months of readings above target, they were instructed to make medication changes in accordance with the titration schedule by requesting a new prescription without seeing their family doctor. Participants returned to their family doctor for a further titration schedule if blood pressure remained above target after 2 changes. Home targets were 130/85 mmHg for people without diabetes and 130/75 mmHg for participants with diabetes. Monthly summaries of each participant’s blood pressure readings were sent to their family doctor. Number of GP visits not stated.
Clinic monitoring: They were asked to attend a review by their family doctor. Number of GP visits not stated. No specific instructions were given to the clinicians about the content of this visit other than to review medication. Thereafter, care was at the discretion of the family doctor. No further details given for communications and targets were not specified.
McManus 201881
Home monitoring without telemonitoring, n=395
versus
Home monitoring with telemonitoring, n=393
versus
Clinic monitoring, n=394
HBPM without telemonitoring: Device used was a validated automated electronic sphygmomanometer (Omron M10-IT). Participants were asked to monitor their own blood pressure in their non-dominant arm, twice each morning and evening, for the first week of every
Adults with diabetes (n=1,182)
Mean age =66.93 years (SD=9.43 years)
At 12 months:
• Change in clinic blood pressure
• Cardiovascular events
Downgraded for population indirectness, as it did not specify type of diabetes present

Mon
itorin
g b
lood p
ressure
Hyp
erte
nsio
n in
adu
lts: D
RA
FT
FO
R C
ON
SU
LT
AT
ION
© N
atio
nal In
stitu
te fo
r He
alth
an
d C
are
Exce
llence
, 201
9
12
Study Intervention and comparison
Details Population Outcomes Comments
month using standard recommendations. At the end of each monitoring week, they were asked to record their readings on paper and send them for review to their practice in a reply-paid envelope. Attending clinicians were asked to review their readings on a monthly basis. BP targets: <135/85 mmHg at home for those younger than 80 years, <145/85 mmHg at home for those 80 years or older, and <135/75 mmHg at home for those with diabetes. Clinicians in the trial had complete freedom to adjust antihypertensive and other medication as they sought fit, regardless of which group an individual was randomly assigned to and with no restriction on type of drug used. No further details given on number of GP visits.
HBPM with telemonitoring: Participants were trained to send readings via a simple free SMS text-based telemonitoring service with web-based data entry back up. They were asked to monitor their own blood pressure in their non-dominant arm, twice each morning and evening, for the first week of every month using standard recommendations. They were prompted to make contact with their practice if their average blood pressure was above target, and presented readings to attending clinicians via a web interface. Attending clinicians were asked to review their readings on a monthly basis. BP targets:
• Overall defined daily dose
• Mean number of consultations
• Quality of life
• Dizziness

Mon
itorin
g b
lood p
ressure
Hyp
erte
nsio
n in
adu
lts: D
RA
FT
FO
R C
ON
SU
LT
AT
ION
© N
atio
nal In
stitu
te fo
r He
alth
an
d C
are
Exce
llence
, 201
9
13
Study Intervention and comparison
Details Population Outcomes Comments
<135/85 mmHg at home for those younger than 80 years, <145/85 mmHg at home for those 80 years or older, and <135/75 mmHg at home for those with diabetes. Clinicians in the trial had complete freedom to adjust antihypertensive and other medication as they sought fit, regardless of which group an individual was randomly assigned to and with no restriction on type of drug used. No further details given on number of GP visits.
Clinic monitoring: Participants were managed with titration of antihypertensive treatment based on clinic blood pressure measurements at the discretion of their attending health-care professional. Attending clinicians were asked to review participants as often as they wished. BP targets: <135/85 mmHg at home for those younger than 80 years, <145/85 mmHg at home for those 80 years or older, and <135/75 mmHg at home for those with diabetes. Clinicians in the trial had complete freedom to adjust antihypertensive and other medication as they sought fit, regardless of which group an individual was randomly assigned to and with no restriction on type of drug used. No further details given on number of GP visits or communications.

Mon
itorin
g b
lood p
ressure
Hyp
erte
nsio
n in
adu
lts: D
RA
FT
FO
R C
ON
SU
LT
AT
ION
© N
atio
nal In
stitu
te fo
r He
alth
an
d C
are
Exce
llence
, 201
9
14
Study Intervention and comparison
Details Population Outcomes Comments
Simpson 2011117
Pharmacy monitoring, n=131
versus
Usual care, n=129
Pharmacy monitoring: Blood pressure was measured according to the Canadian Hypertension Education Program recommendations using the BPTru BPM-100 automated machine set to report the average of 5 measurements at 1-minute intervals, no further details on how often. Pharmacists collaborated with primary care physicians and recommended medication changes where appropriate, as per guideline recommendations. No further details given on number of GP visits or communication and targets were not specified.
Usual care: Participants received usual care by the primary care team without contributions from study pharmacists, except for standardized blood pressure measurements at the end of the follow-up period. No further details given for number of GP visits or communication and targets were not specified.
Adults with Type 2 diabetes (n=260)
Mean age =59.1 years (SD=11.6 years)
At 12 months:
• All-cause mortality
• Change in blood pressure
• Number of visits
Downgraded for intervention indirectness as it was comparing with usual care not clearly stating clinic measurement.
Stergiou 2014126
Home monitoring without telemonitoring, n=73
versus
Ambulatory and clinic monitoring, n=72
HBPM without telemonitoring: Used validated oscillometric devices with automated memory. Treatment titration during the 12-month follow-up period was made exclusively based on home BP measurements. Target of average home BP <135/85 mmHg for low/moderate-risk participants and <125/80 mmHg for high-risk participants. Treatment titration was performed at 4-week intervals until the pre-set BP goal
Adults with diabetes (n=145)
Mean age=50.75 years (SD=10.3 years)
At 12 months:
• Change in clinic blood pressure
Downgraded for population indirectness, as it did not specify type of diabetes present

Mon
itorin
g b
lood p
ressure
Hyp
erte
nsio
n in
adu
lts: D
RA
FT
FO
R C
ON
SU
LT
AT
ION
© N
atio
nal In
stitu
te fo
r He
alth
an
d C
are
Exce
llence
, 201
9
15
Study Intervention and comparison
Details Population Outcomes Comments
was reached. Participants were treated for 12 months with the aim to reach the pre-set BP goals. Controlled hypertension was defined as home BP levels at the pre-set goal in 2 visits 4 weeks apart. No further details given for number of GP visits, communication or number of measurements.
Ambulatory and clinic monitoring: Ambulatory BP was monitored on a routine workday at 20-minute intervals for 24 hours using validated oscillometric devices. Treatment titration during the 12-month follow-up period was made on clinic and ambulatory BP measurements. Target was to reach clinic BP <140/90 mmHg and awake ambulatory BP <135/85 mmHg for low/moderate-risk people and <130/80 mmHg and <125/80 mmHg, respectively, for high-risk people. Treatment titration was performed at 4-week intervals until the pre-set BP goal was reached. Participants were treated for 12 months with the aim to reach the pre-set BP goals. No further details given for number of GP visits, communication or number of measurements.
Tucker 2017130
Home monitoring with telemonitoring (HM with TM), n=616
versus
Home monitoring without telemonitoring (HM), n=973
HBPM with telemonitoring: Self-monitoring had to be without medical professional input (that is, by participant with or without carer support) and using a validated monitor, with or without other co-interventions, and where a comparator group had no organised self-
Adults (n=3,123)
At 12 months:
• Proportion of people controlled to a target
IPD
Tucker 2015131 merged with this study
Downgraded once for intervention indirectness

Mon
itorin
g b
lood p
ressure
Hyp
erte
nsio
n in
adu
lts: D
RA
FT
FO
R C
ON
SU
LT
AT
ION
© N
atio
nal In
stitu
te fo
r He
alth
an
d C
are
Exce
llence
, 201
9
16
Study Intervention and comparison
Details Population Outcomes Comments
versus
Usual care, (n=961 in HM, n=573 in HM with TM)
measurement of BP. Targets ranged from 120/75 to 140/90 from home and from 130/80 to 140/90 for clinic. Number of readings/sessions ranged from 1 to 3. Self-monitoring ranged from occurring daily for 1 week every 2 months to daily for the first week of each month. No further details given on number of GP visits or communication.
HBPM without telemonitoring: Self-monitoring had to be without medical professional input (that is, by participant with or without carer support) and using a validated monitor, with or without other co-interventions, and where a comparator group had no organised self-measurement of BP. Targets ranged from 120/75 to 140/90 from home and from 130/80 to 140/90 for clinic. Number of readings/sessions ranged from 1 to 3. Self-monitoring ranged from occurring daily for 1 week every 2 months to daily for the first week of each month. No further details given on the telemonitoring aspect. No further details given on number of GP visits or communication.
Usual care: No further details given about usual care. Targets ranged from 120/75 to 140/90 from home and from 130/80 to 140/90 for clinic. No further details given on number of GP visits or communication.
• Change in clinic blood pressure
and once for population indirectness, as it was comparing with usual care not clearly stating clinic measurement and did not specify type of diabetes present

Mon
itorin
g b
lood p
ressure
Hyp
erte
nsio
n in
adu
lts: D
RA
FT
FO
R C
ON
SU
LT
AT
ION
© N
atio
nal In
stitu
te fo
r He
alth
an
d C
are
Exce
llence
, 201
9
17
See appendix D for full evidence tables. 1
1.5.4 Quality assessment of clinical studies included in the evidence review 2
Table 3: Clinical evidence summary: Home monitoring versus clinic monitoring 3
Outcomes
No of Participants (studies) Follow up
Quality of the evidence (GRADE)
Relative effect (95% CI)
Anticipated absolute effects
Risk with Control
Risk difference with Home monitoring without telemonitoring versus clinic monitoring (95% CI)
Cardiovascular events (new atrial fibrillation, angina, myocardial infarction, coronary artery bypass graft or angioplasty, stroke, peripheral vascular disease, or heart failure)
678
(1 study)
1 years
VERY LOW2,3,4 due to risk of bias, indirectness, imprecision
RR 1.42 (0.61 to 3.33)
Moderate
26 per 1,000 11 more per 1,000 (from 10 fewer to 61 more)
Reduction in clinic blood pressure, (systolic blood pressure, change scores)
2,610 (2 studies) 1 years
VERY LOW2 ,5 due to risk of bias, indirectness,
1 Control group risk not available.
The mean reduction in clinic blood pressure, systolic blood pressure, in the intervention groups was 2.23 mmHg lower (3.84 to 0.63 lower)
Reduction in clinic blood pressure, (diastolic blood pressure, change scores)
2,610 (2 studies) 1 years
VERY LOW2,5 due to risk of bias, indirectness
1 Control group risk not available.
The mean reduction in clinic blood pressure, diastolic blood pressure, in clinic diastolic blood pressure in the intervention groups was 1.31 mmHg lower (2.19 to 0.44 lower)
Proportion not meeting target (varied target due to IPD – mode 140/90mmHg)
(Uncontrolled blood pressure – not meeting trial target)
1,934 (1 study) 1 years
VERY LOW2,4,5 due to risk of bias, indirectness, imprecision
RR 0.99 (0.72 to 1.36)
Moderate
73 per 1,000 1 fewer per 1,000 (from 20 fewer to 26 more)

Mon
itorin
g b
lood p
ressure
Hyp
erte
nsio
n in
adu
lts: D
RA
FT
FO
R C
ON
SU
LT
AT
ION
© N
atio
nal In
stitu
te fo
r He
alth
an
d C
are
Exce
llence
, 201
9
18
Outcomes
No of Participants (studies) Follow up
Quality of the evidence (GRADE)
Relative effect (95% CI)
Anticipated absolute effects
Risk with Control
Risk difference with Home monitoring without telemonitoring versus clinic monitoring (95% CI)
Overall defined daily dose 678 (1 study) 1 years
LOW2,3 due to risk of bias, indirectness
The mean overall defined daily dose in the control groups was 2.27
The mean overall defined daily dose in the intervention groups was 0.15 higher (0.11 lower to 0.41 higher)
Mean number of consultations for hypertension
678 (1 study) 1 years
LOW2,3 due to risk of bias, indirectness
The mean number of consultations for hypertension in the control groups was 2.1
The mean number of consultations for hypertension in the intervention groups was 0.30 lower (0.65 lower to 0.05 higher)
Dizziness, hypertension specific symptoms, (no further details of definition)
672 (1 study) 1 years
VERY LOW2,3,4 due to risk of bias, indirectness, imprecision
RR 0.88 (0.63 to 1.24)
Moderate
175 per 1,000 21 fewer per 1,000 (from 65 fewer to 42 more)
1 Control group risk not available. 2 Downgraded by 1 increment if the majority of the evidence was at high risk of bias and downgraded by 2 increments if the majority of the evidence was at very high risk of bias. 3 Downgraded by 1 or 2 increments because the majority of the evidence included an indirect or very indirect population respectively. 4 Downgraded by 1 increment if the confidence interval crossed 1 MID or by 2 increments if the confidence interval crossed both MIDs. 5Downgraded by 1 or 2 increments because the majority of the evidence included an indirect or very indirect population and intervention respectively.
Table 4: Clinical evidence summary: Home monitoring without telemonitoring versus ambulatory and clinic monitoring 1
Outcomes
No of Participants (studies) Follow up
Quality of the evidence (GRADE)
Relative effect (95% CI)
Anticipated absolute effects
Risk with Ambulatory monitoring
Risk difference with home monitoring without TM (95% CI)
Reduction in clinic blood pressure, systolic blood pressure, change score
145 (1 study) 1 years
LOW2,3
due to risk of bias, indirectness,
1 Control group risk not available
The mean reduction in clinic blood pressure, systolic blood pressure, in the intervention groups was 2.1 mmHg lower (6.8 lower to 2.6 higher)
Reduction in clinic blood pressure, diastolic blood
145 (1 study) 1 years
LOW2,3
due to risk of bias, indirectness,
1 Control group risk not available
The mean reduction in clinic blood pressure, diastolic blood pressure, in the intervention groups was 1.4 mmHg lower (4.3 lower to 1.5 higher)

Mon
itorin
g b
lood p
ressure
Hyp
erte
nsio
n in
adu
lts: D
RA
FT
FO
R C
ON
SU
LT
AT
ION
© N
atio
nal In
stitu
te fo
r He
alth
an
d C
are
Exce
llence
, 201
9
19
Outcomes
No of Participants (studies) Follow up
Quality of the evidence (GRADE)
Relative effect (95% CI)
Anticipated absolute effects
Risk with Ambulatory monitoring
Risk difference with home monitoring without TM (95% CI)
pressure, change score 1 Control group not available. 2 Downgraded by 1 increment if the majority of the evidence was at high risk of bias and downgraded by 2 increments if the majority of the evidence was at very high risk of bias. 3 Downgraded by 1 or 2 increments because the majority of the evidence included an indirect or very indirect population respectively.
1
Table 5: Clinical evidence summary: Home monitoring with telemonitoring versus home monitoring without telemonitoring 2
Outcomes
No of Participants (studies) Follow up
Quality of the evidence (GRADE)
Relative effect (95% CI)
Anticipated absolute effects
Risk with Home monitoring without TM
Risk difference with home monitoring with TM (95% CI)
Cardiovascular events (new atrial fibrillation, angina, myocardial infarction, coronary artery bypass graft or angioplasty, stroke, peripheral vascular disease, or heart failure)
658
(1 study)
1 years
VERY LOW2,3,4
due to risk of bias, indirectness, imprecision
RR 0.91
(0.41 to 2.04)
Moderate
37 per 1,000 3 fewer per 1,000 (from 22 fewer to 38 more)
Reduction in clinic blood pressure, systolic blood pressure, final score
655
(1 study)
1 years
LOW2,3
due to risk of bias, indirectness
The mean change in clinic blood pressure, systolic in the control group was 137 mmHg
The mean reduction in clinic blood pressure, systolic blood pressure, in the intervention group was 1.00 mmHg lower (3.51 lower to 1.51 higher)

Mon
itorin
g b
lood p
ressure
Hyp
erte
nsio
n in
adu
lts: D
RA
FT
FO
R C
ON
SU
LT
AT
ION
© N
atio
nal In
stitu
te fo
r He
alth
an
d C
are
Exce
llence
, 201
9
20
Outcomes
No of Participants (studies) Follow up
Quality of the evidence (GRADE)
Relative effect (95% CI)
Anticipated absolute effects
Risk with Home monitoring without TM
Risk difference with home monitoring with TM (95% CI)
Reduction in clinic blood pressure, diastolic blood pressure, final score
655
(1 study)
1 years
LOW2,3
due to risk of bias, indirectness
The mean change in clinic blood pressure, diastolic in the control groups was 77.8 mmHg
The mean reduction in clinic blood pressure, diastolic blood pressure, in the intervention group was 0.90 mmHg higher (0.62 lower to 2.42 higher)
Overall defined daily dose
658 (1 study) 1 years
LOW2,3
due to risk of bias, indirectness
The mean overall defined daily dose in the control groups was 2.42
The mean overall defined daily dose in the intervention groups was 0.27 higher (0 to 0.54 higher)
Average number of visits
100 (1 study) 1 years
VERY LOW3,4
due to indirectness, imprecision
RR 0.64 (0.19 to 2.13)
Moderate
122 per 1,000 44 fewer per 1,000 (from 99 fewer to 138 more)
Mean number of consultations for hypertension
658
(1 study)
1 years
LOW2,3
due to risk of bias, indirectness
The mean number of consultations for hypertension in the control groups was 1.8
The mean number of consultations for hypertension in the intervention groups was 0.40 higher (0.01 to 0.79 higher)
Dizziness, hypertension specific symptoms
650 (1 study) 1 years
VERY LOW2,3,4
due to risk of bias, indirectness, imprecision
RR 1.43 (1.03 to 1.98)
Moderate
154 per 1,000 66 more per 1,000 (from 5 more to 151 more)
1 Control group risk not available. 2 Downgraded by 1 increment if the majority of the evidence was at high risk of bias and downgraded by 2 increments if the majority of the evidence was at very high risk of bias. 3 Downgraded by 1 increment if the confidence interval crossed 1 MID or by 2 increments if the confidence interval crossed both MIDs. 4Downgraded by 1 or 2 increments because the majority of the evidence included an indirect or very indirect population respectively.

Mon
itorin
g b
lood p
ressure
Hyp
erte
nsio
n in
adu
lts: D
RA
FT
FO
R C
ON
SU
LT
AT
ION
© N
atio
nal In
stitu
te fo
r He
alth
an
d C
are
Exce
llence
, 201
9
21
Table 6: Clinical evidence summary: Home monitoring with telemonitoring versus clinic monitoring 1
Outcomes
No of Participants (studies) Follow up
Quality of the evidence (GRADE)
Relative effect (95% CI)
Anticipated absolute effects
Risk with Control
Risk difference with Home monitoring with telemonitoring versus clinic monitoring (95% CI)
All-cause mortality 493 (1 study) 1 years
VERY LOW3,6 due to indirectness, imprecision
Peto OR 7.45 (0.46 to 119.44)
Moderate
0 events in control arm 10 more per 1,000 (from 10 fewer to 20 more)
Cardiovascular events (defined as new atrial fibrillation, angina, myocardial infarction, coronary artery bypass graft or angioplasty, stroke, peripheral vascular disease, or heart failure in 1 study, defined as non-fatal cardiovascular events in another)
1,173 (2 studies) 1 years
VERY LOW1,2,3,6 due to risk of bias, indirectness, imprecision
RR 1.43 (0.66 to 3.08)
Moderate
17 per 1,000 7 more per 1,000 (from 6 fewer to 35 more)
Quality of life, SF-12, emotional subscale, 0-100, high is good outcome
493 (1 study) 1 years
LOW1,6 due to risk of bias, indirectness
The mean quality of life -–emotional scale in the control groups was 71.5
The mean quality of life - emotional scale in the intervention groups was 0.6 higher (2.45 lower to 3.65 higher)
Quality of life, SF-12, physical subscale, 0-100, high is good outcome
493 (1 study) 1 years
LOW1,6 due to risk of bias, indirectness
The mean quality of life – physical in the control groups was 78.1
The mean quality of life - physical in the intervention groups was 0.4 lower (5.53 lower to 4.73 higher)
Quality of life, SF-12, general subscale, 0-100, high is good outcome
493 (1 study) 1 years
LOW1,6 due to risk of bias, indirectness
The mean quality of life – general in the control groups was 66.7
The mean quality of life - general in the intervention groups was 0.1 lower (3.75 lower to 3.55 higher)
Reduction in clinic blood pressure – systolic blood pressure, change score
2,357 (3 studies) 1 years
VERY LOW1,2,5,6 due to risk of bias, inconsistency, indirectness
4 Control group risk not available.
The mean reduction in clinic blood pressure – systolic blood pressure in the intervention groups was 3.08 mmHg lower (5.89 to 0.58 lower)

Mon
itorin
g b
lood p
ressure
Hyp
erte
nsio
n in
adu
lts: D
RA
FT
FO
R C
ON
SU
LT
AT
ION
© N
atio
nal In
stitu
te fo
r He
alth
an
d C
are
Exce
llence
, 201
9
22
Outcomes
No of Participants (studies) Follow up
Quality of the evidence (GRADE)
Relative effect (95% CI)
Anticipated absolute effects
Risk with Control
Risk difference with Home monitoring with telemonitoring versus clinic monitoring (95% CI)
Reduction in clinic blood pressure - diastolic blood pressure, change score
2,357 (3 studies) 1 years
VERY LOW1,2 ,6 due to risk of bias, indirectness,
4 Control group risk not available.
The mean reduction in clinic blood pressure - diastolic blood pressure in the intervention groups was 0.83 mmHg lower (1.51 to 0.15 lower)
Proportion controlled to a target
493
(1 study)
1 years
LOW3,6 due indirectness, imprecision
RR 1.22
(0.95 to 1.56)
Moderate
304 per 1,000 67 more per 1,000 (from 15 fewer to 170 more)
Proportion not meeting target (varied target due to IPD – mode 140/90 mmHg)
(Uncontrolled blood pressure – not meeting trial target)
1,189 (1 study) 1 years
VERY LOW1,2,3,6 due to risk of bias, indirectness, imprecision
RR 0.90 (0.69 to 1.15)
Moderate
164 per 1,000 16 fewer per 1,000 (from 51 fewer to 25 more)
Overall defined daily dose 680 (1 study) 1 years
VERY LOW1,2 due to risk of bias, indirectness
The mean overall defined daily dose in the control groups was 2.27
The mean overall defined daily dose in the intervention groups was 0.42 higher (0.16 to 0.68 higher)
Mean number of consultations for hypertension
680 (1 study) 1 years
VERY LOW1,2 due to risk of bias, indirectness
The mean number of consultations for hypertension in the control groups was 2.1
The mean number of consultations for hypertension in the intervention groups was 0.10 higher (0.25 lower to 0.45 higher)
Dizziness, hypertension specific symptoms, (no further details of definition)
674 (1 study) 1 years
VERY LOW1,2,3 due to risk of bias, indirectness, imprecision
RR 1.26 (0.93 to 1.71)
Moderate
175 per 1,000 45 more per 1,000 (from 12 fewer to 124 more)
1 Downgraded by 1 increment if the majority of the evidence was at high risk of bias and downgraded by 2 increments if the majority of the evidence was at very high risk of bias. 2 Downgraded by 1 or 2 increments because the majority of the evidence included an indirect or very indirect population respectively. 3 Downgraded by 1 increment if the confidence interval crossed 1 MID or by 2 increments if the confidence interval crossed both MIDs. 4 Control group risk not available. 5 'Downgraded by 1 or 2 incrments due to heterogeneity, unexplained by subgroup analyses so random effects was used.

Mon
itorin
g b
lood p
ressure
Hyp
erte
nsio
n in
adu
lts: D
RA
FT
FO
R C
ON
SU
LT
AT
ION
© N
atio
nal In
stitu
te fo
r He
alth
an
d C
are
Exce
llence
, 20
19
23
Outcomes
No of Participants (studies) Follow up
Quality of the evidence (GRADE)
Relative effect (95% CI)
Anticipated absolute effects
Risk with Control
Risk difference with Home monitoring with telemonitoring versus clinic monitoring (95% CI)
6Downgraded by 1 or 2 increments because the majority of the evidence included an indirect or very indirect intervention respectively.
Table 7: Clinical evidence summary: Home monitoring with telemonitoring and pharmacist care versus clinic monitoring 1
Outcomes
No of Participants (studies) Follow up
Quality of the evidence (GRADE)
Relative effect (95% CI)
Anticipated absolute effects
Risk with Clinic monitoring
Risk difference with Home monitoring with TM and pharmacist care (95% CI)
All-cause mortality 484 (1 study) 1 years
VERY LOW2,3 due to indirectness, imprecision
Peto OR 7.71 (0.15 to 388.76)
Moderate
0 events in control group 0 more per 1,000 (from 10 fewer to 20 more)
Non-fatal Cardiovascular events, no further details given
484 (1 study) 1 years
VERY LOW2,3 due to indirectness, imprecision
RR 1.56 (0.26 to 9.27)
Moderate
8 per 1,000 5 more per 1,000 (from 6 fewer to 67 more)
Change in blood pressure, systolic change score
484
(1 study)
1 years
LOW2,3
due to indirectness, imprecision
The mean change in systolic blood pressure in the control group was -5.3 mmHg
The mean change in systolic blood pressure in the intervention groups was 8.90 mmHg lower (11.43 to 6.37 lower)
Change in blood pressure, diastolic change score
484
(1 study)
1 years
LOW2,3
due to indirectness, imprecision
The mean change in diastolic blood pressure in the control groups was -3.5 mmHg
The mean change in diastolic blood pressure in the intervention groups was 3.50 mmHg lower (4.91 to 2.09 lower)
Proportion controlled to a target
484
(1 study)
1 years
LOW1,2 due to risk of bias, indirectness
RR 1.84
(1.48 to 2.28)
Moderate
308 per 1,000 259 more per 1,000 (from 148 more to 394 more)
Quality of life, SF-12, emotional subscale, 0-100, high is good outcome
484 (1 study) 1 years
LOW1,2 due to risk of bias, indirectness
The mean quality of life - emotional scale in the control groups was 71.5
The mean quality of life - emotional scale in the intervention groups was 0.20 higher (3.14 lower to 3.54 higher)

Mon
itorin
g b
lood p
ressure
Hyp
erte
nsio
n in
adu
lts: D
RA
FT
FO
R C
ON
SU
LT
AT
ION
© N
atio
nal In
stitu
te fo
r He
alth
an
d C
are
Exce
llence
, 201
9
24
Outcomes
No of Participants (studies) Follow up
Quality of the evidence (GRADE)
Relative effect (95% CI)
Anticipated absolute effects
Risk with Clinic monitoring
Risk difference with Home monitoring with TM and pharmacist care (95% CI)
Quality of life, SF-12, physical subscale, 0-100, high is good outcome
484 (1 study) 1 years
LOW1,2 due to risk of bias, indirectness
The mean quality of life - physical in the control groups was 78.1
The mean quality of life - physical in the intervention groups was 2.90 higher (1.93 lower to 7.73 higher)
Quality of life, SF-12, general subscale, 0-100, high is good outcome
484 (1 study) 1 years
LOW1,2 due to risk of bias, indirectness
The mean quality of life - general in the control groups was 66.7
The mean quality of life - general in the intervention groups was 0.10 lower (3.9 lower to 3.7 higher)
1 Downgraded by 1 increment if the majority of the evidence was at high risk of bias and downgraded by 2 increments if the majority of the evidence was at very high risk of bias. 2 Downgraded by 1 or 2 increments because the majority of the evidence included an indirect or very indirect intervention respectively. 3 Downgraded by 1 increment if the confidence interval crossed 1 MID or by 2 increments if the confidence interval crossed both MIDs.
Table 8: Clinical evidence summary: Home monitoring with telemonitoring and pharmacist care versus home monitoring with 1 telemonitoring 2
Outcomes
No of Participants (studies) Follow up
Quality of the evidence (GRADE)
Relative effect (95% CI)
Anticipated absolute effects
Risk with Home monitoring with telemonitoring
Risk difference with Home monitoring with TM + pharmacist care (95% CI)
All-cause mortality 483 (1 study) 1 years
VERY LOW2,3 due to indirectness, imprecision
RR 0.52 (0.05 to 5.69)
Moderate
8 per 1,000 4 fewer per 1,000 (from 8 fewer to 38 more)
Non-fatal Cardiovascular events
483 (1 study) 1 years
VERY LOW2,3 due to indirectness, imprecision
RR 0.78 (0.18 to 3.44)
Moderate
16 per 1,000 4 fewer per 1,000 (from 13 fewer to 39 more)
Change in blood pressure, systolic change score
483
(1 study)
1 years
LOW2,3 due to indirectness, imprecision
The mean change in systolic blood pressure in the control groups was
-8.2mmHg
The mean change in systolic blood pressure in the intervention groups was 6.00 mmHg lower (8.53 to 3.47 lower)

Mon
itorin
g b
lood p
ressure
Hyp
erte
nsio
n in
adu
lts: D
RA
FT
FO
R C
ON
SU
LT
AT
ION
© N
atio
nal In
stitu
te fo
r He
alth
an
d C
are
Exce
llen
ce
, 201
9
25
Outcomes
No of Participants (studies) Follow up
Quality of the evidence (GRADE)
Relative effect (95% CI)
Anticipated absolute effects
Risk with Home monitoring with telemonitoring
Risk difference with Home monitoring with TM + pharmacist care (95% CI)
Change in blood pressure, diastolic change score
483
(1 study)
1 years
LOW2,3 due to indirectness, imprecision
The mean change in diastolic blood pressure in the control groups was
-4.4mmHg
The mean change in diastolic blood pressure in the intervention groups was 2.60 mmHg lower (4.01 to 1.19 lower)
Quality of life, SF-12, emotional sub scale, 0-100, high is good outcome
483 (1 study) 1 years
LOW1,2 due to risk of bias, indirectness
The mean quality of life - emotional scale in the control groups was 72.1
The mean quality of life - emotional scale in the intervention groups was 0.40 lower (3.67 lower to 2.87 higher)
Quality of life, SF-12, physical sub scale, 0-100, high is good outcome
483 (1 study) 1 years
LOW1,2 due to risk of bias, indirectness
The mean quality of life - physical in the control groups was 77.7
The mean quality of life - physical in the intervention groups was 3.30 higher (1.77 lower to 8.37 higher)
Quality of life, SF-12, general sub scale, 0-100, high is good outcome
483 (1 study) 1 years
LOW1,2 due to risk of bias, indirectness
The mean quality of life - general in the control groups was 66.6
The mean quality of life - general in the intervention groups was 0.00 higher (3.85 lower to 3.85 higher)
1 Downgraded by 1 increment if the majority of the evidence was at high risk of bias and downgraded by 2 increments if the majority of the evidence was at very high risk of bias. 2 Downgraded by 1 or 2 increments because the majority of the evidence included an indirect or very indirect intervention respectively. 3 Downgraded by 1 increment if the confidence interval crossed 1 MID or by 2 increments if the confidence interval crossed both MIDs.
Table 9: Clinical evidence summary: Home-monitoring (with self-titration) and telemonitoring versus clinic monitoring 1
Outcomes
No of Participants (studies) Follow up
Quality of the evidence (GRADE)
Relative effect (95% CI)
Anticipated absolute effects
Risk with Clinic/office
Risk difference with Self-monitoring (with self-titration) and telemonitoring (95% CI)
Change in blood pressure, systolic change score
480
(1 study)
1 years
LOW1,2 due to risk of bias, indirectness
The mean blood pressure systolic in the control groups was 140.3mmHg
The mean change in blood pressure systolic in the intervention groups was
5.60mmHg lower (8.91 to 2.29 lower)

Mon
itorin
g b
lood p
ressure
Hyp
erte
nsio
n in
adu
lts: D
RA
FT
FO
R C
ON
SU
LT
AT
ION
© N
atio
nal In
stitu
te fo
r He
alth
an
d C
are
Exce
llence
, 201
9
26
Outcomes
No of Participants (studies) Follow up
Quality of the evidence (GRADE)
Relative effect (95% CI)
Anticipated absolute effects
Risk with Clinic/office
Risk difference with Self-monitoring (with self-titration) and telemonitoring (95% CI)
Change in blood pressure, diastolic change score
480
(1 study)
1 years
LOW1,2 due to risk of bias, indirectness
The mean blood pressure diastolic in the control groups was 79.8mmHg
The mean change in blood pressure diastolic in the intervention groups was
2.30 mmHg lower (4.41 to 0.19 lower)
Quality of life, EQ-5D, 480 (1 study) 1 years
LOW1,2 due to risk of bias, indirectness
The mean quality of life, EQ-5D, in the control groups was 0.838
The mean quality of life, eq-5d, in the intervention groups was 0.01 lower (0.06 lower to 0.03 higher)
Mean number of consultations for hypertension
480 (1 study) 1 years
LOW1,2 due to risk of bias, indirectness
The mean number of consultations in the control groups was 3.5
The mean number of consultations in the intervention groups was 0.30 lower (0.72 lower to 0.12 higher)
Mean number of antihypertensive drugs
480 (1 study) 1 years
LOW1,2 due to risk of bias, indirectness
The mean number of antihypertensive drugs in the control groups was 1.7
The mean number of antihypertensive drugs in the intervention groups was 0.40 higher (0.12 to 0.68 higher)
1 Downgraded by 1 increment if the majority of the evidence was at high risk of bias and downgraded by 2 increments if the majority of the evidence was at very high risk of bias. 2 Downgraded by 1 or 2 increments because the majority of the evidence included an indirect or very indirect population respectively.
Table 10: Clinical evidence summary: Pharmacy monitoring versus clinic monitoring 1
Outcomes
No of Participants (studies) Follow up
Quality of the evidence (GRADE)
Relative effect (95% CI)
Anticipated absolute effects
Risk with Clinic/office Risk difference with Pharmacy (95% CI)
All-cause mortality 260 (1 study) 1 years
VERY LOW1,2,3 due to risk of bias, indirectness, imprecision
Peto OR 0.13
(0 to 6.72)
Moderate
8 per 1,000 10 fewer per 1,000 (from 30 fewer to 10 more)
Reduction in blood pressure, systolic blood pressure, change score
260
(1 study)
1 years
VERY LOW1,2,3
due to risk of bias, indirectness, imprecision
The mean change in blood pressure, systolic in the control group was 2.5 mmHg
The mean reduction in blood pressure, systolic blood pressure, in the intervention group was 4.90 mmHg lower (8.75 to 1.05 lower)

Mon
itorin
g b
lood p
ressure
Hyp
erte
nsio
n in
adu
lts: D
RA
FT
FO
R C
ON
SU
LT
AT
ION
© N
atio
nal In
stitu
te fo
r He
alth
an
d C
are
Exce
llence
, 201
9
27
Outcomes
No of Participants (studies) Follow up
Quality of the evidence (GRADE)
Relative effect (95% CI)
Anticipated absolute effects
Risk with Clinic/office Risk difference with Pharmacy (95% CI)
Reduction in blood pressure, diastolic blood pressure, change score
260
(1 study)
1 years
LOW1,2
due to risk of bias, indirectness
The mean change in blood pressure, diastolic in the control group was 0.6 mmHg
The mean reduction in blood pressure, diastolic blood pressure, in the intervention group was 2.90 mmHg lower (5.70 to 0.10 lower)
Contacts per patients with all resources (excluding pharmacists)
260
(1 study)
1 years
VERY LOW
due to risk of bias, indirectness,
The median number of contacts per participant in the control group was 2. The interquartile range was 2 to 5.
The median number of contacts per participant in the intervention group was 3. The interquartile range was 1 to 6.
1 Downgraded by 1 or 2 increments because the majority of the evidence included an indirect or very indirect intervention respectively. 2 Downgraded by 1 increment if the confidence interval crossed 1 MID or by 2 increments if the confidence interval crossed both MIDs. 3 Downgraded by 1 increment if the majority of the evidence was at high risk of bias and downgraded by 2 increments if the majority of the evidence was at very high risk of bias.
See appendix F for full GRADE tables. 1

Hypertension in adults: DRAFT FOR CONSULTATION Monitoring blood pressure
© National Institute for Health and Care Excellence, 2019 28
1.6 Economic evidence 1
1.6.1 Included studies 2
One health economic study identified with the relevant comparison and has been included in 3 this review.58 This is summarised in the health economic evidence profile below (Table 11) 4 and the health economic evidence tables in appendix H. 5
1.6.2 Excluded studies 6
Ten economic studies relating to this review question were identified but were excluded due 7 to a combination of limited applicability and methodological limitations, as well as the 8 availability of more applicable evidence. 17, 70, 72, 83, 99, 102, 110, 123, 128, 138 9
These are listed in appendix I, with reasons for exclusion given. 10
See also the health economic study selection flow chart in appendix G. 11
12

Mon
itorin
g b
lood p
ressure
Hyp
erte
nsio
n in
adu
lts: D
RA
FT
FO
R C
ON
SU
LT
AT
ION
© N
atio
nal In
stitu
te fo
r He
alth
an
d C
are
Exce
llence
, 201
9
29
1.6.3 Summary of studies included in the economic evidence review 1
Table 11: Health economic evidence profile: Self-monitoring (with self-titration) and telemonitoring versus usual care 2
Study Applicability Limitations Other comments Incremental cost
Incremental effects (QALYs)
Cost effectiveness Uncertainty
Kaambwa 201389 (UK)
Directly applicable(a)
Potentially serious limitations (b)
Cost–utility analysis.
Markov model comparing self-management with usual care. One-year cycles. 35-year time horizon. People begin in a ‘well’ state with poorly controlled hypertension, with the possibility of moving to other states of stroke, myocardial infarction, angina, heart failure, and death. Each event state has a post state. Baseline risk based on Framingham. Extrapolation of effect from a 12-month trial based on translating BP reduction from TASMINH2 trial into a relative risk reduction from Law 2009.
Men:
£383
Women:
£576
Men:
0.24
Women:
0.12
Men:
£1,624 per QALY gained
Women:
£4,923 per QALY gained
Probabilistic sensitivity analysis undertaken. Probability of being cost effective at £20,000 threshold was 99% for both men and women.
Sensitivity analyses undertaken varying time horizon and relaxing assumption that extrapolated effectiveness difference in BP for entire time horizon by reducing the effectiveness for both men and women at different time points in the model. The only time this made self-management not cost effective was when no effectiveness difference between the interventions was assumed for women at year 2 in the model, at year 3, and at year 5.
Abbreviations: CUA: cost utility analysis; ICER: incremental cost-effectiveness ratio; QALY: quality-adjusted life years; RCT: randomised controlled trial 3 (a) UK study, CUA, long-term time horizon. Appropriate interventions. 4 (b) Based on a trial of only 12 months and extrapolating this effect. CV events based on risk equation rather than directly from a trial. Relative treatment effect based on 5 mapping BP changes. No adverse events. Costs may be out of date. 6

Hypertension in adults: DRAFT FOR CONSULTATION Monitoring blood pressure
© National Institute for Health and Care Excellence, 2019 30
1.6.4 Resource costs 1
Some unit costs and considerations are presented and discussed below. 2
Table 12: Staff costs 3
Resource Cost per appointment
Source
GP £38 Per patient contact lasting 9.22 minutes.
PSSRU 201733
Nurse (GP practice) £10.85 Based on 15.5 minutes of patient contact from PSSRU 2015, and £42 per hour (including qualifications) from PSSRU 201733
Community pharmacist £18.75 Assuming the same duration of contact as a nurse (15.5 minutes of patient contact).
Community pharmacist cost was last included in the 2014 PSSRU32, this has been inflated to 2015/16 costs(a).
(a) This is the latest available inflation index available from the PSSRU 33 4
1.7 Evidence statements 5
1.7.1 Clinical evidence statements 6
Home monitoring versus clinic monitoring 7
Very low quality evidence from one study with 678 participants showed a clinically important 8 increase of cardiovascular events for home monitoring compared to clinic monitoring. 9
Very low quality evidence from 2 studies with a total of 2,610 participants showed no 10 clinically important difference between home and clinic monitoring for reduction in systolic or 11 diastolic clinic blood pressure. Very low quality evidence from 1 study with 1,934 participants 12 showed no clinically important difference between home and clinic monitoring for proportion 13 not meeting target. Low quality evidence from 1 study with 678 participants showed no 14 clinically important difference between home and clinic monitoring for mean number of 15 consultations and overall defined daily dose. Very low quality evidence from 1 study with 672 16 participants showed no clinically important difference for dizziness. 17
Home monitoring without telemonitoring versus ambulatory and clinic monitoring 18
Low quality evidence from 1 study with 145 participants showed no clinically important 19 difference between home monitoring compared to ambulatory and clinic monitoring for 20 reduction in systolic and diastolic clinic blood pressure. 21
Home monitoring with telemonitoring versus home monitoring without telemonitoring 22
Very low quality evidence from one study with 650 participants showed a clinically important 23 increase in occurrence of dizziness for home monitoring with telemonitoring compared to 24 without telemonitoring. 25
Low to very low quality evidence from 1 study (658 participants) showed no clinically 26 important difference between home monitoring with or without telemonitoring for 27 cardiovascular events, reduction in systolic and diastolic clinic blood pressure, mean number 28 of consultations or overall defined daily dose (number of participants was 655–658 29

Hypertension in adults: DRAFT FOR CONSULTATION Monitoring blood pressure
© National Institute for Health and Care Excellence, 2019 31
depending on the outcome). Very low quality evidence from 1 study with 100 participants 1 showed no clinically important difference for average number of visits. 2
Home monitoring with telemonitoring versus clinic monitoring 3
Low quality evidence from 1 study with 493 participants showed a clinically important benefit 4 for home monitoring with telemonitoring compared to clinic monitoring in terms of proportion 5 controlled to a target. 6
Very low quality evidence from 1 study with 493 participants showed a greater occurrence of 7 all-cause mortality with home monitoring with telemonitoring compared to clinic monitoring. 8 Very low quality evidence from 2 studies with 1,173 participants showed a greater 9 occurrence of cardiovascular events for home monitoring with telemonitoring. 10
Low quality evidence from 1 study with 493 participants showed no clinically important 11 difference between home monitoring with telemonitoring and clinic monitoring for quality of 12 life on the emotional, physical and general SF-12 subscale. Very low quality evidence from 3 13 studies with a total of 2,357 participants showed no clinically important difference between 14 the monitoring methods for reduction in systolic and diastolic clinic blood pressure. Further 15 evidence (also very low quality) from 1 study with 1,189 participants showed no clinically 16 important difference for proportion not meeting a target. Very low quality from 1 study with 17 680 participants showed no clinically important difference for mean number of consultations 18 and overall defined daily dose. Very low quality evidence from 1 study with 674 participants 19 showed no clinically important difference for dizziness. 20
Home monitoring with telemonitoring and pharmacist care versus clinic monitoring 21
Low quality evidence from 1 study with 484 participants showed a clinically important benefit 22 of home monitoring with telemonitoring and pharmacist interaction for change in systolic 23 blood pressure, proportion controlled to a target and quality of life with the physical SF-12 24 subscale. 25
Very low quality evidence from this study showed a greater occurrence of non-fatal 26 cardiovascular events with home monitoring with telemonitoring and pharmacist interaction 27 compared to clinic monitoring. 28
Low to very low quality evidence from the same study showed no clinically important 29 difference for all-cause mortality, change in diastolic blood pressure or quality of life 30 measured on the emotional or general subscales of the SF-12 scale. 31
Home monitoring with telemonitoring and pharmacist care versus home monitoring 32 with telemonitoring 33
Low to very low quality evidence from the same study failed to demonstrate a clinically 34 important difference for occurrence of non-fatal cardiovascular events, change in diastolic 35 blood pressure or quality of life on the emotional and general subscale of the SF-12 scale. 36
Low to very low quality evidence from 1 study with 483 participants showed a clinically 37 important benefit of home monitoring with telemonitoring and pharmacist care compared to 38 home monitoring with telemonitoring (without pharmacist care) for all-cause mortality, change 39 in systolic blood pressure and quality of life on the physical subscale of the SF-12 scale. 40
Home monitoring (with self-titration) and telemonitoring versus clinic monitoring 41
Low quality evidence from 1 study with 480 participants showed a clinically important benefit 42 of self-monitoring with self-titration for change in systolic blood pressure. 43

Hypertension in adults: DRAFT FOR CONSULTATION Monitoring blood pressure
© National Institute for Health and Care Excellence, 2019 32
Low quality evidence from the same study showed no clinically important difference for 1 change in diastolic blood pressure, quality of life, mean number of consultations and mean 2 number of antihypertensive drugs. 3
Pharmacy monitoring versus clinic monitoring 4
Very low quality evidence from one study with 260 participants showed a clinically important 5 benefit of pharmacy compared to clinic monitoring for all-cause mortality and reduction in 6 systolic blood pressure, but no difference in terms of reduction in diastolic blood pressure, 7 and an increased number of contacts per patient for pharmacy monitoring. 8
1.7.2 Health economic evidence statements 9
One cost utility analysis found that self-monitoring with self-titration and telemonitoring was 10 cost effective compared to usual care for monitoring blood pressure (ICER: £1,624 for men 11 and £4,923 for women). This analysis was assessed as directly applicable with potentially 12 serious limitations. 13
1.8 Recommendations 14
For guidance on blood pressure control in people with chronic kidney disease (with or without 15 type 2 diabetes), see NICE’s guideline on chronic kidney disease in adults: assessment and 16 management. 17
B1. Use clinic blood pressure measurements to monitor the response to lifestyle changes or 18 drug treatment in adults with hypertension. [2019] 19
B2. Consider HBPM for adults with hypertension who choose to self-monitor their blood 20 pressure. [2019] 21
B3. Consider ABPM or HBPM, in addition to clinic blood pressure measurements, for adults 22 with hypertension identified as having a white-coat effect or masked hypertension (in 23 which clinic and non-clinic blood pressure results are conflicting). Be aware that the 24 corresponding measurements for ABPM and HBPM are 5 mmHg lower than for clinic 25 measurements (see recommendation 1.2.8 for diagnostic thresholds). [2019] 26
B4. For people who choose to use HBPM, provide: 27
• training and advice on using home blood pressure monitors 28
• information about what to do if they are not achieving their target blood pressure. 29
Be aware that the corresponding measurements for HBPM are 5 mmHg lower than for 30 clinic measurements (see recommendation 1.2.8 for diagnostic thresholds) [2019] 31
Research recommendations 32
RR1. Which automated blood pressure monitors are suitable for people with hypertension 33 and atrial fibrillation? 34
See also the rationale in appendix J. 35

Hypertension in adults: DRAFT FOR CONSULTATION Monitoring blood pressure
© National Institute for Health and Care Excellence, 2019 33
1.9 The committee’s discussion of the evidence 1
1.9.1 Interpreting the evidence 2
1.9.1.1 The outcomes that matter most 3
The committee considered all-cause mortality, quality of life, stroke and myocardial infarction 4 as critical outcomes during decision-making. Reduction in clinic blood pressure, proportion 5 controlled to a target, average daily dose of antihypertensive medication, average number of 6 visits, intolerance to device and hypotension were considered important for decision-making. 7 There was no evidence on the outcomes of stroke and intolerance to devices. 8
1.9.1.2 The quality of the evidence 9
Seven studies were included, with evidence ranging from very low to low quality. The 10 evidence was rated as low or very low quality due to risk of bias, imprecision or population 11 indirectness. Although there is evidence for cardiovascular events, it is noted the studies did 12 not pre-specify this as an outcome, which led to questions of reliability and whether these 13 events were recorded systematically within the studies. The events were reported, as it is 14 good practice; however, they were not validated by checking if hospital records tallied up with 15 notes reviews carried out during the study. Furthermore, it was noted that the mortality 16 events were not entirely accurate as some people were lost to follow up, which may also 17 have included more mortality events. The studies within the evidence were also small and 18 therefore not powered to detect differences in cardiovascular events. These factors suggest 19 that this evidence should be interpreted with caution. 20
It was noted that the number of people involved in the included studies and the number of 21 events were relatively small, leading to statistical variation. However, the committee 22 acknowledged that these studies were designed and powered to detect achievement of 23 blood pressure targets, rather than the reduction of cardiovascular events. It was noted that 24 the key aspects to consider were the monitoring endpoints rather than cardiovascular events, 25 as that is what most studies accurately report to demonstrate the accuracy and effects of 26 various monitoring technology. 27
1.9.1.3 Benefits and harms 28
There was a clinically important benefit of home monitoring with telemonitoring when 29 compared to clinic monitoring for the proportion of people controlled to a target. There was a 30 clinically important benefit of home monitoring with telemonitoring and pharmacist care when 31 compared to clinic monitoring for systolic blood pressure reduction, proportion controlled to a 32 target and quality of life with the physical SF-12 subscale. Home monitoring with 33 telemonitoring and pharmacist care also showed a clinically important benefit when 34 compared to home monitoring with telemonitoring, for mortality, systolic blood pressure 35 reduction and quality of life with the physical SF-12 subscale. In addition, home monitoring 36 with self-titration and telemonitoring showed a clinically important benefit when compared to 37 clinic monitoring (for systolic blood pressure reduction). Finally, pharmacy monitoring showed 38 a clinically important benefit when compared to clinic monitoring (for mortality and reduction 39 in systolic blood pressure). There was a clinically important harm for home monitoring with 40 telemonitoring compared to home monitoring without telemonitoring (dizziness) and home 41 monitoring with telemonitoring compared to clinic monitoring (mortality and cardiovascular 42 events). Due to the low quality of the evidence, the committee agreed it was not robust 43 enough to make a strong recommendation to offer home blood pressure monitoring. 44
It was noted that the aim of the interventions was to deliver better blood pressure control to a 45 specified target and to make efficient use of NHS resources. The outcome for average 46 number of visits was included, as it was agreed to be the best indicator for this. Furthermore, 47

Hypertension in adults: DRAFT FOR CONSULTATION Monitoring blood pressure
© National Institute for Health and Care Excellence, 2019 34
it was noted that a reduction in number of visits to the GP would help inform patient choice 1 when choosing which monitor to use, as well as being a relevant outcome for the NHS. 2
It was noted that the greatest blood pressure reduction was seen with pharmacist input in 3 monitoring; however, the evidence was not considered strong enough to make a 4 recommendation in favour of pharmacist input. 5
The committee agreed the evidence showed no difference between clinic and home 6 monitoring. However, it was also noted that the evidence was not robust (as discussed 7 above). It was noted the person's choice is important and that some will be more willing and 8 motivated to use home monitoring. It is important that people know they have the option to 9 choose the type of monitoring most suitable and preferred to them. The recommendations 10 from CG127 were carried forward to recommend CPMB but with the option to consider 11 HBMP for those who chose to self-monitor their blood pressure. 12
It was discussed that home blood pressure monitoring is routinely used and is widespread 13 practice already, especially for those known to have a white coat effect. The committee 14 agreed that adequate training would have to be in place to ensure it is being measured 15 correctly and the machines are used correctly, perhaps through demonstrations. It was also 16 noted that suitably trained personnel or a robust system would have to be available to deal 17 with any problems arising from use of the machines. Additionally, it was discussed that 18 people with hypertension would receive target instructions and those higher than their target 19 would be able to make an appointment to discuss it further. Therefore, the committee agreed 20 to make a consider recommendation on home monitoring provided the correct training and 21 guidance is given, as it is realistic with the most time being spent at home. 22
The committee agreed it could not make a recommendation on telemonitoring, as the 23 evidence was not sufficient to support a clear benefit of this technique. In addition, there 24 were variations in the types of telemonitoring methods within the evidence studied. The 25 committee agreed that this was not a priority area for a research recommendation within the 26 guideline as multiple trials were likely on-going as this is a fast-moving field of research, 27 furthermore any specific trial design recommended was likely to be out-of-date by the time it 28 was performed. 29
The 2011 iteration of the guideline included a recommendation for further research for the 30 best method of monitoring hypertension in people with atrial fibrillation. No evidence was 31 identified in the updated reviews to inform recommendations for this group; therefore, the 32 committee agreed that this research recommendation should be retained potentially to inform 33 future updates of the guideline. 34
1.9.2 Cost effectiveness and resource use 35
One UK economic evaluation was identified that compared home measurement with 36 telemonitoring (self-management including self-titration of medication) versus usual care. 37 Ten economic evaluations were excluded due to a combination of limited applicability and 38 methodological limitations, as well as the availability of more applicable evidence. 39
The included study was a cost–utility analysis based on a Markov model with 1-year cycles 40 and a 35-year time horizon. People began in a ‘well’ state with poorly controlled hypertension 41 with the possibility of moving to other states of stroke, myocardial infarction, angina, heart 42 failure, and death. Each event state had a post state. Baseline risk was based on the 43 Framingham risk calculator. Treatment effect was based on the 12-month difference in 44 systolic blood pressure from the TASMINH2 trial80 and this was translated into a relative risk 45 reduction using a published meta-analysis.68 Treatment effect was assumed to stay the same 46 after 12 months. There were subgroups by sex. The results showed that self-management 47 was cost effective for both men and women with ICERs below £5,000. 48

Hypertension in adults: DRAFT FOR CONSULTATION Monitoring blood pressure
© National Institute for Health and Care Excellence, 2019 35
Probabilistic sensitivity analysis was undertaken as well as various 1-way sensitivity 1 analyses: varying the time horizon and relaxing the assumption that the 12-month treatment 2 effect was extrapolated to a lifetime horizon. This was done by reducing the effectiveness for 3 both men and women at different time points in the model. The only time self-management 4 was not cost effective was when no effectiveness difference between the interventions was 5 assumed for women at year 2, at year 3, and at year 5 in the model. The study was rated as 6 directly applicable because it is a UK study from the NHS perspective; it is a cost–utility 7 analysis and has relevant interventions. The quality was rated as having potentially serious 8 limitations because treatment effect was based on a single trial of only 12 months with the 9 effect extrapolated. Additionally, cardiovascular events were based on a risk equation that 10 was based on blood pressure rather than directly from a trial. This possibly overestimates the 11 treatment effect compared to other sources. The baseline risk calculator used is no longer 12 used in practice and is known to overestimate baseline risk. These 2 factors together imply 13 that the ICERs are possibly overestimating the cost effectiveness of the treatment. 14
Different methods of monitoring are associated with different costs and resource use. 15 Ambulatory monitoring involves having to purchase the expensive machine and staff being 16 trained to use it so that they can train people who need the device as well as interpret the 17 results that are sent automatically to the surgery. As monitoring is ongoing, unlike diagnosis, 18 then there is a resource impact to monitoring using ambulatory measurement because many 19 more machines will be needed, as only 1 person at a time can use a machine. Home 20 measurement also involves equipment being available for people who need the devices to 21 borrow although machines are not as expensive as ambulatory machines. Again, because of 22 the volume with which machines would be loaned for monitoring, more machines would be 23 needed at GP surgeries. The method of managing the person’s treatment based on the 24 home measurement will also have variable resource use involved; for example, the person 25 could be taught to self-titrate, or there is a telemonitoring component whereby the clinician 26 still oversees medication changes via phone discussion or is alerted to the person's 27 measurement results electronically somehow and contacts the person. Some of these 28 methods may require infrastructure set up for results to be automatically sent to the clinician 29 and involve training for staff as well as people who will use the devices. The final method is 30 clinic measurement. This is perhaps the most staff-intensive method of monitoring because 31 the person is required to attend a clinic and have a blood pressure measurement taken 32 whenever blood pressure needs to be checked, such as annually. Given the high prevalence 33 of hypertension, a lot of GP and nurse time is occupied with blood pressure monitoring. The 34 main costs involved are therefore the cost of monitors needed, and the cost of staff time 35 consulting with people or checking their blood pressure. 36
The goal of monitoring blood pressure is to capture changes in blood pressure accurately 37 that require treatment changes in order to avoid cardiovascular events. Additionally, 38 efficiency is important if ways to monitor can be found that reduce the use of staff time. The 39 different measurement methods themselves also have different accuracies, so this may 40 impact whether someone is correctly identified as having their blood pressure controlled or 41 not. 42
The clinical review identified many different monitoring methods for comparison. The 43 outcome data for cardiovascular events had to be interpreted with caution because the 44 studies were not powered to identify these endpoints. For home monitoring versus clinic 45 monitoring, there was some reduction in systolic blood pressure that favoured home 46 monitoring and also a slightly lower number of consultations in the home monitoring arm. For 47 home monitoring with telemonitoring versus clinic, there was also felt to be a clinically 48 beneficial reduction in systolic blood pressure favouring the home monitoring group. The 49 biggest changes in blood pressure were seen when pharmacist involvement was also added 50 to home monitoring. This was, however, considered to be a very intensive intervention 51 involving around 11 sessions of 30 minutes with a pharmacist over the period of the trial, 52 which would have large cost implications; the committee considered this unfeasible in 53

Hypertension in adults: DRAFT FOR CONSULTATION Monitoring blood pressure
© National Institute for Health and Care Excellence, 2019 36
practice. There was not felt to be any benefit of telemonitoring when compared directly to no 1 telemonitoring. 2
For the resource use outcomes of average daily dose or number of medications, it was 3 difficult to interpret these outcomes because more pills might also be a positive outcome if 4 they are needed to manage blood pressure. 5
The study that the included economic evaluation was based on was an intervention that 6 might be considered more intensive on the spectrum of home monitoring because people 7 were also managing their own medication and therefore received some education as well. 8 This might explain why this study showed a bigger impact on blood pressure reduction than 9 some of the other studies in the review. The individual patient data meta-analysis (IPD) 10 included in the review also showed that there was a positive correlation between the 11 magnitude of the blood pressure decrease and intensity of the intervention. This might be 12 explained because people feel more empowered if they are more in control of their own care 13 and thus perhaps more likely to adhere to treatment. Although the economic evaluation 14 showed that this intervention was cost effective, because it is self-management as a strategy 15 rather than just home monitoring, it is not fully applicable in supporting a recommendation on 16 home monitoring. 17
The committee felt that overall there was some evidence that home monitoring has a positive 18 impact on surrogate outcomes of blood pressure and on some resource use outcomes, 19 which led to them making a consider recommendation for home blood pressure monitoring, if 20 the person prefers. It was not thought possible to be more detailed on the type of home 21 monitoring, and this was left open. 22
Given this is a consider recommendation, the resource impact is uncertain; however, where it 23 would be implemented if it isn’t already, this would involve some staff training, patient 24 education, and investment in devices. Currently, around 30–40% of people have their own 25 home monitors although not all these people would use them for monitoring. It was also 26 discussed that around half of GP surgeries have the ability to loan home monitors. 27

Hypertension in adults: DRAFT FOR CONSULTATION Monitoring blood pressure
© National Institute for Health and Care Excellence, 2019 37
References 1
2
1. Abdoh AA, Krousel-Wood MA, Re RN. Accuracy of telemedicine in detecting 3 uncontrolled hypertension and its impact on patient management. Telemedicine 4 Journal and e-Health. 2003; 9(4):315-323 5
2. Aekplakorn W, Suriyawongpaisal P, Tansirisithikul R, Sakulpipat T, Charoensuk P. 6 Effectiveness of self-monitoring blood pressure in primary care: A randomized 7 controlled trial. Journal of Primary Care & Community Health. 2016; 7(2):58-64 8
3. Albasri A, O'Sullivan JW, Roberts NW, Prinjha S, McManus RJ, Sheppard JP. A 9 comparison of blood pressure in community pharmacies with ambulatory, home and 10 general practitioner office readings: Systematic review and meta-analysis. Journal of 11 Hypertension. 2017; 35(10):1919-1928 12
4. Anderegg MD, Gums TH, Uribe L, Coffey CS, James PA, Carter BL. Physician-13 pharmacist collaborative management: Narrowing the socioeconomic blood pressure 14 gap. Hypertension. 2016; 68(5):1314-1320 15
5. Anderson C, Dadabhai S, Damasceno A, Dzudie A, Islam SMS, Kamath D et al. 16 Home blood pressure management intervention in low- to middle-income countries: 17 Protocol for a mixed methods study. JMIR Research Protocols. 2017; 6(10):e188 18
6. Anonymous. Blood pressure less well controlled with home blood pressure 19 monitoring. Evidence-Based Healthcare and Public Health. 2004; 8(5):253-254 20
7. Antonicelli R, Partemi M, Spazzafumo L, Amadio L, Paciaroni E. Blood pressure self-21 measurement in the elderly: Differences between automatic and semi-automatic 22 systems. Journal of Human Hypertension. 1995; 9(4):229-31 23
8. Aoki Y, Asayama K, Ohkubo T, Nishimura T, Kikuya M, Metoki H et al. Progress 24 report on the HOMED-BP Study: Hypertension objective treatment based on 25 measurement by electrical devices of blood pressure study. Clinical and Experimental 26 Hypertension. 2004; 26(2):119-27 27
9. Artinian NT, Flack JM, Nordstrom CK, Hockman EM, Washington OG, Jen KL et al. 28 Effects of nurse-managed telemonitoring on blood pressure at 12-month follow-up 29 among urban African Americans. Nursing Research. 2007; 56(5):312-322 30
10. Artinian NT, Washington OG, Templin TN. Effects of home telemonitoring and 31 community-based monitoring on blood pressure control in urban African Americans: A 32 pilot study. Heart and Lung. 2001; 30(3):191-199 33
11. Asayama K, Ohkubo T, Hanazawa T, Watabe D, Hosaka M, Satoh M et al. Does 34 antihypertensive drug class affect day-to-day variability of self-measured home blood 35 pressure? The HOMED-BP Study. Journal of the American Heart Association. 2016; 36 5(3):e002995 37
12. Bailey B, Carney SL, Gillies AA, Smith AJ. Antihypertensive drug treatment: A 38 comparison of usual care with self blood pressure measurement. Journal of Human 39 Hypertension. 1999; 13(2):147-150 40
13. Bliziotis IA, Destounis A, Stergiou GS. Home versus ambulatory and office blood 41 pressure in predicting target organ damage in hypertension: A systematic review and 42 meta-analysis. Journal of Hypertension. 2012; 30(7):1289-99 43

Hypertension in adults: DRAFT FOR CONSULTATION Monitoring blood pressure
© National Institute for Health and Care Excellence, 2019 38
14. Bosworth HB, Olsen MK, Dudley T, Orr M, Neary A, Harrelson M et al. The Take 1 Control of Your Blood pressure (TCYB) study: Study design and methodology. 2 Contemporary Clinical Trials. 2007; 28(1):33-47 3
15. Bosworth HB, Olsen MK, Grubber JM, Neary AM, Orr MM, Powers BJ et al. Two self-4 management interventions to improve hypertension control: A randomized trial. 5 Annals of Internal Medicine. 2009; 151(10):687-95 6
16. Bosworth HB, Powers BJ, Olsen MK, McCant F, Grubber J, Smith V et al. Home 7 blood pressure management and improved blood pressure control: Results from a 8 randomized controlled trial. Archives of Internal Medicine. 2011; 171(13):1173-1180 9
17. Boubouchairopoulou N, Karpettas N, Athanasakis K, Kollias A, Protogerou AD, 10 Achimastos A et al. Cost estimation of hypertension management based on home 11 blood pressure monitoring alone or combined office and ambulatory blood pressure 12 measurements. Journal of the American Society of Hypertension. 2014; 8(10):732-8 13
18. Bray EP, Jones MI, Banting M, Greenfield S, Hobbs FD, Little P et al. Performance 14 and persistence of a blood pressure self-management intervention: Telemonitoring 15 and self-management in hypertension (TASMINH2) trial. Journal of Human 16 Hypertension. 2015; 29(7):436-441 17
19. Breaux-Shropshire TL, Judd E, Vucovich LA, Shropshire TS, Singh S. Does home 18 blood pressure monitoring improve patient outcomes? A systematic review comparing 19 home and ambulatory blood pressure monitoring on blood pressure control and 20 patient outcomes. Integrated Blood Pressure Control. 2015; 8:43-49 21
20. Brzozowska-Kiszka M, Rajzer M, Klocek M, Kawecka-Jaszcz K. Efficacy of home 22 blood pressure telemonitoring in treatment of patients with essential hypertension. 23 Nadcisnienie Tetnicze. 2010; 14(2):109-119 24
21. Carnahan JE, Nugent CA. The effects of self-monitoring by patients on the control of 25 hypertension. American Journal of the Medical Sciences. 1975; 269(1):69-73 26
22. Carter BL. Improving blood pressure control with physician/pharmacist collaboration. 27 Vnitrni Lekarstvi. 2009; 55(4):389-394 28
23. Carter BL, Ardery G, Dawson JD, James PA, Bergus GR, Doucette WR et al. 29 Physician and pharmacist collaboration to improve blood pressure control. Archives 30 of Internal Medicine. 2009; 169(21):1996-2002 31
24. Carter BL, Bergus GR, Dawson JD, Farris KB, Doucette WR, Chrischilles EA et al. A 32 cluster randomized trial to evaluate physician/pharmacist collaboration to improve 33 blood pressure control. Journal of Clinical Hypertension. 2008; 10(4):260-271 34
25. Castro MS, Fuchs FD, Santos MC, Maximiliano P, Gus M, Moreira LB et al. 35 Pharmaceutical care program for patients with uncontrolled hypertension. Report of a 36 double-blind clinical trial with ambulatory blood pressure monitoring. American 37 Journal of Hypertension. 2006; 19(5):528-533 38
26. Celis H, Den Hond E, Staessen JA. Self-measurement of blood pressure at home in 39 the management of hypertension. Clinical Medicine & Research. 2005; 3(1):19-26 40
27. Chabot I, Moisan J, Gregoire JP, Milot A. Pharmacist intervention program for control 41 of hypertension. Annals of Pharmacotherapy. 2003; 37(9):1186-1193 42
28. Chambers LW, Kaczorowski J, O'Rielly S, Ignagni S, Hearps SJ. Comparison of 43 blood pressure measurements using an automated blood pressure device in 44 community pharmacies and family physicians' offices: A randomized controlled trial. 45 CMAJ Open. 2013; 1(1):E37-42 46

Hypertension in adults: DRAFT FOR CONSULTATION Monitoring blood pressure
© National Institute for Health and Care Excellence, 2019 39
29. Chatellier G, Dutrey-Dupagne C, Vaur L, Zannad F, Genes N, Elkik F et al. Home self 1 blood pressure measurement in general practice: The SMART study. American 2 Journal of Hypertension. 1996; 9(7):644-652 3
30. Chen Z, Ernst ME, Ardery G, Xu Y, Carter BL. Physician-pharmacist co-management 4 and 24-hour blood pressure control. Journal of Clinical Hypertension. 2013; 5 15(5):337-343 6
31. Cochrane Handbook for Systematic Reviews of Interventions 5.0.2 [updated 7 September 2009]. Higgins J, Green S. The Cochrane Collaboration. 2009. Available 8 from: www.cochrane-handbook.org 9
32. Curtis L. Unit costs of health and social care 2014. Canterbury. Personal Social 10 Services Research Unit University of Kent, 2014. Available from: 11 http://www.pssru.ac.uk/project-pages/unit-costs/2014/index.php 12
33. Curtis L, Burns A. Unit costs of health and social care 2017. Canterbury. Personal 13 Social Services Research Unit University of Kent, 2017. Available from: 14 https://www.pssru.ac.uk/project-pages/unit-costs/unit-costs-2017/ 15
34. Dalfó i Baqué A, Capillas Peréz R, Guarch Rocarias M, Figueras Sabater M, Ylla-16 Català Passola A, Balañá Vilanova M et al. Effectiveness of self-measurement of 17 blood pressure in patients with hypertension: The Dioampa study. Atencion primaria / 18 Sociedad Espanola de Medicina de Familia y Comunitaria. 2005; 35(5):233-237 19
35. Davidson TM, McGillicuddy J, Mueller M, Brunner-Jackson B, Favella A, Anderson A 20 et al. Evaluation of an mHealth medication regimen self-management program for 21 African American and Hispanic uncontrolled hypertensives. Journal of personalized 22 medicine. 2015; 5(4):389-405 23
36. Dean SC, Kerry SM, Khong TK, Kerry SR, Oakeshott P. Evaluation of a specialist 24 nurse-led hypertension clinic with consultant backup in two inner city general 25 practices: Randomized controlled trial. Family Practice. 2014; 31(2):172-9 26
37. Doane J, Buu J, Jason Penrod M, Bischoff M, Conroy MB, Stults B. Measuring and 27 managing blood pressure in a primary care setting: A pragmatic implementation 28 study. The Journal of the American Board of Family Practice / American Board of 29 Family Practice. 2018; 31(3):375-388 30
38. Duan Y, Xie Z, Dong F, Wu Z, Lin Z, Sun N et al. Effectiveness of home blood 31 pressure telemonitoring: A systematic review and meta-analysis of randomised 32 controlled studies. Journal of Human Hypertension. 2017; 31(7):427-437 33
39. Earle KA, Istepanian RS, Zitouni K, Sungoor A, Tang B. Mobile telemonitoring for 34 achieving tighter targets of blood pressure control in patients with complicated 35 diabetes: A pilot study. Diabetes Technology & Therapeutics. 2010; 12(7):575-579 36
40. Earle KA, Taylor P, Wyatt S, Burnett S, Ray J. A physician-pharmacist model for the 37 surveillance of blood pressure in the community: A feasibility study. Journal of Human 38 Hypertension. 2001; 15(8):529-33 39
41. Fikri-Benbrahim N, Faus MJ, Martínez-Martínez F, Sabater-Hernández D. Impact of a 40 community pharmacists' hypertension-care service on medication adherence. The 41 AFenPA study. Research in Social and Administrative Pharmacy. 2013; 9(6):797-805 42
42. Franssen M, Farmer A, Grant S, Greenfield S, Heneghan C, Hobbs R et al. 43 Telemonitoring and/or self-monitoring of blood pressure in hypertension (TASMINH4): 44 Protocol for a randomised controlled trial. BMC Cardiovascular Disorders. 2017; 45 17:58 46

Hypertension in adults: DRAFT FOR CONSULTATION Monitoring blood pressure
© National Institute for Health and Care Excellence, 2019 40
43. Fuchs SC, Mello RG, Fuchs FC. Home blood pressure monitoring is better predictor 1 of cardiovascular disease and target organ damage than office blood pressure: A 2 systematic review and meta-analysis. Current Cardiology Reports. 2013; 15(11):413 3
44. Fujiwara T, Nishimura T, Ohkuko T, Imai Y. Rationale and design of HOMED-BP 4 Study: Hypertension objective treatment based on measurement by electrical devices 5 of blood pressure study. Blood Pressure Monitoring. 2002; 7(1):77-82 6
45. George J, McNamara K, Jackson S, Hughes J, Peterson G, Bailey M et al. The 7 HAPPY trial: A randomised controlled trial of a community pharmacy-based 8 intervention for improving patient adherence to antihypertensive medicines. 9 International Journal of Pharmacy Practice. 2010; 18:22-23 10
46. Green BB, Cook AJ, Ralston JD, Fishman PA, Catz SL, Carlson J et al. Effectiveness 11 of home blood pressure monitoring, Web communication, and pharmacist care on 12 hypertension control: A randomized controlled trial. JAMA. 2008; 299(24):2857-67 13
47. Halme L, Vesalainen R, Kaaja M, Kantola I. Self-monitoring of blood pressure 14 promotes achievement of blood pressure target in primary health care. American 15 Journal of Hypertension. 2005; 18(11):1415-1420 16
48. Hansen TW, Thijs L, Li Y, Boggia J, Liu Y, Asayama K et al. Ambulatory blood 17 pressure monitoring for risk stratification in obese and non-obese subjects from 10 18 populations. Journal of Human Hypertension. 2014; 28(9):535-42 19
49. He J, Irazola V, Mills KT, Poggio R, Beratarrechea A, Dolan J et al. Effect of a 20 community health worker-led multicomponent intervention on blood pressure control 21 in low-income patients in Argentina: A randomized clinical trial. JAMA. 2017; 22 318(11):1016-1025 23
50. Hebert PL, Sisk JE, Tuzzio L, Casabianca JM, Pogue VA, Wang JJ et al. Nurse-led 24 disease management for hypertension control in a diverse urban community: A 25 randomized trial. Journal of General Internal Medicine. 2012; 27(6):630-639 26
51. Heinemann M, Sellick K, Rickard C, Reynolds P, McGrail M. Automated versus 27 manual blood pressure measurement: A randomized crossover trial. International 28 Journal of Nursing Practice. 2008; 14(4):296-302 29
52. Hond E, Staessen JA, Celis H, Fagard R, Keary L, Vandenhoven G et al. 30 Antihypertensive treatment based on home or office blood pressure: The THOP trial. 31 Blood Pressure Monitoring. 2004; 9(6):311-314 32
53. Hosseininasab M, Jahangard-Rafsanjani Z, Mohagheghi A, Sarayani A, Rashidian A, 33 Javadi M et al. Self-monitoring of blood pressure for improving adherence to 34 antihypertensive medicines and blood pressure control: A randomized controlled trial. 35 American Journal of Hypertension. 2014; 27(11):1339-1345 36
54. Hunt JS, Siemienczuk J, Pape G, Rozenfeld Y, MacKay J, LeBlanc BH et al. A 37 randomized controlled trial of team-based care: Impact of physician-pharmacist 38 collaboration on uncontrolled hypertension. Journal of General Internal Medicine. 39 2008; 23(12):1966-1972 40
55. Irving G, Holden J, Stevens R, McManus RJ. Which cuff should I use? Indirect blood 41 pressure measurement for the diagnosis of hypertension in patients with obesity: A 42 diagnostic accuracy review. BMJ Open. 2016; 6(11):e012429 43
56. Jegatheswaran J, Ruzicka M, Hiremath S, Edwards C. Are automated blood pressure 44 monitors comparable to ambulatory blood pressure monitors? A systematic review 45 and meta-analysis. Canadian Journal of Cardiology. 2017; 33(5):644-652 46

Hypertension in adults: DRAFT FOR CONSULTATION Monitoring blood pressure
© National Institute for Health and Care Excellence, 2019 41
57. Jones MI, Greenfield SM, Bray EP, Hobbs FR, Holder R, Little P et al. Patient self-1 monitoring of blood pressure and self-titration of medication in primary care: The 2 TASMINH2 trial qualitative study of health professionals' experiences. British Journal 3 of General Practice. 2013; 63(611):e378-85 4
58. Kaambwa B, Bryan S, Jowett S, Mant J, Bray EP, Hobbs FD et al. Telemonitoring 5 and self-management in the control of hypertension (TASMINH2): A cost-6 effectiveness analysis. European Journal of Preventive Cardiology. 2014; 7 21(12):1517-30 8
59. Kaambwa B, Bryan S, Mant J, Bray EP, Holder R, Jones M. Randomised controlled 9 trial of telemonitoring and self management in the control of hypertension: 10 Telemonitoring and self management in hypertension (TASMINH2): Economic 11 analysis. Journal of Hypertension. 2010; 28(e-Suppl A):e281-2 12
60. Kaihara T, Eguchi K, Kario K. Home BP monitoring using a telemonitoring system is 13 effective for controlling BP in a remote island in Japan. Journal of Clinical 14 Hypertension. 2014; 16(11):814-819 15
61. Kawano Y, Horio T, Kamide K, Iwashima Y, Yoshihara F, Nakamura S. Blood 16 pressure and medication during long-term antihypertensive therapy based on 17 morning home SBP in hypertensive patients: Hypertension Control Based on Home 18 Systolic Pressure (HOSP) substudy. Clinical and Experimental Hypertension. 2010; 19 32(4):239-243 20
62. Kerby TJ, Asche SE, Maciosek MV, O'Connor PJ, Sperl-Hillen JM, Margolis KL. 21 Adherence to blood pressure telemonitoring in a cluster-randomized clinical trial. 22 Journal of Clinical Hypertension. 2012; 14(10):668-674 23
63. Kerry SM, Markus HS, Khong TK, Cloud GC, Tulloch J, Coster D et al. Home blood 24 pressure monitoring with nurse-led telephone support among patients with 25 hypertension and a history of stroke: A community-based randomized controlled trial. 26 CMAJ : Canadian Medical Association journal. 2013; 185(1):23-31 27
64. Kim JY, Wineinger NE, Steinhubl SR. The influence of wireless self-monitoring 28 program on the relationship between patient activation and health behaviors, 29 medication adherence, and blood pressure levels in hypertensive patients: A 30 substudy of a randomized controlled trial. Journal of Medical Internet Research. 2016; 31 18(6):e116 32
65. Kim YN, Shin DG, Park S, Lee CH. Randomized clinical trial to assess the 33 effectiveness of remote patient monitoring and physician care in reducing office blood 34 pressure. Hypertension Research. 2015; 38(7):491-497 35
66. Kind P, Dolan P, Gudex C, Williams A. Variations in population health status: results 36 from a United Kingdom national questionnaire survey. BMJ. 1998; 316(7133):736-741 37
67. Kushiro T, Kario K, Saito I, Teramukai S, Sato Y, Okuda Y et al. Increased 38 cardiovascular risk of treated white coat and masked hypertension in patients with 39 diabetes and chronic kidney disease: The HONEST Study. Hypertension Research. 40 2017; 40(1):87-95 41
68. Law MR, Morris JK, Wald NJ. Use of blood pressure lowering drugs in the prevention 42 of cardiovascular disease: Meta-analysis of 147 randomised trials in the context of 43 expectations from prospective epidemiological studies. BMJ. 2009; 338:b1665 44
69. Logan AG, Irvine MJ, McIsaac WJ, Tisler A, Rossos PG, Easty A et al. Effect of home 45 blood pressure telemonitoring with self-care support on uncontrolled systolic 46 hypertension in diabetics. Hypertension. 2012; 60(1):51-57 47

Hypertension in adults: DRAFT FOR CONSULTATION Monitoring blood pressure
© National Institute for Health and Care Excellence, 2019 42
70. Lorgelly P, Siatis I, Brooks A, Slinn B, Millar-Craig MW, Donnelly R et al. Is 1 ambulatory blood pressure monitoring cost-effective in the routine surveillance of 2 treated hypertensive patients in primary care? British Journal of General Practice. 3 2003; 53(495):794-6 4
71. Maciejewski ML, Bosworth HB, Olsen MK, Smith VA, Edelman D, Powers BJ et al. 5 Do the benefits of participation in a hypertension self-management trial persist after 6 patients resume usual care? Circulation: Cardiovascular Quality and Outcomes. 7 2014; 7(2):269-275 8
72. Madsen LB, Christiansen T, Kirkegaard P, Pedersen EB. Economic evaluation of 9 home blood pressure telemonitoring: A randomized controlled trial. Blood Pressure. 10 2011; 20(2):117-125 11
73. Madsen LB, Kirkegaard P, Pedersen EB. Health-related quality of life (SF-36) during 12 telemonitoring of home blood pressure in hypertensive patients: A randomized, 13 controlled study. Blood Pressure. 2008; 17(4):227-232 14
74. Magid DJ, Olson KL, Billups SJ, Wagner NM, Lyons EE, Kroner BA. A pharmacist-15 led, American Heart Association Heart360 Web-enabled home blood pressure 16 monitoring program. Circulation: Cardiovascular Quality and Outcomes. 2013; 17 6(2):157-163 18
75. Margolis KL, Asche SE, Bergdall AR, Dehmer SP, Groen SE, Kadrmas HM et al. 19 Effect of home blood pressure telemonitoring and pharmacist management on blood 20 pressure control: A cluster randomized clinical trial. JAMA. 2013; 310(1):46-56 21
76. Margolis KL, Kerby TJ, Asche SE, MacIosek MV, Meyers PJ, Sperl-Hillen JM et al. 22 Home blood pressure telemonitoring and case management to control hypertension: 23 Hyperlink design, baseline characteristics, and intervention adherence. Journal of 24 Clinical Hypertension. 2010; 12(Suppl 1):A81-A2 25
77. Martinez MA, Garcia-Puig J, Loeches MP, Mateo MC, Utiel I, Torres R et al. Home 26 blood pressure vs. clinic blood pressure measurement-based follow up in type II 27 diabetics: Effect on 24-h ambulatory BP and albuminuria. Randomised trial. Medicina 28 Clínica. 2017; 150(11):413-20 29
78. McKinstry B, Hanley J, Wild S, Pagliari C, Paterson M, Lewis S et al. Telemonitoring 30 based service redesign for the management of uncontrolled hypertension: Multicentre 31 randomised controlled trial. BMJ. 2013; 346:f3030 32
79. McManus RJ, Bray EP, Mant J, Holder R, Greenfield S, Bryan S et al. Protocol for a 33 randomised controlled trial of telemonitoring and self-management in the control of 34 hypertension: Telemonitoring and self-management in hypertension. BMC 35 Cardiovascular Disorders. 2009; 9:6 36
80. McManus RJ, Mant J, Bray EP, Holder R, Jones MI, Greenfield S et al. 37 Telemonitoring and self-management in the control of hypertension (TASMINH2): A 38 randomised controlled trial. The Lancet. 2010; 376(9736):163-172 39
81. McManus RJ, Mant J, Franssen M, Nickless A, Schwartz C, Hodgkinson J et al. 40 Efficacy of self-monitored blood pressure, with or without telemonitoring, for titration 41 of antihypertensive medication (TASMINH4): an unmasked randomised controlled 42 trial. The Lancet. 2018; 391(10124):949-59 43
82. McManus RJ, Mant J, Haque MS, Bray EP, Bryan S, Greenfield SM et al. Effect of 44 self-monitoring and medication self-titration on systolic blood pressure in hypertensive 45 patients at high risk of cardiovascular disease: The TASMIN-SR randomized clinical 46 trial. JAMA. 2014; 312(8):799-808 47

Hypertension in adults: DRAFT FOR CONSULTATION Monitoring blood pressure
© National Institute for Health and Care Excellence, 2019 43
83. McManus RJ, Mant J, Roalfe A, Oakes RA, Bryan S, Pattison HM et al. Targets and 1 self monitoring in hypertension: Randomised controlled trial and cost effectiveness 2 analysis. BMJ. 2005; 331(7515):493-496 3
84. Myers MG, Godwin M, Dawes M, Kiss A, Tobe SW, Kaczorowski J. Conventional 4 versus automated measurement of blood pressure in the office (CAMBO) trial. Family 5 Practice. 2012; 29(4):376-382 6
85. Myers MG, Godwin M, Dawes M, Kiss A, Tobe SW, Kaczorowski J. The conventional 7 versus automated measurement of blood pressure in the office (CAMBO) trial: 8 Masked hypertension sub-study. Journal of Hypertension. 2012; 30(10):1937-1941 9
86. Nakao N, Seno H, Kasuga H, Toriyama T, Kawahara H, Fukagawa M. Effects of 10 combination treatment with losartan and trandolapril on office and ambulatory blood 11 pressures in non-diabetic renal disease: A COOPERATE-ABP substudy. American 12 Journal of Nephrology. 2004; 24(5):543-548 13
87. National Collaborating Centre for Primary Care. Lipid modification: cardiovascular risk 14 assessment and the modification of blood lipids for the primary and secondary 15 prevention of cardiovascular disease. NICE clinical guideline 67. London. Royal 16 College of General Practitioners, 2008. Available from: 17 http://guidance.nice.org.uk/CG67 18
88. National Institute for Health and Care Excellence. Developing NICE guidelines: the 19 manual. London. National Institute for Health and Care Excellence, 2014. Available 20 from: 21 http://www.nice.org.uk/article/PMG20/chapter/1%20Introduction%20and%20overview 22
89. NHS Supply Chain Catalogue. NHS Supply Chain, 2014. Available from: 23 http://www.supplychain.nhs.uk/ 24
90. Niiranen TJ, Hanninen MR, Johansson J, Reunanen A, Jula AM. Home-measured 25 blood pressure is a stronger predictor of cardiovascular risk than office blood 26 pressure: The Finn-Home study. Hypertension. 2010; 55(6):1346-51 27
91. O'Brien C, Bray EP, Bryan S, Greenfield SM, Haque MS, Hobbs FD et al. Targets 28 and self-management for the control of blood pressure in stroke and at risk groups 29 (TASMIN-SR): Protocol for a randomised controlled trial. BMC Cardiovascular 30 Disorders. 2013; 13:21 31
92. O'Brien E, Mee F, Atkins N, Thomas M. Evaluation of three devices for self-32 measurement of blood pressure according to the revised British Hypertension Society 33 Protocol: The Omron HEM-705CP, Philips HP5332, and Nissei DS-175. Blood 34 Pressure Monitoring. 1996; 1(1):55-61 35
93. Ogedegbe G, Chaplin W. A randomized controlled trial of the effect of home blood 36 pressure monitoring versus usual care on medication adherence in ambulatory 37 hypertensive patients. Journal of General Internal Medicine. 2005; 20(Suppl 1):60 38
94. Omboni S, Ferrari R. The role of telemedicine in hypertension management: Focus 39 on blood pressure telemonitoring. Current Hypertension Reports. 2015; 17(4):535 40
95. Omboni S, Gazzola T, Carabelli G, Parati G. Clinical usefulness and cost 41 effectiveness of home blood pressure telemonitoring: Meta-analysis of randomized 42 controlled studies. Journal of Hypertension. 2013; 31(3):455-67; discussion 467-8 43
96. Omboni S, Guarda A. Impact of home blood pressure telemonitoring and blood 44 pressure control: A meta-analysis of randomized controlled studies. American Journal 45 of Hypertension. 2011; 24(9):989-98 46

Hypertension in adults: DRAFT FOR CONSULTATION Monitoring blood pressure
© National Institute for Health and Care Excellence, 2019 44
97. Onzenoort HA, Verberk WJ, Kroon AA, Kessels AG, Neef C, Kuy PH et al. Electronic 1 monitoring of adherence, treatment of hypertension, and blood pressure control. 2 American Journal of Hypertension. 2012; 25(1):54-59 3
98. Onzenoort HA, Verberk WJ, Kroon AA, Kessels AG, Nelemans PJ, Kuy PH et al. 4 Effect of self-measurement of blood pressure on adherence to treatment in patients 5 with mild-to-moderate hypertension. Journal of Hypertension. 2010; 28(3):622-627 6
99. Parati G, Omboni S, Albini F, Piantoni L, Giuliano A, Revera M et al. Home blood 7 pressure telemonitoring improves hypertension control in general practice: The 8 TeleBPCare study. Journal of Hypertension. 2009; 27(1):198-203 9
100. Parati G, Omboni S, Compare A, Grossi E, Callus E, Venco A et al. Blood pressure 10 control and treatment adherence in hypertensive patients with metabolic syndrome: 11 Protocol of a randomized controlled study based on home blood pressure 12 telemonitoring vs. conventional management and assessment of psychological 13 determinants of adherence (TELEBPMET Study). Trials. 2013; 14:22 14
101. Parati G, Omboni S, Mancia G. Difference between office and ambulatory blood 15 pressure and response to antihypertensive treatment. Journal of Hypertension. 1996; 16 14(6):791-797 17
102. Penaloza-Ramos MC, Jowett S, Mant J, Schwartz C, Bray EP, Sayeed Haque M et 18 al. Cost-effectiveness of self-management of blood pressure in hypertensive patients 19 over 70 years with suboptimal control and established cardiovascular disease or 20 additional cardiovascular risk diseases (TASMIN-SR). European Journal of 21 Preventive Cardiology. 2016; 23(9):902-12 22
103. Piper MA, Evans CV, Burda BU, Margolis KL, O'Connor E, Whitlock EP. Diagnostic 23 and predictive accuracy of blood pressure screening methods with consideration of 24 rescreening intervals: A systematic review for the U.S. Preventive Services Task 25 Force. Annals of Internal Medicine. 2015; 162(3):192-204 26
104. Poteshkina NG, Beloglazova IP, Mogutova PA. Blood pressure 24-hour monitoring in 27 assessment of aortic stiffness in older patients with arterial hypertension. Russian 28 Journal of Cardiology. 2015; 120(4):27-31 29
105. Qi L, Qiu Y, Zhang W. Home blood pressure monitoring is a useful measurement for 30 patients with hypertension: A long-term follow-up study. Biomedical Research (India). 31 2017; 28(7):2898-2902 32
106. Ragot S, Genes N, Vaur L, Herpin D. Comparison of three blood pressure 33 measurement methods for the evaluation of two antihypertensive drugs: Feasibility, 34 agreement, and reproducibility of blood pressure response. American Journal of 35 Hypertension. 2000; 13(6 Pt 1):632-9 36
107. Ralston JD, Cook AJ, Anderson ML, Catz SL, Fishman PA, Carlson J et al. Home 37 blood pressure monitoring, secure electronic messaging and medication 38 intensification for improving hypertension control: A mediation analysis. Applied 39 Clinical Informatics. 2014; 5(1):232-48 40
108. Reboldi G, Angeli F, Simone G, Staessen JA, Verdecchia P. Tight versus standard 41 blood pressure control in patients with hypertension with and without cardiovascular 42 disease. Hypertension. 2014; 63(3):475-482 43
109. Rifkin DE, Abdelmalek JA, Miracle CM, Low C, Barsotti R, Rios P et al. Linking clinic 44 and home: A randomized, controlled clinical effectiveness trial of real-time, wireless 45 blood pressure monitoring for older patients with kidney disease and hypertension. 46 Blood Pressure Monitoring. 2013; 18(1):8-15 47

Hypertension in adults: DRAFT FOR CONSULTATION Monitoring blood pressure
© National Institute for Health and Care Excellence, 2019 45
110. Rodriguez Roca GC, Alonso Moreno FJ, Garcia Jimenez A, Hidalgo Vega A, Llisterri 1 Caro JL, Barrios Alonso V et al. Cost-effectiveness of ambulatory blood pressure 2 monitoring in the follow-up of hypertension. Blood Pressure. 2006; 15(1):27-36 3
111. Rogers MA, Buchan DA, Small D, Stewart CM, Krenzer BE. Telemedicine improves 4 diagnosis of essential hypertension compared with usual care. Journal of 5 Telemedicine and Telecare. 2002; 8(6):344-9 6
112. Rogers MA, Small D, Buchan DA, Butch CA, Stewart CM, Krenzer BE et al. Home 7 monitoring service improves mean arterial pressure in patients with essential 8 hypertension. A randomized, controlled trial. Annals of Internal Medicine. 2001; 9 134(11):1024-1032 10
113. Santschi V, Chiolero A, Colosimo AL, Platt RW, Taffe P, Burnier M et al. Improving 11 blood pressure control through pharmacist interventions: A meta-analysis of 12 randomized controlled trials. Journal of the American Heart Association. 2014; 13 3:e000718 14
114. Schrader J, Lüders S, Züchner C, Herbold M, Schrandt G. Practice vs ambulatory 15 blood pressure measurement under treatment with ramipril (PLUR Study): A 16 randomised, prospective long-term study to evaluate the benefits of ABPM in patients 17 on antihypertensive treatment. Journal of Human Hypertension. 2000; 14(7):435-440 18
115. Schroeder K, Fahey T, Ebrahim S. Interventions for improving adherence to 19 treatment in patients with high blood pressure in ambulatory settings. Cochrane 20 Database of Systematic Reviews 2004, Issue 3. Art. No.: CD004804. DOI: 21 https://dx.doi.org/10.1002/14651858.CD004804. 22
116. Sharman JE, Marwick TH, Abhayaratna WP, Stowasser M. Rationale and design of a 23 randomized study to determine the value of central Blood Pressure for GUIDing 24 managEment of hypertension: The BP GUIDE study. American Heart Journal. 2012; 25 163(5):761-767 26
117. Simpson SH, Majumdar SR, Tsuyuki RT, Lewanczuk RZ, Spooner R, Johnson JA. 27 Effect of adding pharmacists to primary care teams on blood pressure control in 28 patients with type 2 diabetes: A randomized controlled trial. Diabetes Care. 2011; 29 34(1):20-6 30
118. Smith SM, Carris NW, Dietrich E, Gums JG, Uribe L, Coffey CS et al. Physician-31 pharmacist collaboration versus usual care for treatment-resistant hypertension. 32 Journal of the American Society of Hypertension. 2016; 10(4):307-317 33
119. Soghikian K, Casper SM, Fireman BH, Hunkeler EM, Hurley LB, Tekawa IS et al. 34 Home blood pressure monitoring. Effect on use of medical services and medical care 35 costs. Medical Care. 1992; 30(9):855-65 36
120. Spieker C, Zidek W, Vetter H, Rahn KH. Ambulatory 24-h blood pressure monitoring 37 in essential hypertensives treated with the angiotensin-converting enzyme inhibitor 38 ramipril. Journal of International Medical Research. 1991; 19(1):39-43 39
121. Spruill TM, Williams O, Teresi JA, Lehrer S, Pezzin L, Waddy SP et al. Comparative 40 effectiveness of home blood pressure telemonitoring (HBPTM) plus nurse case 41 management versus HBPTM alone among Black and Hispanic stroke survivors: 42 Study protocol for a randomized controlled trial. Trials. 2015; 16:97 43
122. Staessen JA, Byttebier G, Buntinx F, Celis H, O'Brien ET, Fagard R et al. 44 Antihypertensive treatment based on conventional or ambulatory blood pressure 45 measurement. A randomized controlled trial. JAMA. 1997; 278(13):1065-1072 46

Hypertension in adults: DRAFT FOR CONSULTATION Monitoring blood pressure
© National Institute for Health and Care Excellence, 2019 46
123. Staessen JA, Den Hond E, Celis H, Fagard R, Keary L, Vandenhoven G et al. 1 Antihypertensive treatment based on blood pressure measurement at home or in the 2 physician's office: A randomized controlled trial. JAMA. 2004; 291(8):955-964 3
124. Stahl SM, Kelley CR, Neill PJ, Grim CE, Mamlin J. Effects of home blood pressure 4 measurement on long-term BP control. American Journal of Public Health. 1984; 5 74(7):704-709 6
125. Stergiou GS, Bliziotis IA. Home blood pressure monitoring in the diagnosis and 7 treatment of hypertension: A systematic review. American Journal of Hypertension. 8 2011; 24(2):123-34 9
126. Stergiou GS, Karpettas N, Destounis A, Tzamouranis D, Nasothimiou E, Kollias A et 10 al. Home blood pressure monitoring alone vs. combined clinic and ambulatory 11 measurements in following treatment-induced changes in blood pressure and organ 12 damage. American Journal of Hypertension. 2014; 27(2):184-192 13
127. Stewart K, George J, Namara KP, Jackson SL, Peterson GM, Bereznicki LR et al. A 14 multifaceted pharmacist intervention to improve antihypertensive adherence: A 15 cluster-randomized, controlled trial (HAPPy trial). Journal of Clinical Pharmacy and 16 Therapeutics. 2014; 39(5):527-534 17
128. Stoddart A, Hanley J, Wild S, Pagliari C, Paterson M, Lewis S et al. Telemonitoring-18 based service redesign for the management of uncontrolled hypertension (HITS): 19 Cost and cost-effectiveness analysis of a randomised controlled trial. BMJ Open. 20 2013; 3(5):e002681 21
129. Torres A, Fite B, Gascon P, Barau M, Guayta-Escolies R, Estrada-Campmany M et 22 al. Effectiveness of a pharmaceutical care program in the improvement of blood 23 pressure monitoring in poorly controlled hypertensive patients. PressFarm Study. 24 Hipertension y Riesgo Vascular. 2010; 27(1):13-22 25
130. Tucker KL, Sheppard JP, Stevens R, Bosworth HB, Bove A, Bray EP et al. Self-26 monitoring of blood pressure in hypertension: A systematic review and individual 27 patient data meta-analysis. PLoS Medicine. 2017; 14(9):e1002389 28
131. Tucker KL, Sheppard JP, Stevens R, Bosworth HB, Bove A, Bray EP et al. Individual 29 patient data meta-analysis of self-monitoring of blood pressure (BP-SMART): A 30 protocol. BMJ Open. 2015; 5(9):e008532 31
132. Uhlig K, Patel K, Ip S, Kitsios GD, Balk EM. Self-measured blood pressure monitoring 32 in the management of hypertension: A systematic review and meta-analysis. Annals 33 of Internal Medicine. 2013; 159(3):185-94 34
133. Ulm K, Huntgeburth U, Gnahn H, Briesenick C, Pürner K, Middeke M. Effect of an 35 intensive nurse-managed medical care programme on ambulatory blood pressure in 36 hypertensive patients. Archives of Cardiovascular Diseases. 2010; 103(3):142-149 37
134. van der Wel MC, Buunk IE, van Weel C, Thien TA, Bakx JC. A novel approach to 38 office blood pressure measurement: 30-minute office blood pressure vs daytime 39 ambulatory blood pressure. Annals of Family Medicine. 2011; 9(2):128-35 40
135. Varis J, Kantola I. The choice of home blood pressure result reporting method is 41 essential: Results mailed to physicians did not improve hypertension control 42 compared with ordinary office-based blood pressure treatment. Blood Pressure. 43 2010; 19(5):319-24 44
136. Verberk WJ, Kessels AG, Thien T. Telecare is a valuable tool for hypertension 45 management, a systematic review and meta-analysis. Blood Pressure Monitoring. 46 2011; 16(3):149-55 47

Hypertension in adults: DRAFT FOR CONSULTATION Monitoring blood pressure
© National Institute for Health and Care Excellence, 2019 47
137. Verberk WJ, Kroon AA, Kessels AG, Dirksen C, Nelemans PJ, Lenders JW et al. 1 Home versus Office blood pressure MEasurements: Reduction of Unnecessary 2 treatment Study: Rationale and study design of the HOMERUS trial. Blood Pressure. 3 2003; 12(5-6):326-333 4
138. Verberk WJ, Kroon AA, Lenders JW, Kessels AG, van Montfrans GA, Smit AJ et al. 5 Self-measurement of blood pressure at home reduces the need for antihypertensive 6 drugs: A randomized, controlled trial. Hypertension. 2007; 50(6):1019-1025 7
139. Verdecchia P, Angeli F, Gentile G, Reboldi G. More versus less intensive blood 8 pressure-lowering strategy: Cumulative evidence and trial sequential analysis. 9 Hypertension. 2016; 68(3):642-53 10
140. Vollmer WM, Appel LJ, Svetkey LP, Moore TJ, Vogt TM, Conlin PR et al. Comparing 11 office-based and ambulatory blood pressure monitoring in clinical trials. Journal of 12 Human Hypertension. 2005; 19(1):77-82 13
141. Wakefield BJ, Holman JE, Ray A, Scherubel M, Adams MR, Hillis SL et al. 14 Effectiveness of home telehealth in comorbid diabetes and hypertension: A 15 randomized, controlled trial. Telemedicine Journal and e-Health. 2011; 17(4):254-261 16
142. Wakefield BJ, Holman JE, Ray A, Scherubel M, Adams MR, Hills SL et al. Outcomes 17 of a home telehealth intervention for patients with diabetes and hypertension. 18 Telemedicine Journal and e-Health. 2012; 18(8):575-579 19
143. Wakefield BJ, Koopman RJ, Keplinger LE, Bomar M, Bernt B, Johanning JL et al. 20 Effect of home telemonitoring on glycemic and blood pressure control in primary care 21 clinic patients with diabetes. Telemedicine Journal and e-Health. 2014; 20(3):199-205 22
144. Wang J, Wu J, Yang J, Zhuang Y, Chen J, Qian W et al. Effects of pharmaceutical 23 care interventions on blood pressure and medication adherence of patients with 24 primary hypertension in China. Clinical Research and Regulatory Affairs. 2011; 25 28(1):1-6 26
145. Weber CA, Ernst ME, Sezate GS, Zheng S, Carter BL. Pharmacist-physician 27 comanagement of hypertension and reduction in 24-hour ambulatory blood 28 pressures. Archives of Internal Medicine. 2010; 170(18):1634-1639 29
146. Xu L, Fang WY, Zhu F, Zhang HG, Liu K. A coordinated PCP-Cardiologist 30 Telemedicine Model (PCTM) in China's community hypertension care: Study protocol 31 for a randomized controlled trial. Trials. 2017; 18(1):236 32
147. Yatabe MS, Yatabe J, Asayama K, Staessen JA, Mujaj B, Thijs L et al. The rationale 33 and design of reduction of uncontrolled hypertension by Remote Monitoring and 34 Telemedicine (REMOTE) study. Blood Pressure. 2018; 27(2):99-105 35
148. Yates G. Adjustment of antihypertensive medication using home based, patient 36 monitored blood pressure reduced both intensity of treatment and blood pressure 37 control. Evidence-Based Nursing. 2004; 7(3):80 38
149. Zarnke KB. Hypertension management using home blood pressure monitors and 39 patient-initiated drug dosage adjustments: A randomized equivalence trial. London, 40 Ontario. The University of Western Ontario. 1998. Masters of Science 41
150. Zarnke KB, Feagan BG, Mahon JL, Feldman RD. A randomized study comparing a 42 patient-directed hypertension management strategy with usual office-based care. 43 American Journal of Hypertension. 1997; 10(1):58-67 44

Hypertension in adults: DRAFT FOR CONSULTATION Monitoring blood pressure
© National Institute for Health and Care Excellence, 2019 48
151. Zhao PX, Wang C, Qin L, Xiao Q, Guo YH, Wen AD. Effect of clinical pharmacist's 1 pharmaceutical care intervention to control hypertensive outpatients in China. African 2 Journal of Pharmacy and Pharmacology. 2012; 6(1):48-56 3
4

Hypertension in adults: DRAFT FOR CONSULTATION Monitoring blood pressure
© National Institute for Health and Care Excellence, 2019 49
Appendices 1
Appendix A: Review protocols 2
Table 13: Review protocol: Monitoring 3
Field Content
Review question In adults with treated primary hypertension, what is the best method of measuring blood pressure (home, ambulatory or clinic measurement) to assess the response to treatment and prevent cardiovascular events?
Type of review question Intervention review
A review of health economic evidence related to the same review question was conducted in parallel with this review. For details, see the health economic review protocol for this NICE guideline.
Objective of the review The aim of this review is to assess which is the best method of measuring blood pressure (home, ambulatory or clinic measurement) to assess the response to treatment and prevent cardiovascular events in adults aged 18 years or older with treated primary hypertension.
Eligibility criteria – population / disease / condition / issue / domain
Population: Adults (over 18 years) with treated primary hypertension
Eligibility criteria – intervention(s) / exposure(s) / prognostic factor(s)
Different methods of measuring blood pressure followed by appropriate treatment* based on the blood pressure measurement (test plus treatment):
• HBPM without telemonitoring
• HBPM with telemonitoring
• ABPM
• CBPM
• Pharmacy measurement
Stratify results by:
• Upper arm cuff
• Wrist cuff
• Non-oscillometric
* All participants in the study should be receiving the same treatment
Eligibility criteria – comparator(s) / control or reference (gold) standard
Compared against each other
Outcomes and prioritisation
All outcomes to be measured at a minimum of 12 months. Where multiple time points are reported within each study, the longest time point only will be extracted.
Critical
• All-cause mortality
• Health-related quality of life
• Stroke (ischaemic or haemorrhagic)
• Myocardial infarction
Important
• Reduction in clinic BP

Hypertension in adults: DRAFT FOR CONSULTATION Monitoring blood pressure
© National Institute for Health and Care Excellence, 2019 50
• Proportion of people controlled to a target
• Average daily dose of antihypertensive medication
• Average number of visits
• Side effect 1: Intolerance to device
• Side effect 2: Hypotension (dizziness)
• [Combined cardiovascular disease outcomes in the absence of MI and stroke data]
• [Coronary heart disease outcome in the absence of MI data]
Eligibility criteria – study design
RCTs and SRs
Non-randomised studies in the absence of RCT and SR evidence
Other inclusion exclusion criteria
Minimum follow up time: 1 year
Exclusions:
• Studies including participants with type 1 diabetes or chronic kidney disease (A3 or above [heavy proteinuria]).
• Indirect populations with secondary causes of hypertension such as tumours or structural vascular defects (Conn’s adenoma, phaeochromocytoma, renovascular hypertension)
• Pregnant women
• Crossover trials
• Children (younger than 18 years)
• Studies with a population of inpatients
Proposed sensitivity / subgroup analysis, or meta-regression
Subgroups in the presence of heterogeneity:
• Age (75 as a cut off)*
• Presence or absence of type 2 diabetes
• Family origin(African and Caribbean, White, South Asian)
• Severity (stage 1 [BP 140-59/90-99] versus moderate stage 2 to severe [BP 160/100])
*To note that we will also extract evidence in those aged 80 years and older if this evidence is reported separately.
Selection process – duplicate screening / selection / analysis
A senior research fellow will undertake quality assurance prior to completion.
Data management (software)
Pairwise meta-analyses will be performed using Cochrane Review Manager (RevMan5).
GRADEpro will be used to assess the quality of evidence for each outcome.
Endnote will be used for bibliography, citations, sifting and reference management.
Information sources – databases and dates
Medline, Embase, the Cochrane Library
Language: Restrict to English only
Key paper:
• SR Tucker 2017: Self-monitoring of blood pressure in hypertension: A systematic review and individual patient data meta-analysis
• Uhlig 2013: Self-Measured Blood Pressure Monitoring in the Management of hypertension. A Systematic Review and Meta-analysis
• Omboni 2013: Clinical usefulness and cost effectiveness of home blood pressure telemonitoring: meta-analysis of randomized controlled studies
Identify if an update Yes, 2011
Author contacts https://www.nice.org.uk/guidance/cg127

Hypertension in adults: DRAFT FOR CONSULTATION Monitoring blood pressure
© National Institute for Health and Care Excellence, 2019 51
Highlight if amendment to previous protocol
For details, please see section 4.5 of Developing NICE guidelines: the manual.
Search strategy – for 1 database
For details, please see appendix B
Cut off of 2000
Data collection process – forms / duplicate
A standardised evidence table format will be used, and published as appendix D of the evidence report.
Data items – define all variables to be collected
For details, please see evidence tables in Appendix D (clinical evidence tables) or H (health economic evidence tables).
Methods for assessing bias at outcome / study level
Standard study checklists were used to appraise individual studies critically. For details please see section 6.2 of Developing NICE guidelines: the manual
The risk of bias across all available evidence was evaluated for each outcome using an adaptation of the ‘Grading of Recommendations Assessment, Development and Evaluation (GRADE) toolbox’ developed by the international GRADE working group http://www.gradeworkinggroup.org/
Criteria for quantitative synthesis
For details, please see section 6.4 of Developing NICE guidelines: the manual.
Methods for quantitative analysis – combining studies and exploring (in)consistency
For details, please see the separate Methods report for this guideline.
Meta-bias assessment – publication bias, selective reporting bias
For details, please see section 6.2 of Developing NICE guidelines: the manual.
Confidence in cumulative evidence
For details, please see sections 6.4 and 9.1 of Developing NICE guidelines: the manual.
Rationale / context – what is known
For details, please see the introduction to the evidence review.
Describe contributions of authors and guarantor
A multidisciplinary committee developed the evidence review. The committee was convened by the National Guideline Centre (NGC) and chaired by Anthony Wierzbicki in line with section 3 of Developing NICE guidelines: the manual.
Staff from the NGC undertook systematic literature searches, appraised the evidence, conducted meta-analysis and cost-effectiveness analysis where appropriate, and drafted the evidence review in collaboration with the committee. For details, please see Developing NICE guidelines: the manual.
Sources of funding / support
The NGC is funded by NICE and hosted by the Royal College of Physicians.
Name of sponsor The NGC is funded by NICE and hosted by the Royal College of Physicians.
Roles of sponsor NICE funds the NGC to develop guidelines for those working in the NHS, public health and social care in England.
PROSPERO registration number
CRD42018087407
Table 14: Health economic review protocol 1
Review question
All questions – health economic evidence
Objectives To identify health economic studies relevant to any of the review questions.
Search criteria
• Populations, interventions and comparators must be as specified in the clinical review protocol above.

Hypertension in adults: DRAFT FOR CONSULTATION Monitoring blood pressure
© National Institute for Health and Care Excellence, 2019 52
• Studies must be of a relevant health economic study design (cost–utility analysis, cost-effectiveness analysis, cost–benefit analysis, cost–consequences analysis, comparative cost analysis).
• Studies must not be a letter, editorial or commentary, or a review of health economic evaluations. (Recent reviews will be ordered although not reviewed. The bibliographies will be checked for relevant studies, which will then be ordered.)
• Unpublished reports will not be considered unless submitted as part of a call for evidence.
• Studies must be in English.
Search strategy
A health economic study search will be undertaken using population-specific terms and a health economic study filter – see appendix B below. No date cut-off from the previous guideline was used.
Review strategy
Studies not meeting any of the search criteria above will be excluded. Studies published before 2002, abstract-only studies and studies from non-OECD countries or the US will also be excluded.
Studies published after 2002 that were included in the previous guideline(s) will be reassessed for inclusion and may be included or selectively excluded based on their relevance to the questions covered in this update and whether more applicable evidence is also identified.
Each remaining study will be assessed for applicability and methodological limitations using the NICE economic evaluation checklist which can be found in appendix H of Developing NICE guidelines: the manual (2014).88
Inclusion and exclusion criteria
• If a study is rated as both ‘Directly applicable’ and with ‘Minor limitations’, then it will be included in the guideline. A health economic evidence table will be completed and it will be included in the health economic evidence profile.
• If a study is rated as either ‘Not applicable’ or with ‘Very serious limitations’, then it will usually be excluded from the guideline. If it is excluded then a health economic evidence table will not be completed and it will not be included in the health economic evidence profile.
• If a study is rated as ‘Partially applicable’, with ‘Potentially serious limitations’ or both, then there is discretion over whether it should be included.
Where there is discretion
The health economist will make a decision based on the relative applicability and quality of the available evidence for that question in discussion with the guideline committee if required. The ultimate aim is to include health economic studies that are helpful for decision-making in the context of the guideline and the current NHS setting. If several studies are considered of sufficiently high applicability and methodological quality that they could all be included, then the health economist, in discussion with the committee if required, may decide to include only the most applicable studies and to exclude selectively the remaining studies. All studies excluded based on applicability or methodological limitations will be listed with explanation in the excluded health economic studies appendix below.
The health economist will be guided by the following hierarchies.
Setting:
• UK NHS (most applicable).
• OECD countries with predominantly public health insurance systems (for example, France, Germany, Sweden).
• OECD countries with predominantly private health insurance systems (for example, Switzerland).
• Studies set in non-OECD countries or in the US will be excluded before being assessed for applicability and methodological limitations.

Hypertension in adults: DRAFT FOR CONSULTATION Monitoring blood pressure
© National Institute for Health and Care Excellence, 2019 53
Health economic study type:
• Cost–utility analysis (most applicable).
• Other type of full economic evaluation (cost–benefit analysis, cost-effectiveness analysis, cost–consequences analysis).
• Comparative cost analysis.
• Non-comparative cost analyses including cost-of-illness studies will be excluded before being assessed for applicability and methodological limitations.
Year of analysis:
• The more recent the study, the more applicable it will be.
• Studies published in 2002 or later (including any such studies included in the previous guideline[s]) but that depend on unit costs and resource data entirely or predominantly before 2002 will be rated as ‘Not applicable’.
• Studies published before 2002 (including any such studies included in the previous guideline[s]) will be excluded before being assessed for applicability and methodological limitations.
Quality and relevance of effectiveness data used in the health economic analysis:
• The more closely the clinical effectiveness data used in the health economic analysis match with the outcomes of the studies included in the clinical review, the more useful the analysis will be for decision-making in the guideline.
• Generally, economic evaluations based on excludes from the clinical review will be excluded.
1

Hypertension in adults: DRAFT FOR CONSULTATION Monitoring blood pressure
© National Institute for Health and Care Excellence, 2019 54
Appendix B: Literature search strategies 1
The literature searches for this review are detailed below and complied with the methodology 2 outlined in Developing NICE guidelines: the manual 2014, updated 2017. 3
For more detailed information, please see the Methodology Review. 4
B.1 Clinical search literature search strategy 5
Searches were constructed using a PICO framework where population (P) terms were 6 combined with Intervention (I) and in some cases Comparison (C) terms. Outcomes (O) are 7 rarely used in search strategies for interventions as these concepts may not be well 8 described in title, abstract or indexes and therefore difficult to retrieve. Search filters were 9 applied to the search where appropriate. 10
Table 15: Database date parameters and filters used 11
Database Dates searched Search filter used
Medline (OVID) 1946–02 October 2018
Exclusions
Randomised controlled trials
Systematic review studies
Observational studies
Diagnostic tests studies
Embase (OVID) 1974–02 October 2018
Exclusions
Randomised controlled trials
Systematic review studies
Observational studies
Diagnostic tests studies
Prognostic studies
Qualitative studies
The Cochrane Library (Wiley) Cochrane Reviews to Issue 8 of 12, August 2018
CENTRAL to Issue 7 of 12, July 2018
DARE and NHSEED to Issue 2 of 4, April 2015
HTA to Issue 4 of 4, October 2016
None
Table 16: Medline (Ovid) search terms 12
1. exp Hypertension/
2. hypertens*.ti,ab.
3. (elevat* adj2 blood adj pressur*).ti,ab.
4. (high adj blood adj pressur*).ti,ab.
5. (increase* adj2 blood pressur*).ti,ab.
6. ((systolic or diastolic or arterial) adj2 pressur*).ti,ab.
7. or/1-6
8. exp pregnancy/
9. exp Hypertension, Pregnancy-Induced/ not exp Hypertension/
10. (pre eclampsia or pre-eclampsia or preeclampsia).ti,ab.
11. exp Hypertension, Portal/ not exp Hypertension/
12. exp Hypertension, Pulmonary/ not exp Hypertension/

Hypertension in adults: DRAFT FOR CONSULTATION Monitoring blood pressure
© National Institute for Health and Care Excellence, 2019 55
13. exp Intracranial Hypertension/ not exp Hypertension/
14. exp Ocular Hypertension/ not exp Hypertension/
15. exp Diabetes Mellitus, Type 1/ not exp Diabetes Mellitus, Type 2/
16. or/8-15
17. 7 not 16
18. letter/
19. editorial/
20. news/
21. exp historical article/
22. Anecdotes as Topic/
23. comment/
24. case report/
25. (letter or comment*).ti.
26. or/18-25
27. randomized controlled trial/ or random*.ti,ab.
28. 26 not 27
29. animals/ not humans/
30. exp Animals, Laboratory/
31. exp Animal Experimentation/
32. exp Models, Animal/
33. exp Rodentia/
34. (rat or rats or mouse or mice).ti.
35. or/28-34
36. 17 not 35
37. (exp child/ or exp pediatrics/ or exp infant/) not (exp adolescent/ or exp adult/ or exp middle age/ or exp aged/)
38. 36 not 37
39. limit 38 to English language
40. exp Blood Pressure Determination/
41. Blood Pressure Monitoring, Ambulatory/
42. ((ambulatory or home or self or office or clinic or surgery or pharmac* or telemonitor* or daytime or 12 hour or 24 hour or continuous) adj3 (blood pressure* or BP)).ti,ab.
43. (ABPM or HBPM).ti,ab.
44. Blood Pressure Monitors/
45. exp Sphygmomanometers/
46. ((blood pressure or BP) adj3 (monitor* or meter* or device*)).ti,ab.
47. ((arm* or wrist* or cuff or non cuff or automatic or electronic or digital or wireless or remote) adj3 (monitor* or meter* or measur*)).ti,ab.
48. sphygmomanometer*.ti,ab.
49. or/40-47
50. 39 and 49
51. randomized controlled trial.pt.
52. controlled clinical trial.pt.
53. randomi#ed.ti,ab.
54. placebo.ab.
55. randomly.ti,ab.
56. Clinical Trials as topic.sh.
57. trial.ti.

Hypertension in adults: DRAFT FOR CONSULTATION Monitoring blood pressure
© National Institute for Health and Care Excellence, 2019 56
58. or/51-57
59. Meta-Analysis/
60. exp Meta-Analysis as Topic/
61. (meta analy* or metanaly* or metaanaly* or meta regression).ti,ab.
62. ((systematic* or evidence*) adj3 (review* or overview*)).ti,ab.
63. (reference list* or bibliograph* or hand search* or manual search* or relevant journals).ab.
64. (search strategy or search criteria or systematic search or study selection or data extraction).ab.
65. (search* adj4 literature).ab.
66. (medline or pubmed or cochrane or embase or psychlit or psyclit or psychinfo or psycinfo or cinahl or science citation index or bids or cancerlit).ab.
67. cochrane.jw.
68. ((multiple treatment* or indirect or mixed) adj2 comparison*).ti,ab.
69. or/59-68
70. Epidemiologic studies/
71. Observational study/
72. exp Cohort studies/
73. (cohort adj (study or studies or analys* or data)).ti,ab.
74. ((follow up or observational or uncontrolled or non randomi#ed or epidemiologic*) adj (study or studies or data)).ti,ab.
75. ((longitudinal or retrospective or prospective or cross sectional) and (study or studies or review or analys* or cohort* or data)).ti,ab.
76. Controlled Before-After Studies/
77. Historically Controlled Study/
78. Interrupted Time Series Analysis/
79. (before adj2 after adj2 (study or studies or data)).ti,ab.
80. or/70-79
81. exp case control study/
82. case control*.ti,ab.
83. or/81-82
84. 80 or 83
85. Cross-sectional studies/
86. (cross sectional and (study or studies or review or analys* or cohort* or data)).ti,ab.
87. or/85-86
88. 80 or 87
89. 80 or 83 or 87
90. exp "sensitivity and specificity"/
91. (sensitivity or specificity).ti,ab.
92. ((pre test or pretest or post test) adj probability).ti,ab.
93. (predictive value* or PPV or NPV).ti,ab.
94. likelihood ratio*.ti,ab.
95. likelihood function/
96. ((area under adj4 curve) or AUC).ti,ab.
97. (receive* operat* characteristic* or receive* operat* curve* or ROC curve*).ti,ab.
98. (diagnos* adj3 (performance* or accurac* or utilit* or value* or efficien* or effectiveness)).ti,ab.
99. gold standard.ab.

Hypertension in adults: DRAFT FOR CONSULTATION Monitoring blood pressure
© National Institute for Health and Care Excellence, 2019 57
100. or/90-99
101. comparative study.pt.
102. 50 and (58 or 69 or 89 or 100) or (50 and 101)
Table 17: Embase (Ovid) search terms 1
1. exp Hypertension/
2. hypertens*.ti,ab.
3. (elevat* adj2 blood adj pressur*).ti,ab.
4. (high adj blood adj pressur*).ti,ab.
5. (increase* adj2 blood pressur*).ti,ab.
6. ((systolic or diastolic or arterial) adj2 pressur*).ti,ab.
7. or/1-6
8. exp pregnancy/
9. exp Maternal Hypertension/
10. (pre eclampsia or pre-eclampsia or preeclampsia).ti,ab.
11. exp Hypertension, Portal/ not exp Hypertension/
12. exp Hypertension, Pulmonary/ not exp Hypertension/
13. exp Intracranial Hypertension/
14. exp Ocular Hypertension/ not exp Hypertension/
15. exp Diabetes Mellitus, Type 1/ not exp Diabetes Mellitus, Type 2/
16. or/8-15
17. 7 not 16
18. letter.pt. or letter/
19. note.pt.
20. editorial.pt.
21. case report/ or case study/
22. (letter or comment*).ti.
23. or/18-22
24. randomized controlled trial/ or random*.ti,ab.
25. 23 not 24
26. animal/ not human/
27. nonhuman/
28. exp Animal Experiment/
29. exp Experimental Animal/
30. animal model/
31. exp Rodent/
32. (rat or rats or mouse or mice).ti.
33. or/25-32
34. 17 not 33
35. (exp child/ or exp pediatrics/) not (exp adult/ or exp adolescent/)
36. 34 not 35
37. limit 36 to English language
38. blood pressure measurement/
39. *blood pressure monitoring/
40. ((ambulatory or home or self or office or clinic or surgery or pharmac* or telemonitor* or daytime or 12 hour or 24 hour or continuous) adj3 (blood pressure* or BP)).ti,ab.
41. (ABPM or HBPM).ti,ab.

Hypertension in adults: DRAFT FOR CONSULTATION Monitoring blood pressure
© National Institute for Health and Care Excellence, 2019 58
42. exp blood pressure monitor/
43. exp blood pressure meter/
44. exp Sphygmomanometer/
45. ((blood pressure or BP) adj3 (monitor* or meter* or device*)).ti,ab.
46. ((blood pressure or BP) adj measur*).ti,ab.
47. ((arm* or wrist* or cuff or non cuff or automatic or electronic or digital or wireless or remote) adj3 (monitor* or meter* or measur*)).ti,ab.
48. sphygmomanometer*.ti,ab.
49. or/38-47
50. 37 and 49
51. random*.ti,ab.
52. factorial*.ti,ab.
53. (crossover* or cross over*).ti,ab.
54. ((doubl* or singl*) adj blind*).ti,ab.
55. (assign* or allocat* or volunteer* or placebo*).ti,ab.
56. crossover procedure/
57. single blind procedure/
58. randomized controlled trial/
59. double blind procedure/
60. or/51-59
61. systematic review/
62. meta-analysis/
63. (meta analy* or metanaly* or metaanaly* or meta regression).ti,ab.
64. ((systematic* or evidence*) adj3 (review* or overview*)).ti,ab.
65. (reference list* or bibliograph* or hand search* or manual search* or relevant journals).ab.
66. (search strategy or search criteria or systematic search or study selection or data extraction).ab.
67. (search* adj4 literature).ab.
68. (medline or pubmed or cochrane or embase or psychlit or psyclit or psychinfo or psycinfo or cinahl or science citation index or bids or cancerlit).ab.
69. cochrane.jw.
70. ((multiple treatment* or indirect or mixed) adj2 comparison*).ti,ab.
71. or/61-70
72. Clinical study/
73. Observational study/
74. family study/
75. longitudinal study/
76. retrospective study/
77. prospective study/
78. cohort analysis/
79. follow-up/
80. cohort*.ti,ab.
81. 79 and 80
82. (cohort adj (study or studies or analys* or data)).ti,ab.
83. ((follow up or observational or uncontrolled or non randomi#ed or epidemiologic*) adj (study or studies or data)).ti,ab.

Hypertension in adults: DRAFT FOR CONSULTATION Monitoring blood pressure
© National Institute for Health and Care Excellence, 2019 59
84. ((longitudinal or retrospective or prospective or cross sectional) and (study or studies or review or analys* or cohort* or data)).ti,ab.
85. (before adj2 after adj2 (study or studies or data)).ti,ab.
86. or/72-78,81-85
87. exp case control study/
88. case control*.ti,ab.
89. or/87-88
90. 86 or 89
91. cross-sectional study/
92. (cross sectional and (study or studies or review or analys* or cohort* or data)).ti,ab.
93. or/91-92
94. 86 or 93
95. 86 or 89 or 93
96. exp "sensitivity and specificity"/
97. (sensitivity or specificity).ti,ab.
98. ((pre test or pretest or post test) adj probability).ti,ab.
99. (predictive value* or PPV or NPV).ti,ab.
100. likelihood ratio*.ti,ab.
101. ((area under adj4 curve) or AUC).ti,ab.
102. (receive* operat* characteristic* or receive* operat* curve* or ROC curve*).ti,ab.
103. (diagnos* adj3 (performance* or accurac* or utilit* or value* or efficien* or effectiveness)).ti,ab.
104. diagnostic accuracy/
105. diagnostic test accuracy study/
106. gold standard.ab.
107. or/96-106
108. comparative study.pt.
109. 50 and (60 or 71 or 95 or 107) or (50 and 108)
Table 18: Cochrane Library (Wiley) search terms 1
#1. MeSH descriptor: [Hypertension] explode all trees
#2. hypertens*:ti,ab
#3. (elevat* near/2 blood next pressur*):ti,ab
#4. (high near/1 blood near/1 pressur*):ti,ab
#5. (increase* near/2 blood pressur*):ti,ab
#6. ((systolic or diastolic or arterial) near/2 pressur*):ti,ab
#7. (or #1 or #6)
#8. MeSH descriptor: [Blood Pressure Determination] explode all trees
#9. MeSH descriptor: [Blood Pressure Monitoring, Ambulatory] explode all trees
#10. ((ambulatory or home or self or office or clinic or surgery or pharmac* or telemonitor* or daytime or 12 hour or 24 hour or continuous) near/3 (blood pressure* or BP)):ti,ab
#11. (ABPM or HBPM):ti,ab
#12. MeSH descriptor: [Blood Pressure Monitors] this term only
#13. MeSH descriptor: [Sphygmomanometers] explode all trees
#14. ((blood pressure or BP) near/3 (monitor* or meter* or device*)):ti,ab
#15. ((arm* or wrist* or cuff or non cuff or automatic or electronic or digital or wireless or remote) near/3 (monitor* or meter* or measur*)):ti,ab
#16. sphygmomanometer*:ti,ab
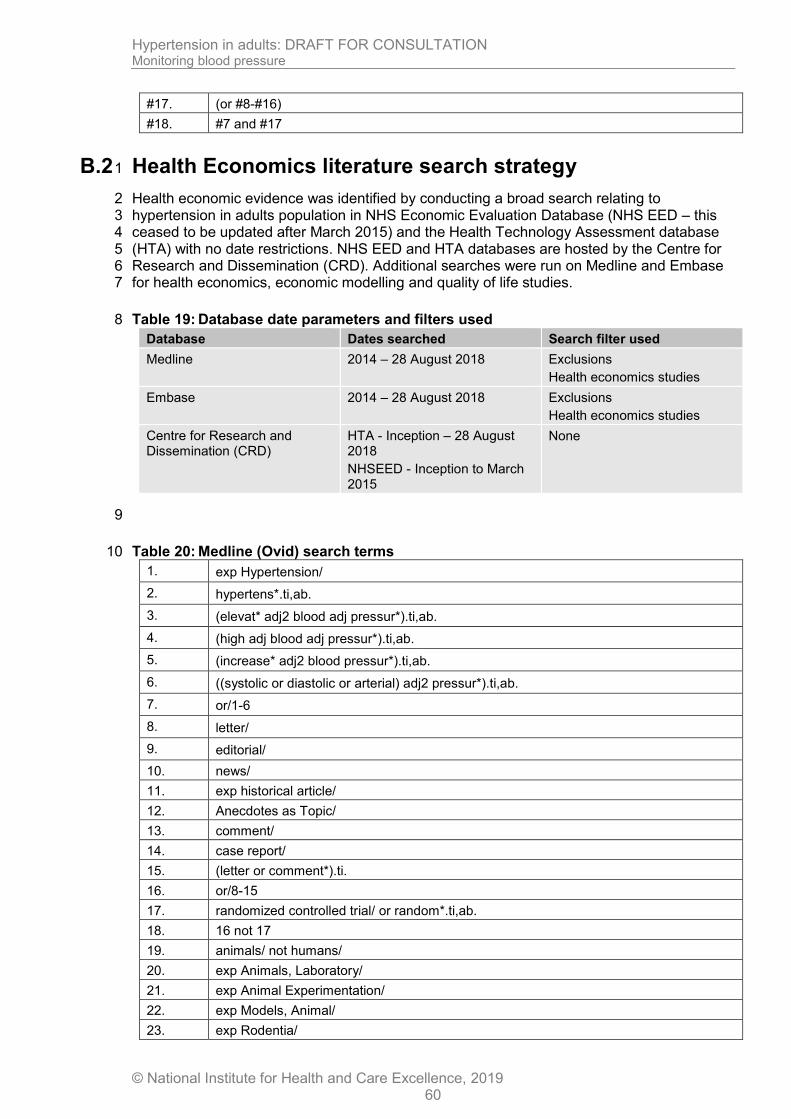
Hypertension in adults: DRAFT FOR CONSULTATION Monitoring blood pressure
© National Institute for Health and Care Excellence, 2019 60
#17. (or #8-#16)
#18. #7 and #17
B.2 Health Economics literature search strategy 1
Health economic evidence was identified by conducting a broad search relating to 2 hypertension in adults population in NHS Economic Evaluation Database (NHS EED – this 3 ceased to be updated after March 2015) and the Health Technology Assessment database 4 (HTA) with no date restrictions. NHS EED and HTA databases are hosted by the Centre for 5 Research and Dissemination (CRD). Additional searches were run on Medline and Embase 6 for health economics, economic modelling and quality of life studies. 7
Table 19: Database date parameters and filters used 8
Database Dates searched Search filter used
Medline 2014 – 28 August 2018
Exclusions
Health economics studies
Embase 2014 – 28 August 2018
Exclusions
Health economics studies
Centre for Research and Dissemination (CRD)
HTA - Inception – 28 August 2018
NHSEED - Inception to March 2015
None
9
Table 20: Medline (Ovid) search terms 10
1. exp Hypertension/
2. hypertens*.ti,ab.
3. (elevat* adj2 blood adj pressur*).ti,ab.
4. (high adj blood adj pressur*).ti,ab.
5. (increase* adj2 blood pressur*).ti,ab.
6. ((systolic or diastolic or arterial) adj2 pressur*).ti,ab.
7. or/1-6
8. letter/
9. editorial/
10. news/
11. exp historical article/
12. Anecdotes as Topic/
13. comment/
14. case report/
15. (letter or comment*).ti.
16. or/8-15
17. randomized controlled trial/ or random*.ti,ab.
18. 16 not 17
19. animals/ not humans/
20. exp Animals, Laboratory/
21. exp Animal Experimentation/
22. exp Models, Animal/
23. exp Rodentia/

Hypertension in adults: DRAFT FOR CONSULTATION Monitoring blood pressure
© National Institute for Health and Care Excellence, 2019 61
24. (rat or rats or mouse or mice).ti.
25. or/18-24
26. 7 not 25
27. limit 26 to English language
28. Economics/
29. Value of life/
30. exp "Costs and Cost Analysis"/
31. exp Economics, Hospital/
32. exp Economics, Medical/
33. Economics, Nursing/
34. Economics, Pharmaceutical/
35. exp "Fees and Charges"/
36. exp Budgets/
37. budget*.ti,ab.
38. cost*.ti.
39. (economic* or pharmaco?economic*).ti.
40. (price* or pricing*).ti,ab.
41. (cost* adj2 (effective* or utilit* or benefit* or minimi* or unit* or estimat* or variable*)).ab.
42. (financ* or fee or fees).ti,ab.
43. (value adj2 (money or monetary)).ti,ab.
44. or/28-43
45. 27 and 44
Table 21: Embase (Ovid) search terms 1
1. exp Hypertension/
2. hypertens*.ti,ab.
3. (elevat* adj2 blood adj pressur*).ti,ab.
4. (high adj blood adj pressur*).ti,ab.
5. (increase* adj2 blood pressur*).ti,ab.
6. ((systolic or diastolic or arterial) adj2 pressur*).ti,ab.
7. or/1-6
8. letter.pt. or letter/
9. note.pt.
10. editorial.pt.
11. case report/ or case study/
12. (letter or comment*).ti.
13. or/8-12
14. randomized controlled trial/ or random*.ti,ab.
15. 13 not 14
16. animal/ not human/
17. nonhuman/
18. exp Animal Experiment/
19. exp Experimental Animal/
20. animal model/
21. exp Rodent/

Hypertension in adults: DRAFT FOR CONSULTATION Monitoring blood pressure
© National Institute for Health and Care Excellence, 2019 62
22. (rat or rats or mouse or mice).ti.
23. or/15-22
24. 7 not 23
25. limit 24 to English language
26. health economics/
27. exp economic evaluation/
28. exp health care cost/
29. exp fee/
30. budget/
31. funding/
32. budget*.ti,ab.
33. cost*.ti.
34. (economic* or pharmaco?economic*).ti.
35. (price* or pricing*).ti,ab.
36. (cost* adj2 (effective* or utilit* or benefit* or minimi* or unit* or estimat* or variable*)).ab.
37. (financ* or fee or fees).ti,ab.
38. (value adj2 (money or monetary)).ti,ab.
39. or/26-38
40. 25 and 39
Table 22: NHS EED and HTA (CRD) search terms 1
#1. MeSH DESCRIPTOR Hypertension EXPLODE ALL TREES IN NHSEED,HTA
#2. (Hypertens*) IN NHSEED, HTA
#3. (elevat* adj2 blood adj pressur*) IN NHSEED, HTA
#4. (high adj blood adj pressur*) IN NHSEED, HTA
#5. (increase* adj2 blood pressur*) IN NHSEED, HTA
#6. ((systolic or diastolic or arterial) adj2 pressur*) IN NHSEED, HTA
#7. #1 OR #2 OR #3 OR #4 OR #5 OR #6

Hypertension in adults: DRAFT FOR CONSULTATION Monitoring blood pressure
© National Institute for Health and Care Excellence, 2019 63
Appendix C: Clinical evidence selection 1
Figure 1: Flow chart of clinical study selection for the review of monitoring
2
Records screened, n=27,418
Records excluded, n=27,282
Papers included in review, n=8
Papers excluded from review, n=128 Reasons for exclusion: see appendix I
Records identified through database searching, n=27,418
Additional records identified through other sources, n=0
Full-text papers assessed for eligibility, n=136

Mon
itorin
g b
lood p
ressure
Hyp
erte
nsio
n in
adu
lts: D
RA
FT
FO
R C
ON
SU
LT
AT
ION
© N
atio
nal In
stitu
te fo
r He
alth
an
d C
are
Exce
llence
, 201
9
64
Appendix D: Clinical evidence tables 1
Study Green 200846
Study type RCT (Patient randomised; Parallel)
Number of studies (number of participants) (n=778)
Countries and setting Conducted in the US; Setting: This study is being conducted at 10 Group Health-owned primary care medical centres in the Puget Sound Region.
Line of therapy Adjunctive to current care
Duration of study Intervention time: 12 months
Method of assessment of guideline condition
Adequate method of assessment/diagnosis
Stratum Upper arm cuff
Subgroup analysis within study Not applicable
Inclusion criteria Potential subjects aged 25–75 and continuously enrolled in Group Health for at least 1 year were identified through administrative data sources. They must not only have a diagnosis of hypertension through an outpatient diagnostic code but also be currently taking antihypertensive medications.
Exclusion criteria Automated data are also used to exclude people who have heart disease (ischemic or valvular heart disease or arrhythmias), diabetes, renal failure, dementia, serious psychiatric disorders (for example, schizophrenia), treatment with chemotherapeutic, immunosuppressant, or antiretroviral agents, or hospitalization within 3 months. Those pregnant or planning either to move away from the area or to change health plans in the next 12 months were excluded.
Recruitment/selection of people Those eligible based on automated data were sent recruitment letters to introduce the study. The research assistants then called potential participants to confirm eligibility, including the ability to use a computer in English, regular access to the Web, an e-mail address, and medication coverage that lets them refill prescriptions at Group Health (most Group Health members have all these).
Age, sex and family origin Age - Mean (SD): 59.1 (8.5). Sex (M:F): 406 female, 372 male. Family origin: 644 White, 61 Black, 29 Asian and 44 other
Indirectness of population Serious indirectness: Usual care comparison not in protocol
Interventions (n=258) Intervention 1: Clinic/office measurement. Usual care without self-monitoring. They were told their BP was not in control and were encouraged to work with their physician to improve it. Duration 12 months. Concurrent medication/care: Not applicable. Indirectness: Serious indirectness; Indirectness comment: Usual care not stated in protocol

Mon
itorin
g b
lood p
ressu
re
Hyp
erte
nsio
n in
adu
lts: D
RA
FT
FO
R C
ON
SU
LT
AT
ION
© N
atio
nal In
stitu
te fo
r He
alth
an
d C
are
Exce
llence
, 201
9
65
(n=259) Intervention 2: Home measurement with telemonitoring - Home measurement with telemonitoring. People assigned to active interventions were first given a home BP monitor (the validated OmronHem-705-CP); with the cuff size based on upper arm measurements and training on its use, demonstrating that they could use it without help. They were instructed to use this monitor to check their BP at least 2 days per week with 2 measurements each time. They were told the goal for average home systolic and diastolic BP was 135 and 85 mmHg or less, respectively, and lower than the goal for clinic measurements for systolic and diastolic BP of less than 140 and 90 mmHg (based on observational data demonstrating that BP readings in individuals tend to be about 5 mmHg lower when taken at home) Second, they received training on how to use the website. They received a tour of the different utilities (secure e-mail, refilling medications, viewing portions of their medical record, use of the health library, and links to Group Health and community resources for lifestyle and behavioural change). After the initial training, the second opaque envelope was opened and people assigned to home BP monitoring and Web training only were told that their BP was not controlled and advised to work with their physician to improve this. They were given the following verbal and written instructions: As a participant in Group 2, you have 2 additional resources (the home BP monitor and MyGroupHealth) to help manage your high blood pressure. We encourage you to use the MyGroupHealth website. It gives you access to a suite of online services so you can e-mail your doctor, refill prescriptions, request appointments, get test results, and look up health information. Sending a message to your provider on MyGroupHealth is an easy way to report your home BP readings. Duration 12 months. Concurrent medication/care: Not applicable. Indirectness: Serious indirectness (n=261) Intervention 3: Home measurement with telemonitoring - Home measurement with telemonitoring. Home monitoring with telemonitoring and pharmacist care - Those assigned to home BP monitoring and web training plus pharmacist care were told a pharmacist would be assisting them to improve their BP control via home BP monitoring and web communications. The pharmacist welcomed the person to the study with a secure message and informed the person’s physician of his or her participation with a staff message. The pharmacist also arranged a time for 1 planned telephone visit to obtain a more detailed medication history and review allergies, intolerances, and cardiovascular risk factors. At the end of the telephone call, the pharmacist introduced the person to the action plan. Pharmacists responded with specific recommendations (including medication changes) and people were encouraged to provide feedback and collaboratively change the action plan. Duration 12 months. Concurrent medication/care: Not applicable. Indirectness: Serious indirectness
Funding Academic or government funding (This research was funded by grant R01-HL075263 from the National Heart, Lung, and Blood Institute of the National Institutes of Health and by the Electronic Communications and Blood Pressure Monitoring)

Mon
itorin
g b
lood p
ressure
Hyp
erte
nsio
n in
adu
lts: D
RA
FT
FO
R C
ON
SU
LT
AT
ION
© N
atio
nal In
stitu
te fo
r He
alth
an
d C
are
Exce
llence
, 201
9
66
RESULTS (NUMBERS ANALYSED) AND RISK OF BIAS FOR COMPARISON: USUAL CARE versus HOME MEASUREMENT WITH TELEMONITORING Protocol outcome 1: All-cause mortality at longest reported - Actual outcome for Upper arm cuff: Mortality at 12 months; Group 1: 0/247, Group 2: 2/246; Comments: Died of cancer-related complications. Risk of bias: All domain - High, Selection - Low, Blinding - Low, Incomplete outcome data - Low, Outcome reporting - High, Measurement - Low, Crossover - Low, Subgroups - Low; Indirectness of outcome: No indirectness; Group 1 Number missing: 13, Reason: 8 withdrew, 1 could not be contacted, 2 missed visit, 2 died; Group 2 Number missing: 11, Reason: 4 withdrew, 1 refused, 2 could not be contacted, 3 moved, 1 - other Protocol outcome 2: Health-related quality of life at longest reported - Actual outcome for Upper arm cuff: QoL - general health at 12 months: Group 1: mean 66.7 (SD 20.4); n=247, Group 2: mean 66.6 (SD 20.9); n=246 Risk of bias: All domain - High, Selection - Low, Blinding - High, Incomplete outcome data - Low, Outcome reporting - Low, Measurement - Low, Crossover - Low, Subgroups - Low; Indirectness of outcome: No indirectness; Group 1 Number missing: 13, Reason: 8 withdrew, 1 could not be contacted, 2 missed visit, 2 died; Group 2 Number missing: 11, Reason: 4 withdrew, 1 refused, 2 could not be contacted, 3 moved, 1 - other - Actual outcome for Upper arm cuff: QoL - physical health at 12 months: Group 1: mean 78.1 (SD 27.7); n=247, Group 2: mean 77.7 (SD 30.3); n=246 Risk of bias: All domain - High, Selection - Low, Blinding - High, Incomplete outcome data - Low, Outcome reporting - Low, Measurement - Low, Crossover - Low, Subgroups - Low; Indirectness of outcome: No indirectness; Group 1 Number missing: 13, Reason: 8 withdrew, 1 could not be contacted, 2 missed visit, 2 died; Group 2 Number missing: 11, Reason: 4 withdrew, 1 refused, 2 could not be contacted, 3 moved, 1 - other - Actual outcome for Upper arm cuff: QoL - emotional health at 12 months: Group 1: mean 71.5 (SD 17.7); n=247, Group 2: mean 72.1 (SD 16.8); n=246 Risk of bias: All domain - High, Selection - Low, Blinding - High, Incomplete outcome data - Low, Outcome reporting - Low, Measurement - Low, Crossover - Low, Subgroups - Low; Indirectness of outcome: No indirectness; Group 1 Number missing: 13, Reason: 8 withdrew, 1 could not be contacted, 2 missed visit, 2 died; Group 2 Number missing: 11, Reason: 4 withdrew, 1 refused, 2 could not be contacted, 3 moved, 1 - other Protocol outcome 3: Myocardial infarction at longest reported - Actual outcome for Upper arm cuff: Non-fatal cardiovascular events at 12 months at 12 months: Group 1: 2/247, Group 2: 4/246 Risk of bias: All domain - High, Selection - Low, Blinding - Low, Incomplete outcome data - Low, Outcome reporting - High, Measurement - Low, Crossover - Low, Subgroups - Low; Indirectness of outcome: No indirectness; Group 1 Number missing: 13, Reason: 8 withdrew, 1 could not be contacted, 2 missed visit, 2 died; Group 2 Number missing: 11, Reason: 4 withdrew, 1 refused, 2 could not be contacted, 3 moved, 1 - other Protocol outcome 4: Reduction in clinic blood pressure at longest reported - Actual outcome for Upper arm cuff: change in blood pressure, systolic, 12 months at 12 months: Group 1: mean -5.3 (SD 14.33); n=247, Group 2: mean -8.2 (SD 14.36); n=246 Risk of bias: All domain - Low, Selection - Low, Blinding - Low, Incomplete outcome data - Low, Outcome reporting - Low, Measurement - Low, Crossover - Low, Subgroups - Low; Indirectness of outcome: No indirectness; Group 1 Number missing: 13, Reason: 8 withdrew, 1 could not be contacted, 2 missed visit, 2 died; Group 2 Number missing: 11, Reason: 4 withdrew, 1 refused, 2 could not be contacted, 3 moved, 1 - other - Actual outcome for Upper arm cuff: change in blood pressure, diastolic, 12 months at 12 months; Group 1: mean -3.5 (SD 7.9792); n=247, Group 2: mean -4.4 (SD 7.96); n=246 Risk of bias: All domain - Low, Selection - Low, Blinding - Low, Incomplete outcome data - Low, Outcome reporting - Low, Measurement - Low, Crossover

Mon
itorin
g b
lood p
ressu
re
Hyp
erte
nsio
n in
adu
lts: D
RA
FT
FO
R C
ON
SU
LT
AT
ION
© N
atio
nal In
stitu
te fo
r He
alth
an
d C
are
Exce
llence
, 201
9
67
- Low, Subgroups - Low; Indirectness of outcome: No indirectness; Group 1 Number missing: 13, Reason: 8 withdrew, 1 could not be contacted, 2 missed visit, 2 died; Group 2 Number missing: 11, Reason: 4 withdrew, 1 refused, 2 could not be contacted, 3 moved, 1 - other Protocol outcome 5: Proportion of people controlled to a target at longest reported - Actual outcome for Upper arm cuff: Proportion controlled to a target, 12 months at 12 months; Group 1: 75/247, Group 2: 91/246 Risk of bias: All domain - Low, Selection - Low, Blinding - Low, Incomplete outcome data - Low, Outcome reporting - Low, Measurement - Low, Crossover - Low, Subgroups - Low; Indirectness of outcome: No indirectness; Group 1 Number missing: 13, Reason: 8 withdrew, 1 could not be contacted, 2 missed visit, 2 died; Group 2 Number missing: 11, Reason: 4 withdrew, 1 refused, 2 could not be contacted, 3 moved, 1 - other RESULTS (NUMBERS ANALYSED) AND RISK OF BIAS FOR COMPARISON: USUAL CARE versus HOME MEASUREMENT WITH TELEMONITORING and a PHARMACIST Protocol outcome 1: All-cause mortality at longest reported - Actual outcome for Upper arm cuff: Mortality at 12 months: Group 1: 0/247, Group 2: 1/237; Comments: Died of cardiac arrest. Risk of bias: All domain - High, Selection - Low, Blinding - Low, Incomplete outcome data - Low, Outcome reporting - High, Measurement - Low, Crossover - Low, Subgroups - Low; Indirectness of outcome: No indirectness; Group 1 Number missing: 13, Reason: 8 withdrew, 1 could not be contacted, 2 missed visit, 2 died; Group 2 Number missing: 11, Reason: 4 withdrew, 1 refused, 2 could not be contacted, 3 moved, 1 - other Protocol outcome 2: Health-related quality of life at longest reported - Actual outcome for Upper arm cuff: QoL - general health at 12 months; Group 1: mean 66.7 (SD 20.4); n=247, Group 2: mean 66.6 (SD 22.2); n=237 Risk of bias: All domain - High, Selection - Low, Blinding - High, Incomplete outcome data - Low, Outcome reporting - Low, Measurement - Low, Crossover - Low, Subgroups - Low; Indirectness of outcome: No indirectness; Group 1 Number missing: 13, Reason: 8 withdrew, 1 could not be contacted, 2 missed visit, 2 died; Group 2 Number missing: 11, Reason: 4 withdrew, 1 refused, 2 could not be contacted, 3 moved, 1 - other - Actual outcome for Upper arm cuff: QoL - physical health at 12 months; Group 1: mean 78.1 (SD 27.7); n=247, Group 2: mean 81 (SD 26.5); n=237 Risk of bias: All domain - High, Selection - Low, Blinding - High, Incomplete outcome data - Low, Outcome reporting - Low, Measurement - Low, Crossover - Low, Subgroups - Low; Indirectness of outcome: No indirectness; Group 1 Number missing: 13, Reason: 8 withdrew, 1 could not be contacted, 2 missed visit, 2 died; Group 2 Number missing: 11, Reason: 4 withdrew, 1 refused, 2 could not be contacted, 3 moved, 1 - other - Actual outcome for Upper arm cuff: QoL - emotional health at 12 months; Group 1: mean 71.5 (SD 17.7); n=247, Group 2: mean 71.7 (SD 19.7); n=237 Risk of bias: All domain - High, Selection - Low, Blinding - High, Incomplete outcome data - Low, Outcome reporting - Low, Measurement - Low, Crossover - Low, Subgroups - Low; Indirectness of outcome: No indirectness; Group 1 Number missing: 13, Reason: 8 withdrew, 1 could not be contacted, 2 missed visit, 2 died; Group 2 Number missing: 11, Reason: 4 withdrew, 1 refused, 2 could not be contacted, 3 moved, 1 - other Protocol outcome 3: Myocardial infarction at longest reported - Actual outcome for Upper arm cuff: Non-fatal cardiovascular events at 12 months at 12 months: Group 1: 2/247, Group 2: 3/237 Risk of bias: All domain - High, Selection - Low, Blinding - Low, Incomplete outcome data - Low, Outcome reporting - High, Measurement - Low, Crossover - Low, Subgroups - Low; Indirectness of outcome: No indirectness; Group 1 Number missing: 13, Reason: 8 withdrew, 1 could not be contacted, 2 missed visit, 2 died; Group 2 Number missing: 11, Reason: 4 withdrew, 1 refused, 2 could not be contacted, 3 moved, 1 - other

Mon
itorin
g b
lood p
ressure
Hyp
erte
nsio
n in
adu
lts: D
RA
FT
FO
R C
ON
SU
LT
AT
ION
© N
atio
nal In
stitu
te fo
r He
alth
an
d C
are
Exce
llence
, 201
9
68
Protocol outcome 4: Reduction in clinic blood pressure at longest reported - Actual outcome for Upper arm cuff: Change in blood pressure, systolic, 12 months at 12 months: Group 1: mean -5.3 (SD 14.3625); n=247, Group 2: mean -14.2 (SD 14.0658); n=237 Risk of bias: All domain - Low, Selection - Low, Blinding - Low, Incomplete outcome data - Low, Outcome reporting - Low, Measurement - Low, Crossover - Low, Subgroups - Low; Indirectness of outcome: No indirectness; Group 1 Number missing: 13, Reason: 8 withdrew, 1 could not be contacted, 2 missed visit, 2 died; Group 2 Number missing: 11, Reason: 4 withdrew, 1 refused, 2 could not be contacted, 3 moved, 1 - other - Actual outcome for Upper arm cuff: Change in blood pressure, diastolic, 12 months at 12 months; Group 1: mean -3.5 (SD 7.9792); n=247, Group 2: mean -7 (SD 7.8144); n=237 Risk of bias: All domain - Low, Selection - Low, Blinding - Low, Incomplete outcome data - Low, Outcome reporting - Low, Measurement - Low, Crossover - Low, Subgroups - Low; Indirectness of outcome: No indirectness; Group 1 Number missing: 13, Reason: 8 withdrew, 1 could not be contacted, 2 missed visit, 2 died; Group 2 Number missing: 11, Reason: 4 withdrew, 1 refused, 2 could not be contacted, 3 moved, 1 - other Protocol outcome 5: Proportion of people controlled to a target at longest reported - Actual outcome for Upper arm cuff: Proportion controlled to a target, 12 months at 12 months: Group 1: 76/247, Group 2: 134/237 Risk of bias: All domain - Low, Selection - Low, Blinding - Low, Incomplete outcome data - Low, Outcome reporting - Low, Measurement - Low, Crossover - Low, Subgroups - Low; Indirectness of outcome: No indirectness; Group 1 Number missing: 13, Reason: 8 withdrew, 1 could not be contacted, 2 missed visit, 2 died; Group 2 Number missing: 11, Reason: 4 withdrew, 1 refused, 2 could not be contacted, 3 moved, 1 - other RESULTS (NUMBERS ANALYSED) AND RISK OF BIAS FOR COMPARISON: HOME MEASUREMENT WITH TELEMONITORING versus HOME MEASUREMENT WITH TELEMONITORING plus a PHARMACIST Protocol outcome 1: All-cause mortality at longest reported - Actual outcome for Upper arm cuff: Mortality at 12 months; Group 1: 2/246, Group 2: 1/237 Risk of bias: All domain - High, Selection - Low, Blinding - Low, Incomplete outcome data - Low, Outcome reporting - High, Measurement - Low, Crossover - Low, Subgroups - Low; Indirectness of outcome: No indirectness; Group 1 Number missing: 13, Reason: 8 withdrew, 1 could not be contacted, 2 missed visit, 2 died; Group 2 Number missing: 11, Reason: 4 withdrew, 1 refused, 2 could not be contacted, 3 moved, 1 - other Protocol outcome 2: Health-related quality of life at longest reported - Actual outcome for Upper arm cuff: QoL - general health at 12 months; Group 1: mean 66.6 (SD 20.9); n=246, Group 2: mean 66.6 (SD 22.2); n=237 Risk of bias: All domain - High, Selection - Low, Blinding - High, Incomplete outcome data - Low, Outcome reporting - Low, Measurement - Low, Crossover - Low, Subgroups - Low; Indirectness of outcome: No indirectness; Group 1 Number missing: 13, Reason: 8 withdrew, 1 could not be contacted, 2 missed visit, 2 died; Group 2 Number missing: 11, Reason: 4 withdrew, 1 refused, 2 could not be contacted, 3 moved, 1 - other - Actual outcome for Upper arm cuff: QoL - physical health at 12 months; Group 1: mean 77.7 (SD 30.3); n=246, Group 2: mean 81 (SD 26.5); n=237 Risk of bias: All domain - High, Selection - Low, Blinding - High, Incomplete outcome data - Low, Outcome reporting - Low, Measurement - Low, Crossover - Low, Subgroups - Low; Indirectness of outcome: No indirectness; Group 1 Number missing: 13, Reason: 8 withdrew, 1 could not be contacted, 2 missed visit, 2 died; Group 2 Number missing: 11, Reason: 4 withdrew, 1 refused, 2 could not be contacted, 3 moved, 1 - other - Actual outcome for Upper arm cuff: QoL - emotional health at 12 months; Group 1: mean 72.1 (SD 16.8); n=246, Group 2: mean 71.7 (SD 19.7); n=237 Risk of bias: All domain - High, Selection - Low, Blinding - High, Incomplete outcome data - Low, Outcome reporting - Low, Measurement - Low,

Mon
itorin
g b
lood p
ressu
re
Hyp
erte
nsio
n in
adu
lts: D
RA
FT
FO
R C
ON
SU
LT
AT
ION
© N
atio
nal In
stitu
te fo
r He
alth
an
d C
are
Exce
llence
, 201
9
69
Crossover - Low, Subgroups - Low; Indirectness of outcome: No indirectness; Group 1 Number missing: 13, Reason: 8 withdrew, 1 could not be contacted, 2 missed visit, 2 died; Group 2 Number missing: 11, Reason: 4 withdrew, 1 refused, 2 could not be contacted, 3 moved, 1 - other Protocol outcome 3: Myocardial infarction at longest reported - Actual outcome for Upper arm cuff: Non-fatal cardiovascular events at 12 months at 12 months; Group 1: 4/246, Group 2: 3/237 Risk of bias: All domain - High, Selection - Low, Blinding - Low, Incomplete outcome data - Low, Outcome reporting - High, Measurement - Low, Crossover - Low, Subgroups - Low; Indirectness of outcome: No indirectness; Group 1 Number missing: 13, Reason: 8 withdrew, 1 could not be contacted, 2 missed visit, 2 died; Group 2 Number missing: 11, Reason: 4 withdrew, 1 refused, 2 could not be contacted, 3 moved, 1 - other Protocol outcome 4: Reduction in clinic blood pressure at longest reported - Actual outcome for Upper arm cuff: Change in blood pressure, systolic, 12 months at 12 months; Group 1: mean -8.2 (SD 14.3331); n=246, Group 2: mean -14.2 (SD 14.0658); n=237 Risk of bias: All domain - Low, Selection - Low, Blinding - Low, Incomplete outcome data - Low, Outcome reporting - Low, Measurement - Low, Crossover - Low, Subgroups - Low; Indirectness of outcome: No indirectness; Group 1 Number missing: 13, Reason: 8 withdrew, 1 could not be contacted, 2 missed visit, 2 died; Group 2 Number missing: 11, Reason: 4 withdrew, 1 refused, 2 could not be contacted, 3 moved, 1 - other - Actual outcome for Upper arm cuff: Change in blood pressure, diastolic, 12 months at 12 months; Group 1: mean -4.4 (SD 7.9629); n=246, Group 2: mean -7 (SD 7.8144); n=237 Risk of bias: All domain - Low, Selection - Low, Blinding - Low, Incomplete outcome data - Low, Outcome reporting - Low, Measurement - Low, Crossover - Low, Subgroups - Low; Indirectness of outcome: No indirectness; Group 1 Number missing: 13, Reason: 8 withdrew, 1 could not be contacted, 2 missed visit, 2 died; Group 2 Number missing: 11, Reason: 4 withdrew, 1 refused, 2 could not be contacted, 3 moved, 1 - other
Protocol outcomes not reported by the study
Stroke (ischaemic or haemorrhagic) at longest reported; Average daily dose of antihypertensive medication at longest reported; Average number of visits at longest reported; Intolerance to device at longest reported; Hypotension (dizziness) at longest reported

Mon
itorin
g b
lood p
ressure
Hyp
erte
nsio
n in
adu
lts: D
RA
FT
FO
R C
ON
SU
LT
AT
ION
© N
atio
nal In
stitu
te fo
r He
alth
an
d C
are
Exce
llence
, 201
9
70
Study Logan 201269
Study type RCT (Patient randomised; Parallel)
Number of studies (number of participants) (n=110)
Countries and setting Conducted in Canada; Setting:
Line of therapy Adjunctive to current care
Duration of study Intervention time: 12 months
Method of assessment of guideline condition
Adequate method of assessment/diagnosis
Stratum Upper arm cuff
Subgroup analysis within study Not applicable
Inclusion criteria People with diabetes and uncontrolled systolic hypertension, defined as a mean daytime systolic BP of >130 mmHg on ambulatory BP monitoring were eligible.
Exclusion criteria Severe or end-stage organ disease (liver, kidney, heart, and lung), a history of diabetic ketoacidosis, any illness with expected survival <1 year, severe cognitive impairment, mental illness or disability, clinically significant cardiac arrhythmia, symptomatic orthostatic hypotension, or were pregnant, unsuitable for participation in the opinion of their primary care physician, or not fluent in English.
Recruitment/selection of people Men and women, >30 years of age, with diabetes mellitus were recruited from family physicians’ office or hospital-based speciality clinics and advertisements in public areas of hospitals.
Age, sex and family origin Age - Mean (SD): 62.9 (8.4). Sex (M:F): 61 male, 49 female. Family origin: Control - 60% White, 18.1% African or West Indian, 12.7% Asian, 1.8% Hispanic, 7.4% other Intervention - 70.9% White, 14.6% African or West Indian, 7.2% Asian, 5.5% Hispanic, 1.8% Other
Indirectness of population No indirectness
Interventions (n=55) Intervention 1: Home measurement without telemonitoring. Home BP monitoring without self-care support. Duration 12 months. Concurrent medication or care: Participants in both groups were taught how to measure their BP correctly, instructed to measure their BP 2 days per week twice in the morning and twice in the evening, provided with a validated home BP monitoring device with appropriate-sized upper arm cuff, and given a booklet with detailed information on the self-measurement of BP, treatment of hypertension, and goals of therapy. Their primary care physician was given an outline of the study’s objectives and BP treatment goal, asked to provide relevant medical information, and given a copy of the 24-hour ambulatory BP monitoring report. In both groups, treatment decisions, including medication adjustments and changes in lifestyle, were made by the person’s primary care physician. Indirectness: No indirectness. (n=55) Intervention 2: Home measurement with telemonitoring - Home measurement with telemonitoring. Self-care support people were taught how to use the telemonitoring system, review past readings on their

Mon
itorin
g b
lood p
ressu
re
Hyp
erte
nsio
n in
adu
lts: D
RA
FT
FO
R C
ON
SU
LT
AT
ION
© N
atio
nal In
stitu
te fo
r He
alth
an
d C
are
Exce
llence
, 201
9
71
smart phone and the study-specific web site (these activities were optional), and generate a 1-page patient summary report. They were instructed to take their smart phone to all doctor visits. The person’s physician was shown the patient summary report, asked to indicate the low and high threshold BP values for critical alert messages (default options were provided), and taught how to change the threshold values. Optionally, they were shown how to visit the study’s password-protected website. The research team did not contact the subjects in either group or their physician during the course of the study. Duration 12 months. Concurrent medication or care: Participants in both groups were taught how to measure their BP correctly, instructed to measure their BP 2 days per week twice in the morning and twice in the evening, provided with a validated home BP monitoring device with appropriate-sized upper arm cuff, and given a booklet with detailed information on the self-measurement of BP, treatment of hypertension, and goals of therapy. Their primary care physician was given an outline of the study’s objectives and BP treatment goal, asked to provide relevant medical information, and given a copy of the 24-hour ambulatory BP monitoring report. In both groups, treatment decisions, including medication adjustments and changes in lifestyle, were made by the person’s primary care physician. Indirectness: No indirectness.
Funding Academic or government funding (The Heart and Stroke Foundation of Ontario (ESA 5970) was the sole source of funding for this project and was not involved in any aspect of the study.)
RESULTS (NUMBERS ANALYSED) AND RISK OF BIAS FOR COMPARISON: HOME MEASUREMENT WITHOUT TELEMONITORING versus HOME MEASUREMENT WITH TELEMONITORING Protocol outcome 1: Average number of visits at longest reported - Actual outcome for Upper arm cuff: Number of GP visits at 12 months: Group 1: 6/49, Group 2: 4/51; Comments: Median reported IQR 3-8 control group, 3-7 intervention group Risk of bias: All domain - Low, Selection - Low, Blinding - Low, Incomplete outcome data - Low, Outcome reporting - Low, Measurement - Low, Crossover - Low, Subgroups - Low; Indirectness of outcome: No indirectness; Group 1 Number missing: 2, Reason: 2 refused full 24hr monitoring; Group 2 Number missing: 4, Reason: 1 died, 3 refused exit blood pressure assessment
Protocol outcomes not reported by the study
All-cause mortality at longest reported; Health-related quality of life at longest reported; Stroke (ischaemic or haemorrhagic) at longest reported; Myocardial infarction at longest reported; Reduction in clinic blood pressure at longest reported; Proportion of people controlled to a target at longest reported; Average daily dose of antihypertensive medication at longest reported; Intolerance to device at longest reported; Hypotension (dizziness) at longest reported

Mon
itorin
g b
lood p
ressure
Hyp
erte
nsio
n in
adu
lts: D
RA
FT
FO
R C
ON
SU
LT
AT
ION
© N
atio
nal In
stitu
te fo
r He
alth
an
d C
are
Exce
llence
, 201
9
72
Study McManus 201080
Study type RCT (Patient randomised; Parallel)
Number of studies (number of participants) (n=527)
Countries and setting Conducted in United Kingdom
Line of therapy Adjunctive to current care
Duration of study Intervention time: 12 months
Method of assessment of guideline condition
Adequate method of assessment or diagnosis
Stratum Upper arm cuff
Subgroup analysis within study Not applicable
Inclusion criteria Define
Exclusion criteria Define
Recruitment/selection of people Potential participants were identified by their own family doctor by use of electronic searches of practice clinical record systems in 24 general practices in the West Midlands, UK.
Age, sex and family origin Age - Mean (SD): 66.4 (8.8). Sex (M: F): Define. Family origin: 461 White, 7 Black, 10 Asian, 2 other
Indirectness of population No indirectness
Interventions (n=264) Intervention 1: Clinic or office measurement. All participants in the control group were asked to attend a review by their family doctor. No specific instructions were given to the clinicians about the content of this visit other than to review medication. Thereafter, care was at the discretion of the family doctor. Duration 12 months. Concurrent medication or care: All participants received information based on literature produced by the British Hypertension Society about non-pharmacological interventions to reduce blood pressure. All participating family doctors were given a copy of current National Institute for Health and Clinical Excellence (NICE) guidelines. Indirectness: No indirectness. (n=263) Intervention 2: Home measurement with telemonitoring - Home measurement with telemonitoring. People assigned to the intervention group were invited to 2 training sessions the research team ran. Participants were trained to monitor their own blood pressure for the first week of each month with a validated automated sphygmomanometer and to transmit blood pressure readings to the research team by means of an automated modem device, which was connected to the sphygmomanometer and plugged into a normal telephone socket like an answer phone. Two self-measurements were made each morning with a 5-minute interval and the second reading acted upon. A colour traffic light system was used by participants to code these readings as green (below target but above safety limit), amber (above target but below safety limits) and red (outside of safety limits). A month was deemed to be ‘above target’ if the readings on 4 or more days were above target. Duration 12 months. Concurrent medication or care: All participants received

Mon
itorin
g b
lood p
ressu
re
Hyp
erte
nsio
n in
adu
lts: D
RA
FT
FO
R C
ON
SU
LT
AT
ION
© N
atio
nal In
stitu
te fo
r He
alth
an
d C
are
Exce
llence
, 201
9
73
information based on literature produced by the British Hypertension Society about non-pharmacological interventions to reduce blood pressure. All participating family doctors were given a copy of current National Institute for Health and Clinical Excellence (NICE) guidelines. Indirectness: No indirectness.
Funding Academic or government funding (Department of Health Policy Research Programme, National Coordinating Centre for Research Capacity Development, and Midlands Research Practices Consortium.)
RESULTS (NUMBERS ANALYSED) AND RISK OF BIAS FOR COMPARISON: CLINIC/OFFICE MEASUREMENT versus HOME MEASUREMENT WITH TELEMONITORING Protocol outcome 1: Health-related quality of life at longest reported - Actual outcome for Upper arm cuff: Quality of life measured by EQ-5D (adjusted) at 12 months; Mean; , Comments: Mean (95% CI) TM - 0.826 (0.792 to 0.859) Usual care - 0.838 (0.805 to 0.871); Risk of bias: All domain - Very high, Selection - Low, Blinding - High, Incomplete outcome data - High, Outcome reporting - Low, Measurement - Low, Crossover - Low, Subgroups - Low; Indirectness of outcome: No indirectness; Group 1 Number missing: 29/263, Reason: Did not attend follow-up, discontinued intervention; Group 2 Number missing: 18/264, Reason: Did not attend follow-up Protocol outcome 2: Reduction in clinic blood pressure at longest reported - Actual outcome for Upper arm cuff: Change in blood pressure, systolic, 12 months at 12 months; Group 1: mean 140.3 (SD 18.3146); n=246, Group 2: mean 134.7 (SD 18.6341); n=234 Risk of bias: All domain - High, Selection - Low, Blinding - Low, Incomplete outcome data - High, Outcome reporting - Low, Measurement - Low, Crossover - Low, Subgroups - Low; Indirectness of outcome: No indirectness; Group 1 Number missing: 29/263, Reason: Did not attend follow-up, discontinued intervention; Group 2 Number missing: 18/264, Reason: Did not attend follow-up - Actual outcome for Upper arm cuff: Change in blood pressure, diastolic, 12 months at 12 months; Group 1: mean 79.8 (SD 11.9443); n=246, Group 2: mean 77.5 (SD 11.6463); n=234 Risk of bias: All domain - High, Selection - Low, Blinding - Low, Incomplete outcome data - High, Outcome reporting - Low, Measurement - Low, Crossover - Low, Subgroups - Low; Indirectness of outcome: No indirectness; Group 1 Number missing: 29/263, Reason: Did not attend follow-up, discontinued intervention; Group 2 Number missing: 18/264, Reason: Did not attend follow-up Protocol outcome 3: Average daily dose of antihypertensive medication at longest reported - Actual outcome for Upper arm cuff: Mean number of antihypertensive drugs, 1 year at 12 months; Group 1: mean 1.7 (SD 1.5926); n=246, Group 2: mean 2.1 (SD 1.5528); n=234 Risk of bias: All domain - High, Selection - Low, Blinding - Low, Incomplete outcome data - High, Outcome reporting - Low, Measurement - Low, Crossover - Low, Subgroups - Low; Indirectness of outcome: No indirectness; Group 1 Number missing: 29/263, Reason: Did not attend follow-up, discontinued intervention; Group 2 Number missing: 18/264, Reason: Did not attend follow-up Protocol outcome 4: Average number of visits at longest reported - Actual outcome for Upper arm cuff: Mean number of consultations, 1 year at 12 months; Group 1: mean 3.5 (SD 2.3889); n=246, Group 2: mean 3.2 (SD 2.3293); n=234

Mon
itorin
g b
lood p
ressure
Hyp
erte
nsio
n in
adu
lts: D
RA
FT
FO
R C
ON
SU
LT
AT
ION
© N
atio
nal In
stitu
te fo
r He
alth
an
d C
are
Exce
llence
, 201
9
74
Risk of bias: All domain - High, Selection - Low, Blinding - Low, Incomplete outcome data - High, Outcome reporting - Low, Measurement - Low, Crossover - Low, Subgroups - Low; Indirectness of outcome: No indirectness; Group 1 Number missing: 29/263, Reason: Did not attend follow-up, discontinued intervention; Group 2 Number missing: 18/264, Reason: Did not attend follow-up
Protocol outcomes not reported by the study
All-cause mortality at longest reported; Stroke (ischaemic or haemorrhagic) at longest reported; Myocardial infarction at longest reported; Proportion of people controlled to a target at longest reported; Intolerance to device at longest reported; Hypotension (dizziness) at longest reported
Study McManus 201881
Study type RCT (Patient randomised; Parallel)
Number of studies (number of participants) (n=1,182)
Countries and setting Conducted in United Kingdom; Setting:
Line of therapy Adjunctive to current care
Duration of study Intervention time: 12 months
Method of assessment of guideline condition
Adequate method of assessment/diagnosis
Stratum Upper arm cuff
Subgroup analysis within study Not applicable:
Inclusion criteria Older than 35 years, with a diagnosis of hypertension, taking no more than 3 antihypertensive agents, but with clinic blood pressure not controlled below 140/90 mmHg. They had to be on stable antihypertensive medication for at least 4 weeks before randomisation and free from orthostatic hypotension, atrial fibrillation, dementia, or chronic kidney disease of grade 4 or worse, or chronic kidney disease with proteinuria.
Exclusion criteria Exclusion criteria will be orthostatic hypertension (20 mmHg or more systolic drop after standing for 1 minute, in order to avoid adverse events), BP not managed by their GP (limited possibility of antihypertensive titration), diagnosed atrial fibrillation (automated monitors not validated), unwilling to self-monitor, dementia or score over 10 on the short orientation memory concentration test (inability to undertake self-monitoring), female participant who is pregnant, lactating or planning pregnancy during the trial (management of essential hypertension in pregnancy is different), the partner or spouse of an individual already randomised in the trial (to avoid clustering within families), Chronic Kidney Disease (CKD) grade 4 or worse, any grade of CKD with proteinuria (both may have different BP targets), participants who have participated in another research trial involving antihypertensive medication in the past 4 weeks.

Mon
itorin
g b
lood p
ressu
re
Hyp
erte
nsio
n in
adu
lts: D
RA
FT
FO
R C
ON
SU
LT
AT
ION
© N
atio
nal In
stitu
te fo
r He
alth
an
d C
are
Exce
llence
, 201
9
75
Recruitment/selection of people Potentially eligible participants were identified using automated searches of electronic primary care patient records in practices in England, UK. The searches identified individuals potentially eligible in terms of age, hypertension diagnosis, current medication, and last recorded systolic blood pressure above 145 mmHg.
Age, sex and family origin Age - Mean (SD): 66.93 (9.43). Sex: (M:F): 545 female, 628 male. Family origin: 1127 white, 20 black, 16 Asian, 7 mixed, 3 other
Indirectness of population No indirectness
Interventions (n=395) Intervention 1: Home measurement without telemonitoring. Participants randomly assigned to self-monitoring were taught to use a validated automated electronic sphygmomanometer. They were asked to monitor their own blood pressure in their non-dominant arm, twice each morning and evening, for the first week of every month using standard recommendations and their GPs were asked to use the self-monitored measurements for titration of antihypertensive medication. A simple colour chart was used to train participants to attend their practice for blood pressure checks in the light of very high or very low readings. At the end of each monitoring week, they were asked to record their readings on paper and send them for review to their practice in a reply-paid envelope. Duration 12 months. Concurrent medication/care: Attending clinicians were asked to review both self-monitoring and tele monitoring groups’ readings on a monthly basis and usual care people as often as they wished. All participants were followed up at 6 and 12 months by research nurses. Indirectness: No indirectness (n=393) Intervention 2: Home measurement with telemonitoring - Home measurement with telemonitoring. Participants randomly assigned to self-monitoring were taught to use a validated automated electronic sphygmomanometer. They were asked to monitor their own blood pressure in their non-dominant arm, twice each morning and evening, for the first week of every month using standard recommendations and their GPs were asked to use the self-monitored measurements for titration of antihypertensive medication. Participants in the telemonitoring group were trained to send readings via a simple free SMS text-based telemonitoring service with web-based data entry back-up. The telemonitoring system incorporated an algorithm that alerted participants to contact their surgery in the light of very high or very low readings, reminded them if insufficient readings were transmitted, prompted them to make contact with their practice if their average blood pressure was above target, and presented readings to attending clinicians via a web interface. This secure web page automatically calculated mean blood pressure for each monitoring week, highlighted very high or very low readings, and presented a graphical display of blood pressure measurements. Duration 12 months. Concurrent medication/care: Attending clinicians were asked to review both self-monitoring and tele monitoring groups’ readings on a monthly basis and usual care people as often as they wished. All participants were followed up at 6 and 12 months by research nurses. Indirectness: No indirectness (n=394) Intervention 3: Clinic/office measurement. Participants randomly assigned to usual care were thereafter managed with titration of antihypertensive treatment based on clinic blood pressure measurements at the discretion of

Mon
itorin
g b
lood p
ressure
Hyp
erte
nsio
n in
adu
lts: D
RA
FT
FO
R C
ON
SU
LT
AT
ION
© N
atio
nal In
stitu
te fo
r He
alth
an
d C
are
Exce
llence
, 201
9
76
their attending health-care professional. Duration 12 months. Concurrent medication/care: Attending clinicians were asked to review both self-monitoring and tele monitoring groups’ readings on a monthly basis and usual care people as often as they wished. All participants were followed up at 6 and 12 months by research nurses. Indirectness: No indirectness.
Funding Academic or government funding (The trial was funded by an National Institute for Health Research (NIHR) Programme grant (RP-PG-1209-10051), and by an NIHR Professorship awarded to RJM, the Chief Investigator (NIHR-RP-R2-12-015).)
RESULTS (NUMBERS ANALYSED) AND RISK OF BIAS FOR COMPARISON: HOME MEASUREMENT WITHOUT TELEMONITORING versus HOME MEASUREMENT WITH TELEMONITORING Protocol outcome 1: Health-related quality of life at longest reported - Actual outcome for Upper arm cuff: EQ-5D-5L at 12 months; MD; -0.02 (95%CI -0.06 to 0.01); Risk of bias: All domain - High, Selection - Low, Blinding - High, Incomplete outcome data - Low, Outcome reporting - Low, Measurement - Low, Crossover - Low, Subgroups - Low; Indirectness of outcome: No indirectness; Group 1 Number missing: N/A, Reason: Partial withdrawals, withdrew from treatment, complete withdrawals/lost to follow-up, withdrew from treatment and follow-up, withdrew consent, ineligible, disease progression, other reason, lost to follow-up; Group 2 Number missing: N/A, Reason: Partial withdrawals, withdrew from treatment, complete withdrawals/lost to follow-up, withdrew from treatment and follow-up, withdrew consent, ineligible, disease progression, other reason, lost to follow-up Protocol outcome 2: Myocardial infarction at longest reported - Actual outcome for Upper arm cuff: Cardiovascular events, 12 months at 12 months; Group 1: 12/328, Group 2: 11/330 Risk of bias: All domain - Very high, Selection - Low, Blinding - Low, Incomplete outcome data - High, Outcome reporting - High, Measurement - Low, Crossover - Low, Subgroups - Low; Indirectness of outcome: No indirectness; Group 1 Number missing: N/A, Reason: Partial withdrawals, withdrew from treatment, complete withdrawals/lost to follow-up, withdrew from treatment and follow-up, withdrew consent, ineligible, disease progression, other reason, lost to follow-up; Group 2 Number missing: N/A, Reason: Partial withdrawals, withdrew from treatment, complete withdrawals/lost to follow-up, withdrew from treatment and follow-up, withdrew consent, ineligible, disease progression, other reason, lost to follow-up Protocol outcome 3: Reduction in clinic blood pressure at longest reported - Actual outcome for Upper arm cuff: Reduction in blood pressure, systolic, at 1 year at 12 months; Group 1: mean 137 (SD 16.7); n=328, Group 2: mean 136 (SD 16.1); n=327 Risk of bias: All domain - High, Selection - Low, Blinding - Low, Incomplete outcome data - High, Outcome reporting - Low, Measurement - Low, Crossover - Low, Subgroups - Low; Indirectness of outcome: No indirectness; Group 1 Number missing: N/A, Reason: Partial withdrawals, withdrew from treatment, complete withdrawals or lost to follow-up, withdrew from treatment and follow-up, withdrew consent, ineligible, disease progression, other reason, lost to follow-up; Group 2 Number missing: N/A, Reason: Partial withdrawals, withdrew from treatment, complete withdrawals or lost to follow-up, withdrew from treatment and follow-up, withdrew consent, ineligible, disease progression, other reason, lost to follow-up - Actual outcome for Upper arm cuff: Reduction in blood pressure, diastolic, at 1 year at 12 months; Group 1: mean 77.8 (SD 10.1); n=328, Group 2: mean 78.7 (SD 9.7); n=328 Risk of bias: All domain - High, Selection - Low, Blinding - Low, Incomplete outcome data - High, Outcome reporting - Low, Measurement - Low, Crossover - Low, Subgroups - Low; Indirectness of outcome: No indirectness; Group 1 Number missing: N/A, Reason: Partial withdrawals, withdrew from

Mon
itorin
g b
lood p
ressu
re
Hyp
erte
nsio
n in
adu
lts: D
RA
FT
FO
R C
ON
SU
LT
AT
ION
© N
atio
nal In
stitu
te fo
r He
alth
an
d C
are
Exce
llence
, 201
9
77
treatment, complete withdrawals/lost to follow-up, withdrew from treatment and follow-up, withdrew consent, ineligible, disease progression, other reason, lost to follow-up; Group 2 Number missing: N/A, Reason: Partial withdrawals, withdrew from treatment, complete withdrawals/lost to follow-up, withdrew from treatment and follow-up, withdrew consent, ineligible, disease progression, other reason, lost to follow-up Protocol outcome 4: Average daily dose of antihypertensive medication at longest reported - Actual outcome for Upper arm cuff: Overall defined daily dose at 12 months; Group 1: mean 2.42 (SD 1.75); n=328, Group 2: mean 2.69 (SD 1.82); n=330 Risk of bias: All domain - High, Selection - Low, Blinding - Low, Incomplete outcome data - High, Outcome reporting - Low, Measurement - Low, Crossover - Low, Subgroups - Low; Indirectness of outcome: No indirectness; Group 1 Number missing: N/A, Reason: Partial withdrawals, withdrew from treatment, complete withdrawals/lost to follow-up, withdrew from treatment and follow-up, withdrew consent, ineligible, disease progression, other reason, lost to follow-up; Group 2 Number missing: N/A, Reason: Partial withdrawals, withdrew from treatment, complete withdrawals/lost to follow-up, withdrew from treatment and follow-up, withdrew consent, ineligible, disease progression, other reason, lost to follow-up Protocol outcome 5: Average number of visits at longest reported - Actual outcome for Upper arm cuff: Mean number of consultations between baseline and 12 months at 12 months; Group 1: mean 1.8 (SD 2.54); n=328, Group 2: mean 2.2 (SD 2.53); n=330 Risk of bias: All domain - High, Selection - Low, Blinding - Low, Incomplete outcome data - High, Outcome reporting - Low, Measurement - Low, Crossover - Low, Subgroups - Low; Indirectness of outcome: No indirectness; Group 1 Number missing: N/A, Reason: Partial withdrawals, withdrew from treatment, complete withdrawals/lost to follow-up, withdrew from treatment and follow-up, withdrew consent, ineligible, disease progression, other reason, lost to follow-up; Group 2 Number missing: N/A, Reason: Partial withdrawals, withdrew from treatment, complete withdrawals/lost to follow-up, withdrew from treatment and follow-up, withdrew consent, ineligible, disease progression, other reason, lost to follow-up Protocol outcome 6: Hypotension (dizziness) at longest reported - Actual outcome for Upper arm cuff: Dizziness at 12 months; Group 1: 50/324, Group 2: 72/326 Risk of bias: All domain - High, Selection - Low, Blinding - High, Incomplete outcome data - High, Outcome reporting - Low, Measurement - Low, Crossover - Low, Subgroups - Low; Indirectness of outcome: No indirectness; Group 1 Number missing: N/A, Reason: Partial withdrawals, withdrew from treatment, complete withdrawals/lost to follow-up, withdrew from treatment and follow-up, withdrew consent, ineligible, disease progression, other reason, lost to follow-up; Group 2 Number missing: N/A, Reason: Partial withdrawals, withdrew from treatment, complete withdrawals and lost to follow-up, withdrew from treatment and follow-up, withdrew consent, ineligible, disease progression, other reason, lost to follow-up RESULTS (NUMBERS ANALYSED) AND RISK OF BIAS FOR COMPARISON: HOME MEASUREMENT WITHOUT TELEMONITORING versus CLINIC/OFFICE MEASUREMENT Protocol outcome 1: Health-related quality of life at longest reported - Actual outcome for Upper arm cuff: EQ-5D-5L at 12 months; MD; -0.01 (95%CI -0.04 to 0.02); Risk of bias: All domain - High, Selection - Low, Blinding - High, Incomplete outcome data - Low, Outcome reporting - Low, Measurement - Low, Crossover - Low, Subgroups - Low; Indirectness of outcome: No indirectness; Group 1 Number missing: N/A, Reason: Partial withdrawals, withdrew from treatment, complete withdrawals/lost to follow-up, withdrew from treatment and follow-up, withdrew consent, ineligible, disease progression, other reason,

Mon
itorin
g b
lood p
ressure
Hyp
erte
nsio
n in
adu
lts: D
RA
FT
FO
R C
ON
SU
LT
AT
ION
© N
atio
nal In
stitu
te fo
r He
alth
an
d C
are
Exce
llence
, 201
9
78
lost to follow-up; Group 2 Number missing: N/A, Reason: Partial withdrawals, withdrew from treatment, complete withdrawals/lost to follow-up, withdrew from treatment and follow-up, withdrew consent, ineligible, disease progression, other reason, lost to follow-up Protocol outcome 2: Myocardial infarction at longest reported - Actual outcome for Upper arm cuff: Cardiovascular events, 12 months at 12 months; Group 1: 12/328, Group 2: 9/350 Risk of bias: All domain - Very high, Selection - Low, Blinding - Low, Incomplete outcome data - High, Outcome reporting - High, Measurement - Low, Crossover - Low, Subgroups - Low; Indirectness of outcome: No indirectness; Group 1 Number missing: N/A, Reason: Partial withdrawals, withdrew from treatment, complete withdrawals/lost to follow-up, withdrew from treatment and follow-up, withdrew consent, ineligible, disease progression, other reason, lost to follow-up; Group 2 Number missing: N/A, Reason: Partial withdrawals, withdrew from treatment, complete withdrawals/lost to follow-up, withdrew from treatment and follow-up, withdrew consent, ineligible, disease progression, other reason, lost to follow-up Protocol outcome 3: Reduction in clinic blood pressure at longest reported - Actual outcome for Upper arm cuff: 12 month adjusted MD HM without TM versus usual care - systolic at 12 months; MD; –3·5 (95%CI -5.8 to -1.2); Risk of bias: All domain - High, Selection - Low, Blinding - Low, Incomplete outcome data - High, Outcome reporting - Low, Measurement - Low, Crossover - Low, Subgroups - Low; Indirectness of outcome: No indirectness; Group 1 Number missing: N/A, Reason: Partial withdrawals, withdrew from treatment, complete withdrawals/lost to follow-up, withdrew from treatment and follow-up, withdrew consent, ineligible, disease progression, other reason, lost to follow-up; Group 2 Number missing: N/A, Reason: Partial withdrawals, withdrew from treatment, complete withdrawals/lost to follow-up, withdrew from treatment and follow-up, withdrew consent, ineligible, disease progression, other reason, lost to follow-up - Actual outcome for Upper arm cuff: 12 month adjusted MD HM without TM versus usual care - diastolic at 12 months; MD; -1.5 (95%CI -2.7 to -0.2); Risk of bias: All domain - High, Selection - Low, Blinding - Low, Incomplete outcome data - High, Outcome reporting - Low, Measurement - Low, Crossover - Low, Subgroups - Low; Indirectness of outcome: No indirectness; Group 1 Number missing: N/A, Reason: Partial withdrawals, withdrew from treatment, complete withdrawals/lost to follow-up, withdrew from treatment and follow-up, withdrew consent, ineligible, disease progression, other reason, lost to follow-up; Group 2 Number missing: N/A, Reason: Partial withdrawals, withdrew from treatment, complete withdrawals/lost to follow-up, withdrew from treatment and follow-up, withdrew consent, ineligible, disease progression, other reason, lost to follow-up Protocol outcome 4: Average daily dose of antihypertensive medication at longest reported - Actual outcome for Upper arm cuff: Overall defined daily dose at 12 months; Group 1: mean 2.42 (SD 1.75); n=328, Group 2: mean 2.27 (SD 1.65); n=350 Risk of bias: All domain - High, Selection - Low, Blinding - Low, Incomplete outcome data - High, Outcome reporting - Low, Measurement - Low, Crossover - Low, Subgroups - Low; Indirectness of outcome: No indirectness; Group 1 Number missing: N/A, Reason: Partial withdrawals, withdrew from treatment, complete withdrawals/lost to follow-up, withdrew from treatment and follow-up, withdrew consent, ineligible, disease progression, other reason, lost to follow-up; Group 2 Number missing: N/A, Reason: Partial withdrawals, withdrew from treatment, complete withdrawals/lost to follow-up, withdrew from treatment and follow-up, withdrew consent, ineligible, disease progression, other reason, lost to follow-up Protocol outcome 5: Average number of visits at longest reported - Actual outcome for Upper arm cuff: Mean number of consultations between baseline and 12 months at 12 months; Group 1: mean 1.8 (SD 2.54); n=328, Group 2: mean 2.1 (SD 2.03); n=350 Risk of bias: All domain - High, Selection - Low, Blinding - Low, Incomplete outcome data - High, Outcome reporting - Low, Measurement - Low,

Mon
itorin
g b
lood p
ressure
Hyp
erte
nsio
n in
adu
lts: D
RA
FT
FO
R C
ON
SU
LT
AT
ION
© N
atio
nal In
stitu
te fo
r He
alth
an
d C
are
Exce
llence
, 201
9
79
Crossover - Low, Subgroups - Low; Indirectness of outcome: No indirectness; Group 1 Number missing: N/A, Reason: Partial withdrawals, withdrew from treatment, complete withdrawals/lost to follow-up, withdrew from treatment and follow-up, withdrew consent, ineligible, disease progression, other reason, lost to follow-up; Group 2 Number missing: N/A, Reason: Partial withdrawals, withdrew from treatment, complete withdrawals/lost to follow-up, withdrew from treatment and follow-up, withdrew consent, ineligible, disease progression, other reason, lost to follow-up Protocol outcome 6: Hypotension (dizziness) at longest reported - Actual outcome for Upper arm cuff: Dizziness at 12 months; Group 1: 50/324, Group 2: 61/348 Risk of bias: All domain - High, Selection - Low, Blinding - High, Incomplete outcome data - High, Outcome reporting - Low, Measurement - Low, Crossover - Low, Subgroups - Low; Indirectness of outcome: No indirectness; Group 1 Number missing: N/A, Reason: Partial withdrawals, withdrew from treatment, complete withdrawals/lost to follow-up, withdrew from treatment and follow-up, withdrew consent, ineligible, disease progression, other reason, lost to follow-up; Group 2 Number missing: N/A, Reason: Partial withdrawals, withdrew from treatment, complete withdrawals/lost to follow-up, withdrew from treatment and follow-up, withdrew consent, ineligible, disease progression, other reason, lost to follow-up RESULTS (NUMBERS ANALYSED) AND RISK OF BIAS FOR COMPARISON: HOME MEASUREMENT WITH TELEMONITORING versus CLINIC/OFFICE MEASUREMENT Protocol outcome 1: Health-related quality of life at longest reported - Actual outcome for Upper arm cuff: EQ-5D-5L at 12 months; MD; -0.03 (95%CI -0.06 to -0.001); Risk of bias: All domain - High, Selection - Low, Blinding - High, Incomplete outcome data - Low, Outcome reporting - Low, Measurement - Low, Crossover - Low, Subgroups - Low; Indirectness of outcome: No indirectness; Group 1 Number missing: N/A, Reason: Partial withdrawals, withdrew from treatment, complete withdrawals/lost to follow-up, withdrew from treatment and follow-up, withdrew consent, ineligible, disease progression, other reason, lost to follow-up; Group 2 Number missing: N/A, Reason: Partial withdrawals, withdrew from treatment, complete withdrawals/lost to follow-up, withdrew from treatment and follow-up, withdrew consent, ineligible, disease progression, other reason, lost to follow-up Protocol outcome 2: Myocardial infarction at longest reported - Actual outcome for Upper arm cuff: Cardiovascular events, 12 months at 12 months; Group 1: 11/330, Group 2: 9/350 Risk of bias: All domain - Very high, Selection - Low, Blinding - Low, Incomplete outcome data - High, Outcome reporting - High, Measurement - Low, Crossover - Low, Subgroups - Low; Indirectness of outcome: No indirectness; Group 1 Number missing: N/A, Reason: Partial withdrawals, withdrew from treatment, complete withdrawals/lost to follow-up, withdrew from treatment and follow-up, withdrew consent, ineligible, disease progression, other reason, lost to follow-up; Group 2 Number missing: N/A, Reason: Partial withdrawals, withdrew from treatment, complete withdrawals/lost to follow-up, withdrew from treatment and follow-up, withdrew consent, ineligible, disease progression, other reason, lost to follow-up Protocol outcome 3: Reduction in clinic blood pressure at longest reported - Actual outcome for Upper arm cuff: 12 month adjusted MD HM with TM versus usual care - systolic at 12 months; MD; –4·7 (95%CI -7 to -2.4); Risk of bias: All domain - High, Selection - Low, Blinding - Low, Incomplete outcome data - High, Outcome reporting - Low, Measurement - Low, Crossover - Low, Subgroups - Low; Indirectness of outcome: No indirectness; Group 1 Number missing: N/A, Reason: Partial withdrawals, withdrew from treatment, complete withdrawals/lost to follow-up, withdrew from treatment and follow-up, withdrew consent, ineligible, disease progression, other reason, lost to follow-up; Group 2 Number missing: N/A, Reason: Partial withdrawals, withdrew from treatment, complete withdrawals/lost to follow-up, withdrew

Mon
itorin
g b
lood p
ressure
Hyp
erte
nsio
n in
adu
lts: D
RA
FT
FO
R C
ON
SU
LT
AT
ION
© N
atio
nal In
stitu
te fo
r He
alth
an
d C
are
Exce
llence
, 201
9
80
from treatment and follow-up, withdrew consent, ineligible, disease progression, other reason, lost to follow-up - Actual outcome for Upper arm cuff: 12 month adjusted MD HM with TM versus usual care - diastolic at 12 months; MD; -1.3 (95%CI -2.5 to -0.02); Risk of bias: All domain - High, Selection - Low, Blinding - Low, Incomplete outcome data - High, Outcome reporting - Low, Measurement - Low, Crossover - Low, Subgroups - Low; Indirectness of outcome: No indirectness; Group 1 Number missing: N/A, Reason: Partial withdrawals, withdrew from treatment, complete withdrawals/lost to follow-up, withdrew from treatment and follow-up, withdrew consent, ineligible, disease progression, other reason, lost to follow-up; Group 2 Number missing: N/A, Reason: Partial withdrawals, withdrew from treatment, complete withdrawals/lost to follow-up, withdrew from treatment and follow-up, withdrew consent, ineligible, disease progression, other reason, lost to follow-up Protocol outcome 4: Average daily dose of antihypertensive medication at longest reported - Actual outcome for Upper arm cuff: Overall defined daily dose at 12 months: Group 1: mean 2.69 (SD 1.82); n=330, Group 2: mean 2.27 (SD 1.65); n=350 Risk of bias: All domain - High, Selection - Low, Blinding - Low, Incomplete outcome data - High, Outcome reporting - Low, Measurement - Low, Crossover - Low, Subgroups - Low; Indirectness of outcome: No indirectness; Group 1 Number missing: N/A, Reason: Partial withdrawals, withdrew from treatment, complete withdrawals/lost to follow-up, withdrew from treatment and follow-up, withdrew consent, ineligible, disease progression, other reason, lost to follow-up; Group 2 Number missing: N/A, Reason: Partial withdrawals, withdrew from treatment, complete withdrawals/lost to follow-up, withdrew from treatment and follow-up, withdrew consent, ineligible, disease progression, other reason, lost to follow-up Protocol outcome 5: Average number of visits at longest reported - Actual outcome for Upper arm cuff: Mean number of consultations between baseline and 12 months at 12 months; Group 1: mean 2.2 (SD 2.54); n=330, Group 2: mean 2.1 (SD 2.03); n=350 Risk of bias: All domain - High, Selection - Low, Blinding - Low, Incomplete outcome data - High, Outcome reporting - Low, Measurement - Low, Crossover - Low, Subgroups - Low; Indirectness of outcome: No indirectness; Group 1 Number missing: N/A, Reason: Partial withdrawals, withdrew from treatment, complete withdrawals/lost to follow-up, withdrew from treatment and follow-up, withdrew consent, ineligible, disease progression, other reason, lost to follow-up; Group 2 Number missing: N/A, Reason: Partial withdrawals, withdrew from treatment, complete withdrawals/lost to follow-up, withdrew from treatment and follow-up, withdrew consent, ineligible, disease progression, other reason, lost to follow-up Protocol outcome 6: Hypotension (dizziness) at longest reported - Actual outcome for Upper arm cuff: Dizziness at 12 months; Group 1: 72/326, Group 2: 61/348 Risk of bias: All domain - High, Selection - Low, Blinding - High, Incomplete outcome data - High, Outcome reporting - Low, Measurement - Low, Crossover - Low, Subgroups - Low; Indirectness of outcome: No indirectness; Group 1 Number missing: N/A, Reason: Partial withdrawals, withdrew from treatment, complete withdrawals/lost to follow-up, withdrew from treatment and follow-up, withdrew consent, ineligible, disease progression, other reason, lost to follow-up; Group 2 Number missing: N/A, Reason: Partial withdrawals, withdrew from treatment, complete withdrawals/lost to follow-up, withdrew from treatment and follow-up, withdrew consent, ineligible, disease progression, other reason, lost to follow-up
Protocol outcomes not reported by the study
All-cause mortality at longest reported; Stroke (ischaemic or haemorrhagic) at longest reported; Proportion of people controlled to a target at longest reported; Intolerance to device at longest reported

Mon
itorin
g b
lood p
ressure
Hyp
erte
nsio
n in
adu
lts: D
RA
FT
FO
R C
ON
SU
LT
AT
ION
© N
atio
nal In
stitu
te fo
r He
alth
an
d C
are
Exce
llence
, 201
9
81
Study Simpson 2011117
Study type RCT (Patient randomised; Parallel)
Number of studies (number of participants) (n=260)
Countries and setting Conducted in Canada
Line of therapy Adjunctive to current care
Duration of study Intervention time: 12 months
Method of assessment of guideline condition
Adequate method of assessment or diagnosis
Stratum Upper arm cuff
Subgroup analysis within study Not applicable
Inclusion criteria People were eligible if they had type 2 diabetes, were regularly seen by the primary care team and did not qualify for urgent specialist referral and assessment (according to protocol, a fasting blood glucose ≥ mmol/l, blood pressure ≥220/120 mmHg, or triglycerides ≥15 mmol/l).
Exclusion criteria We excluded people who were followed in specialty clinics for diabetes, hypertension, or dyslipidaemia; who were cognitively impaired; who were not responsible for their own medication administration; or who were unable to communicate in English.
Recruitment/selection of people Eligible people were identified from the clinic roster, and a clinic staff member made initial contact to tell people about the study.
Age, sex and family origin Age - Mean (SD): 59.1 (11.6). Sex: (M:F): 149 female, 111 male. Family origin: N/A
Indirectness of population No indirectness
Interventions (n=129) Intervention 1: Clinic/office measurement. Control people received usual care by the primary care team without contributions from study pharmacists, except for standardized blood pressure measurements at the end of the follow-up period. No further details stated. Duration 12 months. Concurrent medication/care: N/A. Indirectness: Serious indirectness; Indirectness comment: Usual care (n=131) Intervention 2: Pharmacy measurement. Conducted by 2 pharmacists. The intervention program began with an in-person visit with a study pharmacist to identify all prescription, non-prescription, complementary, and alternative medications. Pharmacists also measured the person’s height, weight, heart rate, and blood pressure. Blood pressure was measured according to the Canadian Hypertension Education Program recommendations using the BPTru BPM-100 (VSM Med Tech, Coquitlam, BC) automated machine set to report the average of 5 measurements at 1-minute intervals. Pharmacists then formulated guideline-concordant recommendations to optimize medication management of blood pressure and other

Mon
itorin
g b
lood p
ressure
Hyp
erte
nsio
n in
adu
lts: D
RA
FT
FO
R C
ON
SU
LT
AT
ION
© N
atio
nal In
stitu
te fo
r He
alth
an
d C
are
Exce
llence
, 201
9
82
cardiovascular risk factors. Duration 12 months. Concurrent medication/care: N/A. Indirectness: Serious indirectness
Funding Academic or government funding (Operating grant funding was provided by the Canadian Diabetes Association, the Institute of Health Economics, and the Alberta Heritage Foundation for Medical Research [AHFMR])
RESULTS (NUMBERS ANALYSED) AND RISK OF BIAS FOR COMPARISON: CLINIC/OFFICE MEASUREMENT versus PHARMACY MEASUREMENT Protocol outcome 1: All-cause mortality at longest reported - Actual outcome for Upper arm cuff: All-cause mortality at 12 months; Group 1: 1/129, Group 2: 0/131 Risk of bias: All domain - Very high, Selection - Low, Blinding - Low, Incomplete outcome data - High, Outcome reporting - High, Measurement - Low, Crossover - Low, Subgroups - Low; Indirectness of outcome: Serious indirectness; Group 1 Number missing: 16, Reason: withdrew, lost to follow-up, died; Group 2 Number missing: 21, Reason: withdrew, lost to follow-up Protocol outcome 2: Reduction in clinic blood pressure at longest reported - Actual outcome for Upper arm cuff: Reduction in blood pressure, systolic at 12 months; Group 1: mean -2.5 (SD 15.4983); n=129, Group 2: mean -7.4 (SD 16.1988); n=131 Risk of bias: All domain - High, Selection - Low, Blinding - Low, Incomplete outcome data - High, Outcome reporting - Low, Measurement - Low, Crossover - Low, Subgroups - Low; Indirectness of outcome: Serious indirectness; Group 1 Number missing: 16, Reason: withdrew, lost to follow-up, died; Group 2 Number missing: 21, Reason: withdrew, lost to follow-up - Actual outcome for Upper arm cuff: Reduction in blood pressure, diastolic at 12 months; Group 1: mean 0.6 (SD 11.4802); n=129, Group 2: mean -2.3 (SD 11.5706); n=131 Risk of bias: All domain - High, Selection - Low, Blinding - Low, Incomplete outcome data - High, Outcome reporting - Low, Measurement - Low, Crossover - Low, Subgroups - Low; Indirectness of outcome: Serious indirectness; Group 1 Number missing: 16, Reason: withdrew, lost to follow-up, died; Group 2 Number missing: 21, Reason: withdrew, lost to follow-up Protocol outcome 3: Average number of visits at longest reported - Actual outcome for Upper arm cuff: Contacts per patient for all resources (excluding pharmacists) at 12 months; Pharmacy group: Median (IQR) - 3 (1-6) Usual care group: Median (IQR) - 2 (2 - 5); Risk of bias: All domain -; Indirectness of outcome: Serious indirectness
Protocol outcomes not reported by the study
Health-related quality of life at longest reported; Stroke (ischaemic or haemorrhagic) at longest reported; Myocardial infarction at longest reported; Proportion of people controlled to a target at longest reported; Average daily dose of antihypertensive medication at longest reported; Intolerance to device at longest reported; Hypotension (dizziness) at longest reported

Mon
itorin
g b
lood p
ressure
Hyp
erte
nsio
n in
adu
lts: D
RA
FT
FO
R C
ON
SU
LT
AT
ION
© N
atio
nal In
stitu
te fo
r He
alth
an
d C
are
Exce
llence
, 201
9
83
Study Stergiou 2014126
Study type RCT (Patient randomised; Parallel)
Number of studies (number of participants) (n=145)
Countries and setting Conducted in United Kingdom, Unknown
Line of therapy Adjunctive to current care
Duration of study Intervention time: 12 months
Method of assessment of guideline condition
Adequate method of assessment/diagnosis
Stratum Upper arm cuff
Subgroup analysis within study Stratified then randomised
Inclusion criteria Consecutive adults aged >30 years referred to a hospital outpatient hypertension clinic untreated or treated for <2 weeks were considered for inclusion.
Exclusion criteria Exclusion criteria were clinic BP ≥180 mmHg systolic and/or ≥110 mmHg diastolic; secondary hypertension; sustained arrhythmia; pregnancy; history of coronary heart disease, heart failure, or stroke; serum creatinine >2 mg/dl or overt proteinuria; uncontrolled diabetes (HbA1c >8%); use of any drugs known to affect BP (excluding aspirin up to 300 mg/day and statins); any severe non-cardiovascular disease (for example, cancer, liver cirrhosis, respiratory failure); inability to self-monitor BP at home; clinic systolic BP <160 mmHg and diastolic BP <100 mmHg in <6 months of follow-up in subjects with no other cardiovascular risk factors.
Age, sex and family origin Age - Mean (SD): 50.75 (10.3). Sex (M:F): 69 male, 47 female. Family origin: N/A
Indirectness of population No indirectness
Interventions (n=73) Intervention 1: Home measurement without telemonitoring. In arm A, neither clinic nor ambulatory BP measurements were made during the 12-month follow-up period. In arm A, controlled hypertension was defined as home BP levels at the pre-set goal in 2 visits 4 weeks apart. Performed for 7 routine workdays within 2 weeks, with duplicate self-measurements in the morning (06.00–09.00, before drug intake if treated) and the evening (18.00–21.00) after 5 minutes sitting rest and with 1 minute between measurements, using validated oscillometric devices with automated memory and PC link capacity. Duration 1 year. Concurrent medication/care: In both arms, treatment titration was performed at 4-week intervals until the pre-set BP goal was reached. After 12 months of follow-up, all participants were re-evaluated with the same tests as at baseline, including BP measurements (clinic, home, and ambulatory), laboratory investigation, and assessment of target organ damage. A form was supplied to the participants to report all their home BP readings, which were verified against those downloaded from the device memory. Indirectness: No indirectness. (n=72) Intervention 2: Ambulatory measurement. Ambulatory and clinic - Home BP monitoring was

Mon
itorin
g b
lood p
ressure
Hyp
erte
nsio
n in
adu
lts: D
RA
FT
FO
R C
ON
SU
LT
AT
ION
© N
atio
nal In
stitu
te fo
r He
alth
an
d C
are
Exce
llence
, 201
9
84
discouraged and not reviewed by the investigators (if reported by people) or taken into account in decision-making. In arm B, when clinic BP reached the pre-set goal, ambulatory BP monitoring was performed and hypertension was regarded as controlled if both clinic and awake ambulatory BP were at goal. At each clinic visit, duplicate BP measurements were taken by a doctor after 5 minutes sitting rest and with a 1-minute interval between measurements using a validated professional oscillometric device. Ambulatory BP was monitored on a routine workday at 20-minute intervals for 24 hours using validated oscillometric devices. In each participant, the same type of ambulatory monitor was used throughout the study. Duration 1 year. Concurrent medication/care: In both arms, treatment titration was performed at 4-week intervals until the pre-set BP goal was reached. After 12 months of follow-up, all participants were re-evaluated with the same tests as at baseline, including BP measurements (clinic, home, and ambulatory), laboratory investigation, and assessment of target organ damage. Indirectness: No indirectness.
Funding Principal author funded by industry (G.S. Stergiou has received consulting fees by Microlife, Widnau, Switzerland)
RESULTS (NUMBERS ANALYSED) AND RISK OF BIAS FOR COMPARISON: HOME MEASUREMENT WITHOUT TELEMONITORING versus AMBULATORY AND CLINIC MEASUREMENT Protocol outcome 1: Reduction in clinic blood pressure at longest reported - Actual outcome for Upper arm cuff: Mean difference in systolic clinic BP decline at 1 year; Mean; -2.1 (95%CI -6.8 to 2.6; 2.4 SE); Risk of bias: All domain - High, Selection - High, Blinding - Low, Incomplete outcome data - High, Outcome reporting - Low, Measurement - Low, Crossover - Low, Subgroups - Low; Indirectness of outcome: No indirectness; Group 1 Number missing: 14/73, Reason: missed follow-up visits, unwillingness to initiate treatment, treatment-related reasons, white coat hypertension, and non-study-related issues; Group 2 Number missing: 15/72, Reason: missed follow-up visits, unwillingness to initiate treatment, treatment-related reasons, white coat hypertension, and non-study-related issues - Actual outcome for Upper arm cuff: Mean difference in diastolic clinic BP decline at 1 year; Mean: -1.4 (95%CI -4.3 to 1.4; 1.4 SE); Risk of bias: All domain - High, Selection - High, Blinding - Low, Incomplete outcome data - High, Outcome reporting - Low, Measurement - Low, Crossover - Low, Subgroups - Low; Indirectness of outcome: No indirectness; Group 1 Number missing: 14/73, Reason: missed follow-up visits, unwillingness to initiate treatment, treatment-related reasons, white coat hypertension, and non-study-related issues; Group 2 Number missing: 15/72, Reason: missed follow-up visits, unwillingness to initiate treatment, treatment-related reasons, white coat hypertension, and non-study-related issues
Protocol outcomes not reported by the study
All-cause mortality at longest reported; Health-related quality of life at longest reported; Stroke (ischaemic or haemorrhagic) at longest reported; Myocardial infarction at longest reported; Proportion of people controlled to a target at longest reported; Average daily dose of antihypertensive medication at longest reported; Average number of visits at longest reported; Intolerance to device at longest reported; Hypotension (dizziness) at longest reported

Mon
itorin
g b
lood p
ressure
Hyp
erte
nsio
n in
adu
lts: D
RA
FT
FO
R C
ON
SU
LT
AT
ION
© N
atio
nal In
stitu
te fo
r He
alth
an
d C
are
Exce
llence
, 201
9
85
Study (subsidiary papers) Tucker 2017130 (Tucker 2015131)
Study type Systematic Review
Number of studies (number of participants) 25 (n=11,015)
Countries and setting Conducted in Multiple countries
Line of therapy Adjunctive to current care
Duration of study Intervention time: 12 months
Method of assessment of guideline condition
Adequate method of assessment/diagnosis
Stratum Mixed/unspecified
Subgroup analysis within study Stratified then randomised
Inclusion criteria Randomised trials were eligible that recruited people with hypertension being managed as outpatients using an intervention that included self-measurement of BP. Self-monitoring had to be without medical professional input (that is, by person with or without carer support) and using a validated monitor, with or without other co-interventions, and where a comparator group had no organised self-measurement of BP. Included studies were required to have involved at least 100 people, followed up for at least 24 weeks, and to have been published since 2000.
Exclusion criteria Studies unable to provide individual patient data
Age, sex and family origin Age - Other: Adults, details not stated. Sex (M:F): Not stated. Family origin: Mixed populations from Europe and North America.
Indirectness of population Serious indirectness: Usual care comparison and treatments in trial were not standardised
Interventions (n=973) Intervention 1: Home measurement without telemonitoring. Self-monitoring with no feedback. Duration 12 months. Concurrent medication/care: Combination of 5 trials data. Indirectness: No indirectness. (n=961) Intervention 2: Clinic or office measurement. Usual care without self-monitoring. Duration 12 months. Concurrent medication/care: data pooled from 5 trials. Indirectness: Serious indirectness. (n=616) Intervention 3: Home measurement with telemonitoring - Home measurement with telemonitoring. Self-monitoring with web or phone feedback. Duration 12 months. Concurrent medication/care: summary of 4 trials. Indirectness: No indirectness. (n=573) Intervention 4: Clinic/office measurement. Usual care. Duration 12 months. Concurrent medication/care: data pooled from 4 trials. Indirectness: Serious indirectness.
Funding Other (Public/government grants, charity, commercial.)

Mon
itorin
g b
lood p
ressure
Hyp
erte
nsio
n in
adu
lts: D
RA
FT
FO
R C
ON
SU
LT
AT
ION
© N
atio
nal In
stitu
te fo
r He
alth
an
d C
are
Exce
llence
, 201
9
86
RESULTS (NUMBERS ANALYSED) AND RISK OF BIAS FOR COMPARISON: HOME MEASUREMENT WITHOUT TELEMONITORING versus CLINIC/OFFICE MEASUREMENT 1 Protocol outcome 1: Reduction in clinic blood pressure at longest reported - Actual outcome for Mixed/unspecified: Change in clinic systolic BP at 12 months; Risk of bias: All domain - High, Crossover - Low; Indirectness of outcome: Serious indirectness; Group 1 Number missing: N/A; Group 2 Number missing: N/A - Actual outcome for Mixed/unspecified: Change in clinic diastolic BP at 12 months; Risk of bias: All domain - High, Crossover - Low; Indirectness of outcome: Serious indirectness; Group 1 Number missing: N/A; Group 2 Number missing: N/A Protocol outcome 2: Proportion of people controlled to a target at longest reported - Actual outcome for Mixed/unspecified: Impact of self-monitoring on the RR of uncontrolled BP at 12 months; Risk of bias: All domain –; Indirectness of outcome: Serious indirectness RESULTS (NUMBERS ANALYSED) AND RISK OF BIAS FOR COMPARISON: HOME MEASUREMENT WITH TELEMONITORING versus CLINIC/OFFICE MEASUREMENT 2 Protocol outcome 1: Reduction in clinic blood pressure at longest reported - Actual outcome for Mixed/unspecified: Change in clinic diastolic BP at 12 months; Risk of bias: All domain - High, Crossover - Low; Indirectness of outcome: Serious indirectness; Group 1 Number missing: N/A; Group 2 Number missing: N/A - Actual outcome for Mixed/unspecified: Change in clinic systolic BP at 12 months; Risk of bias: All domain - High, Crossover - Low; Indirectness of outcome: Serious indirectness; Group 1 Number missing: N/A; Group 2 Number missing: N/A Protocol outcome 2: Proportion of people controlled to a target at longest reported - Actual outcome for Mixed/unspecified: Impact of self-monitoring on the RR of uncontrolled BP at 12 months; Risk of bias: All domain - High, Crossover - Low; Indirectness of outcome: Serious indirectness; Group 1 Number missing: N/A; Group 2 Number missing: N/A
Protocol outcomes not reported by the study
All-cause mortality at longest reported; Health-related quality of life at longest reported; Stroke (ischaemic or haemorrhagic) at longest reported; Myocardial infarction at longest reported; Average daily dose of antihypertensive medication at longest reported; Average number of visits at longest reported; Intolerance to device at longest reported; Hypotension (dizziness) at longest reported
1

Hypertension in adults: DRAFT FOR CONSULTATION Forest plots
© National Institute for Health and Care Excellence, 2019 87
Appendix E: Forest plots 1
E.1 Home monitoring versus clinic monitoring 2
Figure 2: Cardiovascular events, (new atrial fibrillation, angina, myocardial infarction, coronary artery bypass graft or angioplasty, stroke, peripheral vascular disease, or heart failure), 12 months
3
Figure 3: Reduction in clinic blood pressure (mmHg), systolic (change in clinic systolic blood pressure), 12 months
4
Figure 4: Reduction in clinic blood pressure (mmHg), diastolic (change in clinic diastolic blood pressure), 12 months
5
Figure 5: Proportion not meeting target (varied target due to IPD – mode 140/90 mmHg), 12 months
6
Figure 6: Overall defined daily dose, 12 months
7
Study or Subgroup
McManus, 2018
Total (95% CI)
Total events
Heterogeneity: Not applicable
Test for overall effect: Z = 0.81 (P = 0.42)
Events
12
12
Total
328
328
Events
9
9
Total
350
350
Weight
100.0%
100.0%
M-H, Fixed, 95% CI
1.42 [0.61, 3.33]
1.42 [0.61, 3.33]
Home monitoring Clinic monitoring Risk Ratio Risk Ratio
M-H, Fixed, 95% CI
0.1 0.2 0.5 1 2 5 10Favours Home monitoring Favours clinic monitoring
Study or Subgroup
McManus, 2018
Tucker 2017
Total (95% CI)
Heterogeneity: Chi² = 2.28, df = 1 (P = 0.13); I² = 56%
Test for overall effect: Z = 2.72 (P = 0.007)
Mean Difference
-3.5
-1.02
SE
1.1735
1.15
Weight
49.0%
51.0%
100.0%
IV, Fixed, 95% CI
-3.50 [-5.80, -1.20]
-1.02 [-3.27, 1.23]
-2.23 [-3.84, -0.63]
Mean Difference Mean Difference
IV, Fixed, 95% CI
-50 -25 0 25 50Favours home monitoring Favours clinic monitoring
Study or Subgroup
McManus, 2018
Tucker 2017
Total (95% CI)
Heterogeneity: Chi² = 0.20, df = 1 (P = 0.66); I² = 0%
Test for overall effect: Z = 2.93 (P = 0.003)
Mean Difference
-1.5
-1.1
SE
0.6123
0.6582
Weight
53.6%
46.4%
100.0%
IV, Fixed, 95% CI
-1.50 [-2.70, -0.30]
-1.10 [-2.39, 0.19]
-1.31 [-2.19, -0.44]
Mean Difference Mean Difference
IV, Fixed, 95% CI
-50 -25 0 25 50Favours Home monitoring Favours Clinic monitoring
Study or Subgroup
Tucker 2017
Total (95% CI)
Total events
Heterogeneity: Not applicable
Test for overall effect: Z = 0.08 (P = 0.94)
Events
70
70
Total
973
973
Events
70
70
Total
961
961
Weight
100.0%
100.0%
M-H, Fixed, 95% CI
0.99 [0.72, 1.36]
0.99 [0.72, 1.36]
Home monitoring Clinic monitoring Risk Ratio Risk Ratio
M-H, Fixed, 95% CI
0.02 0.1 1 10 50Favours Home monitoring Favours Clinic monitoring
Study or Subgroup
McManus, 2018
Total (95% CI)
Heterogeneity: Not applicable
Test for overall effect: Z = 1.15 (P = 0.25)
Mean
2.42
SD
1.75
Total
328
328
Mean
2.27
SD
1.65
Total
350
350
Weight
100.0%
100.0%
IV, Fixed, 95% CI
0.15 [-0.11, 0.41]
0.15 [-0.11, 0.41]
Home monitoring Clinic monitoring Mean Difference Mean Difference
IV, Fixed, 95% CI
-4 -2 0 2 4Favours clinic monitoring Favours home monitoring

Hypertension in adults: DRAFT FOR CONSULTATION Forest plots
© National Institute for Health and Care Excellence, 2019 88
Figure 7: Mean number of consultations for hypertension, 12 months
1
Figure 8: Dizziness, hypertension specific symptoms (no further details of definition) 12 months
E.2 Home monitoring without telemonitoring versus 2
ambulatory and clinic monitoring 3
Figure 9: Reduction in clinic blood pressure (mmHg), systolic, 12 months
4
Figure 10: Reduction in clinic blood pressure (mmHg), diastolic, 12 months
E.3 Home monitoring with telemonitoring versus home 5
monitoring without telemonitoring 6
Figure 11: Cardiovascular events, (new atrial fibrillation, angina, myocardial infarction, coronary artery bypass graft or angioplasty, stroke, peripheral vascular disease, or heart failure), 12 monthsa
7 a Home monitoring (HM), Telemonitoring (TM) 8
Study or Subgroup
McManus, 2018
Total (95% CI)
Heterogeneity: Not applicable
Test for overall effect: Z = 1.69 (P = 0.09)
Mean
1.8
SD
2.54
Total
328
328
Mean
2.1
SD
2.03
Total
350
350
Weight
100.0%
100.0%
IV, Fixed, 95% CI
-0.30 [-0.65, 0.05]
-0.30 [-0.65, 0.05]
Home monitoring Clinic monitoring Mean Difference Mean Difference
IV, Fixed, 95% CI
-10 -5 0 5 10Favours home monitoring Favours clinic monitoring
Study or Subgroup
McManus, 2018
Total (95% CI)
Total events
Heterogeneity: Not applicable
Test for overall effect: Z = 0.73 (P = 0.47)
Events
50
50
Total
324
324
Events
61
61
Total
348
348
Weight
100.0%
100.0%
M-H, Fixed, 95% CI
0.88 [0.63, 1.24]
0.88 [0.63, 1.24]
Home monitoring Clinic monitoring Risk Ratio Risk Ratio
M-H, Fixed, 95% CI
0.1 0.2 0.5 1 2 5 10Favours home monitoring Favours clinic
Study or Subgroup
Stergiou, 2014
Total (95% CI)
Heterogeneity: Not applicable
Test for overall effect: Z = 0.88 (P = 0.38)
Mean Difference
-2.1
SE
2.398
Weight
100.0%
100.0%
IV, Fixed, 95% CI
-2.10 [-6.80, 2.60]
-2.10 [-6.80, 2.60]
Mean Difference Mean Difference
IV, Fixed, 95% CI
-50 -25 0 25 50Favours home monitoring Favours ambulatory/clinic
Study or Subgroup
Stergiou, 2014
Total (95% CI)
Heterogeneity: Not applicable
Test for overall effect: Z = 0.95 (P = 0.34)
Mean Difference
-1.4
SE
1.4796
Weight
100.0%
100.0%
IV, Fixed, 95% CI
-1.40 [-4.30, 1.50]
-1.40 [-4.30, 1.50]
Mean Difference Mean Difference
IV, Fixed, 95% CI
-50 -25 0 25 50Favours home monitoring Favours ambulatory/clinic
Study or Subgroup
McManus, 2018
Total (95% CI)
Total events
Heterogeneity: Not applicable
Test for overall effect: Z = 0.23 (P = 0.82)
Events
11
11
Total
330
330
Events
12
12
Total
328
328
Weight
100.0%
100.0%
M-H, Fixed, 95% CI
0.91 [0.41, 2.04]
0.91 [0.41, 2.04]
Home monitoring with TM Home monitoring Risk Ratio Risk Ratio
M-H, Fixed, 95% CI
0.01 0.1 1 10 100Favours HM with TM Favours HM without TM

Hypertension in adults: DRAFT FOR CONSULTATION Forest plots
© National Institute for Health and Care Excellence, 2019 89
Figure 12: Reduction in clinic blood pressure (mmHg), systolic, 12 monthsa
1
Figure 13: Reduction in clinic blood pressure (mmHg), diastolic, 12 monthsa
2
Figure 14: Overall defined daily dose, 12 monthsa
Figure 15: Average number of visits, 12 monthsa
Figure 17: Dizziness, hypertension specific symptoms (no further details of definition) 12 monthsa
Figure 16: Mean number of consultations for hypertension, 12 monthsa
3
Study or Subgroup
McManus, 2018
Total (95% CI)
Heterogeneity: Not applicable
Test for overall effect: Z = 0.78 (P = 0.44)
Mean
136
SD
16.1
Total
327
327
Mean
137
SD
16.7
Total
328
328
Weight
100.0%
100.0%
IV, Fixed, 95% CI
-1.00 [-3.51, 1.51]
-1.00 [-3.51, 1.51]
Home monitoring with TM Home monitoring Mean Difference Mean Difference
IV, Fixed, 95% CI
-50 -25 0 25 50Favours HM with TM Favours HM without TM
Study or Subgroup
McManus, 2018
Total (95% CI)
Heterogeneity: Not applicable
Test for overall effect: Z = 1.16 (P = 0.24)
Mean
78.7
SD
9.7
Total
328
328
Mean
77.8
SD
10.1
Total
328
328
Weight
100.0%
100.0%
IV, Fixed, 95% CI
0.90 [-0.62, 2.42]
0.90 [-0.62, 2.42]
Home monitoring with TM Home monitoring Mean Difference Mean Difference
IV, Fixed, 95% CI
-50 -25 0 25 50Favours HM with TM Favours HM without TM
Study or Subgroup
McManus, 2018
Total (95% CI)
Heterogeneity: Not applicable
Test for overall effect: Z = 1.94 (P = 0.05)
Mean
2.69
SD
1.82
Total
330
330
Mean
2.42
SD
1.75
Total
328
328
Weight
100.0%
100.0%
IV, Fixed, 95% CI
0.27 [-0.00, 0.54]
0.27 [-0.00, 0.54]
Home monitoring with TM Home monitoring Mean Difference Mean Difference
IV, Fixed, 95% CI
-4 -2 0 2 4Favours HM without TM Favours HM with TM
Study or Subgroup
Logan, 2012
Total (95% CI)
Total events
Heterogeneity: Not applicable
Test for overall effect: Z = 0.73 (P = 0.47)
Events
4
4
Total
51
51
Events
6
6
Total
49
49
Weight
100.0%
100.0%
M-H, Fixed, 95% CI
0.64 [0.19, 2.13]
0.64 [0.19, 2.13]
Home monitoring with TM Home monitoring Risk Ratio Risk Ratio
M-H, Fixed, 95% CI
0.1 0.2 0.5 1 2 5 10Favours HM with TM Favours HM without TM
Study or Subgroup
McManus, 2018
Total (95% CI)
Total events
Heterogeneity: Not applicable
Test for overall effect: Z = 2.15 (P = 0.03)
Events
72
72
Total
326
326
Events
50
50
Total
324
324
Weight
100.0%
100.0%
M-H, Fixed, 95% CI
1.43 [1.03, 1.98]
1.43 [1.03, 1.98]
HM with TM HM without TM Risk Ratio Risk Ratio
M-H, Fixed, 95% CI
0.1 0.2 0.5 1 2 5 10Favours HM with TM Favours HM without TM
Study or Subgroup
McManus, 2018
Total (95% CI)
Heterogeneity: Not applicable
Test for overall effect: Z = 2.02 (P = 0.04)
Mean
2.2
SD
2.53
Total
330
330
Mean
1.8
SD
2.54
Total
328
328
Weight
100.0%
100.0%
IV, Fixed, 95% CI
0.40 [0.01, 0.79]
0.40 [0.01, 0.79]
Home monitoring with TM Home monitoring Mean Difference Mean Difference
IV, Fixed, 95% CI
-10 -5 0 5 10Favours HM with TM Favours HM without TM

Hypertension in adults: DRAFT FOR CONSULTATION Forest plots
© National Institute for Health and Care Excellence, 2019 90
E.4 Home monitoring with telemonitoring versus clinic 1
monitoring 2
Figure 18: All-cause mortality, 12 monthsa
3
Figure 19: Cardiovascular events (defined as new atrial fibrillation, angina, myocardial infarction, coronary artery bypass graft or angioplasty, stroke, peripheral vascular disease, or heart failure in 1 study, defined as non-fatal cardiovascular events in another), 12 monthsa
4
Figure 20: Quality of life, SF-12, emotional subscale, 0–100 scale, higher score is better, 12 months
5
Figure 21: Quality of life, SF-12, physical subscale, 0–100 scale, higher is better, 12 monthsa
6
Figure 22: Quality of life, SF-12, general subscale, 0–100 scale, higher is better, 12 monthsa
7
Figure 23: Reduction in clinic blood pressure (mmHg), systolic 12 months
Study or Subgroup
Green, 2008
Total (95% CI)
Total events
Heterogeneity: Not applicable
Test for overall effect: Z = 1.42 (P = 0.16)
Events
2
2
Total
246
246
Events
0
0
Total
247
247
Weight
100.0%
100.0%
Peto, Fixed, 95% CI
7.45 [0.46, 119.44]
7.45 [0.46, 119.44]
Home monitoring with TM Clinic monitoring Peto Odds Ratio Peto Odds Ratio
Peto, Fixed, 95% CI
0.01 0.1 1 10 100Favours HM with TM Favours clinic monitoring
Study or Subgroup
Green, 2008
McManus, 2018
Total (95% CI)
Total events
Heterogeneity: Chi² = 0.20, df = 1 (P = 0.65); I² = 0%
Test for overall effect: Z = 0.91 (P = 0.36)
Events
4
11
15
Total
246
330
576
Events
2
9
11
Total
247
350
597
Weight
18.6%
81.4%
100.0%
M-H, Fixed, 95% CI
2.01 [0.37, 10.86]
1.30 [0.54, 3.09]
1.43 [0.66, 3.08]
HM with TM Clinic/office Risk Ratio Risk Ratio
M-H, Fixed, 95% CI
0.01 0.1 1 10 100Favours HM with TM Favours clinic
Study or Subgroup
Green, 2008
Total (95% CI)
Heterogeneity: Not applicable
Test for overall effect: Z = 0.39 (P = 0.70)
Mean
72.1
SD
16.8
Total
246
246
Mean
71.5
SD
17.7
Total
247
247
Weight
100.0%
100.0%
IV, Fixed, 95% CI
0.60 [-2.45, 3.65]
0.60 [-2.45, 3.65]
Home monitoring with TM Clinic monitoring Mean Difference Mean Difference
IV, Fixed, 95% CI
-100 -50 0 50 100Favours clinic Favours home monitoring
Study or Subgroup
Green, 2008
Total (95% CI)
Heterogeneity: Not applicable
Test for overall effect: Z = 0.15 (P = 0.88)
Mean
77.7
SD
30.3
Total
246
246
Mean
78.1
SD
27.7
Total
247
247
Weight
100.0%
100.0%
IV, Fixed, 95% CI
-0.40 [-5.53, 4.73]
-0.40 [-5.53, 4.73]
Home monitoring with TM Clinic monitoring Mean Difference Mean Difference
IV, Fixed, 95% CI
-100 -50 0 50 100Favours clinic monitoring Favours Hm with TM
Study or Subgroup
Green, 2008
Total (95% CI)
Heterogeneity: Not applicable
Test for overall effect: Z = 0.05 (P = 0.96)
Mean
66.6
SD
20.9
Total
246
246
Mean
66.7
SD
20.4
Total
247
247
Weight
100.0%
100.0%
IV, Fixed, 95% CI
-0.10 [-3.75, 3.55]
-0.10 [-3.75, 3.55]
Home monitoring with TM Clinic monitoring Mean Difference Mean Difference
IV, Fixed, 95% CI
-100 -50 0 50 100Favours clinic monitoring Favours HM with TM

Hypertension in adults: DRAFT FOR CONSULTATION Forest plots
© National Institute for Health and Care Excellence, 2019 91
1
Figure 24: Reduction in clinic blood pressure (mmHg), diastolic 12 months
2
Figure 25: Proportion controlled to a target, 12 monthsa
3
Figure 26: Proportion not meeting target (varied target due to IPD – mode 140/90 mmHg), 12 months
Figure 27: Overall defined daily dose, 12 monthsa
4
Figure 28: Mean number of consultations for hypertension, 12 monthsa
5
Study or Subgroup
Green, 2008
McManus, 2018
Tucker 2017
Total (95% CI)
Heterogeneity: Tau² = 0.86; Chi² = 3.39, df = 2 (P = 0.18); I² = 41%
Test for overall effect: Z = 3.69 (P = 0.0002)
Mean Difference
-2.9
-4.7
-1.98
SE
1.2924
1.1735
0.898
Weight
27.4%
31.0%
41.6%
100.0%
IV, Random, 95% CI
-2.90 [-5.43, -0.37]
-4.70 [-7.00, -2.40]
-1.98 [-3.74, -0.22]
-3.08 [-4.71, -1.44]
Mean Difference Mean Difference
IV, Random, 95% CI
-50 -25 0 25 50
Favours Home monitoring Favours Clinic monitoring
Study or Subgroup
Green, 2008
McManus, 2018
Tucker 2017
Total (95% CI)
Heterogeneity: Chi² = 1.11, df = 2 (P = 0.57); I² = 0%
Test for overall effect: Z = 2.40 (P = 0.02)
Mean Difference
-0.9
-1.3
-0.46
SE
0.718
0.6123
0.5153
Weight
23.2%
31.9%
45.0%
100.0%
IV, Fixed, 95% CI
-0.90 [-2.31, 0.51]
-1.30 [-2.50, -0.10]
-0.46 [-1.47, 0.55]
-0.83 [-1.51, -0.15]
Mean Difference Mean Difference
IV, Fixed, 95% CI
-50 -25 0 25 50Favours home monitoring Favours clinic
Study or Subgroup
Green, 2008
Total (95% CI)
Total events
Heterogeneity: Not applicable
Test for overall effect: Z = 1.55 (P = 0.12)
Events
91
91
Total
246
246
Events
75
75
Total
247
247
Weight
100.0%
100.0%
M-H, Fixed, 95% CI
1.22 [0.95, 1.56]
1.22 [0.95, 1.56]
HM with TM Clinic Risk Ratio Risk Ratio
M-H, Fixed, 95% CI
0.01 0.1 1 10 100Favours clinic Favours HM with TM
Study or Subgroup
Tucker 2017
Total (95% CI)
Total events
Heterogeneity: Not applicable
Test for overall effect: Z = 0.85 (P = 0.39)
Events
90
90
Total
616
616
Events
94
94
Total
573
573
Weight
100.0%
100.0%
M-H, Fixed, 95% CI
0.89 [0.68, 1.16]
0.89 [0.68, 1.16]
Home monitoring Clinic monitoring Risk Ratio Risk Ratio
M-H, Fixed, 95% CI
0.02 0.1 1 10 50Favours Home monitoring Favours Clinic monitoring
Study or Subgroup
McManus, 2018
Total (95% CI)
Heterogeneity: Not applicable
Test for overall effect: Z = 3.15 (P = 0.002)
Mean
2.69
SD
1.82
Total
330
330
Mean
2.27
SD
1.65
Total
350
350
Weight
100.0%
100.0%
IV, Fixed, 95% CI
0.42 [0.16, 0.68]
0.42 [0.16, 0.68]
Home monitoring with TM Clinic monitoring Mean Difference Mean Difference
IV, Fixed, 95% CI
-10 -5 0 5 10Favours clinic monitoring Favours HM with TM
Study or Subgroup
McManus, 2018
Total (95% CI)
Heterogeneity: Not applicable
Test for overall effect: Z = 0.57 (P = 0.57)
Mean
2.2
SD
2.54
Total
330
330
Mean
2.1
SD
2.03
Total
350
350
Weight
100.0%
100.0%
IV, Fixed, 95% CI
0.10 [-0.25, 0.45]
0.10 [-0.25, 0.45]
Home monitoring with TM Clinic monitoring Mean Difference Mean Difference
IV, Fixed, 95% CI
-10 -5 0 5 10Favours home with TM Favours clinic monitoring

Hypertension in adults: DRAFT FOR CONSULTATION Forest plots
© National Institute for Health and Care Excellence, 2019 92
Figure 29: Dizziness, hypertension specific symptoms (no further definition), 12 months
1
E.5 Home monitoring with telemonitoring and pharmacist care 2
versus clinic monitoring 3
Figure 30: All-cause mortality, 12 monthsa
4
Figure 31: Non-fatal Cardiovascular events (no further details given), 1 yeara
5
Figure 32: Change in blood pressure (mmHg), systolic, 12 monthsa
6
Figure 33: Change in blood pressure, diastolic, 12 monthsa
7
Figure 34: Proportion controlled to a target, 12 monthsa
8
Study or Subgroup
McManus, 2018
Total (95% CI)
Total events
Heterogeneity: Not applicable
Test for overall effect: Z = 1.48 (P = 0.14)
Events
72
72
Total
326
326
Events
61
61
Total
348
348
Weight
100.0%
100.0%
M-H, Fixed, 95% CI
1.26 [0.93, 1.71]
1.26 [0.93, 1.71]
Home monitoring Clinic monitoring Risk Ratio Risk Ratio
M-H, Fixed, 95% CI
0.1 0.2 0.5 1 2 5 10Favours home monitoring Favours clinic
Study or Subgroup
Green, 2008
Total (95% CI)
Total events
Heterogeneity: Not applicable
Test for overall effect: Z = 1.02 (P = 0.31)
Events
1
1
Total
237
237
Events
0
0
Total
247
247
Weight
100.0%
100.0%
Peto, Fixed, 95% CI
7.71 [0.15, 388.76]
7.71 [0.15, 388.76]
Hm with TM + pharmacist Clinic monitoring Peto Odds Ratio Peto Odds Ratio
Peto, Fixed, 95% CI
0.01 0.1 1 10 100Favours HMTM+ pharmacist Favours clinic monitoring
Study or Subgroup
Green, 2008
Total (95% CI)
Total events
Heterogeneity: Not applicable
Test for overall effect: Z = 0.49 (P = 0.62)
Events
3
3
Total
237
237
Events
2
2
Total
247
247
Weight
100.0%
100.0%
M-H, Fixed, 95% CI
1.56 [0.26, 9.27]
1.56 [0.26, 9.27]
Hm with TM + pharmacist Clinic monitoring Risk Ratio Risk Ratio
M-H, Fixed, 95% CI
0.01 0.1 1 10 100Favours HMTM + pharmacist Favours clinic monitoring
Study or Subgroup
Green, 2008
Total (95% CI)
Heterogeneity: Not applicable
Test for overall effect: Z = 6.89 (P < 0.00001)
Mean
-14.2
SD
14.0658
Total
237
237
Mean
-5.3
SD
14.3625
Total
247
247
Weight
100.0%
100.0%
IV, Fixed, 95% CI
-8.90 [-11.43, -6.37]
-8.90 [-11.43, -6.37]
Hm with TM + pharmacist Clinic monitoring Mean Difference Mean Difference
IV, Fixed, 95% CI
-100 -50 0 50 100Favours HMTM + pharmacist Favours clinic monitoring
Study or Subgroup
Green, 2008
Total (95% CI)
Heterogeneity: Not applicable
Test for overall effect: Z = 4.88 (P < 0.00001)
Mean
-7
SD
7.8144
Total
237
237
Mean
-3.5
SD
7.9792
Total
247
247
Weight
100.0%
100.0%
IV, Fixed, 95% CI
-3.50 [-4.91, -2.09]
-3.50 [-4.91, -2.09]
Hm with TM + pharmacist Clinic monitoring Mean Difference Mean Difference
IV, Fixed, 95% CI
-50 -25 0 25 50Favours HMTM + pharmacist Favours clinic monitoring
Study or Subgroup
Green, 2008
Total (95% CI)
Total events
Heterogeneity: Not applicable
Test for overall effect: Z = 5.47 (P < 0.00001)
Events
134
134
Total
237
237
Events
76
76
Total
247
247
Weight
100.0%
100.0%
M-H, Fixed, 95% CI
1.84 [1.48, 2.28]
1.84 [1.48, 2.28]
Hm with TM + pharmacist Clinic monitoring Risk Ratio Risk Ratio
M-H, Fixed, 95% CI
0.01 0.1 1 10 100Favours clinic monitoring Favours HMTM + pharmacist

Hypertension in adults: DRAFT FOR CONSULTATION Forest plots
© National Institute for Health and Care Excellence, 2019 93
Figure 35: Quality of life, SF-12, emotional subscale, 0–100 scale, higher score is better, 12 monthsa
1
Figure 36: Quality of life, SF-12, physical subscale, 0–100 scale, higher score is better, 12 monthsa
2
Figure 37: Quality of life, SF-12, general subscale, 0–100 scale, higher score is better, 12 monthsa
E.6 Home monitoring with telemonitoring and pharmacist care 3
versus home monitoring with telemonitoring 4
Figure 38: All-cause mortality, 12 months
5
Figure 39: Non-fatal Cardiovascular events (no further details given), 12 months
6
Study or Subgroup
Green, 2008
Total (95% CI)
Heterogeneity: Not applicable
Test for overall effect: Z = 0.12 (P = 0.91)
Mean
71.7
SD
19.7
Total
237
237
Mean
71.5
SD
17.7
Total
247
247
Weight
100.0%
100.0%
IV, Fixed, 95% CI
0.20 [-3.14, 3.54]
0.20 [-3.14, 3.54]
HM with TM + pharmacist Clinic monitoring Mean Difference Mean Difference
IV, Fixed, 95% CI
-100 -50 0 50 100Favours clinic monitoring Favours HMTM + pharmacist
Study or Subgroup
Green, 2008
Total (95% CI)
Heterogeneity: Not applicable
Test for overall effect: Z = 1.18 (P = 0.24)
Mean
81
SD
26.5
Total
237
237
Mean
78.1
SD
27.7
Total
247
247
Weight
100.0%
100.0%
IV, Fixed, 95% CI
2.90 [-1.93, 7.73]
2.90 [-1.93, 7.73]
HM with TM + pharmacist Clinic monitoring Mean Difference Mean Difference
IV, Fixed, 95% CI
-100 -50 0 50 100Favours clinic monitoring Favours HMTM + pharmacist
Study or Subgroup
Green, 2008
Total (95% CI)
Heterogeneity: Not applicable
Test for overall effect: Z = 0.05 (P = 0.96)
Mean
66.6
SD
22.2
Total
237
237
Mean
66.7
SD
20.4
Total
247
247
Weight
100.0%
100.0%
IV, Fixed, 95% CI
-0.10 [-3.90, 3.70]
-0.10 [-3.90, 3.70]
HM with TM + pharmacist Clinic monitoring Mean Difference Mean Difference
IV, Fixed, 95% CI
-100 -50 0 50 100Favours clinic monitoring Favours HMTM + pharmacist
Study or Subgroup
Green, 2008
Total (95% CI)
Total events
Heterogeneity: Not applicable
Test for overall effect: Z = 0.54 (P = 0.59)
Events
1
1
Total
237
237
Events
2
2
Total
246
246
Weight
100.0%
100.0%
M-H, Fixed, 95% CI
0.52 [0.05, 5.69]
0.52 [0.05, 5.69]
HM with TM + pharmacist Home monitoring with TM Risk Ratio Risk Ratio
M-H, Fixed, 95% CI
0.01 0.1 1 10 100Favours HMTM+ pharmacist Favours HM with TM
Study or Subgroup
Green, 2008
Total (95% CI)
Total events
Heterogeneity: Not applicable
Test for overall effect: Z = 0.33 (P = 0.74)
Events
3
3
Total
237
237
Events
4
4
Total
246
246
Weight
100.0%
100.0%
M-H, Fixed, 95% CI
0.78 [0.18, 3.44]
0.78 [0.18, 3.44]
HM with TM + pharmacist Home monitoring with TM Risk Ratio Risk Ratio
M-H, Fixed, 95% CI
0.01 0.1 1 10 100Favours HMTM+ pharmacist Favours HM with TM

Hypertension in adults: DRAFT FOR CONSULTATION Forest plots
© National Institute for Health and Care Excellence, 2019 94
Figure 40: Change in blood pressure (mmHg), systolic, 12 monthsa
1
Figure 41: Change in blood pressure (mmHg), diastolic, 12 monthsa
2
Figure 42: Quality of life, SF-12, emotional subscale, 0–100 scale, higher score is better, 12 monthsa
3
Figure 43: Quality of life, SF-12, physical subscale, 0–100 scale, higher score is better, 12 monthsa
4
Figure 44: Quality of life, SF-12, general subscale, 0–100 scale, higher score is better, 12 monthsa
E.7 Home-monitoring (with self-titration) and telemonitoring 5
versus clinic monitoring 6
Figure 45: Change in clinic blood pressure (mmHg), systolic, 12 monthsa
7
Study or Subgroup
Green, 2008
Total (95% CI)
Heterogeneity: Not applicable
Test for overall effect: Z = 4.64 (P < 0.00001)
Mean
-14.2
SD
14.0658
Total
237
237
Mean
-8.2
SD
14.3331
Total
246
246
Weight
100.0%
100.0%
IV, Fixed, 95% CI
-6.00 [-8.53, -3.47]
-6.00 [-8.53, -3.47]
HM with TM + pharmacist Home monitoring with TM Mean Difference Mean Difference
IV, Fixed, 95% CI
-100 -50 0 50 100Favours HMTM + pharmacist Favours HMTM
Study or Subgroup
Green, 2008
Total (95% CI)
Heterogeneity: Not applicable
Test for overall effect: Z = 3.62 (P = 0.0003)
Mean
-7
SD
7.8144
Total
237
237
Mean
-4.4
SD
7.9629
Total
246
246
Weight
100.0%
100.0%
IV, Fixed, 95% CI
-2.60 [-4.01, -1.19]
-2.60 [-4.01, -1.19]
HM with TM + pharmacist Home monitoring with TM Mean Difference Mean Difference
IV, Fixed, 95% CI
-100 -50 0 50 100Favours HMTM + pharmacist Favours HMTM
Study or Subgroup
Green, 2008
Total (95% CI)
Heterogeneity: Not applicable
Test for overall effect: Z = 0.24 (P = 0.81)
Mean
71.7
SD
19.7
Total
237
237
Mean
72.1
SD
16.8
Total
246
246
Weight
100.0%
100.0%
IV, Fixed, 95% CI
-0.40 [-3.67, 2.87]
-0.40 [-3.67, 2.87]
HM with TM + pharmacist Home monitoring with TM Mean Difference Mean Difference
IV, Fixed, 95% CI
-100 -50 0 50 100Favours HM with TM Favour HM with pharmacist
Study or Subgroup
Green, 2008
Total (95% CI)
Heterogeneity: Not applicable
Test for overall effect: Z = 1.28 (P = 0.20)
Mean
81
SD
26.5
Total
237
237
Mean
77.7
SD
30.3
Total
246
246
Weight
100.0%
100.0%
IV, Fixed, 95% CI
3.30 [-1.77, 8.37]
3.30 [-1.77, 8.37]
HM with TM + pharmacist Home monitoring with TM Mean Difference Mean Difference
IV, Fixed, 95% CI
-100 -50 0 50 100Favours HM with TM Favours HMTM + pharmacist
Study or Subgroup
Green, 2008
Total (95% CI)
Heterogeneity: Not applicable
Test for overall effect: Z = 0.00 (P = 1.00)
Mean
66.6
SD
22.2
Total
237
237
Mean
66.6
SD
20.9
Total
246
246
Weight
100.0%
100.0%
IV, Fixed, 95% CI
0.00 [-3.85, 3.85]
0.00 [-3.85, 3.85]
HM with TM + pharmacist Home monitoring with TM Mean Difference Mean Difference
IV, Fixed, 95% CI
-100 -50 0 50 100Favours HM with TM Favours HMTM + pharmacist
Study or Subgroup
McManus, 2010
Total (95% CI)
Heterogeneity: Not applicable
Test for overall effect: Z = 3.32 (P = 0.0009)
Mean
134.7
SD
18.6341
Total
234
234
Mean
140.3
SD
18.3146
Total
246
246
Weight
100.0%
100.0%
IV, Fixed, 95% CI
-5.60 [-8.91, -2.29]
-5.60 [-8.91, -2.29]
Home monitoring with TM Clinic monitoring Mean Difference Mean Difference
IV, Fixed, 95% CI
-100 -50 0 50 100Favours HM with TM Favours clinic monitoring

Hypertension in adults: DRAFT FOR CONSULTATION Forest plots
© National Institute for Health and Care Excellence, 2019 95
Figure 46: Change in clinic blood pressure (mmHg), diastolic, 12 monthsa
1
Figure 47: Quality of life, EQ-5D, 0.594 to 1, higher score is better, 12 monthsa
2
Figure 48: Mean number of consultations for hypertension, 12 monthsa
3
Figure 49: Mean number of antihypertensive drugs, 12 monthsa
E.8 Pharmacy monitoring versus clinic monitoring 4
Figure 50: All-cause mortality, 12 months
5
Figure 51: Change in blood pressure (mmHg), systolic, 12 months
6
Study or Subgroup
McManus, 2010
Total (95% CI)
Heterogeneity: Not applicable
Test for overall effect: Z = 2.14 (P = 0.03)
Mean
77.5
SD
11.6463
Total
234
234
Mean
79.8
SD
11.9443
Total
246
246
Weight
100.0%
100.0%
IV, Fixed, 95% CI
-2.30 [-4.41, -0.19]
-2.30 [-4.41, -0.19]
Home monitoring with TM Clinic monitoring Mean Difference Mean Difference
IV, Fixed, 95% CI
-100 -50 0 50 100Favours HM with TM Favours clinic monitoring
Study or Subgroup
McManus, 2010
Total (95% CI)
Heterogeneity: Not applicable
Test for overall effect: Z = 0.51 (P = 0.61)
Mean
0.826
SD
0.26
Total
234
234
Mean
0.838
SD
0.26
Total
246
246
Weight
100.0%
100.0%
IV, Fixed, 95% CI
-0.01 [-0.06, 0.03]
-0.01 [-0.06, 0.03]
Home monitoring with TM Clinic monitoring Mean Difference Mean Difference
IV, Fixed, 95% CI
-1 -0.5 0 0.5 1Favours clinic monitoring Favours home with TM
Study or Subgroup
McManus, 2010
Total (95% CI)
Heterogeneity: Not applicable
Test for overall effect: Z = 1.39 (P = 0.16)
Mean
3.2
SD
2.3293
Total
234
234
Mean
3.5
SD
2.3889
Total
246
246
Weight
100.0%
100.0%
IV, Fixed, 95% CI
-0.30 [-0.72, 0.12]
-0.30 [-0.72, 0.12]
Home monitoring with TM Clinic monitoring Mean Difference Mean Difference
IV, Fixed, 95% CI
-10 -5 0 5 10Favours HM with TM Favours clinic monitoring
Study or Subgroup
McManus, 2010
Total (95% CI)
Heterogeneity: Not applicable
Test for overall effect: Z = 2.79 (P = 0.005)
Mean
2.1
SD
1.5528
Total
234
234
Mean
1.7
SD
1.5926
Total
246
246
Weight
100.0%
100.0%
IV, Fixed, 95% CI
0.40 [0.12, 0.68]
0.40 [0.12, 0.68]
Home monitoring with TM Clinic monitoring Mean Difference Mean Difference
IV, Fixed, 95% CI
-10 -5 0 5 10Favours clinic monitoring Favours HM with TM
Study or Subgroup
Simpson, 2011
Total (95% CI)
Total events
Heterogeneity: Not applicable
Test for overall effect: Z = 1.01 (P = 0.31)
Events
0
0
Total
131
131
Events
1
1
Total
129
129
Weight
100.0%
100.0%
Peto, Fixed, 95% CI
0.13 [0.00, 6.72]
0.13 [0.00, 6.72]
Pharmacy Clinic monitoring Peto Odds Ratio Peto Odds Ratio
Peto, Fixed, 95% CI
0.01 0.1 1 10 100Favours pharmacy Favours clinic monitoring
Study or Subgroup
Simpson, 2011
Total (95% CI)
Heterogeneity: Not applicable
Test for overall effect: Z = 2.49 (P = 0.01)
Mean
-7.4
SD
16.1988
Total
131
131
Mean
-2.5
SD
15.4983
Total
129
129
Weight
100.0%
100.0%
IV, Fixed, 95% CI
-4.90 [-8.75, -1.05]
-4.90 [-8.75, -1.05]
Pharmacy Clinic monitoring Mean Difference Mean Difference
IV, Fixed, 95% CI
-50 -25 0 25 50Favours pharmacy Favours clinic monitoring

Hypertension in adults: DRAFT FOR CONSULTATION Forest plots
© National Institute for Health and Care Excellence, 2019 96
Figure 52: Change in blood pressure (mmHg), diastolic, 12 months
1
Study or Subgroup
Simpson, 2011
Total (95% CI)
Heterogeneity: Not applicable
Test for overall effect: Z = 2.03 (P = 0.04)
Mean
-2.3
SD
11.5706
Total
131
131
Mean
0.6
SD
11.4802
Total
129
129
Weight
100.0%
100.0%
IV, Fixed, 95% CI
-2.90 [-5.70, -0.10]
-2.90 [-5.70, -0.10]
Pharmacy Clinic monitoring Mean Difference Mean Difference
IV, Fixed, 95% CI
-50 -25 0 25 50Favours pharmacy Favours clinic monitoring

Mon
itorin
g b
lood p
ressure
Hyp
erte
nsio
n in
adu
lts: D
RA
FT
FO
R C
ON
SU
LT
AT
ION
© N
atio
nal In
stitu
te fo
r He
alth
an
d C
are
Exce
llence
, 201
9
97
Appendix F: GRADE tables 1
Table 23: Clinical evidence profile: Home monitoring versus clinic monitoring 2
Quality assessment No of patients Effect
Quality Importance
No of studies
Design Risk of
bias Inconsistency Indirectness Imprecision
Other considerations
Home monitoring without telemonitoring versus clinic/office monitoring
Control Relative (95% CI)
Absolute
Cardiovascular events (follow-up 1 years)
1 randomised trials
very serious1
no serious inconsistency
serious2 very serious3 none 12/328 (3.7%)
2.6% RR 1.42 (0.61 to 3.33)
11 more per 1,000 (from 10 fewer to
61 more)
VERY LOW
CRITICAL
Change in clinic BP - change in clinic systolic BP (follow-up 1 years; Better indicated by lower values)
2 randomised trials
serious1 no serious inconsistency
very serious4 no serious imprecision
none 1301 1309 - MD 2.23 lower (3.84 to 0.63
lower)
VERY LOW
IMPORTANT
Change in clinic BP - change in clinic diastolic BP (follow-up 1 years; Better indicated by lower values)
2 randomised trials
serious1 no serious inconsistency
very serious4 no serious imprecision
none 1301 1309 - MD 1.31 lower (2.19 to 0.44
lower)
VERY LOW
IMPORTANT
Uncontrolled BP (not meeting trial target; follow-up 1 years)
1 randomised trials
serious1 no serious inconsistency
very serious4 very serious3 none 70/973 (7.2%)
7.3% RR 0.99 (0.72 to 1.36)
1 fewer per 1,000 (from 20 fewer to
26 more)
VERY LOW
IMPORTANT
Overall defined daily dose (follow-up 1 years; Better indicated by lower values)

Mon
itorin
g b
lood p
ressure
Hyp
erte
nsio
n in
adu
lts: D
RA
FT
FO
R C
ON
SU
LT
AT
ION
© N
atio
nal In
stitu
te fo
r He
alth
an
d C
are
Exce
llence
, 201
9
98
1 randomised trials
serious1 no serious inconsistency
serious2 no serious imprecision
none 328 350 - MD 0.15 higher (0.11 lower to 0.41
higher)
LOW
IMPORTANT
Mean number of consultations for hypertension (follow-up 1 years; Better indicated by lower values)
1 randomised trials
serious1 no serious inconsistency
serious2 no serious imprecision
none 328 350 - MD 0.30 lower (0.65 lower to 0.05
higher)
LOW
IMPORTANT
Dizziness (follow-up 1 years)
1 randomised trials
serious1 no serious inconsistency
serious2 serious3 none 50/324 (15.4%)
17.5% RR 0.88 (0.63 to 1.24)
21 fewer per 1,000 (from 65 fewer to
42 more)
VERY LOW
IMPORTANT
1 Downgraded by 1 increment if the majority of the evidence was at high risk of bias and downgraded by 2 increments if the majority of the evidence was at very high risk of bias. 1 2 Downgraded by 1 or 2 increments because the majority of the evidence included an indirect or very indirect population respectively. 2 3 Downgraded by 1 increment if the confidence interval crossed 1 MID or by 2 increments if the confidence interval crossed both MIDs. 3 4Downgraded by 1 or 2 increments because the majority of the evidence included an indirect or very indirect population and intervention respectively. 4
Table 24: Clinical evidence profile: Home monitoring versus ambulatory/clinic monitoring 5
Quality assessment No of patients Effect
Quality Importance
No of studies
Design Risk of
bias Inconsistency Indirectness Imprecision
Other considerations
Home monitoring without TM
Ambulatory/clinic monitoring
Relative (95% CI)
Absolute
Clinic BP decline - Systolic (follow-up 1 years; Better indicated by lower values)
1 randomised trials
serious1 no serious inconsistency
serious2 no serious imprecision
none 73 72 - MD 2.1 lower (6.8 lower to 2.6
higher)
LOW
IMPORTANT
Clinic BP decline - Diastolic (follow-up 1 years; Better indicated by lower values)
1 randomised trials
serious1 no serious inconsistency
serious2 no serious imprecision
none 73 72 - MD 1.4 lower (4.3 lower to 1.5
higher)
LOW
IMPORTANT

Mon
itorin
g b
lood p
ressure
Hyp
erte
nsio
n in
adu
lts: D
RA
FT
FO
R C
ON
SU
LT
AT
ION
© N
atio
nal In
stitu
te fo
r He
alth
an
d C
are
Exce
llence
, 201
9
99
1 Downgraded by 1 increment if the majority of the evidence was at high risk of bias and downgraded by 2 increments if the majority of the evidence was at very high risk of bias. 1 2 Downgraded by 1 or 2 increments because the majority of the evidence included an indirect or very indirect population respectively. 2 3
Table 25: Clinical evidence profile: Home monitoring with telemonitoring versus home monitoring 4
Quality assessment No of patients Effect
Quality Importance
No of studies
Design Risk of
bias Inconsistency Indirectness Imprecision
Other considerations
Home monitoring
with TM
Home monitoring without TM
Relative (95% CI)
Absolute
Cardiovascular events (follow-up 1 years)
1 randomised trials
very serious1
no serious inconsistency
serious2 very serious3 none 11/330 (3.3%)
3.7% RR 0.91 (0.41 to 2.04)
3 fewer per 1,000 (from 22 fewer to 38
more)
VERY LOW
CRITICAL
Change in clinic blood pressure, systolic (follow-up 1 years; better indicated by lower values)
1 randomised trials
serious1 no serious inconsistency
serious2 no serious imprecision
none 327 328 - MD 1.00 lower (3.51 lower to 1.51
higher)
LOW
IMPORTANT
Change in clinic blood pressure, diastolic (follow-up 1 years; better indicated by lower values)
1 randomised trials
serious1 no serious inconsistency
serious2 no serious imprecision
none 328 328 - MD 0.90 higher (0.62 lower to 2.42
higher)
LOW
IMPORTANT
Overall defined daily dose (follow-up 1 years; Better indicated by lower values)
1 randomised trials
serious1 no serious inconsistency
serious2 no serious imprecision
none 330 328 - MD 0.27 higher (0 to 0.54 higher)
LOW
IMPORTANT
Average number of visits (follow-up 1 years)
1 randomised trials
no serious risk of bias
no serious inconsistency
serious2 very serious3 none 4/51 (7.8%)
12.2% RR 0.64 (0.19 to 2.13)
44 fewer per 1,000 (from 99 fewer to
138 more)
VERY LOW
IMPORTANT
Mean number of consultations for hypertension (follow-up 1 years; Better indicated by lower values)

Mon
itorin
g b
lood p
ressure
Hyp
erte
nsio
n in
adu
lts: D
RA
FT
FO
R C
ON
SU
LT
AT
ION
© N
atio
nal In
stitu
te fo
r He
alth
an
d C
are
Exce
llence
, 201
9
100
1 randomised trials
serious1 no serious inconsistency
serious2 no serious imprecision
none 330 328 - MD 0.40 higher (0.01 to 0.79
higher)
LOW
IMPORTANT
Dizziness (follow-up 1 years)
1 randomised trials
serious1 no serious inconsistency
serious2 serious3 none 72/326 (22.1%)
15.4% RR 1.43 (1.03 to 1.98)
66 more per 1,000 (from 5 more to 151
more)
VERY LOW
IMPORTANT
1 Downgraded by 1 increment if the majority of the evidence was at high risk of bias and downgraded by 2 increments if the majority of the evidence was at very high risk of bias. 1 2 Downgraded by 1 or 2 increments because the majority of the evidence included an indirect or very indirect population respectively. 2 3 Downgraded by 1 increment if the confidence interval crossed 1 MID or by 2 increments if the confidence interval crossed both MIDs. 3
Table 26: Clinical evidence profile: Home monitoring with telemonitoring versus clinic monitoring 4
Quality assessment No of patients Effect
Quality Importance
No of studies
Design Risk of
bias Inconsistency Indirectness Imprecision
Other considerations
Home monitoring with telemonitoring versus clinic/office monitoring
Control Relative (95% CI)
Absolute
All-cause mortality (follow-up 1 years)
1 randomised trials
serious1 no serious inconsistency
serious5 very serious3 none 2/246 (0.81%)
0% Peto OR 7.45 (0.46 to
119.44)
10 more per 1,000 (from 0.01 fewer
to 0.02 more)
VERY LOW
CRITICAL
Cardiovascular events (follow-up 1 years)
2 randomised trials
very serious1
no serious inconsistency
serious2 very serious3 none 15/576 (2.6%)
1.69% RR 1.43 (0.66 to 3.08)
7 more per 1,000 (from 6 fewer to
35 more)
VERY LOW
CRITICAL
Quality of life - Emotional scale (follow-up 1 years; Better indicated by higher values)
1 randomised trials
serious1 no serious inconsistency
serious2 no serious imprecision
none 246 247 - MD 0.6 higher (2.45 lower to 3.65
higher)
LOW
CRITICAL
Quality of life - Physical (follow-up 1 years; Better indicated by higher values)

Mon
itorin
g b
lood p
ressure
Hyp
erte
nsio
n in
adu
lts: D
RA
FT
FO
R C
ON
SU
LT
AT
ION
© N
atio
nal In
stitu
te fo
r He
alth
an
d C
are
Exce
llence
, 2019
101
1 randomised trials
serious1 no serious inconsistency
serious2 no serious imprecision
none 246 247 - MD 0.4 lower (5.53 lower to 4.73
higher)
LOW
CRITICAL
Quality of life - General (follow-up 1 years; Better indicated by higher values)
1 randomised trials
serious1 no serious inconsistency
serious2 no serious imprecision
none 246 247 - MD 0.1 lower (3.75 lower to 3.55
higher)
LOW
CRITICAL
Change in clinic BP - change in clinic systolic BP (follow-up 1 years; Better indicated by lower values)
3 randomised trials
serious1 serious4 very serious2,5
no serious imprecision
none 1189 1168 - MD 3.08 lower (4.71 to 1.44
lower)
VERY LOW
IMPORTANT
Change in clinic BP - change in clinic diastolic BP (follow-up 1 years; Better indicated by lower values)
3 randomised trials
serious1 no serious inconsistency
very serious2,5
no serious imprecision
none 1189 1168 - MD 0.83 lower (1.51 to 0.15
lower)
VERY LOW
IMPORTANT
Uncontrolled BP (not meeting trial target; follow-up 1 years)
1 randomised trials
serious1 no serious inconsistency
very serious2,5
serious3 none 90/616 (14.6%)
16.4% RR 0.90 (0.69 to 1.15)
16 fewer per 1,000 (from 51
fewer to 25 more)
VERY LOW
IMPORTANT
Proportion controlled to a target (follow-up 1 years)
1 randomised trials
no serious risk of bias
no serious inconsistency
serious2 serious3 none 91/246 (37%)
30.4% RR 1.22 (0.95 to 1.56)
67 more per 1,000 (from 15 fewer to
170 more)
LOW
IMPORTANT
Overall defined daily dose (follow-up 1 years; Better indicated by lower values)
1 randomised trials
serious1 no serious inconsistency
very serious2 no serious imprecision
none 330 350 - MD 0.42 higher (0.16 to 0.68
higher)
VERY LOW
IMPORTANT
Mean number of consultations for hypertension (follow-up 1 years; Better indicated by lower values)

Mon
itorin
g b
lood p
ressure
Hyp
erte
nsio
n in
adu
lts: D
RA
FT
FO
R C
ON
SU
LT
AT
ION
© N
atio
nal In
stitu
te fo
r He
alth
an
d C
are
Exce
llence
, 201
9
102
1 randomised trials
serious1 no serious inconsistency
very serious2 no serious imprecision
none 330 350 - MD 0.10 higher (0.25 lower to 0.45
higher)
VERY LOW
IMPORTANT
Dizziness (follow-up 1 years)
1 randomised trials
serious1 no serious inconsistency
very serious2 serious3 none 72/326 (22.1%)
17.5% RR 1.26 (0.93 to 1.71)
45 more per 1,000 (from 12 fewer to
124 more)
VERY LOW
IMPORTANT
1 Downgraded by 1 increment if the majority of the evidence was at high risk of bias and downgraded by 2 increments if the majority of the evidence was at very high risk of bias. 1 2 Downgraded by 1 or 2 increments because the majority of the evidence included an indirect or very indirect population respectively. 2 3 Downgraded by 1 increment if the confidence interval crossed 1 MID or by 2 increments if the confidence interval crossed both MIDs. 3 4 'Downgraded by 1 or 2 incrments due to heterogeneity, unexplained by subgroup analyses so random effects was used. 4 5Downgraded by 1 or 2 increments because the majority of the evidence included an indirect or very indirect intervention respectively. 5
Table 27: Clinical evidence profile: Home monitoring with telemonitoring and pharmacist care versus clinic monitoring 6
Quality assessment No of patients Effect
Quality Importance
No of studies
Design Risk of
bias Inconsistency Indirectness Imprecision
Other considerations
Home monitoring with TM and pharmacist interaction
Clinic/office monitoring
Relative (95% CI)
Absolute
Quality of life - Emotional scale (follow-up 1 years; Better indicated by higher values)
1 randomised trials
serious1 no serious inconsistency
serious2 no serious imprecision
none 237 247 - MD 0.20 higher (3.14 lower to 3.54 higher)
LOW
CRITICAL
Quality of life - Physical (follow-up 1 years; Better indicated by higher values)
1 randomised trials
serious1 no serious inconsistency
serious2 no serious imprecision
none 237 247 - MD 2.90 higher (1.93 lower to 7.73 higher)
LOW
CRITICAL
Quality of life - General (follow-up 1 years; Better indicated by higher values)
1 randomised trials
serious1 no serious inconsistency
serious2 no serious imprecision
none 237 247 - MD 0.10 lower (3.9 lower to 3.7
higher)
LOW
CRITICAL

Mon
itorin
g b
lood p
ressure
Hyp
erte
nsio
n in
adu
lts: D
RA
FT
FO
R C
ON
SU
LT
AT
ION
© N
atio
nal In
stitu
te fo
r He
alth
an
d C
are
Exce
llence
, 201
9
103
Non-fatal Cardiovascular events (follow-up 1 years)
1 randomised trials
serious1 no serious inconsistency
serious2 very serious3 none 3/237 (1.3%)
0.81% RR 1.56 (0.26 to
9.27)
5 more per 1,000 (from 6 fewer to
67 more)
VERY LOW
CRITICAL
All-cause mortality (follow-up 1 years)
1 randomised trials
serious1 no serious inconsistency
serious2 very serious3 none 1/237 (0.42%)
0% Peto OR 7.71 (0.15 to
388.76)
0 more per 1,000 (from 0.01 fewer
to 0.02 more)
VERY LOW
CRITICAL
Change in systolic BP (follow-up 1 years; Better indicated by lower values)
1 randomised trials
no serious risk of bias
no serious inconsistency
serious2 serious3 none 237 247 - MD 8.90 lower (11.43 to 6.37
lower)
LOW
IMPORTANT
Change in diastolic BP (follow-up 1 years; Better indicated by lower values)
1 randomised trials
no serious risk of bias
no serious inconsistency
serious2 serious3 none 237 247 - MD 3.50 lower (4.91 to 2.09
lower)
LOW
IMPORTANT
Proportion controlled to a target (follow-up 1 years)
1 randomised trials
no serious risk of bias
no serious inconsistency
serious2 no serious imprecision
none 134/237 (56.5%)
30.8% RR 1.84 (1.48 to
2.28)
259 more per 1,000 (from 148
more to 394 more)
MODERATE
IMPORTANT
1 Downgraded by 1 increment if the majority of the evidence was at high risk of bias and downgraded by 2 increments if the majority of the evidence was at very high risk of bias. 1 2 Downgraded by 1 or 2 increments because the majority of the evidence included an indirect or very indirect intervention respectively. 2 3 Downgraded by 1 increment if the confidence interval crossed 1 MID or by 2 increments if the confidence interval crossed both MIDs. 3
Table 28: Clinical evidence profile: Home monitoring with telemonitoring and pharmacist care versus home monitoring with 4 telemonitoring 5
Quality assessment No of patients Effect Quality Importance

Mon
itorin
g b
lood p
ressure
Hyp
erte
nsio
n in
adu
lts: D
RA
FT
FO
R C
ON
SU
LT
AT
ION
© N
atio
nal In
stitu
te fo
r He
alth
an
d C
are
Exce
llence
, 201
9
104
No of studies
Design Risk of
bias Inconsistency Indirectness Imprecision
Other considerations
Home monitoring with TM +
pharmacist care
Home monitoring with telemonitoring
Relative (95% CI)
Absolute
All-cause mortality (follow-up 1 years)
1 randomised trials
serious1 no serious inconsistency
serious2 very serious3 none 1/237 (0.42%)
0.81% RR 0.52 (0.05 to
5.69)
4 fewer per 1,000 (from 8 fewer to 38
more)
VERY LOW
CRITICAL
Non-fatal Cardiovascular events (follow-up 1 years)
1 randomised trials
serious1 no serious inconsistency
serious2 very serious3 none 3/237 (1.3%)
1.6% RR 0.78 (0.18 to
3.44)
4 fewer per 1,000 (from 13
fewer to 39 more)
VERY LOW
CRITICAL
Change in systolic BP (follow-up 1 years; Better indicated by lower values)
1 randomised trials
no serious risk of bias
no serious inconsistency
serious2 serious3 none 237 246 - MD 6.00 lower (8.53 to 3.47
lower)
LOW
IMPORTANT
Change in diastolic BP (follow-up 1 years; Better indicated by lower values)
1 randomised trials
no serious risk of bias
no serious inconsistency
serious2 serious3 none 237 246 - MD 2.60 lower (4.01 to 1.19
lower)
LOW
IMPORTANT
Quality of life - Emotional scale (follow-up 1 years; Better indicated by higher values)
1 randomised trials
serious1 no serious inconsistency
serious2 no serious imprecision
none 237 246 - MD 0.40 lower (3.67 lower to 2.87 higher)
LOW
CRITICAL
Quality of life - Physical (follow-up 1 years; Better indicated by higher values)
1 randomised trials
serious1 no serious inconsistency
serious2 no serious imprecision
none 237 246 - MD 3.30 higher (1.77 lower to 8.37 higher)
LOW
CRITICAL
Quality of life - General (follow-up 1 years; Better indicated by higher values)

Mon
itorin
g b
loo
d p
ressure
Hyp
erte
nsio
n in
adu
lts: D
RA
FT
FO
R C
ON
SU
LT
AT
ION
© N
atio
nal In
stitu
te fo
r He
alth
an
d C
are
Exce
llence
, 201
9
105
1 randomised trials
serious1 no serious inconsistency
serious2 no serious imprecision
none 237 246 - MD 0.00 higher (3.85 lower to 3.85 higher)
LOW
CRITICAL
1 Downgraded by 1 increment if the majority of the evidence was at high risk of bias and downgraded by 2 increments if the majority of the evidence was at very high risk of bias. 1 2 Downgraded by 1 or 2 increments because the majority of the evidence included an indirect or very indirect intervention respectively. 2 3 Downgraded by 1 increment if the confidence interval crossed 1 MID or by 2 increments if the confidence interval crossed both MIDs. 3
4
Table 29: Clinical evidence profile: Home-monitoring (with self-titration) and telemonitoring versus clinic monitoring 5
Quality assessment No of patients Effect
Quality Importance
No of studies
Design Risk of
bias Inconsistency Indirectness Imprecision
Other considerations
Self-monitoring (with self-titration) and
telemonitoring
Clinic monitoring
Relative (95% CI)
Absolute
Change in BP systolic (follow-up 1 years; Better indicated by lower values)
1 randomised trials
serious1 no serious inconsistency
serious2 no serious imprecision
none 234 246 - MD 5.60 lower (8.91 to 2.29
lower)
LOW
IMPORTANT
Change in BP diastolic (follow-up 1 years; Better indicated by lower values)
1 randomised trials
serious1 no serious inconsistency
serious2 no serious imprecision
none 234 246 - MD 2.30 lower (4.41 to 0.19
lower)
LOW
IMPORTANT
Quality of life, EQ-5D, (follow-up 1 years; Better indicated by lower values)
1 randomised trials
serious1 no serious inconsistency
serious2 no serious imprecision
none 234 246 - MD 0.01 lower (0.06 lower to 0.03
higher)
LOW
CRITICAL
Mean number of consultations for hypertension (follow-up 1 years; Better indicated by lower values)
1 randomised trials
serious1 no serious inconsistency
serious2 no serious imprecision
none 234 246 - MD 0.30 lower (0.72 lower to 0.12
higher)
LOW
IMPORTANT

Mon
itorin
g b
lood p
ressure
Hyp
erte
nsio
n in
adu
lts: D
RA
FT
FO
R C
ON
SU
LT
AT
ION
© N
atio
nal In
stitu
te fo
r He
alth
an
d C
are
Exce
llence
, 201
9
106
Mean number of antihypertensive drugs (follow-up 1 years; Better indicated by lower values)
1 randomised trials
serious1 no serious inconsistency
serious2 no serious imprecision
none 234 246 - MD 0.40 higher (0.12 to 0.68
higher)
LOW
IMPORTANT
1 Downgraded by 1 increment if the majority of the evidence was at high risk of bias and downgraded by 2 increments if the majority of the evidence was at very high risk of bias. 1 2 Downgraded by 1 or 2 increments because the majority of the evidence included an indirect or very indirect population respectively. 2
Table 30: Clinical evidence profile: Pharmacy versus clinic monitoring 3
Quality assessment No of patients Effect
Quality Importance
No of studies
Design Risk of
bias Inconsistency Indirectness Imprecision
Other considerations
Pharmacy Clinic/office Relative (95% CI)
Absolute
All-cause mortality (follow-up 1 years)
1 randomised trials
very serious1
no serious inconsistency
serious2 very serious3 none 0/131 (0%)
0.8% Peto OR 0.13 (0 to 6.72)
1 fewer per 1,000 (from 3 fewer to 1
more)
VERY LOW
CRITICAL
Change in clinic BP, systolic (follow-up 1 years; Better indicated by lower values)
1 randomised trials
serious1 no serious inconsistency
serious2 serious3 none 131 129 - MD 4.90 lower (8.75 to 1.05 lower)
VERY LOW
IMPORTANT
Change in clinic BP, diastolic (follow-up 1 years; Better indicated by lower values)
1 randomised trials
serious1 no serious inconsistency
serious2 no serious imprecision
none 131 129 - MD 2.90 lower (5.7 to 0.1 lower)
LOW
IMPORTANT
Contacts per patients with all resources (excluding pharmacists), 12 months (follow-up 1 years; Better indicated by lower values)
1 randomised trials
very serious1
no serious inconsistency
serious2 no serious imprecision
none 131 129 - MD 0 higher (0 to 0 higher)
VERY LOW
IMPORTANT
1 Downgraded by 1 increment if the majority of the evidence was at high risk of bias and downgraded by 2 increments if the majority of the evidence was at very high risk of bias. 4 2 Downgraded by 1 or 2 increments because the majority of the evidence included an indirect or very indirect intervention respectively. 5 3 Downgraded by 1 increment if the confidence interval crossed 1 MID or by 2 increments if the confidence interval crossed both MIDs. 6

Mon
itorin
g b
lood p
ressure
Hyp
erte
nsio
n in
adu
lts: D
RA
FT
FO
R C
ON
SU
LT
AT
ION
© N
atio
nal In
stitu
te fo
r He
alth
an
d C
are
Exce
llence
, 201
9
107
1

Hypertension in adults: DRAFT FOR CONSULTATION Health economic evidence selection
© National Institute for Health and Care Excellence, 2019 108
Appendix G: Health economic evidence 1
selection 2
Figure 53: Flow chart of health economic study selection for the guideline
3
Records screened in 1st sift, n=6,211
Full-text papers assessed for eligibility in 2nd sift, n=273
Records excluded* in 1st sift, n=5,938
Papers excluded* in 2nd sift, n=238
Papers included, n=2 Studies included by review:
• Diagnosis: n=1
• Monitoring: n=1
• Initiation threshold: n=0
• Type of target: n=0
• Target level: n=0
• Step 1 treatment: n=0
• Step 2/3 treatment: n=0
• Step 4 treatment: n=0
• Relaxation: n=0
• Same day review: n=0
Papers selectively excluded, n=4 Studies selectively excluded by review:
• Diagnosis: n=2
• Monitoring: n=2
• Initiation threshold: n=0
• Type of target: n=0
• Target level: n=0
• Step 1 treatment: n=0
• Step 2/3 treatment: n=0
• Step 4 treatment: n=0
• Relaxation: n=0
• Same day review: n=0
Reasons for exclusion: see appendix I.2
Additional records identified through other sources: CG127, n=0; reference searching, n=17; provided by committee members, n=0
Full-text papers assessed for applicability and quality of methodology, n=35
Papers excluded, n=29 Studies excluded by review:
• Diagnosis: n=1
• Monitoring: n=8
• Initiation threshold: n=4
• Type of target: n=0
• Target level: n=3
• Step 1 treatment: n=5
• Step 2/3 treatment: n=8
• Step 4 treatment: n=0
• Relaxation: n=0
• Same day review: n=0
Reasons for exclusion: see appendix I.2
* Non-relevant population, intervention, comparison, design or setting; non-English language
Records identified through database searching, n=6,194

Mon
itorin
g b
lood p
ressure
Hyp
erte
nsio
n in
adu
lts: D
RA
FT
FO
R C
ON
SU
LT
AT
ION
© N
atio
nal In
stitu
te fo
r He
alth
an
d C
are
Exce
llence
, 201
9
109
Appendix H: Health economic evidence tables 1
Study Kaambwa 201358
Study details Population & interventions
Costs Health outcomes Cost effectiveness
Economic analysis: CUA (health outcome: QALYs)
Study design: Probabilistic decision analytic model
Approach to analysis: Markov model comparing self-management and telemonitoring with usual care. One-year cycles. Thirty-five-year time horizon. People begin in a ‘well’ state with poorly controlled hypertension, with the possibility of moving to other states of stroke, myocardial infarction, angina, heart failure, and death. Each event state has a post state. Baseline risk based on Framingham. Extrapolation of effect from a 12-month trial based on translating BP reduction into a RR
Population:
People with a BP at baseline of over 140/90 and receiving treatment with 2 or fewer antihypertensives (that is, uncontrolled hypertension).
Cohort settings:
Start age: 66
Separate analyses for men and women.
Intervention 1:
Usual care
People received an annual hypertension review as per UK national guidelines.
Intervention 2:
Self-management.
People were trained in the use of an automated sphygmomanometer to take readings. Home targets were adjusted from
Total costs (mean per patient) – MEN:
Intervention 1: £6,707
Intervention 2: £7,090
Incremental (2−1): £383
(95% CI: NR; p=NR)
Total costs (mean per patient) – WOMEN:
Intervention 1: £6,720
Intervention 2: £7,296
Incremental (2−1): £576
(95% CI: NR; p=NR)
Currency & cost year:
2009/10 UK pounds
Cost components incorporated:
Inpatient and outpatient visits, primary care consultations, drugs, equipment, training.
QALYs (mean per patient) – MEN:
Intervention 1: 8.92
Intervention 2: 9.16
Incremental (2−1): 0.24
(95% CI: NR; p=NR)
QALYs (mean per patient) – WOMEN:
Intervention 1: 10.46
Intervention 2: 10.57
Incremental (2−1): 0.12
(95% CI: NR; p=NR)
ICER (Intervention 2 versus Intervention 1) – MEN:
£1,624 per QALY gained (pa)
95% CI: NR
Probability Intervention 2 cost effective (£20K/30K threshold): 99%/99%
ICER (Intervention 2 versus Intervention 1) – WOMEN:
£4,923 per QALY gained (pa)
95% CI: NR
Probability Intervention 2 cost effective (£20K/30K threshold): 99%/99%
Analysis of uncertainty:
PSA based on 50,000 Monte Carlo simulations.
Sensitivity analyses included:
• Varying the time horizon from between 5 to 30 years in 5-year increments.
• Assumption regarding long-term effectiveness was tested by assessing the impact of reductions in effectiveness after the initial year – a 20% reduction in BP lowering in the intervention arm.

Mon
itorin
g b
lood p
ressure
Hyp
erte
nsio
n in
adu
lts: D
RA
FT
FO
R C
ON
SU
LT
AT
ION
© N
atio
nal In
stitu
te fo
r He
alth
an
d C
are
Exce
llence
, 201
9
110
reduction from Law 2009.
Perspective: UK NHS
Time horizon/Follow-up: 35 years
Treatment effect duration:(a) 12 months – assumed the same beyond 12 months.
Discounting: Costs: 3.5%; Outcomes: 3.5%
140/90 by 10/5 mmHg to take into account lower home BP. People used a colour traffic light system to code readings. Based on their readings and following an initial consultation with their physician, people could make medication changes without needing to re-consult.
Also, complete loss of incremental effectiveness was modelled (36% decline in impact of intervention in men and 26% in women).
These reduced effects were applied at arbitrarily chosen time points. The only analyses that led to ICERs of more than £20,000 for the intervention was:
• a 26% decline in the impact of the intervention on BP reduction (that is no incremental benefit of intervention) for women in the second year (ICER of £44,423)
• as above but effectiveness reduces in the third year (ICER of £27,801)
• as above but effectiveness reduces in the fifth year (ICER of £24,420).
Data sources
Health outcomes: Risk of secondary events not modelled.
Transition probabilities for moving between the well and CV health and dead states obtained from published sources.
Baseline risk: The mean 10-year CV risk for each patient cohort was calculated using the Framingham equations. This risk estimate was converted to a 1-year probability. And split between the 4 possible CV events. The weights attributed to each type of event was determined by CV risk profiles measured within Framingham, with coronary heart disease further subdivided into MI, HF, and angina.
Treatment effect: Age related relative risk of having a CV event following the use of antihypertensive treatment, together with associated reductions in blood pressure, was derived from Law 2009.68 This information was used to extrapolate from the 12-month reductions in BP recorded in McManus 201080 to the age-related relative risks subsequently used in the model. The base case assumed that the 12-month difference in BP between self-management and usual care groups was maintained over the lifetime of the model. The extrapolated relative risk for CHD was also assumed for MI, angina, and heart failure health states.
Quality-of-life weights: Starting QoL obtained from UK age and sex specific estimates.66 Utilities for health states were all obtained from Cooper et al.87 Future utilities were applied as multiplicative values of the UK age and sex specific estimates.
Cost sources: 2009/10 UK prices. Resource use and subsequent costs per person were applied to the initial health state in the model. Total costs per person in the trial were calculated as the sum of the costs of inpatient and outpatient visits, primary care consultations, drugs, equipment, and training. Equipment costs were annuitised and assumed a lifetime of 5 years. Replacement costs for equipment and additional training were included at 5 yearly intervals over the lifetime of the model. Cost sources not stated for intervention costs as these were reported in the original trial. Costs of CV health states based on various published sources.

Mon
itorin
g b
lood p
ressure
Hyp
erte
nsio
n in
adu
lts: D
RA
FT
FO
R C
ON
SU
LT
AT
ION
© N
atio
nal In
stitu
te fo
r He
alth
an
d C
are
Exce
llence
, 201
9
111
Comments
Source of funding: NIHR, DH,
Limitations: UK study, CUA, long-term time horizon. Appropriate interventions.
Based on a trial of only 12 months and extrapolating this effect. CV events based on risk equation rather than directly from a trial. And relative treatment effect based on mapping BP changes. No adverse events. Costs could be out of date now.
Overall applicability: Directly applicable (b) Overall quality: Potentially serious limitations(c)
Abbreviations: BP: blood pressure; CV: cardiovascular; CUA: cost–utility analysis; EQ-5D: Euroqol 5 dimensions (scale: 0.0 [death] to 1.0 [full health], negative values mean 1 worse than death); ICER: incremental cost-effectiveness ratio; NR: not reported; PA: probabilistic analysis; QALYs: quality-adjusted life years; RR: relative risk. 2 (a) For studies where the time horizon is longer than the treatment duration, an assumption needs to be made about the continuation of the study effect. For example, does a 3
difference in utility between groups during treatment continue beyond the end of treatment and if so for how long. 4 (b) Directly applicable / Partially applicable / Not applicable 5 (c) Minor limitations / Potentially serious limitations / Very serious limitations 6
7

Hypertension in adults: DRAFT FOR CONSULTATION Excluded studies
Appendix I: Excluded studies 1
I.1 Excluded clinical studies 2
Table 31: Studies excluded from the clinical review 3
Study Exclusion reason
Abdoh 20031 Incorrect interventions
Aekplakorn 20162 No relevant outcomes
Albasri 20173 Systematic Review - references checked
Anderegg 20164 Incorrect interventions
Anderson 20175 Protocol
Anonymous 20046 Conference abstract
Antonicelli 19957 Inappropriate comparison
Aoki 20048 Inappropriate comparison
Artinian 200110 No relevant outcomes
Artinian 20079 No relevant outcomes
Asayama 201611 No relevant outcomes
Bailey 199912 Less than minimum duration
Bliziotis 201213 Not review population
Bosworth 200714 Protocol
Bosworth 200915 Included in IPD - no extra outcomes to add
Bosworth 201116 Included in IPD - no extra outcomes to add
Bray 201518 Included in IPD - no extra outcomes to add
Breaux-Shropshire 201519 Less than minimum duration
Brzozowska-Kiszka 201020 Not in English
Carnahan 197521 No relevant outcomes
Carter 200824 Less than minimum duration
Carter 200922 Not in English
Carter 200923 Less than minimum duration
Castro 200625 Less than minimum duration
Celis 200526 Review
Chabot 200327 Less than minimum duration
Chambers 201328 No relevant outcomes
Chatellier 199629 No relevant outcomes
Chen 201330 Less than minimum duration
Dalfó i Baqué 200534 Not in English
Davidson 201535 Less than minimum duration
Dean 201436 Less than minimum duration
Doane 201837 Incorrect interventions
Duan 201738 Systematic Review - references checked
Earle 200140 Less than minimum duration
Earle 201039 Less than minimum duration
Fikri-Benbrahim 201341 Less than minimum duration
Franssen 201742 Protocol
Fuchs 201343 Systematic review - references checked

Hypertension in adults: DRAFT FOR CONSULTATION Excluded studies
Study Exclusion reason
Fujiwara 200244 Protocol
George 201045 Abstract
Halme 200547 Less than minimum duration
Hansen 201448 Incorrect study design
He 201749 Incorrect interventions
Hebert 201250 Included in IPD - no extra outcomes to add
Heinemann 200851 Inappropriate comparison
Hond 200452 Inappropriate comparison
Hosseininasab 201453 Less than minimum duration
Hunt 200854 Incorrect interventions
Irving 201655 Systematic review - references checked
Jegatheswaran 201756 Incorrect study design. No relevant outcomes
Jones 201357 Incorrect study design
Kaambwa 201059 Incorrect study design
Kaihara 201460 Less than minimum duration
Kawano 201061 Incorrect interventions
Kerby 201262 Less than minimum duration
Kerry 201363 Not review population
Kim 201565 Inappropriate comparison
Kim 201664 Less than minimum duration
Kushiro 201767 Incorrect study design
Maciejewski 201471 Included in IPD - no extra outcomes to add
Madsen 200873 Less than minimum duration
Magid 201374 Different treatment pathways. Unclear interventions
Margolis 201076 Unavailable. Conference abstract
Margolis 201375 Not review population
Martinez 201777 No relevant outcomes
Mckinstry 201378 Less than minimum duration
McManus 200583 Incorrect population setting
McManus 200979 Incorrect study design. Protocol
McManus 201482 More than 20% population indirectness
Myers 201284 Inappropriate comparison
Myers 201285 Not all receiving same treatment pathway
Nakao 200486 Inappropriate comparison
Niiranen 201090 Incorrect study design
O'Brien 199692 Inappropriate comparison
O'Brien 201391 Inappropriate comparison
Ogedegbe 200593 Abstract
Omboni 201196 Systematic review - references checked
Omboni 201395 Severely indirect population
Omboni 201594 Incorrect study design
Onzenoort 201098 No relevant outcomes
Onzenoort 201297 Incorrect study design
Parati 1996101 Incorrect study design
Parati 200999 Not all participants were receiving antihypertensive treatment

Hypertension in adults: DRAFT FOR CONSULTATION Excluded studies
Study Exclusion reason
Parati 2013100 Protocol
Piper 2015103 Inappropriate comparison. Systematic review: study designs inappropriate
Poteshkina 2015104 Not in English
Qi 2017105 Not all receiving same treatment pathway
Ragot 2000106 Inappropriate comparison
Ralston 2014107 Included in IPD - no extra outcomes to add
Reboldi 2014108 Inappropriate comparison
Rifkin 2013109 Not review population
Rogers 2001112 Less than minimum duration
Rogers 2002111 No relevant outcomes
Santschi 2014113 Systematic review - references checked
Schrader 2000114 No relevant outcomes
Schroeder 2004115 Systematic review - references checked
Sharman 2012116 Incorrect interventions
Smith 2016118 Less than minimum duration
Soghikian 1992119 Published before 2000
Spieker 1991120 Incorrect interventions
Spruill 2015121 Incorrect interventions
Staessen 1997122 Less than minimum duration
Staessen 2004123 Inappropriate comparison
Stahl 1984124 No relevant outcomes
Stergiou 2011125 Systematic review - references checked
Stewart 2014127 Less than minimum duration
Torres 2010129 Not in English
Uhlig 2013132 Systematic review - references checked
Ulm 2010133 Included in IPD - no extra outcomes to add
Van der Wel 2011134 No relevant outcomes
Varis 2010135 No usable outcomes
Verberk 2003137 Protocol
Verberk 2007138 no outcomes to add to IPD
Verberk 2011136 Systematic review is not relevant to review question or unclear PICO
Verdecchia 2016139 Inappropriate comparison
Vollmer 2005140 Incorrect study design
Wakefield 2011141 Not all receiving same treatment pathway
Wakefield 2012142 Not all receiving same treatment pathway
Wakefield 2014143 Less than minimum duration
Wang 2011144 Not all receiving same treatment pathway
Weber 2010145 Less than minimum duration
Xu 2017146 Protocol
Yatabe 2018147 Protocol
Yates 2004148 Incorrect study design
Zarnke 1997150 Less than minimum duration
Zarnke 1998149 No relevant outcomes
Zhao 2012151 Not review population. Incorrect interventions

Hypertension in adults: DRAFT FOR CONSULTATION Excluded studies
I.2 Excluded health economic studies 1
Table 32: Studies excluded from the health economic review 2
Reference Reason for exclusion
Boubouchairopoulou 201417 This study was assessed as partially applicable with potentially serious limitations. It is a cost comparison and a within trial analysis. However, given that a more applicable UK analysis31 was available that is also a cost utility analysis, this study was selectively excluded.
Verberk 2007138 This study was assessed as partially applicable with potentially serious limitations. It is a cost consequences analysis. However, given that a more applicable UK analysis31 was available that is also a cost utility analysis, this study was selectively excluded.
Lorgelly 200370 This study was assessed as partially applicable with very serious limitations as it is an observational study not an RCT, and there are methodological concerns about costing methods.
Rodriguez-Roca 2006110 This study was assessed as partially applicable with very serious limitations as it is based on a cross sectional study and not an RCT.
Panaloza-Ramos 2016102 This study was assessed as not applicable because the population is a high-risk population that is excluded from the clinical review. It is, however, a UK cost utility analysis.
Madsen 201172 This study was assessed as partially applicable with very serious limitations because the clinical trial the economic evaluation is based on did not meet the length of follow up criteria on the clinical protocol.
Stoddart 2013128 This study was assessed as partially applicable with very serious limitations because the clinical trial the economic evaluation is based on did not meet the length of follow up criteria on the clinical protocol.
Parati 200899 This study was assessed as partially applicable with very serious limitations because the clinical trial the economic evaluation is based on is a study protocol and therefore does not meet the review criteria.
McManus 200583 This study was assessed as not applicable because the clinical trial the economic evaluation is based on does not have the right comparison.
Staessen 2004123
This study was assessed as not applicable because the clinical trial the economic evaluation is based on does not have the right comparison.
3

Hypertension in adults: DRAFT FOR CONSULTATION Research recommendations
Appendix J: Research recommendations 1
J.1 Automated blood pressure monitoring in people with atrial 2
fibrillation 3
Research question: Which automated blood pressure monitors are most accurate for 4 people with hypertension and atrial fibrillation? 5
Why this is important: 6
Atrial fibrillation (AF) is a key risk factor for stroke and is increasingly prevalent with an 7 ageing population. The combination of AF and hypertension puts individuals at a higher risk 8 still. Overall, it is estimated that 1.4 million people in England have AF, which is 2.5% of the 9 population, and 65% of those with AF are aged over 65. Currently, automated blood pressure 10 monitors are used for the majority of NHS consultations and blood pressure measurements 11 both in primary and secondary care; however, most measurements from automated blood 12 pressure monitors are inaccurate in people with AF because the oscillometric algorithms 13 designed to measure blood pressure are validated in sinus rhythm and do not necessarily 14 function in AF, especially when the heart rhythm is very irregular. 15
Criteria for selecting high-priority research recommendations: 16
PICO question Population: People with atrial fibrillation with or suspected to have hypertension.
Target condition: Hypertension
Index test: measurement of blood pressure using automated blood pressure monitors.
Reference test: measurement of blood pressure using a manual mercury sphygmomanometer.
Outcome(s): accuracy as defined by a recognised validation protocol, for example, BHS, ESH or AAMI (level of agreement with reference standard).
Importance to patients or the population
Treatment of both hypertension and atrial fibrillation aims to reduce stroke risk. The accurate measurement of blood pressure is a prerequisite for hypertension management.
Relevance to NICE guidance
High quality research in this area may enable future updates of this guidance to make a strong recommendation on the use of automated blood pressure monitoring in atrial fibrillation, which was not possible in the present guideline due to the lack of good quality evidence.
Relevance to the NHS
Most blood pressure measurement in the NHS utilises automated blood pressure monitors and this is likely to be the case even in AF. Inaccurate measurement of blood pressure in these people may lead to both over and under treatment of hypertension.
National priorities N/A
Current evidence base
Evidence for blood pressure measurement in people with atrial fibrillation was not reviewed, However the suerveillance review informing the update of this guideline didn’t identify sufficient new evidence to inform this, so the research recommendation has been carried forward.
Equality None.
Study design Validation study.
Feasibility No major feasibility or ethical issues.
Other comments None
Importance High: the research is essential to inform future updates of key recommendations in the guideline.

Hypertension in adults: DRAFT FOR CONSULTATION Research recommendations
commendations in the guideline.
1
2