hypersonic aerody namic appraisal of winged blunt, rather sharp and spatuled body … ·...
TRANSCRIPT

1
Abstract
The paper deals with the hypersonic
aerodynamic analysis of three reusable and
unmanned flying laboratories designed to
perform a return flight from low Earth orbit to
provide experimental data in the framework of
re-entry technologies. Several design
approaches, ranging from low-order methods to
computational fluid dynamics analyses, have
been addressed in this work. In particular,
vehicles aerodynamic performances for a wide
range of free stream flow conditions, including
reacting and non-reacting flow and different
angles of attack, have been provided and in
some cases compared. Computational fluid
dynamics results confirm that real gas effects
seem to be fundamental for the assessment of
the concept aerodynamics, especially
concerning pitching moment evaluation.
1 Introduction
This paper deals with the aerodynamic
performance analysis of three reusable and
unmanned flying laboratories designed to
perform an experimental flight return from low
Earth orbit. Therefore, each vehicle concept
belongs to the class of orbital re-entry vehicle
(ORV) e.g., re-entry energy of the order of 25
MJ/kg. Indeed, concepts under investigation in
the present research effort are conceived as
flying test beds (FTB) that will re-enter the
Earth’s atmosphere, thus allowing to perform a
number of experiments on critical re-entry
technologies. For example, the FTB may be
useful to demonstrate maneuverability in the
upper atmosphere, to test advanced thermo-
structure concepts, such as leading edges made
of advanced thermal protection material (TPM),
and to investigate the flowfield features during
re-entry in order to validate numerical (e.g.,
CFD) and experimental prediction capabilities.
In particular, the vehicle may provide
aerodynamic and aerothermodynamic flight data
to correlate with ground test (e.g., the CIRA
Plasma Wind Tunnel “Scirocco”) results, thus
providing new insights into the understanding of
complex aerothermodynamic phenomena
occurring in flight and improving prediction
methodologies and extrapolation to flight
capabilities.
Right now Europe has undertaken the
development of three very different FTBs,
namely ARD (atmospheric re-entry
demonstrator), Expert (european experimental
reentry testbed), and IXV (intermediate
experimental vehicle). ARD was a scaled-down
version of an Apollo capsule. It was launched
by ARIANE 5 V503 on October 21, 1998. After
a fully successful sub-orbital and re-entry flight,
it was recovered in the Pacific Ocean [1]. ARD
allowed Europe to assess the aerodynamics of
such a kind of capsule that still represents a very
attractive design solution for what concerns
manned high energy re-entry (e.g., return from
Mars/Moon missions). Expert, not yet flown, is
a small sphere-cone FTB designed to perform
several in-flight experiments, such as for
example advanced thermal protection system
(TPS), wall catalyticity, flow transition
assessment and so on [2]. Finally, the
Intermediate Experimental Vehicle, which is
still under development by the European Space
Agency (ESA), is a rather blunt FTB which
HYPERSONIC AERODYNAMIC APPRAISAL OF WINGED BLUNT, RATHER SHARP AND SPATULED
BODY RE-ENTRY VEHICLES
Antonio Viviani*, Giuseppe Pezzella**
* Second University of Naples, via Roma, Aversa. Italy,
** Italian Aerospace Research Centre, via Maiorise, Capua. Italy

ANTONIO VIVIANI, GIUSEPPE PEZZELLA
2
features a lifting-body configuration. It will face
re-entry flight conditions in the fall 2014 at the
end of a sub-orbital flight characterized by an
energy level very close to that of an orbital re-
entry (e.g., 25 MJ/kg) [3]. IXV will allow to
address several in-flight experiments like
GN&C of a flapped aeroshape, TPS catalyticity,
and etc. The aerodynamic characterization of
IXV can be found in [4]. Generally speaking, a
reusable ORV operates at different flight
regimes from subsonic to hypersonic speeds. A
typical mission profile includes: ascent phase,
where the spacecraft is attached to a launch
vehicle and placed at an altitude; orbit phase,
where vehicle orbits in space till completion of
desired mission; and descent phase, where the
ORV re-enters in atmosphere and lands like a
conventional airplane for subsequent use.
During the descent up to landing phase the
spacecraft encounters subsonic speeds.
Therefore, the choice of vehicle aeroshape and
its aerodynamic characterization at hypersonic
speeds is of vital importance for safe
return.Usually, the vehicle configuration is
continuously adapted throughout the design
phase by means of a multidisciplinary trade-off
study involving several concepts. Of course the
winning configuration from the aerothermal
point of view is the one showing, at the same
time, the best aerodynamic and
aerothermodynamic performances. Right now
the most promising vehicle configurations,
resulted from trade-off design analyses, are
shown from Figure 1 to Figure 4.
Figure 1 Rather blunt (up), sharp (middle) and spatuled
body configurations.
Figure 2 shows the rather sharp vehicle
configuration, namely ORV-WSB. In this figure
the concept appears also docked with the service
module with deployed solar panels (e.g., orbital
stationing phase) [5][6].
Figure 2 Rather sharp configuration, namely ORV-WSB
and the service module with solar panels [5][6].
The rather blunt configuration, named ORV-
WBB is provided in Figure 3 [6].
Figure 3 Rather blunt vehicle configuration, named
ORV-WBB [6].
Finally, Figure 4 displays a spatuled-body (SB)
configuration, namely ORV_SB [6].
Figure 4. The Spatular body configuration, namely ORV-
SB [6].
It is worth to note that ORV concepts show
different aeroshapes to address different
experimental investigation aims. For example,
the ORV-SB configuration is most attractive
considering that it represents the only viable
way to accomplish and optimize the integration

3
HYPERSONIC AERODYNAMIC APPRAISAL OF WINGED BLUNT, RATHER SHARP AND SPATULED BODY RE-ENTRY VEHICLES
of scramjet propulsion with the vehicle
aerodynamic configuration (see Figure 5, where
the ORV-SB features a scramjet engine on the
belly side), thus evolving toward waverider
aeroshape [7].
Figure 5. The Spatular body configuration with scramjet
engine.
Indeed, since the beginning of aviation, the
trend in aircraft design has been towards greater
speed. The next frontier of speed envelope is
travel at hypersonic speeds. One of the most
practical and efficient approach to travel at these
high speeds is known as the waverider. Figure 6
shows that concerning high-performance flight
vehicle architecture converges with the
technology of airbreathing configuration.
Figure 6 Space and atmospheric vehicle development
coverage, so the technology of high-performance
launchers converges with the technology of airbreathing
aircraft. M=Mach number [7]
Such a configuration demands high
aerodynamic efficiency [7]. Indeed, the most
efficient hypersonic lifting surface is the
infinitely thin flat plate, provided that its lift-to-
drag ratio is the highest that can be achieved at
hypersonic speeds. The flat plate, however, is
obviously not practical, especially since it
cannot contain any volume for payload, engines,
fuel, etc. Therefore, a more realistic
configuration design converges to a spatular
vehicle architecture. The characteristics of this
aeroshape are: very small frontal area and
highly streamlined configuration to minimize
total surface area; very little wing area, but the
fuselage is often shaped to generate additional
lift; and propulsion assembly highly integrated
into the vehicle fuselage.
Anyway, all concepts under investigation
belong to the class of the winged body vehicles.
Such configurations, however, differ in terms of
several vehicle’s features as for example
planform shape, cross section, nose camber,
wing swept angle and, vertical empennages.
Differences in concept aeroshapes can be clearly
appreciated in Figure 7, where each aeroshape is
over imposed on each other.
Figure 7 ORV aeroshapes comparison
In this framework, this research effort provides
an overview of the aerodynamic performances
of these ORVs at hypersonic speed in
continuum flow condition. Both low-order
methods (i.e., hypersonic panel methods) and
CFD design analysis have been considered to
assess vehicle aerodynamic characteristics,
compliant with a phase-A design level. Low-
order methods design approach has been
extensively used; while CFD simulations are
performed to address the reliability of low-order
method design results and to investigate on
complex flowfield phenomena not predictable
with simplified tools [8],[9],[10]. Indeed, the
range between Mach 2 to Mach 25 is analyzed
and both perfect and reacting gas CFD
simulations are performed at several points of
the flight scenario. At flight conditions where
real gas effects occur the air is modeled as a
mixture of five species in thermo-chemical non-
equilibrium conditions. In fact, it is well known
that the pitching moment can be highly
modified by high temperature effects, thus
affecting vehicle’s stability behavior and
trimming conditions [11]. Finally, an analysis of

ANTONIO VIVIANI, GIUSEPPE PEZZELLA
4
the longitudinal and lateral-directional stability
has been also provided for one concept, together
with some of main interesting features of the
flowfield past the vehicles at different Mach
numbers.
2 Vehicles Description and Flight Scenario
Vehicle concepts feature a compact wing-body
configuration equipped with a rounded edge
delta-like fuselage cross section, a delta wing,
and V-tail. The vehicle architecture shows a
blended wing body interface and a flat bottomed
surface to increase its overall hypersonic
performance. The fuselage was designed to be
longitudinally tapered, in order to improve
aerodynamics and lateral-directional stability,
and with a cross section large enough to
accommodate all the vehicle subsystems. The
last fuselage’s feature has a large impact on
vehicle performance. In fact, from the
aerodynamic point of view, the lift and the
aerodynamic efficiency are mainly determined
by the fuselage fineness and by the shape of the
vehicle cross section [12]. The forebody is
characterized by a rather simple cone-sphere
geometry with smooth streamlined surfaces on
the upper and lower side of fuselage, and by the
nose drop-down configuration, typical of
winged hypersonic vehicles. The nose camber is
low enough to reduce elevons size in order to
provide desired trim range and to improve
internal packaging. The wing size and location
were defined on the basis of trade-off studies so
to improve vehicle aerodynamics and to provide
static stability and controllability during flight
[8],[10],[13].
Finally, the wing is swept back to assure
best performance with respect to supersonic
drag and aerodynamic heating. A properly
designed strake could be added in the future,
depending on the confirmation of a specific
landing requirement. A wing dihedral angle of 5
deg is also provided to enhance vehicle lateral-
directional stability. The wing also features a
high length-to-width ratio to minimize drag, and
a section shape that is maintained from root to
wing tip; a leading edge that is rather sharp and
a nearly flat bottomed surface to dissipate
efficiently the aeroheating. Vertical tails sweep
angle is 45 deg. Control power for vehicle is
provided by two wing-mounted elevon surfaces
(which must serve as ailerons and elevators),
and rudders surface. Used symmetrically
elevons are the primary controls for the pitch
axis, i.e., pitch control. Roll control is obtained
through asymmetrical usage of these elevons.
Rudders help to provide the directional
control, i.e., sideslip stability. During entry,
when the vehicle is flying at high angles of
attack, rudders should be augmented by reaction
control system (RCS). Then, the vehicle may be
provided by a body flap located at the trailing
edge of the fuselage in order to augment pitch
control and to shield the nozzle of propulsion
subsystem (ORV-WBB only). Indeed, trim
capability to relieve elevon loads is obtained by
body flap deflection. At hypersonic speeds a
surface behind the vehicle CoG balances the
nose up pitching moment typical of such kind of
configuration at hypersonic speeds.
Finally, the aerodynamic control surfaces
are large enough to provide stability without
sacrificing too much lift.
In the framework of the Flight Mechanics
trade-off analyses several re-entry trajectories
have been computed thus defining a vehicle
flight envelope. For example, Figure 8 shows a
number of re-entry trajectories evaluated
supposing that the vehicle heat flux constraint
ranges between 1.1 and 2 MW/m2; while the
dynamic pressure limit is equal to 12 kPa. The
Mach-Reynolds numbers grid in the altitude-
velocity map of Figure 8 is also reported in
order to characterize vehicle aerodynamics,
according to the space-based design approach
[14]. USV-3 Flight Envelope
0
20000
40000
60000
80000
100000
120000
0 1000 2000 3000 4000 5000 6000 7000 8000 9000 10000
Velocity , m/s
Alt
itu
de
, m
M∞=5 M
∞=10 M
∞=16 M
∞=20 M
∞=25
Re∞Lref=1x10⁴
Re∞Lref=1x10⁵
Re∞Lref=5x10
5
Re∞Lref=1x10
6
Figure 8. The ORV flight envelope in the velocity-altitude
map.
5
HYPERSONIC AERODYNAMIC APPRAISAL OF WINGED BLUNT, RATHER SHARP AND SPATULED BODY RE-ENTRY VEHICLES
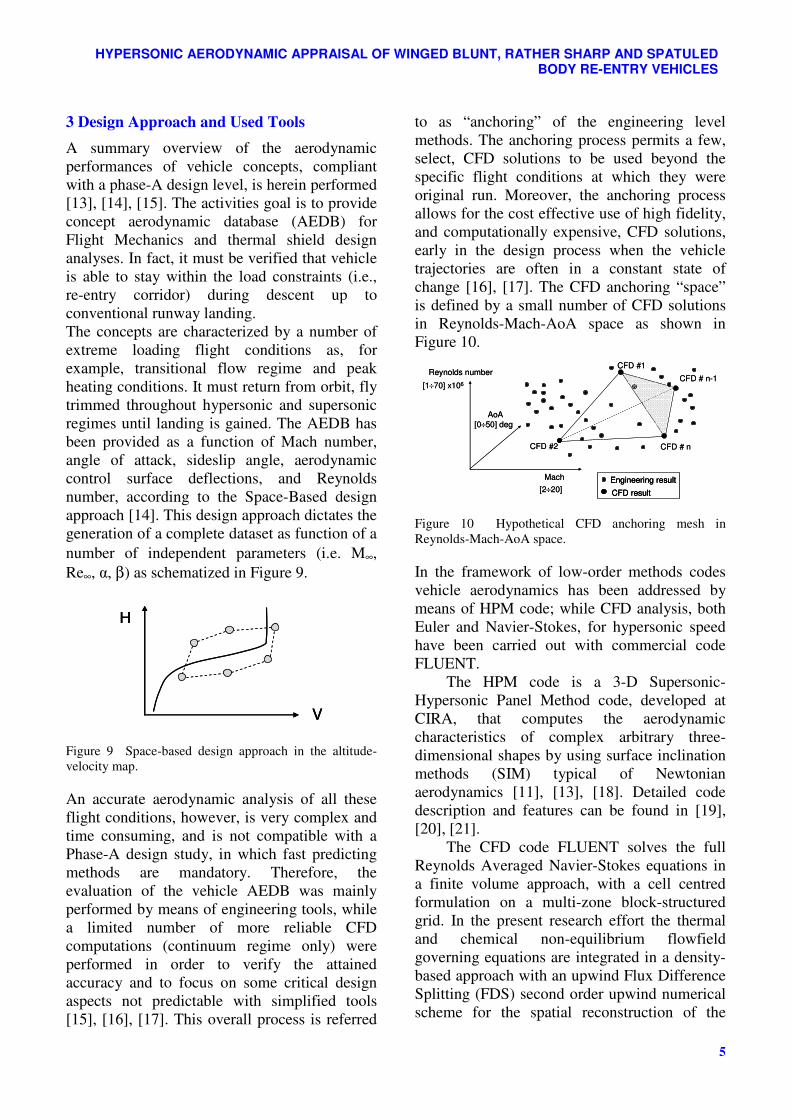
3 Design Approach and Used Tools
A summary overview of the aerodynamic
performances of vehicle concepts, compliant
with a phase-A design level, is herein performed
[13], [14], [15]. The activities goal is to provide
concept aerodynamic database (AEDB) for
Flight Mechanics and thermal shield design
analyses. In fact, it must be verified that vehicle
is able to stay within the load constraints (i.e.,
re-entry corridor) during descent up to
conventional runway landing.
The concepts are characterized by a number of
extreme loading flight conditions as, for
example, transitional flow regime and peak
heating conditions. It must return from orbit, fly
trimmed throughout hypersonic and supersonic
regimes until landing is gained. The AEDB has
been provided as a function of Mach number,
angle of attack, sideslip angle, aerodynamic
control surface deflections, and Reynolds
number, according to the Space-Based design
approach [14]. This design approach dictates the
generation of a complete dataset as function of a
number of independent parameters (i.e. M∞,
Re∞, α, β) as schematized in Figure 9.
H
V
H
V
H
V
Figure 9 Space-based design approach in the altitude-
velocity map.
An accurate aerodynamic analysis of all these
flight conditions, however, is very complex and
time consuming, and is not compatible with a
Phase-A design study, in which fast predicting
methods are mandatory. Therefore, the
evaluation of the vehicle AEDB was mainly
performed by means of engineering tools, while
a limited number of more reliable CFD
computations (continuum regime only) were
performed in order to verify the attained
accuracy and to focus on some critical design
aspects not predictable with simplified tools
[15], [16], [17]. This overall process is referred
to as “anchoring” of the engineering level
methods. The anchoring process permits a few,
select, CFD solutions to be used beyond the
specific flight conditions at which they were
original run. Moreover, the anchoring process
allows for the cost effective use of high fidelity,
and computationally expensive, CFD solutions,
early in the design process when the vehicle
trajectories are often in a constant state of
change [16], [17]. The CFD anchoring “space”
is defined by a small number of CFD solutions
in Reynolds-Mach-AoA space as shown in
Figure 10.
CFD # n-1
Mach
AoA
Reynolds number
CFD # n
CFD #1
CFD #2
Engineering result
CFD result
[1÷70] x106
[0÷50] deg
[2÷20]
CFD # n-1
Mach
AoA
Reynolds number
CFD # n
CFD #1
CFD #2
Engineering result
CFD result
Engineering result
CFD result
[1÷70] x106
[0÷50] deg
[2÷20]
Figure 10 Hypothetical CFD anchoring mesh in
Reynolds-Mach-AoA space.
In the framework of low-order methods codes
vehicle aerodynamics has been addressed by
means of HPM code; while CFD analysis, both
Euler and Navier-Stokes, for hypersonic speed
have been carried out with commercial code
FLUENT.
The HPM code is a 3-D Supersonic-
Hypersonic Panel Method code, developed at
CIRA, that computes the aerodynamic
characteristics of complex arbitrary three-
dimensional shapes by using surface inclination
methods (SIM) typical of Newtonian
aerodynamics [11], [13], [18]. Detailed code
description and features can be found in [19],
[20], [21].
The CFD code FLUENT solves the full
Reynolds Averaged Navier-Stokes equations in
a finite volume approach, with a cell centred
formulation on a multi-zone block-structured
grid. In the present research effort the thermal
and chemical non-equilibrium flowfield
governing equations are integrated in a density-
based approach with an upwind Flux Difference
Splitting (FDS) second order upwind numerical
scheme for the spatial reconstruction of the

ANTONIO VIVIANI, GIUSEPPE PEZZELLA
6
convective terms; while for the diffusive fluxes
a cell-centred scheme is applied. In some
computations, however, flux vector was
computed by using a flux-vector splitting
scheme, namely Advection Upstream Splitting
Method (AUSM). It provides exact resolution of
contact and shock discontinuities and it is less
susceptible to Carbuncle phenomena. Implicit
solver formulation was considered in the
computations of this work. Indeed, due to
broader stability characteristics of the implicit
formulation, a converged steady-state solution
can be obtained much faster using the implicit
formulation rather than the explicit one. Global
transport properties of the gas mixture relied on
semi-empirical rules such as Wilke’s mixing
rule for viscosity and thermal conductivity. The
viscosity and thermal conductivity of ith
species
was obtained by kinetic theory of gases [11].
For the diffusion coefficient of the ith
species in
the mixture the multi-component diffusion
coefficient was applied, where species mass
diffusivity is evaluated by kinetic theory [11].
Flowfield chemical reactions proceed with
forward rates that are expressed in the Arrhenius
and reaction rate parameters are due to Park
[22]. In particular, a number of in-house
modifications (i.e., User Defined Functions –
UDF–) for the thermal non-equilibrium were
considered since vibrational non-equilibrium
conditions are not basic code features. In the
UFD vibrational relaxation is modeled using a
Landau-Teller formulation, where relaxation
times are obtained from Millikan and White,
assuming simple harmonic oscillators [11].
Finally, the k-ω SST model has been considered
to account for turbulence effects and only steady
state computations are carried out so far.
4 Aerodynamic Characterization
Concepts aerodynamic force and moment have
been non-dimensionalized by means of the
following reference parameters: Lref=1.26 m
(wing mean aerodynamic chord–longitudinal
reference length); cref=3.60 m (lateral-
directional reference length); Sref=5.18 m2
(reference Surface).
4.1 Low order methods aerodynamics
Simplified aerodynamic analysis for supersonic
and hypersonic speeds was accomplished on
panel mesh close to that shown in Figure 11.
Figure 11 One of the ORV-WSB panel mesh.
In this figure is reported, for example, one of the
surface panel mesh considered for the ORV-
WSB aerodynamic assessment. Trade-off design
analyses highlighted that the best surface
inclination methods to consider in assessing
vehicle aerodynamic performance are tangent
cone and tangent wedge empirical methods for
fuselage and wing belly side, respectively; while
newtonian method (i.e., Cp=0) at vehicle leeside
[23],[24]. Some of main results obtained for the
ORV-WSB in clean configuration aerodynamic
(i.e., no aerodynamic surface deflected) are
shown from Figure 12 to Figure 16 .
-0.10
-0.05
0.00
0.05
0.10
0.15
0.20
0.25
0.30
0.35
0.40
0.45
0.50
0.05 0.10 0.15 0.20 0.25
Drag Coefficient
Lift C
oeffic
ient
M=2
M=3
M=4
M=5
M=6
M=7
M=8
M=9
Mach
Figure 12 ORV-WSB aerodynamic polars for 2≤M∞≤9
-0.2
0.0
0.2
0.4
0.6
0.8
1.0
1.2
1.4
1.6
1.8
0.0 0.2 0.4 0.6 0.8 1.0 1.2 1.4 1.6
Drag Coefficient
Lift C
oeffic
ient
M=10
M=16
M=25
Figure 13 ORV-WSB aerodynamic polars for 10≤M∞≤25
7
HYPERSONIC AERODYNAMIC APPRAISAL OF WINGED BLUNT, RATHER SHARP AND SPATULED BODY RE-ENTRY VEHICLES
pole @ CoG
-0.7
-0.6
-0.5
-0.4
-0.3
-0.2
-0.1
0.0
0.1
0.2
0 5 10 15 20 25 30 35 40 45
Angle of Attack, (deg)
Pitchin
g m
om
ent co
effic
ient
M=2
M=3
M=6
M=9
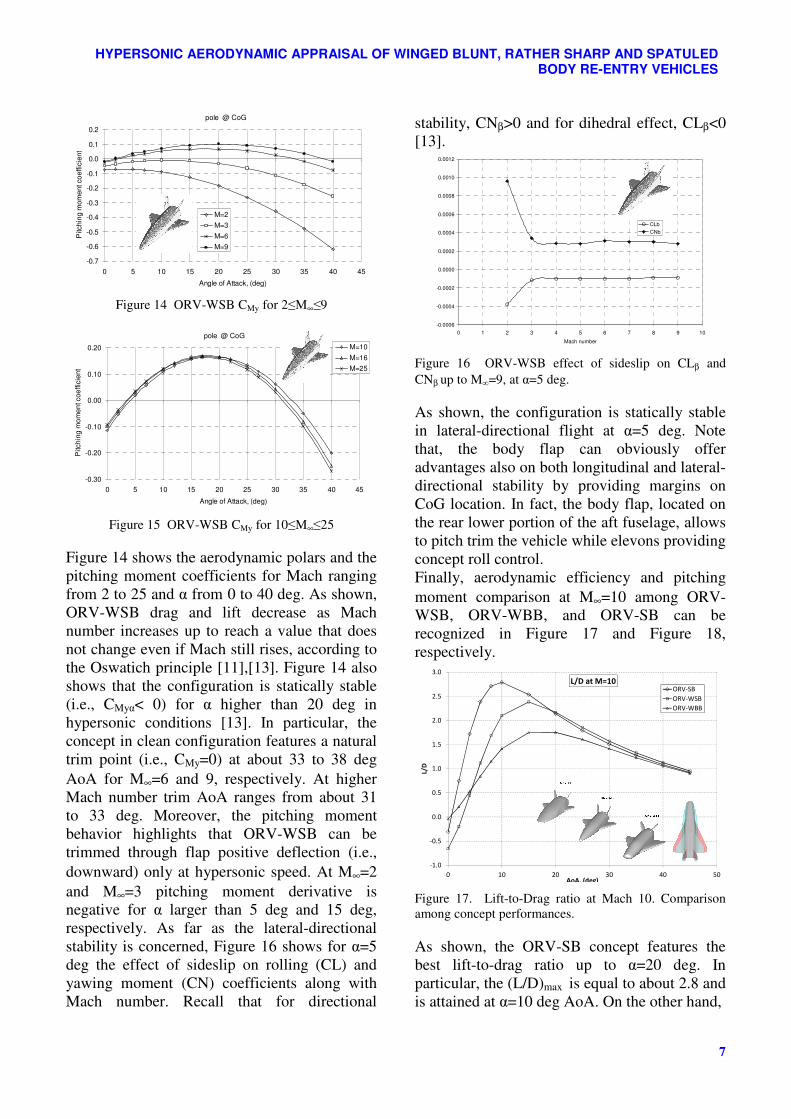
Figure 14 ORV-WSB CMy for 2≤M∞≤9
pole @ CoG
-0.30
-0.20
-0.10
0.00
0.10
0.20
0 5 10 15 20 25 30 35 40 45
Angle of Attack, (deg)
Pitch
ing
mo
men
t coeffic
ient
M=10
M=16
M=25
Figure 15 ORV-WSB CMy for 10≤M∞≤25
Figure 14 shows the aerodynamic polars and the
pitching moment coefficients for Mach ranging
from 2 to 25 and α from 0 to 40 deg. As shown,
ORV-WSB drag and lift decrease as Mach
number increases up to reach a value that does
not change even if Mach still rises, according to
the Oswatich principle [11],[13]. Figure 14 also
shows that the configuration is statically stable
(i.e., CMyα< 0) for α higher than 20 deg in
hypersonic conditions [13]. In particular, the
concept in clean configuration features a natural
trim point (i.e., CMy=0) at about 33 to 38 deg
AoA for M∞=6 and 9, respectively. At higher
Mach number trim AoA ranges from about 31
to 33 deg. Moreover, the pitching moment
behavior highlights that ORV-WSB can be
trimmed through flap positive deflection (i.e.,
downward) only at hypersonic speed. At M∞=2
and M∞=3 pitching moment derivative is
negative for α larger than 5 deg and 15 deg,
respectively. As far as the lateral-directional
stability is concerned, Figure 16 shows for α=5
deg the effect of sideslip on rolling (CL) and
yawing moment (CN) coefficients along with
Mach number. Recall that for directional
stability, CNβ>0 and for dihedral effect, CLβ<0
[13].
-0.0006
-0.0004
-0.0002
0.0000
0.0002
0.0004
0.0006
0.0008
0.0010
0.0012
0 1 2 3 4 5 6 7 8 9 10
Mach number
CLb
CNb
Figure 16 ORV-WSB effect of sideslip on CLβ and
CNβ up to M∞=9, at α=5 deg.
As shown, the configuration is statically stable
in lateral-directional flight at α=5 deg. Note
that, the body flap can obviously offer
advantages also on both longitudinal and lateral-
directional stability by providing margins on
CoG location. In fact, the body flap, located on
the rear lower portion of the aft fuselage, allows
to pitch trim the vehicle while elevons providing
concept roll control.
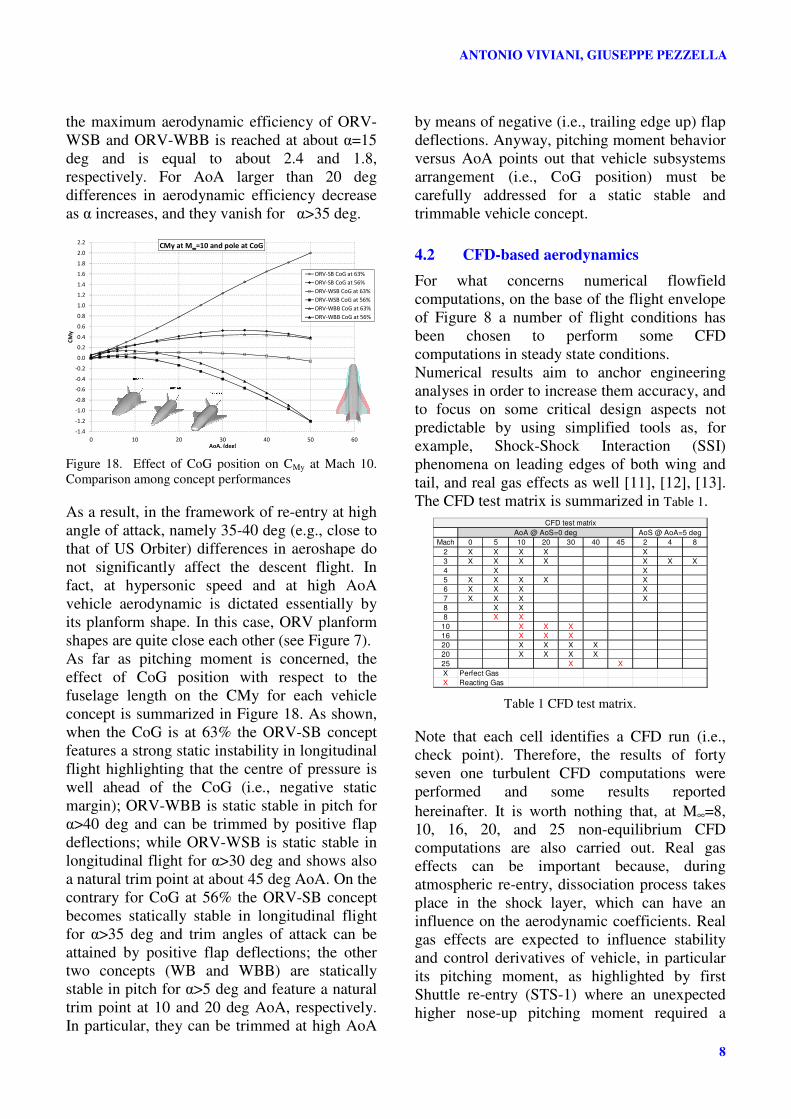
Finally, aerodynamic efficiency and pitching
moment comparison at M∞=10 among ORV-
WSB, ORV-WBB, and ORV-SB can be
recognized in Figure 17 and Figure 18,
respectively.
-1.0
-0.5
0.0
0.5
1.0
1.5
2.0
2.5
3.0
0 10 20 30 40 50
L/D
AoA, (deg)
L/D at M=10ORV-SB
ORV-WSB
ORV-WBB
Figure 17. Lift-to-Drag ratio at Mach 10. Comparison
among concept performances.
As shown, the ORV-SB concept features the
best lift-to-drag ratio up to α=20 deg. In
particular, the (L/D)max is equal to about 2.8 and
is attained at α=10 deg AoA. On the other hand,
ANTONIO VIVIANI, GIUSEPPE PEZZELLA
8
the maximum aerodynamic efficiency of ORV-
WSB and ORV-WBB is reached at about α=15
deg and is equal to about 2.4 and 1.8,
respectively. For AoA larger than 20 deg
differences in aerodynamic efficiency decrease
as α increases, and they vanish for α>35 deg.
-1.4
-1.2
-1.0
-0.8
-0.6
-0.4
-0.2
0.0
0.2
0.4
0.6
0.8
1.0
1.2
1.4
1.6
1.8
2.0
2.2
0 10 20 30 40 50 60
CM
y
AoA, (deg)
CMy at M∞∞∞∞=10 and pole at CoG
ORV-SB CoG at 63%
ORV-SB CoG at 56%
ORV-WSB CoG at 63%
ORV-WSB CoG at 56%
ORV-WBB CoG at 63%
ORV-WBB CoG at 56%
Figure 18. Effect of CoG position on CMy at Mach 10.
Comparison among concept performances
As a result, in the framework of re-entry at high
angle of attack, namely 35-40 deg (e.g., close to
that of US Orbiter) differences in aeroshape do
not significantly affect the descent flight. In
fact, at hypersonic speed and at high AoA
vehicle aerodynamic is dictated essentially by
its planform shape. In this case, ORV planform
shapes are quite close each other (see Figure 7).
As far as pitching moment is concerned, the
effect of CoG position with respect to the
fuselage length on the CMy for each vehicle
concept is summarized in Figure 18. As shown,
when the CoG is at 63% the ORV-SB concept
features a strong static instability in longitudinal
flight highlighting that the centre of pressure is
well ahead of the CoG (i.e., negative static
margin); ORV-WBB is static stable in pitch for
α>40 deg and can be trimmed by positive flap
deflections; while ORV-WSB is static stable in
longitudinal flight for α>30 deg and shows also
a natural trim point at about 45 deg AoA. On the
contrary for CoG at 56% the ORV-SB concept
becomes statically stable in longitudinal flight
for α>35 deg and trim angles of attack can be
attained by positive flap deflections; the other
two concepts (WB and WBB) are statically
stable in pitch for α>5 deg and feature a natural
trim point at 10 and 20 deg AoA, respectively.
In particular, they can be trimmed at high AoA
by means of negative (i.e., trailing edge up) flap
deflections. Anyway, pitching moment behavior
versus AoA points out that vehicle subsystems
arrangement (i.e., CoG position) must be
carefully addressed for a static stable and
trimmable vehicle concept.
4.2 CFD-based aerodynamics
For what concerns numerical flowfield
computations, on the base of the flight envelope
of Figure 8 a number of flight conditions has
been chosen to perform some CFD
computations in steady state conditions.
Numerical results aim to anchor engineering
analyses in order to increase them accuracy, and
to focus on some critical design aspects not
predictable by using simplified tools as, for
example, Shock-Shock Interaction (SSI)
phenomena on leading edges of both wing and
tail, and real gas effects as well [11], [12], [13].
The CFD test matrix is summarized in Table 1.
Mach 0 5 10 20 30 40 45 2 4 8
2 X X X X X
3 X X X X X X X
4 X X
5 X X X X X
6 X X X X
7 X X X X
8 X X
8 X X
10 X X X
16 X X X
20 X X X X
20 X X X X
25 X X
X Perfect Gas
X Reacting Gas
CFD test matrix
AoA @ AoS=0 deg AoS @ AoA=5 deg
Table 1 CFD test matrix.
Note that each cell identifies a CFD run (i.e.,
check point). Therefore, the results of forty
seven one turbulent CFD computations were
performed and some results reported
hereinafter. It is worth nothing that, at M∞=8,
10, 16, 20, and 25 non-equilibrium CFD
computations are also carried out. Real gas
effects can be important because, during
atmospheric re-entry, dissociation process takes
place in the shock layer, which can have an
influence on the aerodynamic coefficients. Real
gas effects are expected to influence stability
and control derivatives of vehicle, in particular
its pitching moment, as highlighted by first
Shuttle re-entry (STS-1) where an unexpected
higher nose-up pitching moment required a
9
HYPERSONIC AERODYNAMIC APPRAISAL OF WINGED BLUNT, RATHER SHARP AND SPATULED BODY RE-ENTRY VEHICLES
body-flap deflection twice than that predicted
by the pre-flight analyses to trim the Orbiter
[11],[13]. Further, real gas effects cause a shock
that lies closer to the vehicle with respect to the
position that would characterize a perfect gas
case (i.e., thin shock layer) [11],[13]. These
effects obviously occur only at high Mach
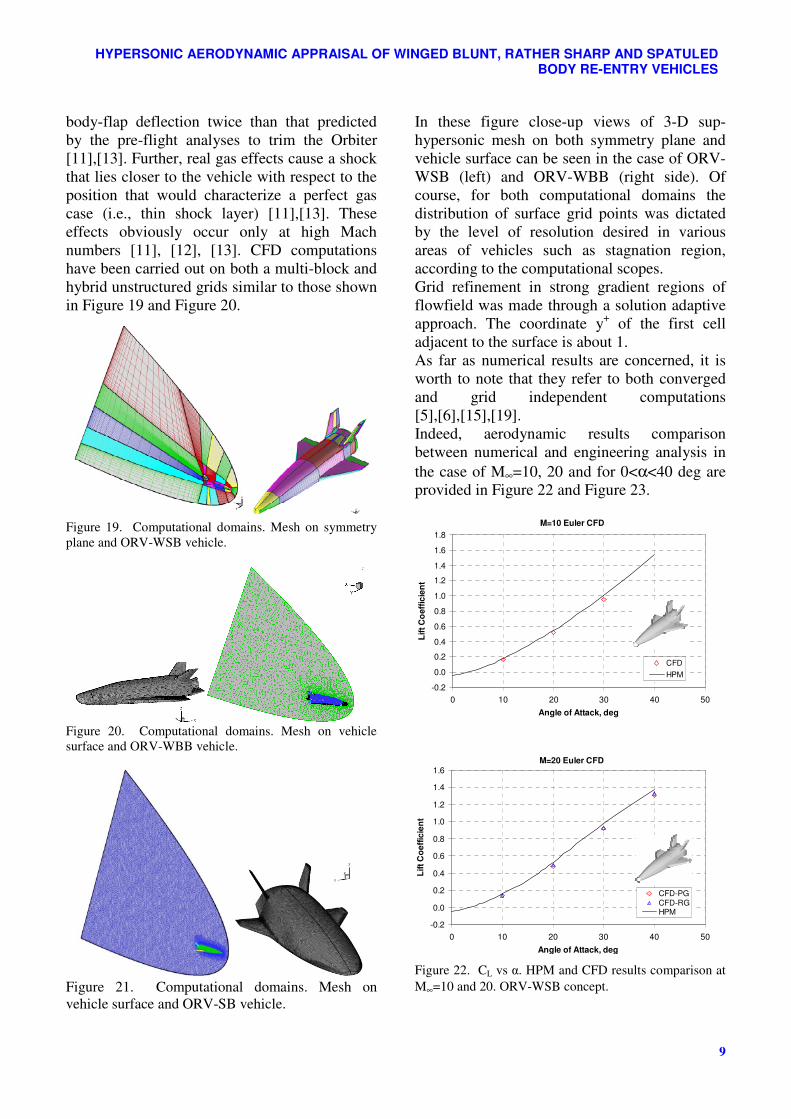
numbers [11], [12], [13]. CFD computations
have been carried out on both a multi-block and
hybrid unstructured grids similar to those shown
in Figure 19 and Figure 20.
Figure 19. Computational domains. Mesh on symmetry
plane and ORV-WSB vehicle.
Figure 20. Computational domains. Mesh on vehicle
surface and ORV-WBB vehicle.
Figure 21. Computational domains. Mesh on
vehicle surface and ORV-SB vehicle.
In these figure close-up views of 3-D sup-
hypersonic mesh on both symmetry plane and
vehicle surface can be seen in the case of ORV-
WSB (left) and ORV-WBB (right side). Of
course, for both computational domains the
distribution of surface grid points was dictated
by the level of resolution desired in various
areas of vehicles such as stagnation region,
according to the computational scopes.
Grid refinement in strong gradient regions of
flowfield was made through a solution adaptive
approach. The coordinate y+ of the first cell
adjacent to the surface is about 1.
As far as numerical results are concerned, it is
worth to note that they refer to both converged
and grid independent computations
[5],[6],[15],[19].
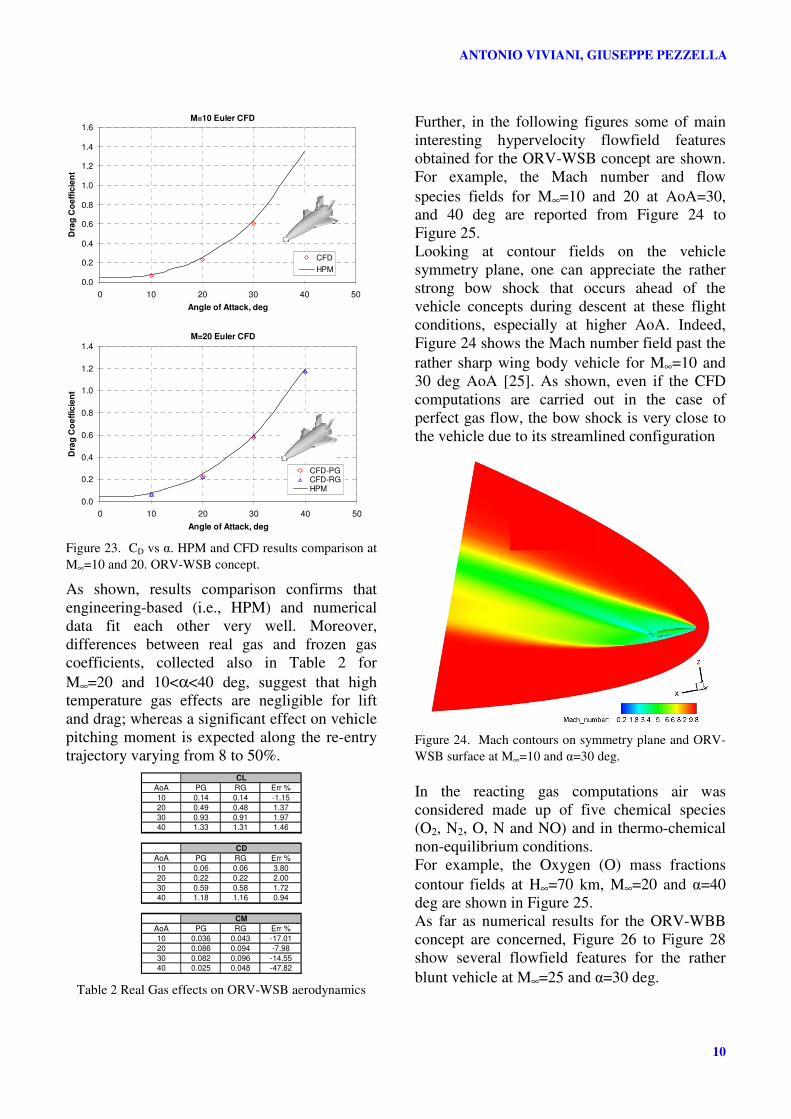
Indeed, aerodynamic results comparison
between numerical and engineering analysis in
the case of M∞=10, 20 and for 0<α<40 deg are
provided in Figure 22 and Figure 23.
M=10 Euler CFD
-0.2
0.0
0.2
0.4
0.6
0.8
1.0
1.2
1.4
1.6
1.8
0 10 20 30 40 50
Angle of Attack, deg
Lif
t C
oeff
icie
nt
CFD
HPM
M=20 Euler CFD
-0.2
0.0
0.2
0.4
0.6
0.8
1.0
1.2
1.4
1.6
0 10 20 30 40 50
Angle of Attack, deg
Lift
Co
eff
icie
nt
CFD-PGCFD-RGHPM
Figure 22. CL vs α. HPM and CFD results comparison at
M∞=10 and 20. ORV-WSB concept.
ANTONIO VIVIANI, GIUSEPPE PEZZELLA
10
M=10 Euler CFD
0.0
0.2
0.4
0.6
0.8
1.0
1.2
1.4
1.6
0 10 20 30 40 50
Angle of Attack, deg
Dra
g C
oe
ffic
ien
t
CFD
HPM
M=20 Euler CFD
0.0
0.2
0.4
0.6
0.8
1.0
1.2
1.4
0 10 20 30 40 50
Angle of Attack, deg
Dra
g C
oe
ffic
ien
t
CFD-PGCFD-RGHPM
Figure 23. CD vs α. HPM and CFD results comparison at
M∞=10 and 20. ORV-WSB concept.
As shown, results comparison confirms that
engineering-based (i.e., HPM) and numerical
data fit each other very well. Moreover,
differences between real gas and frozen gas
coefficients, collected also in Table 2 for
M∞=20 and 10<α<40 deg, suggest that high
temperature gas effects are negligible for lift
and drag; whereas a significant effect on vehicle
pitching moment is expected along the re-entry
trajectory varying from 8 to 50%.
AoA PG RG Err %
10 0.14 0.14 -1.15
20 0.49 0.48 1.37
30 0.93 0.91 1.97
40 1.33 1.31 1.46
AoA PG RG Err %
10 0.06 0.06 3.80
20 0.22 0.22 2.00
30 0.59 0.58 1.72
40 1.18 1.16 0.94
AoA PG RG Err %
10 0.036 0.043 -17.01
20 0.086 0.094 -7.98
30 0.082 0.096 -14.55
40 0.025 0.048 -47.82
CL
CD
CM
Table 2 Real Gas effects on ORV-WSB aerodynamics
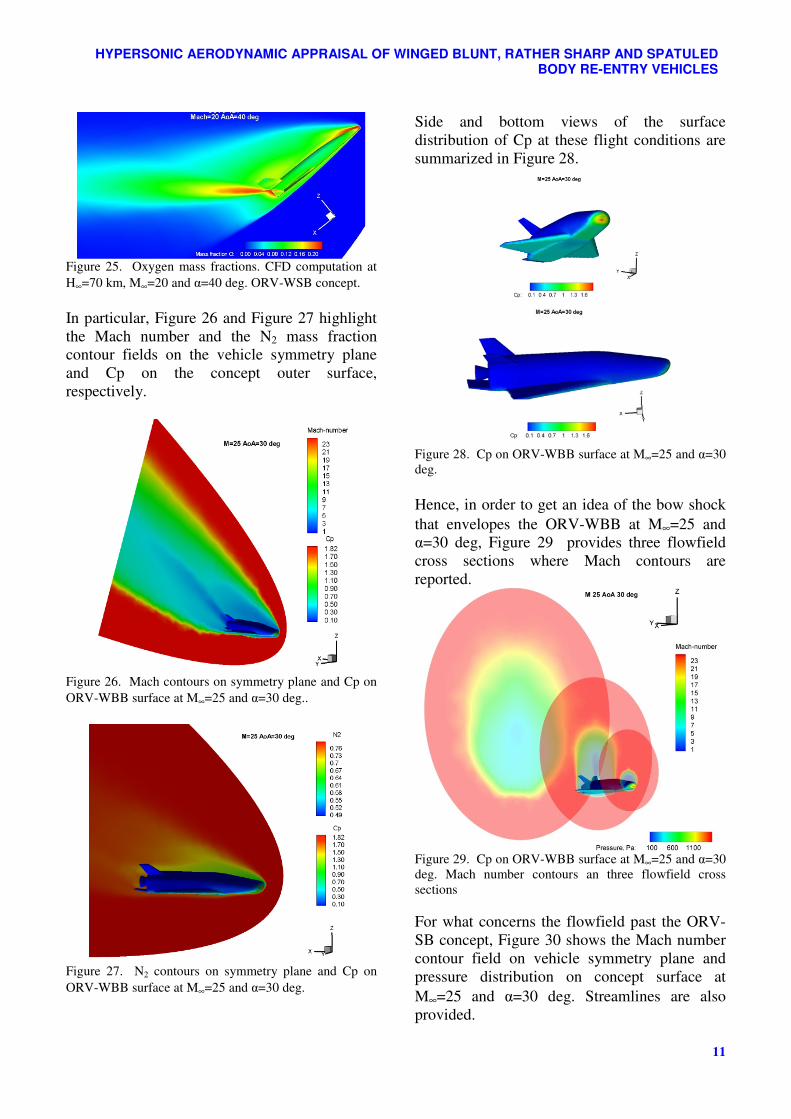
Further, in the following figures some of main
interesting hypervelocity flowfield features
obtained for the ORV-WSB concept are shown.
For example, the Mach number and flow
species fields for M∞=10 and 20 at AoA=30,
and 40 deg are reported from Figure 24 to
Figure 25.
Looking at contour fields on the vehicle
symmetry plane, one can appreciate the rather
strong bow shock that occurs ahead of the
vehicle concepts during descent at these flight
conditions, especially at higher AoA. Indeed,
Figure 24 shows the Mach number field past the
rather sharp wing body vehicle for M∞=10 and
30 deg AoA [25]. As shown, even if the CFD
computations are carried out in the case of
perfect gas flow, the bow shock is very close to
the vehicle due to its streamlined configuration
Figure 24. Mach contours on symmetry plane and ORV-
WSB surface at M∞=10 and α=30 deg.
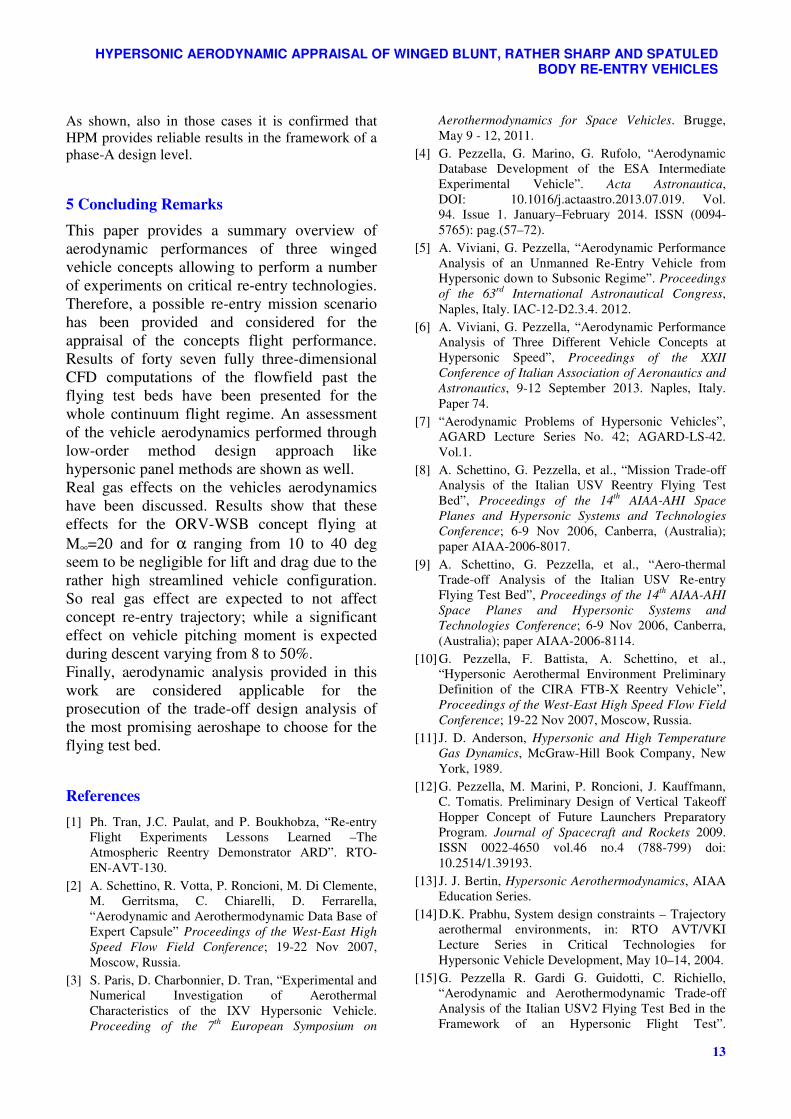
In the reacting gas computations air was
considered made up of five chemical species
(O2, N2, O, N and NO) and in thermo-chemical
non-equilibrium conditions.
For example, the Oxygen (O) mass fractions
contour fields at H∞=70 km, M∞=20 and α=40
deg are shown in Figure 25.
As far as numerical results for the ORV-WBB
concept are concerned, Figure 26 to Figure 28
show several flowfield features for the rather
blunt vehicle at M∞=25 and α=30 deg.
11
HYPERSONIC AERODYNAMIC APPRAISAL OF WINGED BLUNT, RATHER SHARP AND SPATULED BODY RE-ENTRY VEHICLES
Figure 25. Oxygen mass fractions. CFD computation at
H∞=70 km, M∞=20 and α=40 deg. ORV-WSB concept.
In particular, Figure 26 and Figure 27 highlight
the Mach number and the N2 mass fraction
contour fields on the vehicle symmetry plane
and Cp on the concept outer surface,
respectively.
Figure 26. Mach contours on symmetry plane and Cp on
ORV-WBB surface at M∞=25 and α=30 deg..
Figure 27. N2 contours on symmetry plane and Cp on
ORV-WBB surface at M∞=25 and α=30 deg.
Side and bottom views of the surface
distribution of Cp at these flight conditions are
summarized in Figure 28.
Figure 28. Cp on ORV-WBB surface at M∞=25 and α=30
deg.
Hence, in order to get an idea of the bow shock
that envelopes the ORV-WBB at M∞=25 and
α=30 deg, Figure 29 provides three flowfield
cross sections where Mach contours are
reported.
Figure 29. Cp on ORV-WBB surface at M∞=25 and α=30
deg. Mach number contours an three flowfield cross
sections
For what concerns the flowfield past the ORV-
SB concept, Figure 30 shows the Mach number
contour field on vehicle symmetry plane and
pressure distribution on concept surface at
M∞=25 and α=30 deg. Streamlines are also
provided.

ANTONIO VIVIANI, GIUSEPPE PEZZELLA
12
Figure 30. Pressure on ORV-SB surface and Mach
number contours on symmetry plane at M∞=25 and α=30
deg.
3-D streamtraces at these flight conditions
together with a cross flow section coloured by
Mach number are provided in Figure 31.
Also in this case a very narrow shock layer is
expected for this concept.
Figure 31. Pressure on ORV-SB surface at M∞=25 and
α=30 deg with 3-D streamtraces and flowfield cross
section coloured by Mach number.
Finally, results comparison between numerical
and engineering-based aerodynamic for ORV-
WBB and ORV-SB are summarized in Figure
32 and Figure 33, respectively.
For instance, Figure 32 compares aerodynamic
results for axial force coefficient (CA) and
pitching moment coefficient (CMy) at M∞=25 and
α=30 deg; while Figure 33 provides result
comparison for normal force coefficient (CN) at
M∞=10 and α=30 deg and for axial force
coefficient at M∞=25 and α=30 and 45 deg.
0,10
0,11
0,12
0,13
0,14
0,15
0,16
0,17
0,18
0,19
0,20
0 10 20 30 40 50
CA
AoA, deg
M=25
SIM
CFD
-14,0
-12,0
-10,0
-8,0
-6,0
-4,0
-2,0
0,0
2,0
0 10 20 30 40 50
CM
AoA, deg
M=25
SIM
CFD
Figure 32. CA and CM at M∞=25 and α=30 deg. ORV-
WBB concept. CFD and HPM comparison.
-0,5
0,0
0,5
1,0
1,5
2,0
2,5
3,0
3,5
4,0
0 10 20 30 40 50
AoA, deg
M=10
SIM
CFD
0,00
0,02
0,04
0,06
0,08
0,10
0,12
0,14
0,16
0 10 20 30 40 50
CA
AoA, deg
M=25
SIM
CFD
Figure 33. CA and CN at M∞=25 and α=30 deg. ORV-SB
concept. CFD and HPM comparison.
13
HYPERSONIC AERODYNAMIC APPRAISAL OF WINGED BLUNT, RATHER SHARP AND SPATULED BODY RE-ENTRY VEHICLES
As shown, also in those cases it is confirmed that
HPM provides reliable results in the framework of a
phase-A design level.
5 Concluding Remarks
This paper provides a summary overview of
aerodynamic performances of three winged
vehicle concepts allowing to perform a number
of experiments on critical re-entry technologies.
Therefore, a possible re-entry mission scenario
has been provided and considered for the
appraisal of the concepts flight performance.
Results of forty seven fully three-dimensional
CFD computations of the flowfield past the
flying test beds have been presented for the
whole continuum flight regime. An assessment
of the vehicle aerodynamics performed through
low-order method design approach like
hypersonic panel methods are shown as well.
Real gas effects on the vehicles aerodynamics
have been discussed. Results show that these
effects for the ORV-WSB concept flying at
M∞=20 and for α ranging from 10 to 40 deg
seem to be negligible for lift and drag due to the
rather high streamlined vehicle configuration.
So real gas effect are expected to not affect
concept re-entry trajectory; while a significant
effect on vehicle pitching moment is expected
during descent varying from 8 to 50%.
Finally, aerodynamic analysis provided in this
work are considered applicable for the
prosecution of the trade-off design analysis of
the most promising aeroshape to choose for the
flying test bed.
References
[1] Ph. Tran, J.C. Paulat, and P. Boukhobza, “Re-entry
Flight Experiments Lessons Learned –The
Atmospheric Reentry Demonstrator ARD”. RTO-
EN-AVT-130.
[2] A. Schettino, R. Votta, P. Roncioni, M. Di Clemente,
M. Gerritsma, C. Chiarelli, D. Ferrarella,
“Aerodynamic and Aerothermodynamic Data Base of
Expert Capsule” Proceedings of the West-East High
Speed Flow Field Conference; 19-22 Nov 2007,
Moscow, Russia.
[3] S. Paris, D. Charbonnier, D. Tran, “Experimental and
Numerical Investigation of Aerothermal
Characteristics of the IXV Hypersonic Vehicle.
Proceeding of the 7th
European Symposium on
Aerothermodynamics for Space Vehicles. Brugge,
May 9 - 12, 2011.
[4] G. Pezzella, G. Marino, G. Rufolo, “Aerodynamic
Database Development of the ESA Intermediate
Experimental Vehicle”. Acta Astronautica,
DOI: 10.1016/j.actaastro.2013.07.019. Vol.
94. Issue 1. January–February 2014. ISSN (0094-
5765): pag.(57–72).
[5] A. Viviani, G. Pezzella, “Aerodynamic Performance
Analysis of an Unmanned Re-Entry Vehicle from
Hypersonic down to Subsonic Regime”. Proceedings
of the 63rd
International Astronautical Congress,
Naples, Italy. IAC-12-D2.3.4. 2012.
[6] A. Viviani, G. Pezzella, “Aerodynamic Performance
Analysis of Three Different Vehicle Concepts at
Hypersonic Speed”, Proceedings of the XXII
Conference of Italian Association of Aeronautics and
Astronautics, 9-12 September 2013. Naples, Italy.
Paper 74.
[7] “Aerodynamic Problems of Hypersonic Vehicles”,
AGARD Lecture Series No. 42; AGARD-LS-42.
Vol.1.
[8] A. Schettino, G. Pezzella, et al., “Mission Trade-off
Analysis of the Italian USV Reentry Flying Test
Bed”, Proceedings of the 14th
AIAA-AHI Space
Planes and Hypersonic Systems and Technologies
Conference; 6-9 Nov 2006, Canberra, (Australia);
paper AIAA-2006-8017.
[9] A. Schettino, G. Pezzella, et al., “Aero-thermal
Trade-off Analysis of the Italian USV Re-entry
Flying Test Bed”, Proceedings of the 14th
AIAA-AHI
Space Planes and Hypersonic Systems and
Technologies Conference; 6-9 Nov 2006, Canberra,
(Australia); paper AIAA-2006-8114.
[10] G. Pezzella, F. Battista, A. Schettino, et al.,
“Hypersonic Aerothermal Environment Preliminary
Definition of the CIRA FTB-X Reentry Vehicle”,
Proceedings of the West-East High Speed Flow Field
Conference; 19-22 Nov 2007, Moscow, Russia.
[11] J. D. Anderson, Hypersonic and High Temperature
Gas Dynamics, McGraw-Hill Book Company, New
York, 1989.
[12] G. Pezzella, M. Marini, P. Roncioni, J. Kauffmann,
C. Tomatis. Preliminary Design of Vertical Takeoff
Hopper Concept of Future Launchers Preparatory
Program. Journal of Spacecraft and Rockets 2009.
ISSN 0022-4650 vol.46 no.4 (788-799) doi:
10.2514/1.39193.
[13] J. J. Bertin, Hypersonic Aerothermodynamics, AIAA
Education Series.
[14] D.K. Prabhu, System design constraints – Trajectory
aerothermal environments, in: RTO AVT/VKI
Lecture Series in Critical Technologies for
Hypersonic Vehicle Development, May 10–14, 2004.
[15] G. Pezzella R. Gardi G. Guidotti, C. Richiello,
“Aerodynamic and Aerothermodynamic Trade-off
Analysis of the Italian USV2 Flying Test Bed in the
Framework of an Hypersonic Flight Test”.

ANTONIO VIVIANI, GIUSEPPE PEZZELLA
14
Proceeding of 3rd
International ARA Days. 2-4 May
2011. Arcachon. France. AA-1-2011-54.
[16] D.J. Kinney “Aero-thermodynamics for conceptual
design”, Proceedings of the 42nd
AIAA Aerospace
Sciences Meeting and Exhibit, Reno, NV, USA,
January 5–8, 2004, AIAA-2004-31.
[17] D.J. Kinney, “Aerodynamic shape optimization of
hypersonic vehicles”, Proceedings of the 44th
AIAA
Aerospace Sciences Meeting and Exhibit, Reno, NV,
USA, January 9–12, 2006, AIAA-2006-239.
[18] E. Bonner, W. Clever, K Dunn, “Aerodynamic
Preliminary Analysis System II Part I- Theory”,
NASA Contractor Report 182076. April 1991.
[19] G. Pezzella, “Aerodynamic and Aerothermodynamic
Trade-off Analysis of a Small Hypersonic Flying
Test Bed”. Acta Astronautica. Vol. 69 Issue 3-4. pp.
209-222. ISSN (0094-5765)
doi:10.1016/j.actaastro.2011.03.004. (2011).
[20] G. Pezzella, “Aerodynamic and Aerothermodynamic
design of Future Launchers Preparatory Program
Concepts”. Aerospace Science and Technology, Vol.
23, Issue 1, pp 233–249.
http://dx.doi.org/10.1016/j.ast.2011.07.011. (2012).
[21] G. Pezzella, “Hypersonic Aerothermal Environment
Assessment of the CIRA FTB-X Reentry Vehicle”.
Aerospace Science and Technology, Vol. 25, Issue 1,
pp. 190–202.
http://dx.doi.org/10.1016/j.ast.2012.01.007. (2013).
[22] C. Park, “Review of Chemical Kinetic Problems of
Future NASA Missions: Earth Entries”. Journal of
Thermophysics and Heat Transfer, Vol. 7. No 3.
1993.
[23] M. Maughmer, L. Ozoroski, D. Straussfogel, L.
Long, “Validation of engineering methods for
predicting hypersonic vehicle control forces and
moments”, AIAA Journal of Guidance, Control, and
Dynamics 16 (4) (July–August 1993).
[24] M. Moore, J. Williams, “Aerodynamic prediction
rationale for analyses of hypersonic configurations”,
Proceedings of the 27th
Aerospace Sciences Meeting,
Reno, NV, USA, January 9–12, 1989, AIAA-89-
0525.
[25] G. Pezzella, E. Filippone, and M. Serpico, “Re-entry
Aerodynamics and Aerothermodynamics Analyses of
the Flying Test Bed USV-X in the Framework of a
High Lift Return”, Proceeding of 16th
AIAA/DLR/DGLR International Space Planes and
Hypersonic Systems and Technologies Conference,
AIAA 2009-7425, 2009.
Copyright Statement
The authors confirm that they, and/or their company or
organization, hold copyright on all of the original material
included in this paper. The authors also confirm that they
have obtained permission, from the copyright holder of
any third party material included in this paper, to publish
it as part of their paper. The authors confirm that they
give permission, or have obtained permission from the
copyright holder of this paper, for the publication and
distribution of this paper as part of the ICAS 2014
proceedings or as individual off-prints from the
proceedings.