hypersight: towards scalable, high-coverage, and dynamic...
TRANSCRIPT

1
HyperSight: Towards Scalable, High-coverage, andDynamic Network Monitoring Queries
Yu Zhou, Jun Bi, Senior Member, IEEE, Tong Yang, Member, IEEE, Kai Gao, Jiamin Cao, Dai Zhang,Yangyang Wang, Cheng Zhang
Abstract—Performing fine-grained and real-time networkmonitoring is the core logic of various data center operationapplications, such as traffic engineering, network troubleshooting,and anomaly detecting. However, the state-of-the-art networkmonitoring solutions either fall short of completely detectingall network incidents (i.e., congestion), yielding limited moni-toring coverage, or introduce large overheads, yielding limitedscalability. In this paper, we present HyperSight , a networktraffic monitor with both high coverage and low overheads.The key idea of HyperSight is to monitor networks at thebehavior level via tracking packet behavior changes. HyperSightproposes three designs for behavior-level monitoring. First, to fa-cilitate expressing various network monitoring tasks, HyperSightpresents a declarative query language based on the streamingprocessing model. Second, HyperSight proposes Bloom FilterQueue (BFQ), a memory-efficient algorithm to empower in-network capability for monitoring packet behavior changes. BFQcan be implemented on commodity programmable switches.Third, to support dynamic deployment and execution of packetbehavior change monitoring tasks without interrupting on-serviceswitches, HyperSight proposes virtual BFQ to support dynamicquery compilation. We build a prototype of HyperSight anddeploy it on commodity programmable switches. Evaluationresults show that HyperSight supports a wide range of networkevent queries and can monitor over 99% packet behavior changeswhile keeping remarkably low overheads.
Index Terms—Network monitoring, programmable switch,packet behavior
I. INTRODUCTION
Network monitoring is critical for data center networkmanagement. In particular, the management tasks, such astraffic engineering [2–6], troubleshooting [7–10], attack de-tection [11], and network planning [12, 13] require always-on, fine-grained, and real-time visibility of network incidents,such as congestion and throughput degradation. To obtain a
Yu Zhou, Jiamin Cao, and Dai Zhang are with Institute for NetworkSciences and Cyberspace, Tsinghua University, Department of ComputerScience, Tsinghua University, and Beijing National Research Center forInformation Science and Technology (e-mail: {y-zhou16, cjm18, zhangd15,zhang-cheng13}@mails.tsinghua.edu.cn).
Jun Bi and Yangyang Wang are with Institute for Network Sciencesand Cyberspace, Tsinghua University, Department of Computer Science,Tsinghua University, and Beijing National Research Center for InformationScience and Technology, and CERNET Network Center (e-mail: {junbi,wangyy}@cernet.edu.cn).
Tong Yang is with the Department of Computer and Science, PekingUniversity, China (e-mail: [email protected]).
Kai Gao is with the College of Cybersecurity, Sichuan University (e-mail:[email protected]).
Cheng Zhang is with Huawei Technologies Co., Ltd. ([email protected])
The conference version of this paper was presented at the IEEE ICNP 2018,Cambridge, UK, September 17, 2018 [1].
33
Packet‐levelMonitoring
Flow‐levelMonitoring
Behavior‐levelMonitoring
Congestion
Packets with delay changes
Packets with 100us delay
Packets with 1us delay
Monitoring messages
Legend
Figure 1. Behavior-level monitoring vs. packet-level and flow-levelmonitoring. Packet-level monitoring provides high-coverage monitoringbut is limited in scalability. Flow-level monitoring yields good scalabilitybut cannot guarantee monitoring coverage. Behavior-level monitoring canreconcile both the monitoring coverage and scalability.
completed view of network status, network operators shouldbe able to provide high-coverage network monitoring. Fur-thermore, as data center networks expand rapidly in scale,speed, and traffic volume, operators should also guarantee thatnetwork monitoring systems can scale with low overheads.
There have been many off-the-shelf solutions for net-work monitoring in the literature. Based on the monitoringgranularity, we categorize them into two types. First, thepacket-level monitoring solutions [7–9, 14] display how eachpacket traverses the networks, but they have to inspect allpackets, which introduces unacceptable overheads and comeswith significantly constrained scalability. Second, the flow-level monitoring solutions present flow-level information viasampling [15–17], aggregation [18–21], or sketching [22–24]. However, the coarse-grained flow-level information mightmiss some subtle network incidents, compromising monitoringcoverage. For example, sFlow [16] performs sampling overpackets and potentially misses congestion events experiencedby unsampled packets. In summary, packet-level monitoringand flow-level monitoring fail in either scalability or coverage.
Given the limitations of existing solutions, we argue for ashift of network monitoring granularity to the behavior level:only monitor the packets that encounter behavior changes.Packet behaviors can include path, throughput, delay, andfield modification when packets are forwarded in networks.Behavior changes denote that the behavior of a packet differsfrom the behaviors of the previous packets in the same flow.Figure 1 shows a comparison of the three monitoring granu-larities. Furthermore, behavior-level monitoring is motivatedby the following observations. First, network incidents arealways accompanied by packet behavior changes. For example,congestion incurs latency inflation. Second, the packets experi-encing behavior changes only take up a small portion of overalltraffic (see §VII-B). Driven by the above observations, wepropose to monitor all packet behavior changes on switchesto provide visibility of network incidents with both highscalability and high coverage.

2
In this paper, we present HyperSight , a practical system formonitoring packet behavior changes. However, there are threechallenges in designing HyperSight .Lack of a convenient way to express various networkmonitoring tasks. There are various network monitoringtasks, such as load imbalance profiling, congestion detection,and flow path monitoring. Operators need a convenient way toexpress the tasks they intend to deploy in networks. However,no such network programming language that can specifyvarious monitoring tasks over packet behavior changes. Toaddress this issue, we propose a high-level Packet BehaviorQuery Language (PBQL ). PBQL introduces stream processinginto packet behavior change monitoring and abstracts packetbehaviors as dynamic tables. Then, in PBQL, operators can usesliding-window-based primitives, including distinct andduplicate, to extract packet behavior changes.Limited switch telemetry capability for monitoring packetbehavior changes. Although many switch telemetry meth-ods come into being with the flourish of programmableswitches [25] and P4 [26], none of them can be directlyapplied for monitoring packet behavior changes. On the onehand, some telemetry methods can record packet behaviors ofa small portion of flows, which is far from satisfactory forhigh-coverage monitoring. On the other hand, some telemetrymethods record aggregated states (e.g., average delay) ofall flows, which are always helpless for monitoring packetbehavior changes. Packet behavior change monitoring requiresexact states of all flow and can exhaust limited data planememory due to massive traffic. To address this issue, wepropose Bloom Filter Queue (BFQ ), a memory-efficient al-gorithm for recording packet behaviors on data planes. BFQcan identify packet behavior changes by finding distinct orduplicate behaviors among recently-arrived packets. Moreover,BFQ runs in the data plane entirely and can be deployed intoP4-programmable switches, e.g., Tofino [27].Incapable of implementing dynamic monitoring tasks with-out interrupting running switches. As network conditionchanges over time, network operators or applications needto change monitoring tasks running in switches at runtime.However, updating monitoring tasks needs to change P4programs, which will interrupt on-service switches. As in-terrupting switches introduces service pause in millisecondsand is intolerable for network operation, supporting dynamicdeployment and execution of monitoring tasks is of greatimportance. However, none of existing monitoring solutions inprogrammable switches supports dynamic queries. Borrowingfrom the idea of virtual programmable data plane [28, 29], wepropose virtual BFQ (vBFQ) and make BFQ support dynamicreconfiguration. Operators can dynamically compile networkmonitoring tasks into running switches with no interruption.
In this paper, we make the following contributions:
• We propose HyperSight which exploits packet behaviorchanges to monitor network incidents while achievingboth high coverage and high scalability.
• We provide PBQL, a declarative query language foroperators to specify network monitoring intents. PBQLintroduces a simple programming model for network
monitoring based on stream processing. (§IV)• We propose BFQ, a new telemetry algorithm compati-
ble with commodity programmable switches to supportpacket behavior change monitoring. (§V)
• We propose vBFQ to support dynamic compilation ofnetwork event queries, enabling update of monitoringtasks without switch termination. (§VI)
• We implement a prototype of HyperSight atopTofino [27] and SmartNIC [30]. The open-sourcecode of HyperSight is at [31]. Evaluation results indicatethat HyperSight supports a wide range of networkmonitoring queries and can monitor over 99% packetbehavior changes while reducing overheads by twoorders of magnitude. (§VII)
II. MOTIVATION AND RELATED WORK
A. Motivation Cases
In this section, we outline four use cases for always-onmonitoring of packet behavior changes.Network-wide per-flow delay change. HyperSight discretizesdelay for every flow and reports all discretized delay changes.Monitoring flow delay enables operators to identify the currentnetwork congestion status, as network congestion is the maindeciding factor for packet forwarding delay in data centernetworks. Combining delay of different flows, network op-erators can easily locate hot congestion spots (i.e., caused byincast), which helps evaluate the effectiveness of congestioncontrol algorithms. Furthermore, monitoring flow delay canhelp operators debug whether application glitch should beattributed to networks. The state-of-the-art solutions can easilymonitor the delay of a specific path (e.g., Pingmesh [10])or a specific flow (e.g., EverFlow [7]). However, performingalways-on network-wide delay monitoring is non-trivial for thestate of the arts which potentially introduces large overheads.Network-wide per-flow throughput change. HyperSight canreport changes that happen to the port-level throughput ofall flows. Load imbalance introduces limited utilization ofnetwork fabric and impedes the performance of normal traffic.Measuring throughput changes of all links in a continuousmanner enables operators to understand whether the loadbalance scheme (e.g., ECMP) works normally. Furthermore,knowing which flows traverse highly-loaded links is essentialfor traffic engineering.Network-wide per-flow packet retransmission. HyperSightcan monitor packet retransmission via checking whether du-plicate TCP packets with the same five-tuples and sequencenumber exist. On the one hand, in-network packet retrans-mission detection helps identify random packet loss, whichenables operators to take timely mitigation operations suchas device rebooting. On the other hand, continuous packetretransmission reveals severe congestion or link failures, call-ing for traffic redirecting. On-data-plane packet retransmissiondetection paves the path to real-time traffic redirecting andhigh-quality network services.Denial-of-service attacks. Some denial-of-service (DoS) at-tacks lead to a large amount of the same type of trafficto the same destination to exhaust victims’ resources. Thus,

3
attack packets might have the same destination IP addressesand packet patterns, which distinguish them from regularpackets. For example, DNS reflection DoS attacks could resultin massive DNS response packets to victims simultaneously,while in ordinary cases, victims only have a small number ofresponse packets. Given the above nature of DoS attack traffic,HyperSight can check the duplicate packets among recently-arrived packets. When there is a lot of duplicate packetsfrom too many different source IP addresses to the samedestination address, HyperSight can reasonably identify thatthe network undergoes DoS attacks. Furthermore, checkingduplicate packets empowers HyperSight more generality tomonitor various DoS attacks.
Existing solutions can support the above cases for a specificflow or a specific device. However, when applying existingsolutions to check packet behaviors for all flows continuously,they inevitably introduce significant bandwidth overheads andprocessing overheads, posing limited feasibility. Comparedto the existing solutions, HyperSight can provide always-on high-coverage network monitoring services. Meanwhile,HyperSight significantly reduces the monitoring overheadsand can scale to large networks with high-volume traffic.
B. Related Work
Network monitoring has long been a challenging taskdrawing intensive researching interests. First, some tools canprovide fine-grained packet-level monitoring. NetSight [9]will generate packet records (called postcards), but NetSightintroduces high costs, because it needs to generate postcardsfor each packet. EverFlow [7] also generate postcards butemploys match-mirror and proactive test packet injection toreduce monitoring overheads. However, if EverFlow wants tomonitor all packet behaviors, it has to generate postcards for allpackets and encounter the same scalability issue of NetSight.
Second, some solutions can provide aggregated flow-levelmonitoring statistics. sFlow [16] and NetFlow [15] performsampling over packets. FlowRadar [21], LossRadar [20], andTurboFlow [18] can provide flow-level counters, but theycannot provide network incident information. HashPipe [32],Elastic Sketch [22], SketchLearn [23], OpenSketch [24], andUnivMon [33] employ sketches to monitor heavy hitters,flow size distribution, traffic change detection, and so on.Sonata [34] and Marple [35] also provide language-directednetwork monitoring. However, Sonata and Marple have tointerrupt on-service switches when updating their queries inswitches, falling short of supporting dynamic queries.
III. OVERVIEW OF HyperSight
In this section, we will illustrate how HyperSight imple-ments queries and how HyperSight monitors packet behaviorchanges (PBC).
A. Workflow and Dataflow of HyperSight
As shown in Figure 2, HyperSight is composed of fourlayers. The first layer consists of queries from various ap-plications, and the queries can be specified with PBQL. The
ASIC
26
Switch CPU
Centralized Processor
Packet Behaviors
PBC with FNs
Switch-level PBC
Network-wide PBC
HyperSightQueries
Query 1
Query 2
Query 3
Packets
Query 1Query 2Query 3
Query 1Query 2Query 3
Query 1Query 2Query 3
Query 1Query 2Query 3
Switch 1
Switch 2
Switch 3
ASIC
Switch CPU
Centralized Processor
HyperSightQueries
Query 1
Query 2
Query 3
Queries
Queries
Table Entries
Dispatch
Compile
vBFQ 1 vBFQ 2 vBFQ 3
Top-down Workflow Down-top Dataflow
Figure 2. Top-down workflow and down-top dataflow of HyperSight .Solid squares denote packets experiencing behavior changes, while hollowsquares denote those that do not experience behavior changes.
second layer is a centralized processor which collects datafrom all switches and pushes data to queries. The third layerconsists of CPUs of all switches and takes responsibilityfor cleaning raw data from programmable ASIC and reportsdata to the centralized processor. The fourth layer consists ofASICs which collect PBC at line rate. Next, we will introducethe workflow of HyperSight and how monitoring data ofHyperSight moves among the four layers, named dataflow.Top-down workflow of HyperSight . As shown in Figure 2,the workflow of HyperSight starts from the first layer and endsat the fourth layer, i.e., in a top-down manner. HyperSightcould execute multiple queries simultaneously in the samenetwork, and network operators could specify queries withPBQL. Then, the centralized processor dispatches all queriesto switches. Next, the switch CPU compiles queries to config-urations (i.e., table entries) of the P4 program, and the entriescan be dynamically installed into ASIC. Correspondingly,HyperSight will instantiate a vBFQ for each query. On theone hand, the top-down workflow supplies language-directedtelemetry [35] and enables a flexible way to express variousnetwork event monitoring tasks. On the other hand, the top-down workflow prevents collecting redundant data that isundesired by network operations and enhances the overallscalability of HyperSight .Down-top dataflow of HyperSight . Before being provisionedto upper-layer applications, PBC data will flow through ASIC,switch CPU, and the centralized processor sequentially, i.e., ina down-top manner. First, vBFQ in switch ASIC reports PBCwith false negatives (FN). Then, switch CPU can faithfullyremove FNs in PBCs and report switch-level PBCs. Last, thecentralized processor merges the data from different switchesinto the same data store and pushes the data to applicationqueries. Such down-top dataflow will reduce the volume ofdata layer by layer. Leveraging computing power on switchASIC, switch CPU, and the centralized processor, the dataflowcan achieve high PBC coverage while keeping overheads ofcollecting and transmitting data as low as possible.
B. Architecture of HyperSight
Figure 3 demonstrates the HyperSight architecture whichcomprises two parts. First, the centralized processor providesquery interfaces for various applications and collects datafrom all switches. Second, switches supporting HyperSightprovide high-coverage and scalable PBC monitoring. Hyper-Sight integrates the great programmability of switch CPU

4
31
Switch CPU
Switch ASICPCIe DMA
generate_digest
Ingress Egress
Ingress of switch.p4
Egress of switch.p4
vBFQ 1
vBFQ 2
vBFQ 3
vBFQ 4
Dynamic PBQL
Compiler
P4Runtime
PBC Reporter
PBC Cleaner
Queries Switch-level PBC
PBCData Store
𝑆"
𝑆#
HyperSight HyperSight
𝑆$
HyperSight ApplicationsLatency Monitor
Path Monitor
Centralized Processor
HyperSight
Switch-level PBCTable Entries
Figure 3. Architecture of HyperSight .
and the high performance of switch ASIC. On the one hand,HyperSight implements an efficient algorithm (BFQ) on ASICto get PBCs. On the other hand, the switch CPU performs thecomplex logic of removing FNs and reports FN-free PBCs tothe centralized processor. Next, we will introduce the designof switch CPU and switch ASIC.
Switch CPU. There are two functions in switch CPU. First,switch CPU performs query compilation. HyperSight providesa dynamic compiler for PBQL queries on PBC, and thecompiler will convert queries into P4 program configurations,i.e., table entries. Then, the compiler invokes P4 runtime [36],which is a south-bound protocol for controlling programmableASIC. §VI presents more details about query compilation.In this manner, HyperSight supports hot recompilation andreconfiguration of queries without switch service interruption.Second, switch CPU performs PBC cleaning. As PBC reportedby switch ASIC could have FNs, PBC cleaning is requiredto keep switch-level PBC redundancy-free and cut down theoverheads of reporting PBC. Polling PBCs form PCIe DMA,PBC cleaner records data in PBC data store. PBC cleanerwill check whether the reported data correctly identifies PBCs.If there is no FN, PBC cleaner informs PBC reporter whichuploads PBCs to the processor.
Switch ASIC. vBFQ can reside at the end of ingress pipelinesor egress pipelines in switch ASIC, which is decided bythe monitored packet behaviors. For example, if a vBFQ isdeigned to monitor queuing delay which can only be observedin egress pipelines, it must be placed in egress pipelines.BFQ is a memory-efficient algorithm which inevitably comeswith errors (i.e., FNs). Specifically, BFQ might report somepacket behaviors that do not undergo changes. The insightof HyperSight to handle FNs is to employ the processingpower of switch CPU. Whenever a BFQ finds a PBC, it willinvoke generate digest which reports PBC to switch CPU viaPCIe DMA. Evaluation results show that BFQ incurs minoroverheads on packet forwarding performance (§VII-D). In §V,we will present the detailed design and analysis of BFQ.
IV. PACKET BEHAVIOR QUERY LANGUAGE
To provide a convenient way for network operators todescribe their intents on packet behavior change monitoring,HyperSight provides a unified language, named packet behav-ior language (PBQL). In this section, we will introduce theprogramming model and the syntax of PBQL. Furthermore,we will show the expressibility of PBQL via nine applications.
SIP DIP PROTO SPORT DPORT SEQ Delay
𝑝𝑘𝑡 𝑖𝑝 𝑖𝑝 TCP 𝑝 𝑝 1 100us𝑝𝑘𝑡 𝑖𝑝 𝑖𝑝 TCP 𝑝 𝑝 1 100us𝑝𝑘𝑡 𝑖𝑝 𝑖𝑝 TCP 𝑝 𝑝 2 1ms𝑝𝑘𝑡 𝑖𝑝 𝑖𝑝 TCP 𝑝 𝑝 2 1ms
.. …𝑝𝑘𝑡 𝑖𝑝 𝑖𝑝 TCP 𝑝 𝑝 𝑥 1ms𝑝𝑘𝑡 𝑖𝑝 𝑖𝑝 TCP 𝑝 𝑝 y 100us𝑝𝑘𝑡 𝑖𝑝 𝑖𝑝 TCP 𝑝 𝑝 x 100us
SIP DIP PROTO SPORT DPORT Delay
𝑖𝑝 𝑖𝑝 TCP 𝑝 𝑝 1ms𝑖𝑝 𝑖𝑝 TCP 𝑝 𝑝 1ms𝑖𝑝 𝑖𝑝 TCP 𝑝 𝑝 100us𝑖𝑝 𝑖𝑝 TCP 𝑝 𝑝 100us
SIP DIP PROTO SPORT DPORT SEQ
𝑖𝑝 𝑖𝑝 TCP 𝑝 𝑝 x
Root Dynamic Table of Original Packet Behavior
Dynamic Table of Packet Retransmission
Dynamic Table of Packet Congestiondistinct
duplicate
Figure 4. Dynamic tables of HyperSight . Green packets belong to flow1, and red packets belong to flow 2.
……
Sliding Windows for distinct/duplicate Dynamic Table
Figure 5. distinct and duplicate based on sliding windows overdynamic tables.
A. Programming Model
PBQL is inspired by distributed stream processing frame-works, such as Flink [37]. These frameworks take a stream ofdata records as input and make transformation on records tobuild various applications. Correspondingly, packet behaviorsin switches can be abstracted as data records in streamprocessing framework, and we use dynamic tables to denotethe stream of packet behavior records. In this part, we willintroduce HyperSight’s programming model, which includesdynamic tables and the two operations over dynamic tables.Dynamic table. In Figure 4, columns of a dynamic tableare the fields that can identify packet behaviors, such asdestination IP address (SIP) and delay (Delay), and see §IV-Bfor a completed packet behavior field list. A dynamic tablehas an infinite number of rows, each of which is a packetbehavior record. The left part of Figure 4 shows a rootdynamic table that stores original behaviors of each packet.HyperSight generates a dynamic table for each query. Inessence, HyperSight transforms the root dynamic table to thedynamic tables corresponding to different queries. Next, weintroduce two transformations to monitor PBCs.
Table IPACKET BEHAVIOR FIELDS.
Category Field Syntax Pipeline
Header Header Field ℎ4034A . 5 84;3 Ingress and Egress
PathIngress Port 8= ?>AC Ingress and EgressEgress Port 46 ?>AC Ingress and Egress
Queue @83 Ingress and Egress
PerformanceQueue Length @D4D4 Egress
Delay 34;0H EgressThroughput CℎA>D6ℎ?DC Egress
Table IIPBQL SYNTAX.
5 ∈ Packet Behavior Fields+ ∈ N Field Value
+< ∈ N Field Value Mask, ∈ N Window Size� ::= 5 | 5 & +<
) ::= ” < ”� {, � } ” > ” | ∗ Keys� ::= ” < ” 5 {, 5 } ” > ” | ∗ Columns
DIS ::= distinct(C, T, W)DUP ::= duplicate(C, T, W)& ::= DUP | DIS | &1.&2 Statement
OP ::= Q.start(+ , +< {, + , +< }) | Q.end() Query Operations

5
Table IIIEXAMPLE APPLICATIONS EXPRESSED BY THE PACKET BEHAVIOR QUERY LANGUAGE.
Applications Queries
Large flow &1=distinct (<flow>, <flow, tcp.seq&0xFFFF8000>).duplicate (<flow>, <flow>)Flow path &2=distinct (<flow, sid, in port, eg port>, <flow, sid, in port, eg port>)Loop freedom &3=&2.duplicate (*, <flow, sid, eg port>)Flow delay change &4=distinct (<flow, sid, delay>, <flow,sid, delay&0xFC00 >)Flow congestion &5=distinct (*,<flow, sid, delay&0x8000>) .duplicate (*, <flow>)Throughput change &6=duplicate (<ip.dip>, <ip.sip, ip.dip, throughput&0xFC00>) .distinct (*, <ip.dip>)Packet retransmission &7=duplicate (<flow,tcp.seq>,<flow,tcp.seq>). distinct (*,<flow>)DNS reflection attack victims &8=duplicate (<ip.dip>,<ip.sip,ip.dip,dns.address>) .distinct (*,<ip.dip>)Packet modification &9=distinct (<flow,modified fields>,<flow,modified fields>)
Sliding-window-based distinct and duplicate. Intu-itively, dynamic tables could support various streaming pro-cessing primitives like map, reduce, and join. To monitorpacket behavior changes, HyperSight proposes two dedicatedprimitives shown in Figure 4. First, distinct is the sameas the distinct primitive of standard SQL and extracts dis-tinct elements in the dynamic table. Second, duplicate iscontrary to distinct and extracts the duplicate elements inthe dynamic table. However, as a dynamic table could havean infinite number of packet behavior records, performingdistinct or duplicate over the whole dynamic tableis impossible. Therefore, distinct and duplicate areexecuted over sliding windows and extract distinct or duplicatepacket behaviors for the recently-arrived packets. Intuitively,distinct extracts the behaviors of a packet when its behav-ior is distinct among the recently , packets (, is the windowsize), and duplicate works in the similar manner.
B. Packet Behavior Query Language
Based on the above programming model, HyperSight pro-poses PBQL for network operators to specify PBC monitoringtasks. PBQL enables operators to express queries over fieldsthat represent packet behaviors, which are referred to as packetbehavior fields. Next, we will introduce all packet behaviorfields and details of the language syntax.Packet behavior fields. As shown in Table I, there are threetypes of packet behavior fields. The first type is related withpacket headers and contains fields from parsed headers. Inthis paper, we only support some widely-used header fields,including destination IP, source IP, TCP/UDP ports, and so on.The second one is related with packet forwarding paths andincludes forwarding ports and queues. The third one is relatedto packet forwarding performance.Syntax. Table II shows the basic syntax of the query language.Both distinct and duplicate have three parameters.The first parameter � denotes the columns of the dynamictable. The second parameter ) specifies the keys for theprimitives. For example, if we want to find distinct destinationIP addresses, ) should be < 8?.38? >. Some fields, such asdelay, in ) can be discretized via the mask operation (&). Thethird parameter , is the window size. Furthermore, PBQLsupports query refinement, and operators can utilize existingstatements to implement more complex queries. Furthermore,PBQL also provides start and end primitives for operatorsto manipulate their query at runtime dynamically. Furthermore,operators can designate a query to monitor specified flows
through the parameters + and +<. start uses + and +< tocreate ternary match rules of five-tuples.
C. Expressibility
To demonstrate how PBQL comes into force in reality,Table III shows nine example applications. For brevity, weuse flow to denote five-tuples throughout the paper. Theseapplications enhance network monitoring in various perspec-tives. For example, with the ingress port and the egress port,we can get the forwarding path of each flow in &2. With&1, we can also attain the large flows whose sizes are over215 bytes. With PBQL, network operators can convenientlyspecify packet behavior change monitoring tasks. We shouldclaim that it is impossible for HyperSight to implement thecompleted logic of the applications with PBQL. The goal ofHyperSight is to provide an interface for operators to attainthe data required by these applications from networks.
V. DESIGN OF BLOOM FILTER QUEUE
In this section, we first show the technical background andconstraints of P4 and programmable switches. Then, we willdemonstrate the detailed design of BFQ. Table IV summarizesthe symbols used by this paper.
A. Preliminary to P4 and Programmable Switches
PISA and P4. The protocol independent switch architecture(PISA) [38] is a typical programming model for programmableswitches. PISA is composed of several reconfigurable com-ponents. First, PISA has parser and deparser to encode anddecode headers with arbitrary protocol formats. Second, PISAprocesses packets with a pipeline of stages, each of which hasmultiple match-action tables and memory resources, such asSRAM and TCAM. Third, a table has various match fields(e.g., destination IP address) with types (i.e., exact, lpm,range, and ternary). Forth, a table has multiple compoundactions constructed by primitive actions, such as modify field.Last, each stage has a fixed amount of stateful components,
Table IVSYMBOLS USED THROUGHOUT THE PAPER.
Symbol Description
The number of arrays in a bloom filter" The number of cells in an array( The number of bloom filters in a BFQ# The number of packets in a block, The window size, , = (( − 1)#�1, ..., � Hash functions for arrays

6
Cells (M)
Arra
ys (K)
ℎ� = ��(��)
HashFunctions
����
��
…
��
��
......
...…
��ℎ� = ��(��)
ℎ� = ��(��) BF[1][h�]
BF[2][h�]
BF[K][h�]
&
DISTINCT
DUPLICATE
…
0
1
Figure 6. Processing a packet with a Bloom Filter.
including registers, counters, and meters. Only registers can beread and written by PISA in a transaction manner while theother two only support either reading or writing operations.
P4 [26] is a data plane programming language. Network op-erators can develop P4 programs to specify packet processingbehaviors of the above PISA components. The lifecycle of aP4 program has two phases. At compile time, the P4 compilertransforms P4 programs to executable code and generatescontrol API. Then, at runtime, PISA switches process packetsaccording to P4 programs. Meanwhile, the controller populatesmatch-action table entries through control API.Constraints of PISA. To guarantee high-performance packetforwarding, PISA inevitably introduces programmability com-promise with constraints for complex logic. We present someof the PISA constraints, which drive the design choices ofBFQ. The first one is constrained access to stages. In PISA,each packet can traverse tables and stateful components onlyonce. Thus, we can not implement the logic (such as minimalcalculation) requiring multiple accesses to states. The secondone is constrained operations on registers. Registers are cru-cial to implementing stateful packet processing logic on dataplanes, but PISA only supports transactional register opera-tions including read, write, read-write, write-read and so on.The constrained transactional operations prevent implementingcomplex logic over states stored in registers.
There are some off-the-shelf Bloom Filter variants, includ-ing SBF [39], RSBF, BSBFSD, and RLBSBF [40], whichown the similar capability with BFQ, i.e., finding distinct orduplicate items in infinite streams. However, none of them canbe implemented on PISA, as they need either multiple timesof access to same stages or non-transactional operations overregisters. Therefore, the limited feasibility of existing solutionson PISA motivates the design of BFQ.
B. Bloom Filter Queue
In this part, we first demonstrate the philosophy of monitor-ing packet behavior changes. Next, we will briefly introduceBloom Filter (BF) which can find distinct or duplicate ele-ments in a data set with finite elements. Last, we show thedesign of BFQ that can find distinct or duplicate elements inthe data stream with an infinite number of elements.Philosophy of Monitoring Packet Behavior Changes. Anintuitive approach to monitoring packet behavior changes isto track packet behaviors of each flow and compare packetbehaviors of previous packets with the incoming packets.However, this approach needs to record states for each flowand consumes unacceptable data plane resources.
Given the limitation of the above approach, we proposeto check and record the appearance of packet behaviors forincoming packets. If some packet behavior never appears, we
Bloom Filter Queue
………
������
Window for Recently-arrived Packets
…
��������
…
����������
…
����������
…
��������
��� ����������� ���
Dequeue Enqueue
N Packets
Clear
Expired Packets Recently-arrived Packets New Packets
……
Record
���
�����
���
…
|
DISTINCT
DUPLICATE
0
1
Traffic
Figure 7. Bloom Filter Queue design to monitor packet behavior changes.
Algorithm 1: Pseudo-code for BFQ1 ?:C 2>D=C4A ← 0 ;2 foreach ?:C entering a switch do3 ?:C 2>D=C4A ← ?:C 2>D=C4A + 1 ;
/* 1;>2:_83 denote the current block ID for?:C. */
4 1;>2: 83 ← ?:C 2>D=C4A / # ;/* 1 5 _83 and =4GC_1 5 _83 denotes the current
and next BF ID. */5 1 5 83 ← 1;>2: 83 <>3 (;6 =4GC 1 5 83 ← (1;>2: 83 + 1) <>3 (;7 A4?>AC 5 ;06← 0;8 Get a ) for ?:C;9 for 1 ≤ : ≤ do
10 ℎ: ← �: () ) <>3 " ;11 for 1 ≤ B ≤ ( do12 if B ≠ =4GC 1 5 83 then13 if ��& [B] [: ] [ℎ: ] = 1 then14 A4?>AC 5 ;06 = A4?>AC 5 ;06 + 1;15 Break;
16 ��& [1 5 83 ] [: ] [ℎ: ] ← 1;17 ��& [=4GC 1 5 83 ] [: ] [?:C 2>D=C4A <>3 " ] ← 0;
18 if A4?>AC 5 ;06 < then19 Generate a digest;
can identify a packet behavior change, which is similar tofinding distinct packet behaviors. We can record packet be-havior appearance with BF, which is a probabilistic algorithmwith high memory efficiency and consumes bounded memoryresource. However, BF can only find distinct packet behaviorsfor finite packets, but there could be infinite packets passingthrough the switches. Moreover, an error might happen toBF when a packet behavior changes back to a previouslyexisting one. To overcome the limitation of BF, we proposeBFQ, which tries to find distinct behaviors for recently-arrivedpackets, or in a sliding window of packets. BFQ can find PBCseven when the behavior of the incoming packet change backto the behavior of previous packets that are outside the slidingwindow. There is a risk that BFQ might fail when the behaviorof the incoming packet changes back to the previous packetbehavior inside the window. Luckily, this risk can be relievedwith careful adjustment of the sliding window size.
Bloom Filter. First of all, we show how a BF finds distinctpacket behaviors. As shown in Figure 6, a BF comprises arrays, each of which comprises " cells. The behavior ofpacket ?:C8 is )8 . Then, BF generates positions (ℎ1, ...)through different hash functions over )8 . Afterwards, BFcan get cells (�� [1] [ℎ1], ..., �� [ ] [ℎ ]) for )8 . In BF,a cell contains only one bit. If all the cells are 1, BF marks)8 as duplicate (i.e., )8 has been seen before). Otherwise, BFmarks ?:C8 as distinct (i.e., )8 has never been seen).
Bloom Filter Queue. After presenting BF, we illustrate howpackets sequentially traverse BFQ. As shown in Figure 7,

7
BFQ is composed of ( BFs. BFQ sequentially divides packetsinto fixed-size blocks, each of which has # packets. EachBF exclusively records behaviors for a block of packets. Forexample, ��1 records behaviors for �;>2:G . Every packetqueries recent ( − 1 BFs to check whether its behavior hasbeen recorded. If all BFs mark this packet as distinct, BFQhas never seen the packet behavior in recently-arrived packets.Then, BFQ marks this packet as distinct and report packetbehaviors. Otherwise, BFQ marks the packet as positive anddoes not report. Meanwhile, to prevent influences from expiredpackets, BFQ should clear all cells in the dequeued BF, i.e.,��1. When all packets in the current block (�;>2:G+(−1)complete, the new block (�;>2:G+() will be shifted into thewindow, and its BF (cleared ��1) will be enqueued at thesame time. Similar to the above procedure, BFQ dequeues��2 whose block becomes expired.
BFQ maintains a window which slides at the block level andalways scans recently-arrived packets. The window size can becalculated by ((−1)# . For every packet, BFQ checks all BFsexcept for the oldest BF. If outputs of all the checked BFs aredistinct, BFQ classifies this packet behavior as distinct (neverseen in the recently-arrived packets), otherwise duplicate. Weprovide a completed description of BFQ in Algorithm 1.
For BFQ, there could be two types of errors, false positive(FP) and false negative (FN). The FP is referred to that adistinct packet behavior is classified as the duplicate packetbehavior, while the FN is referred to that a duplicate packetbehavior is classified to be distinct. We name the possibilitythat FP and FN happen as false positive rate (FPR) andfalse negative rate (FNR) respectively. We present a detailedanalysis of FPR and FNR of BFQ in §VII.Report messages of BFQ. Instead of forwarding the wholepackets, BFQ only reports the column fields for each queryto the switch CPU with generate digest which is generalprimitive action supported by almost all P4 targets. As thepacket behavior fields only occupy tens of bytes and are muchsmaller than the packet sizes, BFQ takes up a small bandwidthof the ASIC-CPU PCIe channel. To further optimize theworkload of switch CPU, HyperSight proposes to buffer BFQreports on the data plane and forward reports in batches, whichborrows the insight of *Flow [19]. Intuitively, In this manner,HyperSight could effectively reduce the number of messagesbetween ASIC and CPU, improving CPU efficiency.
VI. DYNAMIC COMPILATION
With network conditions changing over time, operatorsmight need different queries at different time over differentflows. In other words, HyperSight should be able to supportdynamically starting and terminating queries. To achieve thisgoal, we propose to support dynamic compilation of PBQLin this section. First, we explore the language elements thatdiffer among queries, which is referred to as dynamics in thequery language and determines the design space of dynamiccompilation. Next, we show the design of a BFQ extensionthat supports reconfiguring PBQL dynamics without disruptingon-service switches. As we borrow the idea of programmabledata plane virtualization [28, 29, 41], we name the extensionas virtual bloom filter queue (vBFQ).
A. Dynamics of PBQL
In this part, we outline the dynamics in the query language.The primary design goal of dynamic compilation is to makethese dynamics dynamically-reconfigurable.Types and numbers of query statements. Each query hasdifferent types, i.e., distinct and duplicate. Furthermore, asnetwork operators might write refinement queries, implyingthat one query might have multiple query statements, just like&3, &6, and &8 in Table III. Thus, vBFQ should supportdifferent types and number of query statements.Columns and keys. In one query, network operators canspecify different packet behavior fields as the columns (C)and keys (T). Furthermore, packet behavior fields in keys needmask operations. Therefore, vBFQ should be able to selectpacket behavior fields to construct columns and keys.Parameters of BFQ. There are four parameters of BFQ,including the number of cells per array ("), the number ofarrays per BF ( ), the number of BF ((), and the numberof packets per block (#). On the one hand, # and ( jointlydetermine the window size , , i.e., , = #(−# . On the otherhand, " , , and ( jointly determine the memory occupiedby vBFQ. To be able to allocate memory and windows fordifferent queries at runtime, vBFQ should support dynamicallychanging the four BFQ parameters.
B. Virtual Bloom Filter Queue
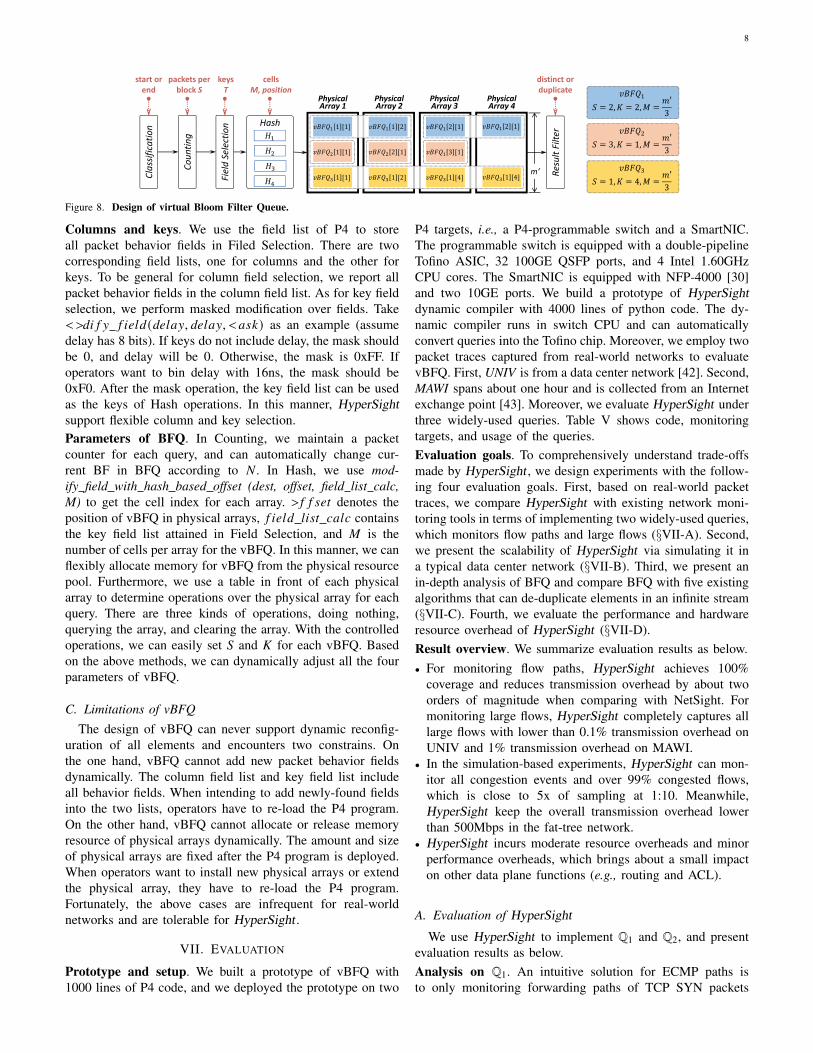
Figure 8 shows the overall design of vBFQ. In the P4pipeline, we allocate multiple physical arrays, each of whichhas a fixed amount of cells and a hash function. As shownin the figure, physical arrays work as a resource pool, andwe can allocate registers from the pool for different vBFQ.Furthermore, in Classification, we use a table to performternary matching over five tuples. Thus, Classification enablesoperators to perform monitoring tasks with various granulari-ties. Moreover, vBFQ is functionally equal to BFQ without anycompromise or wastage of register resources. Next, we showthe design of vBFQ that supports the dynamics of PBQL.Types and numbers of query statements. The two typesof query statements, i.e., distinct and duplicate, have oppositefunctions. As the query results of vBFQ are enumerable, wemake a look-up table to enumerate all results and determinewhether to perform digest generation. For example, when K =3 and S = 3, then there will be 29 kinds of results, and the look-up table should have 512 entries for each query. Currently, weuse SRAM to perform exact match over query results, andwe can also employ ternary match to reduce the number oftable entries at the cost of consuming scarce TCAM. Withthe look-up table, we can dynamically configure the querytype. To support query refinement, we install the structureshown in Figure 8 in ingress pipelines and egress pipelines.Currently, each structure only supports one vBFQ for onequery, thus switch ASIC can support up to 2 query statements.To remove such constrain, we further employ switch CPUto run the remaining query statements on software. In thismanner, HyperSight has no limit in terms of the number ofstatements in one query.
8
Field Selection
PhysicalArray 1
PhysicalArray 2
PhysicalArray 3
PhysicalArray 4
𝑣𝐵𝐹𝑄𝑆 2,𝐾 2,𝑀
𝑚′3
𝑣𝐵𝐹𝑄 1 1
𝑣𝐵𝐹𝑄 1 1
𝑣𝐵𝐹𝑄 1 1
𝑣𝐵𝐹𝑄 1 2
𝑣𝐵𝐹𝑄 2 1
𝑣𝐵𝐹𝑄 1 2
𝑣𝐵𝐹𝑄 2 1
𝑣𝐵𝐹𝑄 3 1
𝑣𝐵𝐹𝑄 1 4
𝑣𝐵𝐹𝑄 2 1
𝑣𝐵𝐹𝑄 1 4
𝑣𝐵𝐹𝑄𝑆 3,𝐾 1,𝑀
𝑚′3
𝑣𝐵𝐹𝑄𝑆 1,𝐾 4,𝑀
𝑚′3
Classification Hash
𝐻
𝐻
𝐻
𝐻Co
untin
g
Result Filte
r
m’
start or end
packets per block S
keysT
cellsM, position
distinct or duplicate
Figure 8. Design of virtual Bloom Filter Queue.
Columns and keys. We use the field list of P4 to storeall packet behavior fields in Filed Selection. There are twocorresponding field lists, one for columns and the other forkeys. To be general for column field selection, we report allpacket behavior fields in the column field list. As for key fieldselection, we perform masked modification over fields. Take<>38 5 H 5 84;3 (34;0H, 34;0H, <0B:) as an example (assumedelay has 8 bits). If keys do not include delay, the mask shouldbe 0, and delay will be 0. Otherwise, the mask is 0xFF. Ifoperators want to bin delay with 16ns, the mask should be0xF0. After the mask operation, the key field list can be usedas the keys of Hash operations. In this manner, HyperSightsupport flexible column and key selection.Parameters of BFQ. In Counting, we maintain a packetcounter for each query, and can automatically change cur-rent BF in BFQ according to # . In Hash, we use mod-ify field with hash based offset (dest, offset, field list calc,M) to get the cell index for each array. > 5 5 B4C denotes theposition of vBFQ in physical arrays, 5 84;3 ;8BC 20;2 containsthe key field list attained in Field Selection, and " is thenumber of cells per array for the vBFQ. In this manner, we canflexibly allocate memory for vBFQ from the physical resourcepool. Furthermore, we use a table in front of each physicalarray to determine operations over the physical array for eachquery. There are three kinds of operations, doing nothing,querying the array, and clearing the array. With the controlledoperations, we can easily set ( and for each vBFQ. Basedon the above methods, we can dynamically adjust all the fourparameters of vBFQ.
C. Limitations of vBFQ
The design of vBFQ can never support dynamic reconfig-uration of all elements and encounters two constrains. Onthe one hand, vBFQ cannot add new packet behavior fieldsdynamically. The column field list and key field list includeall behavior fields. When intending to add newly-found fieldsinto the two lists, operators have to re-load the P4 program.On the other hand, vBFQ cannot allocate or release memoryresource of physical arrays dynamically. The amount and sizeof physical arrays are fixed after the P4 program is deployed.When operators want to install new physical arrays or extendthe physical array, they have to re-load the P4 program.Fortunately, the above cases are infrequent for real-worldnetworks and are tolerable for HyperSight .
VII. EVALUATION
Prototype and setup. We built a prototype of vBFQ with1000 lines of P4 code, and we deployed the prototype on two
P4 targets, i.e., a P4-programmable switch and a SmartNIC.The programmable switch is equipped with a double-pipelineTofino ASIC, 32 100GE QSFP ports, and 4 Intel 1.60GHzCPU cores. The SmartNIC is equipped with NFP-4000 [30]and two 10GE ports. We build a prototype of HyperSightdynamic compiler with 4000 lines of python code. The dy-namic compiler runs in switch CPU and can automaticallyconvert queries into the Tofino chip. Moreover, we employ twopacket traces captured from real-world networks to evaluatevBFQ. First, UNIV is from a data center network [42]. Second,MAWI spans about one hour and is collected from an Internetexchange point [43]. Moreover, we evaluate HyperSight underthree widely-used queries. Table V shows code, monitoringtargets, and usage of the queries.Evaluation goals. To comprehensively understand trade-offsmade by HyperSight , we design experiments with the follow-ing four evaluation goals. First, based on real-world packettraces, we compare HyperSight with existing network moni-toring tools in terms of implementing two widely-used queries,which monitors flow paths and large flows (§VII-A). Second,we present the scalability of HyperSight via simulating it ina typical data center network (§VII-B). Third, we present anin-depth analysis of BFQ and compare BFQ with five existingalgorithms that can de-duplicate elements in an infinite stream(§VII-C). Fourth, we evaluate the performance and hardwareresource overhead of HyperSight (§VII-D).Result overview. We summarize evaluation results as below.• For monitoring flow paths, HyperSight achieves 100%
coverage and reduces transmission overhead by about twoorders of magnitude when comparing with NetSight. Formonitoring large flows, HyperSight completely captures alllarge flows with lower than 0.1% transmission overhead onUNIV and 1% transmission overhead on MAWI.
• In the simulation-based experiments, HyperSight can mon-itor all congestion events and over 99% congested flows,which is close to 5x of sampling at 1:10. Meanwhile,HyperSight keep the overall transmission overhead lowerthan 500Mbps in the fat-tree network.
• HyperSight incurs moderate resource overheads and minorperformance overheads, which brings about a small impacton other data plane functions (e.g., routing and ACL).
A. Evaluation of HyperSight
We use HyperSight to implement Q1 and Q2, and presentevaluation results as below.Analysis on Q1. An intuitive solution for ECMP paths isto only monitoring forwarding paths of TCP SYN packets

9
Table VQUERIES USED IN THE EVALUATION OF HyperSight .
Query Monitoring targets Used by
Q1 = distinct (<flow, in port, eg port>, <flow, in port, eg port>) ECMP flow paths §VII-B, §VII-D, §VII-EQ2 = distinct (<flow, tcp.seq>, <flow, tcp.seq&0xFFF00000>).duplicate (*, <flow>) Large flows §VII-BQ3 = distinct (<flow, qid, delay>, <flow, qid, delay&0xFC00>) Congested flows §VII-C
I d e a lN e t S i g h t 1 : 1 0 1 : 1 0 0
1 : 1 0 0 0 H SH S - O 5
0 . 1
1
1 0
1 0 0
Cover
age (%
)
(a) Coverage on UNIV
I d e a lN e t S i g h t 1 : 1 0 1 : 1 0 0
1 : 1 0 0 0 H SH S - O 5
0 . 1
1
1 0
1 0 0
Overh
ead (%
)
(b) Overhead on UNIV
I d e a lN e t S i g h t 1 : 1 0 1 : 1 0 0
1 : 1 0 0 0 H SH S - O 5
0 . 1
1
1 0
1 0 0
Cover
age (%
)
(c) Coverage on MAWI
I d e a lN e t S i g h t 1 : 1 0 1 : 1 0 0
1 : 1 0 0 0 H SH S - O 5
0 . 1
1
1 0
1 0 0
Overh
ead (%
)
(d) Overhead on MAWIFigure 9. Coverage and overhead comparison in terms of Q1.
at the beginning of flows. However, this solution fails whenECMP paths change due to link failures or load balancing. Q1enables monitoring paths continuously and provides visibilityof path changes. In the experiments of Q1, we compareHyperSight with three countermeasures, including the idealbaseline, NetSight [9], and sampling. For the ideal baseline,we only generate one report for one ECMP flow path andcan cover all flows. NetSight reports messages for all packets.Sampling is configured with different ratios, including 1:10,1:100, and 1:1000. As for HyperSight , we show coverageand overheads of HyperSight (HS) and optimized HyperSightwhose batch size is five (HS-O5).
As shown in Figure 9(a) and Figure 9(c), the ideal baselineand NetSight can monitor all ECMP paths for all flows. Withthe sampling ratio increasing from 1:10 to 1:1000, the cover-age of sampling decreases dramatically. For 1:10, the coverageratio is about 28%, while the ratio is as low as 3% for 1:1000.For both packet traces, the coverage ratio of HS and HS-O5are larger than 99.99%. Figure 9(b) and Figure 9(d) shows themonitoring overheads, i.e., the ratio of monitoring messagesto normal packets. NetSight generates monitoring messagesfor all packets and incurs unacceptable overheads. As forsampling, the overhead decreases linearly as the sampling ratioincreases. HS incurs several percentages of overheads, whichis comparable to sampling 1:100. Furthermore, HS-O5 reducesoverheads by 80%. In summary, as for Q1, HyperSight is theonly one that is close to the ideal baseline and can achieveboth good coverage and low overheads.
Analysis on Q2. In Q2, we utilize HyperSight to monitor theflows whose sizes are larger than 220 bytes. In the experiments,we measure FPR and overheads under different numbers ofpackets per block. Furthermore, we measure the overheads ofHyperSight when the optimization batch size is 1 w/o O, 5w/O5, and 10 (w/ O10).
0 % 0 % 0 % 0 % 0 % 1 % 8 %
3 7 %
7 1 %7 9 %
2 1 0 2 1 1 2 1 2 2 1 3 2 1 4 2 1 5 2 1 6 2 1 7 2 1 8 2 1 902 04 06 08 0
FPR (
%)
P a c k e t s p e r B l o c k ( l o g 2 - s c a l e )(a) FPR on UNIV
2 1 0 2 1 1 2 1 2 2 1 3 2 1 4 2 1 5 2 1 6 2 1 7 2 1 8 2 1 90 . 01 . 02 . 03 . 04 . 0
Overh
ead (x
10-3 )
P a c k e t s p e r B l o c k ( l o g 2 - s c a l e )
w / o O w / O 5 w / O 1 0
(b) Overhead on UNIV
0 % 0 % 0 % 0 % 0 % 0 % 1 % 5 %
3 1 %
8 2 %
2 1 0 2 1 1 2 1 2 2 1 3 2 1 4 2 1 5 2 1 6 2 1 7 2 1 8 2 1 902 04 06 08 0
FPR (
%)
P a c k e t s p e r B l o c k ( l o g 2 - s c a l e )(c) FPR on MAWI
2 1 0 2 1 1 2 1 2 2 1 3 2 1 4 2 1 5 2 1 6 2 1 7 2 1 8 2 1 90 . 02 . 04 . 06 . 08 . 0
Overh
ead (x
10-2 )
P a c k e t s p e r B l o c k ( l o g 2 - s c a l e )
w / o O w / O 5 w / O 1 0
(d) Overhead on MAWIFigure 10. False positive rates and overheads in terms of Q2.
As shown in Figure 10(a) and Figure 10(c), HyperSightcan keep 0% FPR when the window size is small. Whenthe window size further increases, FPR increases accordingly.As shown in Figure 10(b) and Figure 10(d), the overheaddecreases dramatically with the window size increasing. Forexample, when there are 214 packets per block for UNIV, wecan monitor all large flows. If the switch ASIC is forwardingpackets at 1Gpps, the switch CPU should be about to processmonitoring messages at 2Mpps. With the optimization, theswitch CPU should only work at 200Kpps, which is withinthe capability of the switch CPU. Notably, the query runningin ASIC inevitably generate false negatives, but the agent inswitch CPU can faithfully remove those false negatives.
B. Simulation of HyperSight
We simulate a fat-tree network with k = 4 using NS3 (20switches and 32 hosts). In the simulation, links are configuredwith 1Gbps bandwidth and 1ms delay, and switches ports areconfigured with one queue whose size is 1000 packets. Duringthe simulation, each host emits 1000 TCP flows to any otherhost, and the start time of flows follows a uniform distribution.We employ a heavy-tailed Pareto distribution to derive flowsizes [44] whose mean is 10000 bytes. We run Q3 in switchesto monitoring congestion events and flows.Congestion characteristics of simulation traffic. We traceen-queuing length of each packet in each switch to under-stand queuing length evolvement, congestion events, congestedflows, and congested packets, named congestion characteris-tics, which are shown in Figure 11(a). We use different queuethresholds to classify whether queues are congested. Morespecifically, when the queue length exceeds the threshold,the congestion happens, and the congestion ends as soon asthe queue length drops down below the threshold. In ourexperiments, the congestion thresholds can be 16, 32, and

10
2 . 0 0 2 . 0 1 2 . 0 2 2 . 0 3 2 . 0 4 2 . 0 50
2 04 06 08 0
Queue
Lengt
h
T i m e ( s )
E d g e A g g r e g a t e C o r e
(a) Queue length
0 2 0 0 4 0 0 6 0 00 . 00 . 20 . 40 . 60 . 81 . 0
CDF
C o n g e s t i o n E v e n t C o u n t
T h r e s h o l d = 1 6 T h r e s h o l d = 3 2 T h r e s h o l d = 6 4
(b) Congestion events
0 5 0 0 0 1 0 0 0 0 1 5 0 0 00 . 00 . 20 . 40 . 60 . 81 . 0
CDF
C o n g e s t i o n F l o w C o u n t
T h r e s h o l d = 1 6 T h r e s h o l d = 3 2 T h r e s h o l d = 6 4
(c) Congestion flows
0 . 0 0 0 . 0 1 0 . 0 2 0 . 0 3 0 . 0 40 . 00 . 20 . 40 . 60 . 81 . 0
CDF
C o n g e s t e d P a c k e t R a t i o
T h r e s h o l d = 1 6 T h r e s h o l d = 3 2 T h r e s h o l d = 6 4
(d) Congestion packetsFigure 11. Queue, congestion events, congestion flows, and congestionpackets in the simulation experiment.
1 6 3 2 6 40 . 0
0 . 4
0 . 8
1 . 2
C o n g e s t i o n T h r e s h o l d
Event
Cover
age
M e a n : 1 : 1 0 1 : 1 0 0 H S 1 H S 2 H S 3M i n ~ M a x :
(a) Event coverage
1 6 3 2 6 40 . 0
0 . 4
0 . 8
1 . 2
C o n g e s t i o n T h r e s h o l d
Flow C
overag
e
M e a n : 1 : 1 0 1 : 1 0 0 H S 1 H S 2 H S 3M i n ~ M a x :
(b) Flow coverage
1 6 3 2 6 40 . 0 10 . 0 20 . 0 30 . 0 40 . 0 5
C o n g e s t i o n T h r e s h o l d
Overh
ead
2 5 % ~ 7 5 % : H S 1 H S 2 H S 3 M i n ~ M a x : M e a n :
(c) Packet overhead
1 6 3 2 6 40
2 0 0
4 0 0
6 0 0 1 : 1 0 1 : 1 0 0 H S 1 H S 2 H S 3
Bandw
idth O
verhea
d (Mb
ps)
C o n g e s t i o n T h r e s h o l d(d) Bandwidth overhead
Figure 12. Using sampling and HyperSight to detect congestion eventsand flows.
64. Figure 11(a) shows the queuing length evolvement ofthree ports in an edge switch, an aggregate switch, and acore switch. Edge switches encounter more congestion eventsthan aggregate switches and core switches. Figure 11(b) andFigure 11(c) show the cumulative distribution of congestionevents and flows in one switch. When the congestion thresholdrises, the numbers of congestion events and congestion flowsdecrease. Furthermore, we show the ratio of packets experi-encing congestion in Figure 11(d), revealing that congestedpackets only take up a small portion of overall traffic.Analysis on Q3. As for Q3, we present the congestion eventcoverage, congestion flow coverage, as well as overheadsin packets and bandwidth in Figure 12. In the experiment,we compare HyperSight (optimization batch size is 5) withsampling (1:10 and 1:100). Moreover, we change the num-bers of packet per block to 4000 (HS1), 10000 (HS2), and20000 (HS3) for HyperSight . As for event coverage shown inFigure 12(a), HyperSight can monitor over 99% congestionevents in all switches while sampling at 1:100 can only supplyinformation of 43%-81% congestion events on average. Asfor flow coverage shown in Figure 12(b), sampling performsworse. Sampling at 1:10 can only monitor no more than22% congestion flows. HyperSight keeps flow coverage over99% with 4000 packets per block. As for packet overheads
2 1 0 2 1 4 2 1 8 2 2 2 2 2 60 . 0
2 0 . 04 0 . 06 0 . 08 0 . 0
1 0 0 . 0
FPR (
%)
N o . o f C e l l s p e r A r r a y ( l o g 2 - s c a l e )
B S B F B S B F S D R L B S B F S B F B F B F Q
(a) FPR
2 1 0 2 1 2 2 1 4 2 1 6 2 1 8 2 2 0 2 2 2 2 2 4 2 2 60 . 00 . 51 . 01 . 52 . 02 . 53 . 0
FNR (
%)
N o . o f C e l l s p e r A r r a y ( l o g 2 - s c a l e )
B S B F B S B F S D R L B S B F S B F B F B F Q
(b) FNR
2 1 0 2 1 4 2 1 8 2 2 2 2 2 60 . 0
2 0 . 04 0 . 06 0 . 08 0 . 0
1 0 0 . 0
NPV (
%)
N o . o f C e l l s p e r A r r a y ( l o g 2 - s c a l e )(c) NPV
2 1 0 2 1 4 2 1 8 2 2 2 2 2 69 9 . 69 9 . 79 9 . 89 9 . 9
1 0 0 . 0
ACC (
%)
N o . o f C e l l s p e r A r r a y ( l o g 2 - s c a l e )
B S B F B S B F S D R L B S B F S B F B F B F Q
(d) ACCFigure 13. Algorithm comparison with varied numbers of cells per array.
shown in Figure 12(c), monitoring messages generated byHyperSight take up several percents of normal packets, andpacket overheads decrease significantly with the packets perblock increasing. As for bandwidth overheads shown inFigure 12(d), HyperSight generates 500Mbps network-widemonitoring traffic at most. Each switch generates 25Mbpsmonitoring traffic, which occupies 0.3% of switch bandwidth.Overall, HyperSight enables high-coverage and low-overheadcongestion monitoring, and largely outperforms sampling.
C. Analysis of BFQ
To comprehensively understand the characteristics of BFQ,we compare it with the BF baseline and other four widely-used algorithms, including SBF [39], RSBF, BSBFSD, andRLBSBF [40]. All algorithms are tested against UNIV underQ1. Due to space constraints, we only show four metrics,including FPR, FNR, negative predicate value (NPV), andaccuracy (ACC).Analysis of varied M. Figure 13 shows compression of thealgorithms with " increasing from 210 to 225 when is3. Bigger " is, the more memory algorithms occupy. ForHyperSight , ( is 4, and # is 65536. As shown in Figure 13(a)and Figure 13(d), BF encounters almost 100% FPR andzero ACC when the available memory is small, revealingthat BF cannot be applied to infinite packet streams. Otheralgorithms including BFQ extend BF to work over the infinitestream. With M increasing, FPRs of all algorithms decreasesignificantly. For BFQ, it can keep FPR low and accuracyhigh even if there is a small amount of memory, whichis preferable to performing monitoring tasks over resource-constrained switches. Furthermore, as shown in Figure 13(b)and Figure 13(c), FNR and NPV of BFQ are constant.Analysis of varied K. Figure 14 compares the algorithms with increasing from 2 to 5 when " is 65536. For HyperSight ,( is 4, and # is 65536. As shown in Figure 14(a), BF keepsa high FPR, and FPRs of The other algorithms decrease withthe number of arrays. As shown in Figure 14(b), BF has a zeroFNR. The FNR of the other algorithms except BFQ increaseswith , while BFQ has a decreased FNR when increases.Because when K decreases, the window size of recently-arrived packets decreases. This increases the possibility that

11
2 3 4 502 04 06 08 0
1 0 0FP
R (%)
N o . o f A r r a y s
B S B F B S B F S D R L B S B F S B F B F B F Q
(a) FPR
2 3 4 50 . 0
1 . 0
2 . 0
3 . 0
FNR (
%)
N o . o f A r r a y s
B S B F B S B F S D R L B S B F S B F B F B F Q
(b) FNR
2 3 4 502 04 06 08 0
1 0 0
NPV (
%)
N o . o f A r r a y s
B S B F B S B F S D R L B S B F S B F B F B F Q
(c) NPV
2 3 4 502 04 06 08 0
1 0 0
ACC (
%)
N o . o f A r r a y s
B S B F B S B F S D R L B S B F S B F B F B F Q
(d) ACCFigure 14. Comparison of different algorithms with varied numbers ofarrays ( ).
2 1 0 2 1 4 2 1 8 2 2 2 2 2 6
0
1 0
2 0
3 0
FPR (
%)
P a c k e t s p e r B l o c k ( l o g 2 - s c a l e )
S = 2 S = 3 S = 4 S = 5 S = 6 S = 7 S = 8
(a) FPR
2 1 0 2 1 4 2 1 8 2 2 2 2 2 60 . 0
1 . 0
2 . 0
3 . 0
FNR (
%)
P a c k e t s p e r B l o c k ( l o g 2 - s c a l e )
S = 2 S = 3 S = 4 S = 5 S = 6 S = 7 S = 8
(b) FNRFigure 15. FPR and FNR of BFQ with varied packet per block (# ).
2 3 4 5 6 7 80 . 0 0 0
0 . 0 0 5
0 . 0 1 0
FPR (
%)
N o . o f B F
N = 4 0 9 6 N = 8 1 9 2 N = 1 6 3 8 4 N = 3 2 7 6 8
(a) FPR
2 3 4 5 6 7 80 . 5
1 . 0
1 . 5
2 . 0
FNR (
%)
N o . o f B F
N = 4 0 9 6 N = 8 1 9 2 N = 1 6 3 8 4 N = 3 2 7 6 8
(b) FNRFigure 16. FPR and FNR of BFQ with varied numbers of BF (().
duplicated packet behaviors are classified as distinct packetbehaviors, and packets with duplicated behaviors are morelikely to be in different windows. Figure 14(d) demonstratesthat BFQ has similar accuracy with the other algorithms.
Analysis of varied # and (. Figure 15 and Figure 16 showsFPR and FNR of BFQ with # increasing from 210 to 225 when" , are 65536 and 4 respectively. As shown in Figure 15(a),FPR of BFQ is close to zero when the number of packetsper block is small. Then, FPR will grow linearly with # .It is intuitive as bigger # is, one BF in BFQ should checkmore packets simultaneously, which inevitably brings FPR up.As for FNR shown in Figure 15(b), FNR decreases with (
increasing. In the experiments, # ranges from 4096 to 32768.As shown in Figure 16(a), FPR of BFQ increases slightly with(, and # has an impact on the increasing speed. As for FNRshown in Figure 16(b), FNR decreases with ( increasing.
Summary. Based on the above results, we reasonably claimthat BFQ performs comparably to existing algorithms forinfinite streams. Meanwhile, BFQ is implementable on pro-grammable switches while the other BF extension algorithmsare too complex for programmable switches. Furthermore,BFQ’s parameters can be dynamically adjusted by operators atruntime to make a desirable trade-off between FPR and FNR.
6 4 1 2 8 2 5 6 5 1 2 1 0 2 4 1 2 8 0 1 5 0 006
1 21 82 43 0 M e a n w / o B F Q M e a n w / B F Q
1 % ~ 9 9 %
P a c k e t S i z e ( b y t e s )
Delay
(us)
(a) Delay on SmartNIC
6 4 1 2 8 2 5 6 5 1 2 1 0 2 4 1 2 8 0 1 5 0 002468
1 0
P a c k e t S i z e ( b y t e s )
Delay
(us)
M e a n w / o B F Q M e a n w / B F Q 1 % ~ 9 9 %
(b) Delay on TofinoFigure 17. Performance overhead introduced by BFQ.
D. Overheads of vBFQ
HyperSight needs to deploy vBFQ on different P4 targets,such as Tofino, SmartNIC, and FPGA. First, vBFQ needs toperform field selection, store counters, and get final results,which introduce additional usage of data plane resources, suchas matching crossbar, SRAM, and TCAM. Second, vBFQintroduces additional processing logic, which might influencepacket forwarding performance. Next, we will analyze re-source overheads and performance overheads of vBFQ.
Resource usage. In this part, we show the hardware resourceusage of vBFQ, and we build a prototype of vBFQ that isconfigured with eight 65536-cell arrays. Table VI shows theresults normalized by the resource usage of Switch.P4. vBFQonly needs 11.97% VLIW actions to implement compoundactions and 29.09% packet header vector to accommodatemetadata. Furthermore, vBFQ can consume a moderate num-ber of stateful ALUs, which occupies 66.67% of Switch.P4. Asthe resource results are normalized by Switch.P4 which usesfew registers, which makes the stateful ALU consumption ofHyperSight seem high. When compared to the overall switchesresources, the stateful ALU consumption of vBFQ is small. Inthe previous publication [1], we also propose an algorithmthat can significantly reduce the amount of stateful ALUsconsumed by vBFQ. In summary, vBFQ brings acceptableresource overheads to hardware targets and have a smallimpact on the other data plane functions.
Performance overhead. There raises a concern that vBFQcould bring performance overheads. We deploy vBFQ onTofino and SmartNIC and measure the forwarding delay ofECMP with (w/) or without (w/o) vBFQ against packetsof varied sizes. Figure 17 shows the evaluation results. Wepresent not only mean delay but also the 1-99% intervalto show whether vBFQ affects delay jitters. As shown inFigure 17(a), vBFQ introduces a modest delay increase inSmartNIC. For packets of all sizes, the delay increases byabout 2μs. As shown in Figure 17(b), vBFQ introduces dozensof nanoseconds delay increase on Tofino. On both targets,vBFQ has a close-to-zero impact on delay jitter.
Table VIADDITIONAL HARDWARE RESOURCES CONSUMED WITH 16 SOURCE
ROUTING LABELS. THE VALUES ARE NORMALIZED BY THE USAGE OFSWITCH.P4.
Resources Normalized Usage
Match Crossbar 15.53%SRAM 20.48%TCAM 33.33%
Very Long Instruction Word (VLIW) Actions 11.97%Hash Bits 13.54%
Stateful Arithmetic Logical Units (Stateful ALU) 66.67%Packet Header Vector (PHV) 29.09%

12
VIII. CONCLUSION
This paper presents HyperSight , an efficient networkmonitor for packet behavior changes. HyperSight proposesbehavior-level monitoring, which brings a remarkable decreasein monitoring cost with high monitoring coverage. HyperSightpresents a declarative query language to enable convenientexpression of various packet behavior monitoring tasks. Hy-perSight proposes BFQ to empower a powerful capabilityfor monitoring packet behavior changes. HyperSight proposesto virtualize BFQ to implement dynamic monitoring taskswithout disrupting switches. HyperSight supports a wide rangeof network monitoring queries and can monitor over 99%packet behavior changes while reducing overheads by twoorders of magnitude. In our future work, HyperSight willexplore automatically tuning the number of cells per array invBFQ for accuracy guarantee and monitoring network-widepacket behavior changes.
ACKNOWLEDGEMENT
This research is supported by National Key R&D Pro-gram of China (2017YFB0801701) and the National ScienceFoundation of China (No. 61872426, No. 61625203, and No.61832013). Tong Yang is the corresponding author. We thankChen Sun, Zhilong Zheng, Yiran Zhang, Yunsenxiao Lin, andHeng Yu for their insightful suggestions.
REFERENCES
[1] Y. Zhou, J. Bi, T. Yang, K. Gao, C. Zhang, J. Cao, and Y. Wang,“Keysight: Troubleshooting programmable switches via scalable high-coverage behavior tracking,” in Proceedings of ICNP, 2018.
[2] N. Katta, M. Hira, C. Kim, A. Sivaraman, and J. Rexford, “Hula: Scal-able load balancing using programmable data planes,” in Proceedingsof SOSR, 2016.
[3] N. Katta, M. Hira, A. Ghag, C. Kim, I. Keslassy, and J. Rexford, “Clove:How i learned to stop worrying about the core and love the edge,” inProceedings of HotNets, 2016.
[4] L. Chen, J. Lingys, K. Chen, and F. Liu, “Auto: Scaling deep rein-forcement learning for datacenter-scale automatic traffic optimization,”in Proceedings of SIGCOMM, 2018.
[5] T. Benson, A. Anand, A. Akella, and M. Zhang, “Microte: Fine grainedtraffic engineering for data centers,” in Proceedings of CoNEXT, 2011.
[6] M. Al-Fares, S. Radhakrishnan, B. Raghavan, N. Huang, and A. Vah-dat, “Hedera: Dynamic flow scheduling for data center networks,” inProceedings of NSDI, 2010.
[7] Y. Zhu, N. Kang, J. Cao, A. Greenberg, G. Lu, R. Mahajan, D. Maltz,L. Yuan, M. Zhang, B. Y. Zhao, and H. Zheng, “Packet-level telemetryin large datacenter networks,” in Proceedings of SIGCOMM, 2015.
[8] D. Yu, Y. Zhu, B. Arzani, R. Fonseca, T. Zhang, K. Deng, andL. Yuan, “dshark: A general, easy to program and scalable frameworkfor analyzing in-network packet traces,” in Proceedings of NSDI, 2019.
[9] N. Handigol, B. Heller, V. Jeyakumar, D. Mazieres, and N. McKeown,“I know what your packet did last hop: Using packet histories totroubleshoot networks,” in Proceedings of NSDI, 2014.
[10] C. Guo, L. Yuan, D. Xiang, Y. Dang, R. Huang, D. Maltz, Z. Liu,V. Wang, B. Pang et al., “Pingmesh: A large-scale system for datacenter network latency measurement and analysis,” in Proceedings ofSIGCOMM, 2015.
[11] I. Farris, T. Taleb, Y. Khettab, and J. Song, “A survey on emerging sdnand nfv security mechanisms for iot systems,” IEEE CommunicationsSurveys Tutorials, vol. 21, no. 1, 2019.
[12] Y. Geng, S. Liu, Z. Yin, A. Naik, B. Prabhakar, M. Rosenblum,and A. Vahdat, “SIMON: A simple and scalable method for sensing,inference and measurement in data center networks,” in Proceeding ofNSDI, 2019.
[13] M. Moshref, M. Yu, R. Govindan, and A. Vahdat, “Trumpet: Timely andprecise triggers in data centers,” in Proceedings of SIGCOMM, 2016.
[14] J. Rasley, B. Stephens, C. Dixon, E. Rozner, W. Felter, K. Agarwal,J. Carter, and R. Fonseca, “Planck: Millisecond-scale monitoring andcontrol for commodity networks,” in Proceedings of SIGCOMM, 2014.
[15] B. Claise, “Cisco systems netflow services export version 9,” Website,http://www.rfc-editor.org/rfc/rfc3954.txt.
[16] sFlow, “sflow,” Website, https://sflow.org/.[17] J. Suh, T. T. Kwon, C. Dixon, W. Felter, and J. Carter, “Opensample: A
low-latency, sampling-based measurement platform for commodity sdn,”in Proceedings of ICDCS, 2014.
[18] J. Sonchack, A. J. Aviv, E. Keller, and J. M. Smith, “Turboflow:Information Rich Flow Record Generation on Commodity Switches,”in Proceedings of EuroSys, 2018.
[19] J. Sonchack, O. Michel, A. J. Aviv, E. Keller, and J. M. Smith, “Scalinghardware accelerated network monitoring to concurrent and dynamicqueries with *flow,” in Proceedings of ATC, 2018.
[20] Y. Li et al., “Lossradar: Fast detection of lost packets in data centernetworks,” in Proceedings of CoNEXT, 2016.
[21] Y. Li, R. Miao, C. Kim, and M. Yu, “Flowradar: A better netflow fordata centers,” in Proceedings of NSDI, 2016.
[22] T. Yang, J. Jiang, P. Liu, Q. Huang, J. Gong, Y. Zhou, R. Miao,X. Li, and S. Uhlig, “Elastic sketch: Adaptive and fast network-widemeasurements,” in Proceedings of SIGCOMM, 2018.
[23] Q. Huang, P. P. C. Lee, and Y. Bao, “Sketchlearn: Relieving user burdensin approximate measurement with automated statistical inference,” inProceedings of SIGCOMM, 2018.
[24] M. Yu, L. Jose, and R. Miao, “Software defined traffic measurementwith opensketch,” in Proceedings of NSDI, 2013.
[25] P. Bosshart, G. Gibb, H.-S. Kim, G. Varghese, N. McKeown, M. Iz-zard, F. Mujica, and M. Horowitz, “Forwarding metamorphosis: Fastprogrammable match-action processing in hardware for sdn,” in Pro-ceedings of SIGCOMM, 2013.
[26] P. Bosshart, D. Daly, G. Gibb, M. Izzard, N. McKeown, J. Rexford,C. Schlesinger, D. Talayco, A. Vahdat, G. Varghese, and D. Walker,“P4: Programming protocol-independent packet processors,” SIGCOMMCCR, vol. 44, no. 3, Jul. 2014.
[27] Barefoot Networks, “Barefoot tofino switch,” Website, https://barefootnetworks.com/technology/.
[28] C. Zhang, J. Bi, Y. Zhou, A. Basit, and J. Wu, “Hyperv: A highperformance hypervisor for virtualization of the programmable dataplane,” in Proceedings of ICCCN, 2017.
[29] D. Hancock and J. van der Merwe, “Hyper4: Using p4 to virtualize theprogrammable data plane,” in Proceedings of CoNEXT, 2016.
[30] Netronome, “Netronome flow processor,” Website, https://netronome.com/product/nfp-6xxx/.
[31] “The code of keysight,” Website, https://github.com/KeySight-P4.[32] V. Sivaraman, S. Narayana, O. Rottenstreich, S. Muthukrishnan, and
J. Rexford, “Heavy-hitter detection entirely in the data plane,” inProceedings of SOSR, 2017.
[33] Z. Liu, A. Manousis, G. Vorsanger, V. Sekar, and V. Braverman, “Onesketch to rule them all: Rethinking network flow monitoring withunivmon,” in Proceedings of SIGCOMM, 2016.
[34] A. Gupta, R. Harrison, A. Pawar, R. Birkner, M. Canini, N. Feamster,J. Rexford, and W. Willinger, “Sonata: Query-driven streaming networktelemetry,” in Proceedings of SIGCOMM, 2018.
[35] S. Narayana, A. Sivaraman, V. Nathan, P. Goyal, V. Arun, M. Alizadeh,V. Jeyakumar, and C. Kim, “Language-directed hardware design fornetwork performance monitoring,” in Proceedings of SIGCOMM, 2017.
[36] P4 Language Consortium, “P4 runtime,” Website, https://github.com/p4lang/PI.
[37] The Apache Software Foundation, “Flink: Stateful computations overdata streams,” Website, https://flink.apache.org.
[38] Barefoot Networks, “The world’s fastest & most programmable net-works,” Website, https://goo.gl/1mtjpf.
[39] F. Deng and D. Rafiei, “Approximately detecting duplicates for stream-ing data using stable bloom filters,” in Proceedings of SIGMOD, 2006.
[40] S. K. Bera, S. Dutta, A. Narang, and S. Bhattacherjee, “Advanced bloomfilter based algorithms for efficient approximate data de-duplication instreams,” CoRR, 2012.
[41] C. Zhang, J. Bi, Y. Zhou, A. B. Dogar, and J. Wu, “Mpvisor: A modularprogrammable data plane hypervisor,” in Proceedings of SOSR, 2017.
[42] T. Benson, A. Akella, and D. A. Maltz, “Network traffic characteristicsof data centers in the wild,” in Proceedings of IMC, 2010.
[43] WIDE Project, “Mawi working group traffic archive,” Website, http://mawi.wide.ad.jp/mawi/.
[44] V. Paxson, “Empirically derived analytic models of wide-area tcpconnections,” IEEE/ACM Trans. Netw., vol. 2, no. 4, p. 316–336, Aug.1994. [Online]. Available: https://doi.org/10.1109/90.330413