hypergol maintenance facility … and the rental system was removed from the site; however, all...
TRANSCRIPT

HYPERGOL MAINTENANCE FACILITYHAZARDOUS WASTE SOUTH STAGING AREAS, SWMU 070
CORRECTIVE MEASURES IMPLEMENTATIONANNUAL REPORT, YEAR 10
KENNEDY SPACE CENTER, FLORIDA
Prepared for:
National Aeronautics and Space AdministrationKennedy Space Center, Florida
January 2016Revision 0
Prepared by:
Tetra Tech, Inc.661 Andersen Drive
Pittsburgh, PA 15220(412) 921-7090
https://ntrs.nasa.gov/search.jsp?R=20160001193 2019-05-13T03:04:19+00:00Z

CORRECTIVE MEASURES IMPLEMENTATIONANNUAL REPORT, YEAR 10
FOR THEHYPERGOL MAINTENANCE FACILITY
HAZARDOUS WASTE SOUTH STAGING AREASSWMU 070
AT THEJOHN F. KENNEDY SPACE CENTER, FLORIDA
Revision 0
Prepared for:Environmental Assurance Branch
National Aeronautics and Space AdministrationJohn F. Kennedy Space Center
Kennedy Space Center, Florida 32899
Prepared by:Tetra Tech, Inc.
661 Andersen DrivePittsburgh, PA 15220
(412) 921-7090
Prepared by:Ralinda R. MillerTetra Tech, Inc.
Approved by:Mark P. Speranza, P.E.Tetra Tech, Inc.
January 2016
This report was prepared in accordance with sound professional practices. The figures, tables,and text have been reviewed and certified by a Professional Engineer registered in the State ofFlorida.
Robert F. Simcik, P.E.Professional Engineer No. 61263Engineering Business License No. 2429

HMF AGWMR Yr 10 Revision 0
January 2016
iii
PREFACE
This document presents the Corrective Measures Implementation (CMI) Year 10 Annual Report
for implementation of corrective measures at the Hypergol Maintenance Facility (HMF)
Hazardous Waste South Staging Areas at Kennedy Space Center, Florida. The work is being
performed by Tetra Tech, Inc., for the National Aeronautics and Space Administration (NASA)
under Indefinite Delivery Indefinite Quantity (IDIQ) NNK12CA15B, Task Order (TO) 07. Mr.
Harry Plaza, P.E., of NASA’s Environmental Assurance Branch is the Remediation Project
Manager for John F. Kennedy Space Center. The Tetra Tech Program Manager is Mr. Mark
Speranza, P.E., and the Tetra Tech Project Manager is Robert Simcik, P.E.
Approved:
Robert F. Simcik, P.E. Project Manager Tetra Tech, Inc.
HMF AGWMR Yr 10 Revision 0 January 2016
v
TABLE OF CONTENTS
Section Title Page
PREFACE ..................................................................................................................................... iii ACRONYMS AND ABBREVIATIONS ................................................................................... vii 1 INTRODUCTION.......................................................................................................... 1-1 1.1 OVERVIEW ..................................................................................................... 1-1 1.2 PURPOSE ........................................................................................................ 1-1 1.3 CORRECTIVE MEASURES OBJECTIVE .................................................... 1-2 1.4 SYSTEM OVERVIEW .................................................................................... 1-2 1.5 CMI ANNUAL REPORT ORGANIZATION ................................................. 1-4 2 GROUNDWATER MONITORING ............................................................................ 2-1 2.1 GROUNDWATER SAMPLING ..................................................................... 2-1 2.1.1 ONE HUNDRED-ELEVENTH MONTH GROUNDWATER SAMPLING
RESULTS ......................................................................................................... 2-2 2.1.2 ONE HUNDRED-FOURTEENTH MONTH GROUNDWATER SAMPLING
RESULTS ......................................................................................................... 2-3 2.1.3 ONE HUNDRED-SEVENTEENTH MONTH GROUNDWATER SAMPLING
RESULTS ......................................................................................................... 2-3 2.1.4 ONE HUNDRED-TWENTIETH MONTH GROUNDWATER SAMPLING
RESULTS ......................................................................................................... 2-4 2.2 GROUNDWATER SAMPLING SUMMARY ................................................ 2-4 3 OBSERVATIONS AND RECOMMENDATIONS .................................................... 3-1 4 REFERENCES ............................................................................................................... 4-1

HMF AGWMR Yr 10 Revision 0 January 2016
vi
LIST OF TABLES Table Title Page 1-1 Site-Specific Cleanup Levels for the HMF ...................................................................... 1-5 2-1 Groundwater TCFM Data Summary by Sampling Event ................................................ 2-7 2-2 Groundwater Data Summary by Monitoring Well ......................................................... 2-15 2-3 Groundwater Elevation Data – October 29, 2015 .......................................................... 2-25
LIST OF FIGURES Figure Title Page 2-1 Groundwater TCFM Results Summary ......................................................................... 2-27 2-2 TCFM Concentrations Versus Time .............................................................................. 2-29 2-3 Year 10 Annual Groundwater TCFM Results Summary ............................................... 2-31 2-4 Year 10 TCFM Concentrations Versus Time ................................................................ 2-33 2-5 Potentiometric Surface Map – October 2015 ................................................................. 2-35 3-1 Long-Term Monitoring Well Location Map ...................................................................... 3-
LIST OF APPENDICES APPENDIX A MEETING MINUTES APPENDIX B FIELD LOGBOOK APPENDIX C GROUNDWATER CHAIN-OF-CUSTODY FORMS AND SAMPLE LOG
SHEETS APPENDIX D ANALYTICAL RESULTS
HMF AGWMR Yr 10 Revision 0
January 2016
vii
ACRONYMS AND ABBREVIATIONS
AGWMR Annual Groundwater Monitoring Report
bls below land surface
CM Corrective Measures
CMI Corrective Measures Implementation
CMO Corrective Measures Objective
DPT direct-push technology
FDEP Florida Department of Environmental Protection
GCTL Groundwater Cleanup Target Level
HMF Hypergol Maintenance Facility
IDIQ Indefinite Delivery Indefinite Quantity
KSC Kennedy Space Center
KSCRT Kennedy Space Center Remediation Team
MNA monitored natural attenuation
MNA-DV Monitored Natural Attenuation Default Value
NASA National Aeronautics and Space Administration
NFA no further action
RCRA Resource Conservation and Recovery Act
SAP Sampling and Analysis Plan
SCTL Soil Cleanup Target Level
TCFM trichlorofluoromethane
TO Task Order
µg/L microgram per liter
VC vinyl chloride
VOC volatile organic compound

HMF AGWMR Yr 10 Revision 0
January 2016
1-1
SECTION 1
INTRODUCTION
1.1 OVERVIEW
This Corrective Measures Implementation (CMI) Year 10 Annual Groundwater Monitoring
Report (AGWMR) for the Hypergol Maintenance Facility (HMF) Hazardous Waste South
Staging Areas was prepared by Tetra Tech, Inc., for the National Aeronautics and Space
Administration (NASA) under Indefinite Delivery Indefinite Quantity (IDIQ) NNK12CA15B,
Task Order (TO) 07. This CMI Report has been prepared as part of the Resource Conservation
and Recovery Act (RCRA) corrective action program being implemented at Kennedy Space
Center (KSC).
1.2 PURPOSE
The purpose of this CMI Year 10 AGWMR is to present the actions taken and results obtained
during the tenth year of implementation of Corrective Measures (CM) at HMF. Groundwater
monitoring activities detailed in this Year 10 report were conducted in accordance with the CMI
Work Plan (Tetra Tech, 2005a) and CMI Site-Specific Safety and Health Plan (Tetra Tech,
2005b) and include quarterly performance monitoring events in December 2014 and March,
June, and September 2015. The air sparging system was not operational during this monitoring
period.
The results of the first 6 months of CMI (including air sparging system installation) and the first
6 months of system operation were presented in the CMI Construction Completion and Semi-
Annual HMF Hazardous Waste South Staging Areas Report (Tetra Tech, 2006a), and the results
of the second 6 months of the first year of CMI were presented in the CMI Annual Report (Tetra
Tech, 2006b). The results for the second year of CMI were presented in the System Expansion
Construction Completion and Second Annual Report (Tetra Tech, 2007a and 2007b), and results
of the third through ninth years of CMI were presented in the Years 3 through 9 Annual Reports
(Tetra Tech, 2008; 2009; 2010; 2011; 2013; 2014; and 2015).

HMF AGWMR Yr 10 Revision 0 January 2016
1-2
1.3 CORRECTIVE MEASURES OBJECTIVE
The objective of the CM at HMF is to reduce concentrations of contaminants of concern
(trichlorofluoromethane [TCFM], vinyl chloride [VC], and aluminum) in groundwater at the site
to less than the Florida Department of Environmental Protection (FDEP) Groundwater Cleanup
Target Levels (GCTLs) for TCFM and VC or to the upper range of the KSC background values
for aluminum (see Table 1-1). Air sparging was recommended and approved for remediation of
the TCFM plume, which is defined as areas with concentrations of TCFM in excess of the GCTL
(2,100 micrograms per liter [µg/L]) and Monitored Natural Attenuation (MNA) Default Value
(MNA-DV) (21,000 µg/L). MNA was selected as the presumptive remedy for monitoring
aluminum and VC exceedances of applicable Corrective Measures Objectives (CMOs) (see Table
1-1). Based on reductions in concentrations to less than CMOs, no further action (NFA) was
approved for VC and aluminum in October 2010 and September 2006, respectively.
1.4 SYSTEM OVERVIEW
Air sparging system operation began in September 2005, and after 1 month of operation, TCFM
concentrations had been reduced by 87.2 percent (approximately 173 pounds of TCFM
removed). Free product was observed during the fourth month of system operation. Because
TCFM concentrations in monitoring well HMF-MW5I had not decreased to less than the MNA-
DV and appeared to be stagnant, additional investigation in this area was recommended. An
additional direct-push technology (DPT) investigation was conducted in October 2006 to
determine whether residual soil contamination existed in the area of HMF-MW5I, to refine the
understanding of lithologic conditions in the area, and to attempt to delineate the extent of TCFM
groundwater contamination in the area. Results of the DPT investigation indicated that TCFM in
groundwater was contained within the existing system treatment area, and no free product was
observed. Maximum residual TCFM concentrations were located between wells HMF-MW5I
and NLP-IW4I. TCFM concentrations in soil were less than the FDEP residential Soil Cleanup
Target Level (SCTL), but maximum concentrations, detected near HMF-MW5I at 36 to 40 feet
below land surface (bls), exceeded the SCTL based on leachability to groundwater. Based on the
delineation efforts during the DPT investigation, it was decided that additional shallow air

HMF AGWMR Yr 10 Revision 0
January 2016
1-3
sparging wells would be installed in the area around HMF-MW5I above a low-permeability
lithologic layer that was thought to possibly be impacting the effectiveness of the original
sparging wells in this area.
The first system expansion was completed in March 2007 and included installation of six
additional sparging wells to address contamination in the HMF-MW5I area. From March 2008
to August 2010, the system was operated as needed when rebounding occurred to attempt to
reduce TCFM concentrations to less than the GCTL. The system expansion efforts were very
successful. TCFM concentrations in all monitoring wells have been less than the MNA-DV
since March 2010. A significant system failure occurred in August 2010, air sparging operations
ceased, and the rental system was removed from the site; however, all system wells and the
piping network remained in place for future use if needed. In March 2011, TCFM
concentrations in all wells were less than the GCTL for the first time without the system
operating to reduce concentrations, although concentrations rebounded in June 2011, and the
TCFM concentration in NLP-IW41 again exceeded the GCTL. In October 2011, the KSC
Remediation Team (KSCRT) reached consensus to expand the system to address residual
contamination in the area of NLP-IW4I (Meeting Minute 1110-M05, Decision 1110-D24; see
Appendix A). System expansion activities were completed in 2012, and the modified system
with new sparging wells in the NLP-IW4I area operated from October 2012 to March 2013.
TCFM concentrations during the December 2012 and March 2013 quarterly events were less
than the GCTL in all wells sampled, and based on these results, the system was not restarted
after it was shut down on March 25, 2013, for the March sampling event. Because TCFM
concentrations increased to greater than the GCTL at NLP-IW4I during the September and
December 2013 events, KSCRT consensus was reached at the February 2014 meeting to restart
the system with modified operating parameters and operate it for 5 months to evaluate potential
rebound (Meeting Minute 1402-M12, Decision 1402-D43). The modified system began
operations on February 19, 2014, operated for approximately 5 months until July 1, 2014, and
has remained off since that time. Based on rebounding TCFM concentrations at HMF-MW5I
(exceeding the GCTL in July and September 2014) and at NLP-IW4I (exceeding the GCTL in

HMF AGWMR Yr 10 Revision 0 January 2016
1-4
September 2014), consensus was reached at the November 2014 KSCRT Meeting to conduct an
additional year of quarterly monitoring (Meeting Minute 1411-M6, Decision 1411-D17). It was
decided that if concentrations continued to exceed the GCTL, a long-term monitoring plan for
continued sampling would be developed, and if concentrations decreased to less than the GCTL,
the required sampling period for a no further action (NFA) proposal would be determined. 1.5 CMI ANNUAL REPORT ORGANIZATION
Section 1: Introduction – This section provides a brief overview of the report and discusses the
purpose and objective of the report.
Section 2: Groundwater Monitoring – This section presents the results of the groundwater
sampling events conducted during the reporting period and compares these results to previous
sampling results.
Section 3: Observations and Recommendations – This section presents observations regarding
the current status of the CMI and provides recommendations regarding the CMI.
Section 4: References – This section provides a listing of the references cited in or applicable to
this report.

HMF AGWMR Yr 10 Revision 0
January 2016
1-5
Table 1-1. Site-Specific Cleanup Levels for the HMF
Contaminant of Concern GCTL (µg/L)
MNA-DV (µg/L)
CMO (µg/L)
Trichlorofluoromethane 2,100 21,000 2,100 Vinyl chloride 1 100 1 Aluminum 200 2,000 1,300(1)
GCTL – Groundwater Cleanup Target Level (Table 1, Chapter 62-777, Florida Administrative
Code). MNA-DV – Monitored Natural Attenuation Default Value. CMO – Corrective Measures Objective. µg/L – Micrograms per liter. 1 CMO represents the upper range of the Kennedy Space Center background values for
aluminum.

HMF AGWMR Yr 10 Revision 0 January 2016
2-1
SECTION 2
GROUNDWATER MONITORING
This section presents the results of Year 10 groundwater sampling.
2.1 GROUNDWATER SAMPLING
Groundwater sampling was conducted in accordance with the Project-Specific Sampling and
Analysis Plan (SAP) submitted with the CMI Work Plan (Tetra Tech, 2005a). The SAP initially
identified that groundwater from eight wells would be collected and analyzed for volatile organic
compounds (VOCs) by SW-846 Method 8260B. Two additional wells (HMF-MW8I and HMF-
MW9I) were installed and included in the original monthly monitoring well program. One well
(NLP-IW2I) was not functioning; therefore, it was not sampled until it was replaced on January
23, 2007, prior to the seventeenth monthly groundwater sampling event. Three wells (M71410-
IW1S, M71411-IW1I, and NLP-IW1D) were to be sampled in conjunction with the MNA semi-
annual and annual sampling program; however, because aluminum and VC analyses are no
longer required, monitoring wells M71410-IW1S and M71411-IW1I were eliminated from the
sampling program. Based on consensus reached during the KSCRT Meeting on October 27,
2010, Year 6 groundwater monitoring included quarterly sampling of three source area wells
(NLP-IW1I, NLP-IW4I, and HMF-MW5I) and the shallow well (NLP-IW1S) in December 2010
and March and June 2011 and sampling of these four wells and four perimeter wells (HMF-MW-
6I through HMF-MW-9I) and the deep well (NLP-IW1D) during the September 2011 annual
event. During the seventh year of groundwater monitoring, quarterly sampling was conducted in
December 2011, March 2012, June 2012 (which also served as the baseline sampling event prior
to startup of the modified air sparging system), and December 2012. In November 2012 after 1
month of operation of the modified system, NLP-IW4I only was sampled. Quarterly events
included sampling of four wells, three source area wells (NLP-IW1I, NLP-IW4I, and HMF-
MW5I) and the shallow well (NLP-IW1S). During Year 8, quarterly events in March, June, and
December 2013 included sampling of four wells, three source area wells (NLP-IW1I, NLP-IW4I,

HMF AGWMR Yr 10 Revision 0 January 2016
2-2
and HMF-MW5I) and the shallow well (NLP-IW1S), and the September 2013 annual event
included sampling of the three source area wells (NLP-IW1I, NLP-IW4I, and HMF-MW5I),
shallow well NLP-IW1S, four perimeter wells (HMF-MW-6I through HMF-MW-9I), and deep
well NLP-IW1D. During Year 9, a pre-startup sampling event was conducted in February prior
to the start of modified system operations (only NLP-IW4I was sampled), and subsequent
quarterly events were conducted in March, July, and September 2014. During Year 10, quarterly
sampling events were conducted in December 2014 and March, June, and September 2015.
Year 10 groundwater samples were collected in accordance with the SAP and analyzed for
TCFM by Accutest Laboratories in Orlando, Florida, according to the subcontract specifications.
The TCFM results are summarized by event in Table 2-1 and by monitoring well in Table 2-2.
Figure 2-1 provides a summary of TCFM results for Years 8 through 10 events, including all
events since shutdown of the system in March 2013 and since the latest period of operation,
February 2014 to July 2014. Figure 2-2 provides a graph of the analytical TCFM results from
the source wells for the monitoring program beginning with the original baseline sampling event
(September 2005), Figure 2-3 provides a summary of the TCFM results from this reporting
period, and Figure 2-4 provides a graph of these results for the wells monitored quarterly.
Copies of field logbook entries for Year 10 activities are provided in Appendix B, and copies of
groundwater chain-of-custody forms, sample log sheets, and laboratory analytical data for the
Year 10 events are provided in Appendix C.
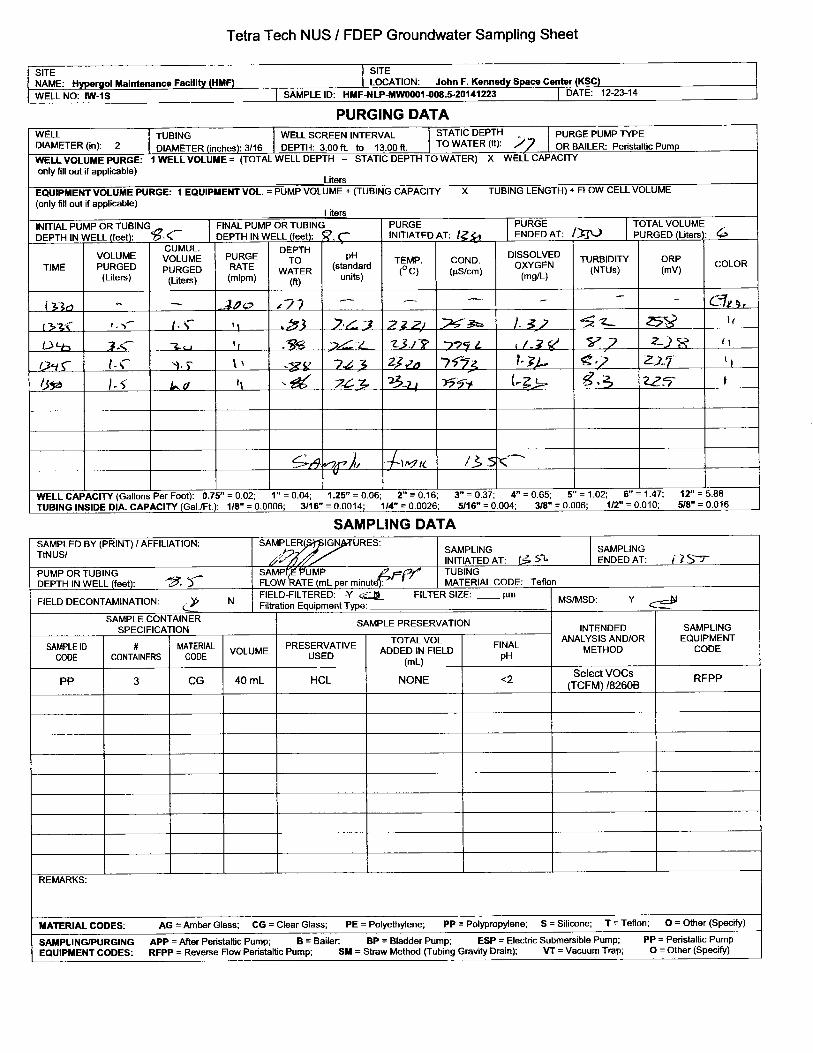
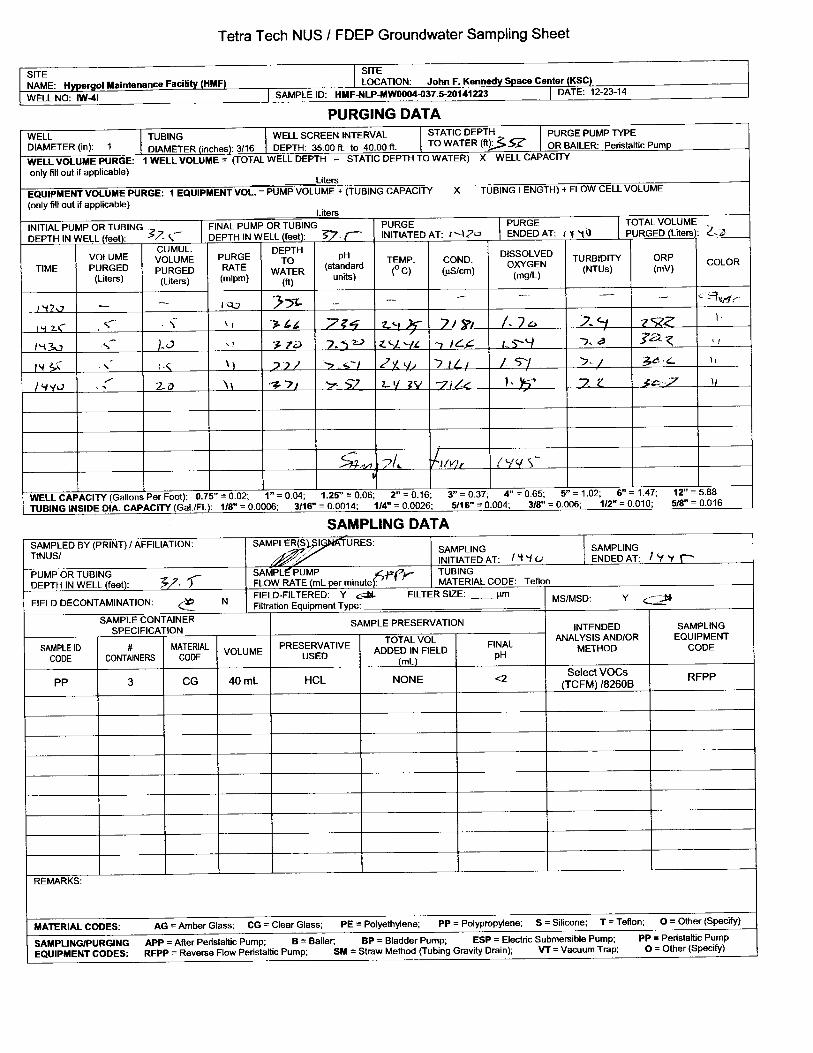
2.1.1 ONE HUNDRED-ELEVENTH MONTH GROUNDWATER SAMPLING
RESULTS. The groundwater sampling event for the 111th month of the monitoring program
was conducted on December 23, 2014, and included sampling of three source area wells, NLP-
IW1I, NLP-IW4I, and HMF-MW5I, and shallow well NLP-IW1S. The air sparging system had
been off line for 5 months before the December 2014 event. All TCFM concentrations during
this event were less than the GCTL. As shown in Table 2-1, the TCFM concentration at source
well NLP-IW4I decreased in December 2014 to 75.1 µg/L, less than the GCTL, from 3,370 µg/L
during the previous event in September 2014. The concentration at HMF-MW5I also decreased

HMF AGWMR Yr 10 Revision 0 January 2016
2-3
to less than the GCTL, from 2,130 µg/L during the previous event to 506 µg/L in December
2014. The TCFM concentration at NLP-IW1S decreased from 132 µg/L in September 2014 to
54.9 µg/L in December 2014, and TCFM was not detected at NLP-IW1I in December 2014. As
a result of the significant decreases in concentrations at NLP-IW4I and HMF-MW5I, the overall
source area average TCFM concentration for this round was 194 µg/L, significantly less than
during the 108th month event (1,834 µg/L), as shown in Table 2-1.
2.1.2 ONE HUNDRED-FOURTEENTH MONTH GROUNDWATER SAMPLING
RESULTS. The groundwater sampling event for the 114th month of the monitoring program
was conducted on March 31, 2015, and included the same four wells as were sampled the 111th
month event. The TCFM concentration at NLP-IW4I was greater than the GCTL during this
event; TCFM concentrations at the other three wells sampled were less than the GCTL. As
shown in Table 2-1, the concentration of TCFM at source well NLP-IW4I increased from 75.1
µg/L during the December 2014 event to 3,910 µg/L in March 2015. March 2015 concentrations
at NLP-IW1S, NLP-IW1I, and HMF-MW5I were generally consistent with December 2014
levels. As a result of the significant increase in concentrations at NLP-IW4I, the overall source
area average TCFM concentration for this round was 1,467 µg/L, a significant increase from the
average during the 111th month event (194 µg/L), as shown in Table 2-1.
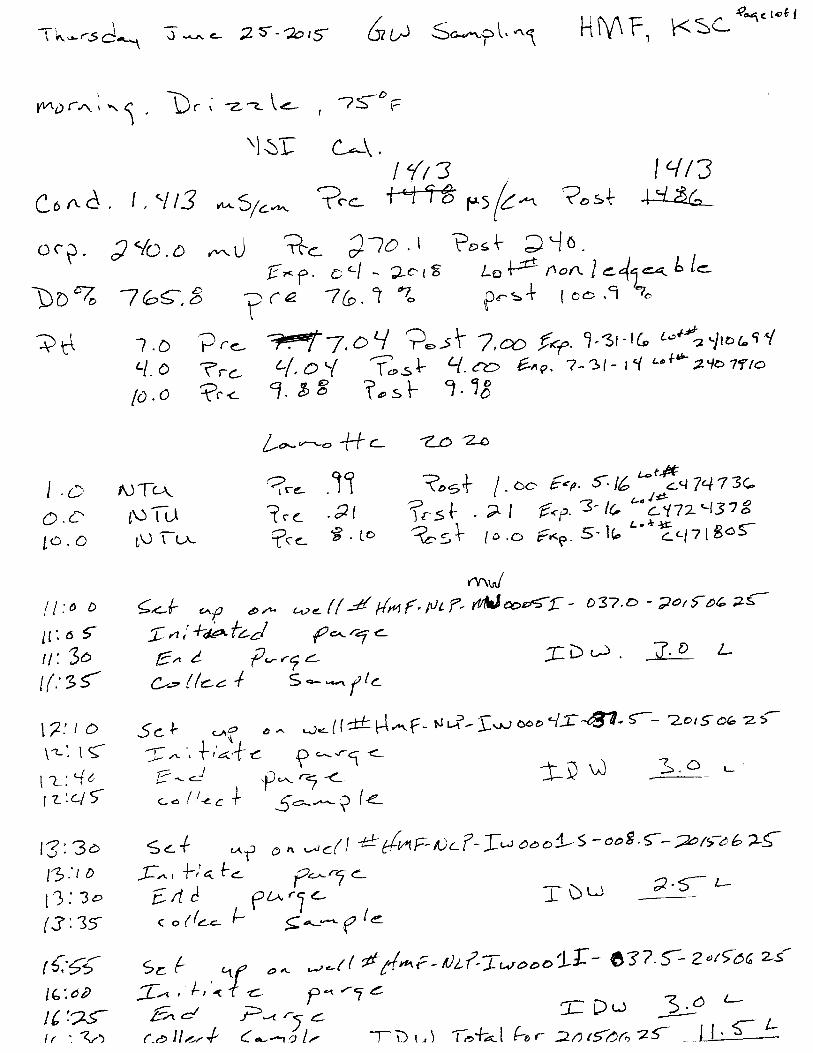
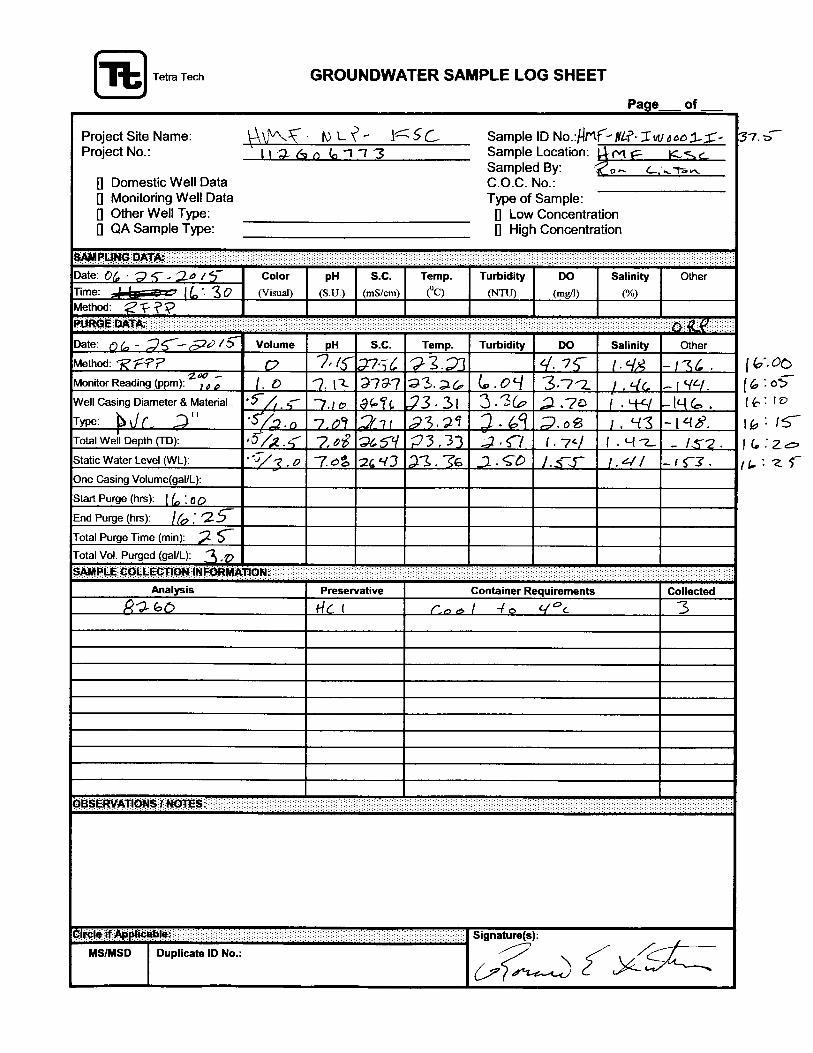
2.1.3 ONE HUNDRED-SEVENTEENTH MONTH GROUNDWATER SAMPLING
RESULTS. The groundwater sampling event for the 117th month of the monitoring program
was conducted on June 25, 2015, and included the same four wells as for the 111th and 114th
month events. Similar to March 2015 results, the TCFM concentration at NLP-IW41 exceeded
the GCTL, and concentrations at the other wells sampled were less than the GCTL. The TCFM
concentration increased at NLP-IW4I from 3,910 µg/L in March 2015 to 4,670 µg/L in June
2015. Compared to the previous round, TCFM concentrations decreased slightly at HMF-
MW5I, from 489 to 337 µg/L in June 2015, and at NLP-IW1I, from 2.3 to 0.86 µg/L, and
increased slightly at NLP-IW1S, from 81.4 to 117 µg/L. As a result of the increase in TCFM

HMF AGWMR Yr 10 Revision 0 January 2016
2-4
concentrations at NLP-IW4I, the overall source area average TCFM concentration increased to
1,669 µg/L in June 2015 from 1,467 µg/L during the previous event.
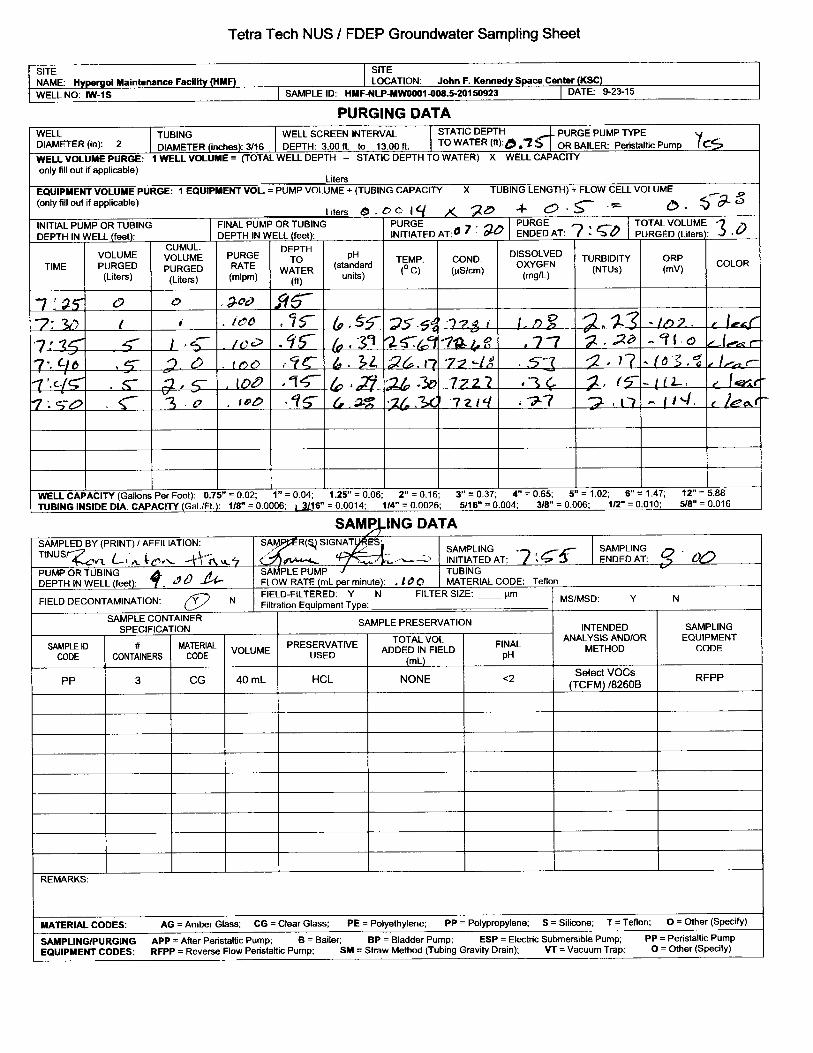
2.1.4 ONE HUNDRED-TWENTIETH MONTH GROUNDWATER SAMPLING
RESULTS. Nine monitoring wells were sampled during the 120th month annual groundwater
sampling event on September 23, 2015, including the four wells sampled during the three
previous events, deep well NLP-IW1D, and perimeter wells HMF-MW-6I, HMF-MW-7I, HMF-
MW-8I, and HMF-MW-9I. TCFM was detected at source area wells NLP-IW1I, NLP-IW-4I,
and HMF-MW5I only, and only the concentration at NLP-IW4I exceeded the GCTL. At NLP-
IW4I, the concentration of TCFM increased from 4,670 µg/L during the June 2015 event to
5,410 µg/L in September 2015. TCFM concentrations increased at HMF-MW5I, from 337 to
568 µg/L, and decreased at NLP-IW1S, from 117 to 52 µg/L, and NLP-IW1I, from 0.86 µg/L to
less than the detection limit. At HMF-MW6I, HMF-MW8I, and HMF-MW9I, TCFM
concentrations decreased to less than detection limits from the September 2014 to September
2015 events; TCFM was not detected at HMF-MW7I during the September 2014 or 2015 event.
At deep well NLP-IW1D, the TCFM concentration decreased from 10.3 µg/L in September 2014
to 3.1 µg/L in September 2015. The overall source area average TCFM concentration increased
this round to 1,993 µg/L as a result of the increased concentration at NLP-IW4I.
2.2 GROUNDWATER SAMPLING SUMMARY
The existing groundwater monitoring well network at the site consists of source area wells
(subjected to direct treatment during system operation), perimeter monitoring wells, and one
deep well to evaluate potential vertical migration. During the tenth year of groundwater
monitoring, the three source area wells (NLP-IW1I, NLP-IW4I, and HMF-MW5I) and the
shallow well (NLP-IW1S) were sampled during the December 2014 and March and June 2015
quarterly events, and these four wells in addition to four perimeter wells (HMF-MW6I through
HMF-MW9I) and deep well (NLP-IW1D) were sampled during the September 2015 annual
event. The air sparging system was turned off in July 2014 and has not been restarted. TCFM
concentrations decreased to less than the GCTL in all wells during the December 2014 event, but

HMF AGWMR Yr 10 Revision 0 January 2016
2-5
during subsequent events, concentrations at NLP-IW4I exceeded the GCTL of 2,100 µg/L. At
HMF-MW5I, concentrations ranged from 337 to 568 µg/L during the tenth year of monitoring,
and at the third source area well, NLP-IW1I, TCFM was detected during two of the four events
at concentrations less than 2.5 µg/L. Concentrations of TCFM at the shallow well fluctuated
from 52 to 117 µg/L during the tenth year of monitoring. TCFM was not detected at any of the
four perimeter wells sampled during the September 2015 annual event. TCFM was detected in
the deep well during the September 2015 event but at a concentration (3.1 µg/L) significantly
less than the GCTL.
On October 29, 2015, groundwater elevations were measured in intermediate zone monitoring
wells to determine the current groundwater flow conditions and to ensure that a monitoring point
downgradient of the source area was present. Groundwater elevations are shown in Table 2-3,
and a potentiometric surface map is shown as Figure 2-5. Groundwater elevations are not
presented for perimeter intermediate wells HMF-MW8I and HMF-MW9I because no top of well
casing elevation survey data exist for these wells. Groundwater flow in the intermediate zone
was determined to be to the south/southeast, which is generally consistent with previous
groundwater flow directions identified at this site.

Monitoring Well
Baseline Prior to System Startup
(Sept-05)
FirstMonth
(Oct-05)
SecondMonth
(Nov-05)
ThirdMonth
(Dec-05)
FourthMonth
(Jan-06) (1)
FifthMonth
(Feb-06)
SixthMonth
(Mar-06)
SeventhMonth
(Apr-06)
EighthMonth
(May-06)
HMF-MW5I 49,200 36,200 2,660 60,600 71,700 51,000 51,900 8,240 25,800HMF-MW6I 2 41.7 3.4 15.1 17.5 9.8 5 2.3 0.7HMF-MW7I 0.5 6.3 37.1 10.7 11.4 20.5 17.3 28 2.3HMF-MW8I NS NS NS NS 0.56 9.2 5 4.7 4.7HMF-MW9I NS NS NS NS 4.7 0.69 3.2 5.3 10.5NLP-IW2I 3,080 3,710 NS NS NS NS NS NS NSNLP-IW1I 400,000 48,400 3,660 9,190 184,000 34,600 1,520 3,950 2,320NLP-IW1S 0.5 721 57 9.3 15.8 37 36.2 25.2 8.8NLP-IW4I 396,000 23,500 21,200 54,700 49,700 9,230 27,200 34,800 2,380NLP-IW3I ND at 200 U 0.50 U 24.5 10.6 0.54 0.5 0.5 1.8 1
Source wells are: NLP-IW1I, NLP-IW4I, HMF-MW5I Source well average concentration (µg/L) 281,733 36,033 9,173 41,497 101,800 31,610 26,873 15,663 10,167 Source area remaining soluble mass (lbs) 198.43 25.38 6.46 29.23 71.70 22.26 18.93 11.03 7.16 Source area removal from baseline (%) NA 87.21 96.74 85.27 63.87 88.78 90.46 94.44 96.39
Table 2-1. Groundwater TCFM Data Summary by Sampling Event

Monitoring WellNinth Month
(June-06)
Tenth Month
(July-06)
Eleventh Month
(Aug-06)
Twelfth Month
(Sept-06)
Thirteenth Month
(Oct-06)
Fourteenth Month
(Nov-06)
Fifteenth Month
(Dec-06)
Sixteenth Month
(Jan-07)
Seventeenth Month
(Feb-07)
HMF-MW5I 87,900 75,700 42,800 34,800 18,600 89,500 51,500 81,200 78,100HMF-MW6I 0.5 0.5 0.5 2.7 2.7 2.7 1.6 0.5 0.5HMF-MW7I 2 51.2 0.5 2.3 2.3 2.3 0.5 0.5 0.5HMF-MW8I 0.5 0.5 0.5 0.5 0.5 0.73 0.84 4.4 0.5HMF-MW9I 31.5 40.6 1.6 0.5 94.3 0.78 3.8 0.51 0.5NLP-IW2I NS NS NS NS NS NS NS NS 0.5NLP-IW1I 4,180 15,700 9,380 8,790 3,930 14,900 4,260 14,800 12,400NLP-IW1S 3.4 14 384 701 2,280 4,000 2,010 8,780 15,300NLP-IW4I 17,000 40,600 6,370 48,900 25,700 21,400 12,500 45,800 65,300NLP-IW3I 0.5 14.9 0.5 0.87 I 11.2 19.8 0.5 0.5 0.5
Source wells are: NLP-IW1I, NLP-IW4I, HMF-MW5I Source well average concentration (µg/L) 36,360 44,000 19,517 30,830 16,077 41,933 22,753 47,267 51,933 Source area remaining soluble mass (lbs) 25.61 30.99 13.75 21.71 11.32 29.53 16.03 33.29 36.58 Source area removal from baseline (%) 87.09 84.38 93.07 89.06 94.29 85.12 91.92 83.22 81.57
Table 2-1. Groundwater TCFM Data Summary by Sampling Event (continued)

Monitoring WellEighteenth
Month(Mar-07)
Nineteenth Month
(Apr-07)
Twentieth Month
(May-07)
Twenty-First Month
(June-07)
Twenty-Second Month
(July-07)
Twenty-Third Month
(Aug-07)
Twenty-Fourth Month
(Sept-07)
Twenty-Sixth
Month(Nov-07)
Twenty-Eighth Month
(Jan-08)
HMF-MW5I 40,900 15,000 6,310 4,290 2,420 826 2,900 698 547HMF-MW6I 0.5 4 5.8 0.5 69.7 2.1 2.6 2.2 2.1HMF-MW7I 40.3 2.6 2.9 0.5 7.1 4.2 6.1 4.8 4.3HMF-MW8I 5.3 2.5 5.5 0.68 68.5 0.51 0.43 U 0.43 U 0.81HMF-MW9I 3.8 2 5 0.92 117 1.7 1.9 I 3.2 1.2NLP-IW2I 16 U 4.2 14.1 0.8 I 0.43 U 21.5 22.4 0.43 U 23.6NLP-IW1I 11,200 L 7,590 447 8,090 13,100 5,330 2,970 4,550 1,140NLP-IW1S 7,430 7,540 3,890 3,830 9,640 4,320 2,870 463 217NLP-IW4I 36,200 8,180 583 19,500 67,000 13,000 24,000 4,590 2,580NLP-IW3I 0.5 14.7 0.5 0.5 13,600 0.43 57.10 0.43 U 0.43 U
Source wells are: NLP-IW1I, NLP-IW4I, HMF-MW5I Source well average concentration (µg/L) 38,550 10,257 2,447 10,627 27,507 6,385 9,957 3,279 1,422 Source area remaining soluble mass (lbs) 27.15 7.22 1.72 7.48 19.37 4.50 7.01 2.31 1.00 Source area removal from baseline (%) 86.32 96.36 99.13 96.23 90.24 97.73 96.47 98.84 99.50
Table 2-1. Groundwater TCFM Data Summary by Sampling Event (continued)

Monitoring WellThirtieth Month
(Mar-08)
Thirty-Second Month
(May-08)
Thirty-Fourth Month
(July-08)
Thirty-Sixth Month
(Sept-08)
Thirty-Eighth Month
(Nov-08)
Fortieth Month
(Jan-09)
Forty-Second Month
(Mar-09)
Forty-Fourth Month
(May-09)
Forty-Fifth Month
(July-09)
HMF-MW5I 469 519 69.6 35.1 328 178 290 309 82.2HMF-MW6I 5.2 NS NS 4.5 NS NS 1.4 I NS NSHMF-MW7I 7.5 NS NS 11.4 NS NS 12.8 NS NSHMF-MW8I 1.3 NS NS 5.1 NS NS 6 NS NSHMF-MW9I 3.1 NS NS 5.2 NS NS 0.05 U NS NSNLP-IW2I 35.6 NS NS 73.7 NS NS 10 NS NSNLP-IW1I 3,950 6,590 312 25.1 1.5 68.4 2.5 1.6 I 88.6NLP-IW1S 197 146 178 127 1,770 289 2,280 178 594NLP-IW4I 5,220 9,330 953 437 183 90.5 4,470 5,610 352NLP-IW3I 0.43 U NS NS 0.50 U NS NS 3.2 NS NS
Source wells are: NLP-IW1I, NLP-IW4I, HMF-MW5I Source well average concentration (µg/L) 3,213 5,480 445 166 171 112 1,588 2,960 174 Source area remaining soluble mass (lbs) 2.26 3.86 0.31 0.12 0.12 0.08 1.12 2.08 0.12 Source area removal from baseline (%) 98.86 98.06 99.84 99.94 99.94 99.96 99.44 98.95 99.94
Table 2-1. Groundwater TCFM Data Summary by Sampling Event (continued)

Monitoring WellForty-Sixth
Month(July-09)
Forty-Eighth Month
(Sept-09)
Forty-Ninth Month
(Oct-09)
Fiftieth Month
(Nov-09)
Fifty-First Month
(Dec-09)
Fifty-Second Month
(Jan-10)
Fifty-Third Month
(Feb-10)
Fifty-Fourth Month
(Mar-10)
Fifty-Sixth Month
(May-10)
HMF-MW5I 194 315 155 142 46.2 71.6 101 51.1 61.4HMF-MW6I NS 1.0 I NS NS NS NS NS 0.4 U NSHMF-MW7I NS 10.5 NS NS NS NS NS 1.1 I NSHMF-MW8I NS 0.50 U NS NS NS NS NS 0.4 U NSHMF-MW9I NS 0.55 NS NS NS NS NS 0.4 U NSNLP-IW2I NS 32.2 NS NS NS NS NS 0.4 U NSNLP-IW1I 464 2.7 59 17,000 755 38.3 65 5.8 2.0 UNLP-IW1S 1,750 4,020 8,280 511 695 122 90.2 41.1 54.1NLP-IW4I 918 22,800 21,900 7,240 6,840 90.7 529 107 507NLP-IW3I NS 15.9 NS NS NS NS NS 0.4 U NS
Source wells are: NLP-IW1I, NLP-IW4I, HMF-MW5I Source well average concentration (µg/L) 525 7,706 7,371 8,127 2,547 67 232 55 284 Source area remaining soluble mass (lbs) 0.37 5.43 5.19 5.72 1.79 0.05 0.16 0.04 0.20 Source area removal from baseline (%) 99.81 97.26 97.38 97.12 99.10 99.98 99.92 99.98 99.90
Table 2-1. Groundwater TCFM Data Summary by Sampling Event (continued)

Monitoring WellFifty-Eighth
Month (July-10)
Fifty-Ninth Month
(Aug-10)
Sixtieth Month
(Sept-10)
Sixty-Third Month
(Dec-10)
Sixty-Sixth Month
(Mar-11)
Sixty-Ninth Month
(Jun-11)
Seventy-Second Month
(Sept-11)
Seventy-Fifth Month
(Dec-11)
Seventy-Eighth Month
(Mar-12)
HMF-MW5I 3.8 334 89.4 104 197 125 118 4.9 4.5HMF-MW6I NS NS 2.6 NS NS NS 0.50 U NS NSHMF-MW7I NS NS 7.1 NS NS NS 6.5 NS NSHMF-MW8I NS NS 0.40 U NS NS NS 0.50 U NS NSHMF-MW9I NS NS 7.2 NS NS NS 0.50 U NS NSNLP-IW2I NS NS 67.3 NS NS NS NS NS NSNLP-IW1I 0.44 I 1.9 I 36.5 0.8 I 0.50 U 5.7 0.85 I 0.50 U 0.50 UNLP-IW1S 43.6 57.4 94.3 296 1,010 E 1,480 753 502 1,200NLP-IW4I 3,350 3,100 3,670 2,750 1,190 2,940 7,210 9,660 723NLP-IW3I NS NS 35.7 NS NS NS NS NS NS
Source wells are: NLP-IW1I, NLP-IW4I, HMF-MW5I Source well average concentration (µg/L) 1,677 1,717 1,265 952 462 1,024 2,443 3,222 243 Source area remaining soluble mass (lbs) 1.18 1.21 0.89 0.67 0.33 0.72 1.72 2.27 0.17 Source area removal from baseline (%) 99.40 99.39 99.55 99.66 99.84 99.64 99.13 98.86 99.91
Table 2-1. Groundwater TCFM Data Summary by Sampling Event (continued)

Monitoring WellEighty-First
Month (June-12)
Eighty-Sixth
Month (Nov-12)
Eighty-Seventh Month
(Dec-12)
Ninetieth Month
(Mar-13)
Ninety-Third Month
(Jun-13)
Ninety-Sixth
Month(Sept-13)
Ninety-Ninth Month
(Dec-13)
101st Month (Pre-
Startup Baseline) (Feb-14)
102nd
Month (Mar-14)
HMF-MW5I 0.5 U NS 3.4 16.5 58.6 49.7 30.3 NS 286HMF-MW6I NS NS NS NS NS 0.50 U NS NS NSHMF-MW7I NS NS NS NS NS 0.50 U NS NS NSHMF-MW8I NS NS NS NS NS 0.50 U NS NS NSHMF-MW9I NS NS NS NS NS 0.50 U NS NS NSNLP-IW2I NS NS NS NS NS NS NS NS NSNLP-IW1I 0.50 U NS 50 4.5 3.2 0.50 U 0.50 U NS 0.79 INLP-IW1S 10.7 NS 12.1 95.2 123 51.4 83.9 NS 192NLP-IW4I 9,250 166 76.4 272 1,480 6,730 10,300 14,600 26NLP-IW3I NS NS NS NS NS NS NS NS NS
Source wells are: NLP-IW1I, NLP-IW4I, HMF-MW5I Source well average concentration (µg/L) 3,084 NA 43 98 514 2,260 3,444 NA 104 Source area remaining soluble mass (lbs) 2.17 NA 0.03 0.07 0.36 1.59 2.43 NA 0.07 Source area removal from baseline (%) 98.91 NA 99.98 99.97 99.82 99.20 98.78 NA 99.96
Table 2-1. Groundwater TCFM Data Summary by Sampling Event (continued)

Monitoring Well 106th Month (Jul-14)
108th Month (Sept-14)
111th Month (Dec-14)
114th Month (Mar-2015)
117th Month (Jun-15)
120th Month (Sept-15)
HMF-MW5I 2,650 2,130 506 489 337 568 HMF-MW6I NS 14.1 NS NS NS 0.5 UHMF-MW7I NS 0.5 U NS NS NS 0.5 UHMF-MW8I NS 0.93 I NS NS NS 0.5 UHMF-MW9I NS 45.4 NS NS NS 0.5 UNLP-IW2I NS NS NS NS NS NSNLP-IW1I 51.2 1.1 I 0.5 U 2.3 0.86 I 0.5 UNLP-IW1S 117 132 54.9 81.4 117 52NLP-IW4I 123 3,370 75.1 3,910 4,670 5,410 NLP-IW3I NS NS NS NS NS NS
Source wells are: NLP-IW1I, NLP-IW4I, HMF-MW5I Source well average concentration (µg/L) 941 1,834 194 1,467 1,669 1,993 Source area remaining soluble mass (lbs) 0.66 1.29 0.14 1.03 1.18 1.40 Source area removal from baseline (%) 99.67 99.35 99.93 99.48 99.41 99.29
Bolded results indicate TCFM greater than GCTL of 2,100 µg/L. Deep well NLP-IW1D TCFM Results: February 2014 Sparging Well Results:Shaded area indicates TCFM greater than the MNA-DV of 21,000 µg/L. Sept-06 Annual: 9.2 µg/L HMF-ASW-34: 79.8 µg/LNS - Well not sampled or not installed at time of sampling effort. Mar-07 Semi-annual: 82.5 µg/L HMF-ASW-38: 20.8 µg/LU - Not detected at associated detection limit. Sept-07 Annual: 6.8 µg/L HMF-ASW39: 4,160 µg/LI - Reported value is between method detection limit and practical Mar-08 Semi-annual: 29.8 µg/L quantitation limit. Sept-08 Annual: 167 µg/L
Mar-09 Semi-annual: 0.50 U µg/L1 Additional sampling results from January 2006: Sept-09 Annual: 0.50 U µg/L Free Product TCFM Results: Mar-10 Semi-annual: 0.40 U µg/L Water above product: HMF-GW-PROD-IW1I = 814,000 230 µg/L Sept-10 Annual: 0.40 U µg/L Product: HMF-PRODUCT-IW1I = 813,000,000 µg/L Sept-11 Annual: 0.50 U µg/L Supplemental sampling based on free product identification. Sept-13 Annual: 0.50 U µg/L M7-1411-IW1D: TCFM = 1.7 I µg/L Sept-14 Annual: 10.3 µg/L NLP-IW1D: TCFM = 0.5 U µg/L Sept-15 Annual: 3.1 µg/L
Table 2-1. Groundwater TCFM Data Summary by Sampling Event (continued)

MONITORING WELL
SAMPLE ID SAMPLE DATE
NLP-IW1S HMF-NLP-IW0001S-013.5-20050908 09-08-2005 0.5 UHMF-NLP-IW0001S-013.0-20051026 10-26-2005 721HMF-NLP-IW0001S-013.0-20051201 12-01-2005 57HMF-NLP-IW0001-013.5-122805 12-28-2005 9.3HMF-NLP-MW0001-013-20060125 01-25-2006 15.8HMF-NLP-MW0001-013.0-20060227 02-27-2006 37HMF-NLP-MW0001-013.0-20060328 03-28-2006 36.2HMF-NLP-MW0001-013.0-20060424 04-25-2006 25.2HMF-NLP-MW0001-013.0-20060525 05-25-2006 8.8HMF-NLP-MW0001-013.0-20060621 06-21-2006 3.4HMF-NLP-MW0001-013.0-20060726 07-26-2006 14HMF-NLP-MW0001-013.0-20060901 09-01-2006 384HMF-NLP-MW0001-013.0-20060928 09-28-2006 701HMF-NLP-MW0001-013.0-20061025 10-25-2006 2,280HMF-NLP-MW0001-013.0-20061129 11-29-2006 4,000HMF-NLP-MW0001-013.0-20061228 12-28-2006 2,010HMF-NLP-MW0001-013.0-20070131 01-31-2007 8,780HMF-NLP-MW0001-013.0-20070227 02-27-2007 15,300HMF-NLP-MW0001-013.0-20070329 03-29-2007 7,430HMF-NLP-MW0001-013.0-20070430 04-30-2007 7,540HMF-NLP-MW0001-013.0-20070531 05-31-2007 3,890HMF-NLP-MW0001-013.0-20070628 06-28-2007 3,830HMF-NLP-MW0001-013.0-20070731 07-31-2007 9,640HMF-NLP-MW0001-013.0-20070828 08-28-2007 4,320HMF-NLP-MW0001-013.0-20070926 09-26-2007 2,870HMF-NLP-MW0001-013.0-20071128 11-28-2007 463HMF-NLP-MW0001-013.0-20080131 01-31-2008 217HMF-NLP-MW0001-013.0-20080327 03-27-2008 197HMF-NLP-MW0001-013.0-20080528 05-28-2008 146HMF-NLP-MW0001-013.0-20080729 07-29-2008 178HMF-NLP-MW0001-013.0-20080925 09-25-2008 127HMF-NLP-MW0001-013.0-20081124 11-24-2008 1,770HMF-NLP-MW0001-013.0-20090130 01-30-2009 289HMF-NLP-MW0001-013.0-20090401 04-01-2009 2,280HMF-NLP-MW0001-013.0-20090526 05-26-2009 150HMF-NLP-MW0001-013.0-20090701 07-01-2009 594HMF-NLP-MW0001-013.0-20090729 07-29-2009 1,750HMF-NLP-MW0001-013.0-20090925 09-25-2009 4,020HMF-NLP-MW0001-013.0-20091027 10-27-2009 8,280HMF-NLP-MW0001-008.5-20091124 11-24-2009 511HMF-NLP-MW0001-008.5-20091229 12-29-2009 695HMF-NLP-MW0001-008.5-20100128 01-28-2010 122HMF-NLP-MW0001-008.5-20100224 02-24-2010 90.2HMF-NLP-MW0001-008.5-20100331 03-31-2010 41.1HMF-NLP-MW0001-008.5-20100527 05-27-2010 54.1HMF-NLP-MW0001-008.5-20100727 07-27-2010 43.6HMF-NLP-MW0001-008.5-20100831 08-31-2010 57.4HMF-NLP-MW0001-008.5-20100922 09-23-2010 94.3HMF-NLP-MW0001-008.5-20101229 12-29-2010 296
Table 2-2. Groundwater Data Summary by Monitoring Well
TCFM RESULT(μg/L)

MONITORING WELL
SAMPLE ID SAMPLE DATE
NLP-IW1S HMF-NLP-MW0001-008.5-20110324 03-24-2011 1,010 E(continued) HMF-NLP-MW0001-008.5-20110622 06-22-2011 1,480
HMF-NLP-MW0001-008.5-20110915 09-15-2011 753HMF-NLP-MW0001-008.5-20111216 12-16-2011 502HMF-NLP-MW0001-008.5-20120329 03-29-2012 1,200HMF-NLP-MW0001-008.5-20120621 06-21-2012 10.7HMF-NLP-MW0001-008.5-2012 12-27-2012 12.1HMF-NLP-MW0001-008.5-20130327 03-27-2013 95.2HMF-NLP-MW0001-008.5-20130627 06-27-2013 123HMF-NLP-MW0001-008.5-20130926 09-26-2013 51.4HMF-NLP-MW0001-008.5-20131219 12-19-2013 83.9HMF-NLP-MW0001-008.5-20140327 03-27-2014 192HMF-NLP-MW0001-008.5-20140710 07-10-2014 117HMF-NLP-MW0001-008.5-20140923 09-23-2014 132HMF-NLP-MW0001-008.5-20141223 12-23-2014 54.9HMF-NLP-MW0001-008.5-20150331 03-31-2015 81.4HMF-NLP-MW0001-008.5-20150625 06-25-2015 117HMF-NLP-MW0001-008.5-20150923 09-23-2015 52
NLP-IW1I HMF-NLP-IW0001I-040.0-20050908 09-08-2005 400,000HMF-NLP-IW0001I-042.0-20051026 10-26-2005 48,400HMF-NLP-IW0001I-040.0-20051201 12-01-2005 3,660HMF-NLP-IW0001-040.0-122805 12-28-2005 9,190HMF-NLP-MW0001-040-20060126 01-26-2006 184,000HMF-NLP-MW0001-042.0-20060227 02-27-2006 34,600HMF-NLP-MW0001-042.0-20060328 03-28-2006 1520HMF-NLP-MW0001-042.0-20060424 04-24-2006 3,950HMF-NLP-MW0001-042.0-20060525 05-25-2006 2,320HMF-NLP-MW0001-042.0-20060621 06-21-2006 4,180HMF-NLP-MW0001-042.0-20060726 07-26-2006 15,700HMF-NLP-MW0001-042.0-20060901 09-01-2006 9,380HMF-NLP-MW0001-042.0-20060928 09-28-2006 8,790HMF-NLP-MW0001-042.0-20061025 10-25-2006 3,930HMF-NLP-MW0001-042.0-20061129 11-29-2006 14,900HMF-NLP-MW0001-042.0-20061228 12-28-2006 4,260HMF-NLP-MW0001-042.0-20070131 01-31-2007 14,800HMF-NLP-MW0001-042.0-20070227 02-27-2007 12,400HMF-NLP-MW0001-042.0-20070329 03-29-2007 11,200 LHMF-NLP-MW0001-042.0-20070430 04-30-2007 7,590HMF-NLP-MW0001-042.0-20070531 05-31-2007 447HMF-NLP-MW0001-042.0-20070628 06-28-2007 8,090HMF-NLP-MW0001-042.0-20070731 07-31-2007 7HMF-NLP-MW0001-042.0-20070828 08-28-2007 5,330HMF-NLP-MW0001-042.0-20070926 09-26-2007 2,970HMF-NLP-MW0001-042.0-20071128 11-28-2007 4,550HMF-NLP-MW0001-042.0-20080131 01-31-2008 1,140HMF-NLP-MW0001-042.0-20080327 03-27-2008 3,950HMF-NLP-MW0001-042.0-20080528 05-28-2008 6,590HMF-NLP-MW0001-042.0-20080729 07-29-2008 312
Table 2-2. Groundwater Data Summary by Monitoring Well (continued)
TCFM RESULT(μg/L)

MONITORING WELL
SAMPLE ID SAMPLE DATE
NLP-IW1I HMF-NLP-MW0001-042.0-20080925 09-25-2008 25.1(continued) HMF-NLP-MW0001-042.0-20081124 11-24-2008 1.5
HMF-NLP-MW0001-042.0-20090130 01-30-2009 68.4HMF-NLP-MW0001-042.0-20090401 04-01-2009 2.5HMF-NLP-MW0001-042.0-20090526 05-26-2009 1.6 IHMF-NLP-MW0001-042.0-20090701 07-01-2009 88.6HMF-NLP-MW0001-042.0-20090729 07-29-2009 464HMF-NLP-MW0001-042.0-20090925 09-25-2009 2.7HMF-NLP-MW0001-042.0-20091027 10-27-2009 59HMF-NLP-MW0001-037.5-20091124 11-24-2009 17,000HMF-NLP-MW0001-037.5-20091229 12-29-2009 755HMF-NLP-MW0001-037.5-20100128 01-28-2010 38.3HMF-NLP-MW0001-037.5-20100224 02-24-2010 65HMF-NLP-MW0001-037.5-20100331 03-31-2010 5.8HMF-NLP-MW0001-037.5-20100527 05-27-2010 2.0 UHMF-NLP-MW0001-037.5-20100727 07-27-2010 0.44 IHMF-NLP-MW0001-037.5-20100831 08-31-2010 1.9 IHMF-NLP-MW0001-037.5-20100922 09-23-2010 36.5HMF-NLP-MW0001-037.5-20101229 12-29-2010 0.8 IHMF-NLP-MW0001-037.5-20110324 03-24-2011 0.5 UHMF-NLP-MW0001-037.5-20110622 06-22-2011 5.7HMF-NLP-MW0001-037.5-20110915 09-15-2011 0.85 IHMF-NLP-MW0001-037.5-20111216 12-16-2011 0.5 UHMF-NLP-MW0001-037.5-20120329 03-29-2012 0.5 UHMF-NLP-MW0001-037.5-20120621 06-21-2012 0.5 UHMF-NLP-MW0001-037.5-2012 12-27-2012 50HMF-NLP-MW0001-037.5-20130327 03-27-2013 4.5HMF-NLP-MW0001-037.5-20130627 06-27-2013 3.2HMF-NLP-MW0001-037.5-20130926 09-26-2013 0.5 UHMF-NLP-MW0001-037.5-20131219 12-19-2013 0.5 UHMF-NLP-MW0001-037.5-20140327 03-27-2014 0.79 IHMF-NLP-MW0001-037.5-20140710 07-10-2014 51.2HMF-NLP-MW0001-037.5-20140923 09-23-2014 1.1 IHMF-NLP-MW0001-037.5-20141223 12-23-2014 0.5 UHMF-NLP-MW0001-037.5-20150331 03-31-2015 2.3HMF-NLP-MW0001-037.5-20150625 06-25-2015 0.86 IHMF-NLP-MW0001-037.5-20150923 09-23-2015 0.5 U
NLP-IW1D HMF-NLP-MW0001-053-20050908 09-08-2005 12.8HMF-NLP-MW0001-053-20060328 03-28-2006 0.5 UHMF-NLP-MW0001-053-20060928 09-28-2006 9.2HMF-NLP-MW0001-053-20070329 03-29-2007 82.5HMF-NLP-MW0001-053-20070926 09-26-2007 6.8HMF-NLP-MW0001-053-20080327 03-27-2008 29.8HMF-NLP-MW0001-053-20080925 09-25-2008 167HMF-NLP-MW0001-053-20090401 04-01-2009 0.5 UHMF-NLP-MW0001-053-20090925 09-25-2009 0.5 UHMF-NLP-MW0001-053-20100331 03-31-2010 0.4 U
Table 2-2. Groundwater Data Summary by Monitoring Well (continued)
TCFM RESULT(μg/L)

MONITORING WELL
SAMPLE ID SAMPLE DATE
NLP-IW1D HMF-NLP-MW0001-053-20100922 09-23-2010 0.4 U(continued) HMF-NLP-MW0001-050.5-20110915 09-15-2011 0.5 U
HMF-NLP-MW0001-050.5-20130926 09-26-2013 0.5 UHMF-NLP-MW0001-050.5-20140922 09-22-2014 10.3HMF-NLP-MW0001-050.5-20150923 09-23-2015 3.1
NLP-IW2I HMF-NLP-IW0002I-042.0-20050909 09-09-2005 3,080HMF-NLP-IW0002I-042.0-20051026 10-26-2005 3,710HMF-NLP-IW0002I-042.5-20070227 02-27-2007 0.5 UHMF-NLP-IW0002I-042.5-20070329 03-29-2007 16 UHMF-NLP-IW0002I-042.5-20070430 04-30-2007 4.2HMF-NLP-IW0002I-042.5-20070531 05-31-2007 14.1HMF-NLP-IW0002I-042.5-20070628 06-28-2007 0.8 IHMF-NLP-IW0002I-042.5-20070731 07-31-2007 0.43 UHMF-NLP-IW0002I-042.5-20070828 08-28-2007 21.5HMF-NLP-IW0002I-042.5-20070926 09-26-2007 22.4HMF-NLP-IW0002I-042.5-20071128 11-28-2007 0.43 UHMF-NLP-IW0002I-042.5-20080131 01-31-2008 23.6HMF-NLP-IW0002I-042.5-20080327 03-27-2008 35.6HMF-NLP-IW0002I-042.5-20080925 09-25-2008 73.7HMF-NLP-IW0002I-042.5-20090401 04-01-2009 10HMF-NLP-IW0002I-042.5-20090925 09-25-2009 32.2HMF-NLP-IW0002I-042.5-20100331 03-31-2010 0.4 UHMF-NLP-IW0002I-042.5-20100922 09-23-2010 67.3
NLP-IW3I HMF-NLP-IW0003I-040.5-20050909 09-09-2005 200 UHMF-NLP-IW0003I-040.0-20051027 10-27-2005 0.5 UHMF-NLP-IW0003I-040.0-20051201 12-01-2005 24.5HMF-NLP-IW0003-040.0-122805 12-28-2008 10.6HMF-NLP-MW0003-045-20060126 01-26-2006 0.54 IHMF-NLP-MW0003-030.0-20060228 02-28-2006 0.5 UHMF-NLP-MW0003-040.0-20060328 03-28-2006 2 UHMF-NLP-MW0003-040.0-20060424 04-24-2006 1.8HMF-NLP-MW0003-040.0-20060525 05-25-2006 1HMF-NLP-MW0003-040.0-20060424 04-24-2006 1.8HMF-NLP-MW0003-040.0-20060621 06-21-2006 0.5HMF-NLP-MW0003-040.0-20060726 07-26-2006 14.9HMF-NLP-MW0003-040.0-20060901 09-01-2006 0.5HMF-NLP-MW0003-040.0-20060928 09-28-2006 0.87 IHMF-NLP-MW0003-040.0-20061025 10-25-2006 11.2HMF-NLP-MW0003-040.0-20061129 11-29-2006 19.8HMF-NLP-MW0003-040.0-20061228 12-28-2006 0.5 UHMF-NLP-MW0003-040.0-20070131 01-31-2007 0.5 UHMF-NLP-MW0003-040.0-20070227 02-27-2007 0.5 UHMF-NLP-MW0003-040.0-20070329 03-29-2007 0.5 UHMF-NLP-MW0003-040.0-20070430 04-30-2007 14.7HMF-NLP-MW0003-040.0-20070531 05-31-2007 0.5 UHMF-NLP-MW0003-040.0-20070628 06-28-2007 0.5 UHMF-NLP-MW0003-040.0-20070731 07-31-2007 13,600HMF-NLP-MW0003-040.0-20070828 08-28-2007 0.43 U
Table 3-2. Groundwater Data Summary by Monitoring Well (continued)
TCFM RESULT(μg/L)

MONITORING WELL
SAMPLE ID SAMPLE DATE
NLP-IW3I HMF-NLP-MW0003-040.0-20070926 09-26-2007 57.1(continued) HMF-NLP-MW0003-040.0-20071128 11-28-2007 0.43 U
HMF-NLP-MW0003-040.0-20080131 01-31-2008 0.43 UHMF-NLP-MW0003-040.0-20080327 03-27-2008 0.43 UHMF-NLP-MW0003-040.0-20080925 09-25-2008 0.5 UHMF-NLP-MW0003-040.0-20090401 04-01-2009 3.2HMF-NLP-MW0003-040.0-20090925 09-25-2009 15.9HMF-NLP-MW0003-040.0-20100331 03-31-2010 0.4 UHMF-NLP-MW0003-040.0-20100922 09-23-2010 35.7
NLP-IW4I HMF-NLP-IW0004I-040.0-20050908 09-08-2005 396,000HMF-NLP-IW0004I-040.0-20051026 10-26-2005 23,500HMF-NLP-IW0004I-040.0-20051201 12-01-2005 21,200HMF-NLP-IW0004-040.0-122805 12-28-2005 54,700HMF-NLP-MW0004-040-20060126 01-26-2006 49,700HMF-NLP-MW0004-040.0-20060228 02-28-2006 9,230HMF-NLP-MW0004-040.0-20060328 03-28-2006 27,200HMF-NLP-MW0004-040.0-20060424 04-24-2006 34,800HMF-NLP-MW0004-040.0-20060525 05-25-2006 2,380HMF-NLP-MW0004-040.0-20060621 06-21-2006 17,000HMF-NLP-MW0004-040.0-20060726 07-26-2006 40,600HMF-NLP-MW0004-040.0-20060901 09-01-2006 6,370HMF-NLP-MW0004-040.0-20060928 09-28-2006 48,900HMF-NLP-MW0004-040.0-20061025 10-25-2006 25,700HMF-NLP-MW0004-040.0-20061129 11-29-2006 21,400HMF-NLP-MW0004-040.0-20061228 12-28-2006 12,500HMF-NLP-MW0004-040.0-20070131 01-31-2007 45,800HMF-NLP-MW0004-040.0-20070227 02-27-2007 65,300HMF-NLP-MW0004-040.0-20070329 03-29-2007 36,200HMF-NLP-MW0004-040.0-20070430 04-30-2007 8,180HMF-NLP-MW0004-040.0-20070531 05-31-2007 583HMF-NLP-MW0004-040.0-20070628 06-28-2007 19,500HMF-NLP-MW0004-040.0-20070731 07-31-2007 67,000HMF-NLP-MW0004-040.0-20070828 08-28-2007 13,000HMF-NLP-MW0004-040.0-20070926 09-26-2007 24,000HMF-NLP-MW0004-040.0-20071128 11-28-2007 4,590HMF-NLP-MW0004-040.0-20080131 01-31-2008 2,580HMF-NLP-MW0004-040.0-20080327 03-27-2008 5,220HMF-NLP-MW0004-040.0-20080528 05-28-2008 9,330HMF-NLP-MW0004-040.0-20080729 07-29-2008 953HMF-NLP-MW0004-040.0-20080925 09-25-2008 437HMF-NLP-MW0004-040.2-20081124 11-24-2008 183HMF-NLP-MW0004-040.0-20080130 01-30-2009 90.5HMF-NLP-MW0004-040.0-20090401 04-01-2009 4,470HMF-NLP-MW0004-040.0-20090526 05-26-2009 5,610HMF-NLP-MW0004-040.0-20090701 07-01-2009 352HMF-NLP-MW0004-040.0-20090729 07-29-2009 918HMF-NLP-MW0004-040.0-20090924 09-25-2009 22,800HMF-NLP-MW0004-037.5-20091124 11-24-2009 7,240HMF-NLP-MW0004-040.0-20091027 10-27-2009 21,900
Table 2-2. Groundwater Data Summary by Monitoring Well (continued)
TCFM RESULT(μg/L)

MONITORING WELL
SAMPLE ID SAMPLE DATE
NLP-IW4I HMF-NLP-MW0004-037.5-20091229 12-29-2009 6,840(continued) HMF-NLP-MW0004-037.5-20100128 01-28-2010 90.7
HMF-NLP-MW0004-037.5-20100224 02-24-2010 529HMF-NLP-MW0004-037.5-20100331 03-31-2010 107HMF-NLP-MW0004-037.5-20100527 05-27-2010 507HMF-NLP-MW0004-037.5-20100727 07-27-2010 3,350HMF-NLP-MW0004-037.5-20100831 08-31-2010 3,100
HMF-NLP-MW0004-037.5-20100922 09-23-2010 3,670HMF-NLP-MW0004-037.5-20101229 12-29-2010 2,750HMF-NLP-MW0004-037.5-20110324 03-24-2011 1,190HMF-NLP-MW0004-037.5-20110622 06-22-2011 2,940HMF-NLP-MW0004-037.5-20110915 09-15-2011 7,210HMF-NLP-MW0004-037.5-20111216 12-16-2011 9,660HMF-NLP-MW0004-037.5-20120329 03-29-2012 723HMF-NLP-MW0004-037.5-20120621 06-21-2012 9,250HMF-NLP-MW0004-037.5-20121120 11-20-2012 166HMF-NLP-MW0004-037.5-2012 12-27-2012 76.4HMF-NLP-MW0004-037.5-20130327 03-27-2013 272HMF-NLP-MW0004-037.5-20130627 06-27-2013 1,480HMF-NLP-MW0004-037.5-20130926 09-26-2013 6,730HMF-NLP-MW0004-037.5-20131219 12-19-2013 10,300HMF-NLP-MW0004-037.5-20131219 02-13-2014 14,600HMF-NLP-MW0004-037.5-20140327 03-27-2014 26HMF-NLP-MW0004-037.5-20140710 07-10-2014 123HMF-NLP-MW0004-037.5-20140923 09-23-2014 3,370HMF-NLP-MW0004-037.5-20141223 12-23-2014 75.1HMF-NLP-MW0004-037.5-20150331 03-31-2015 3,910HMF-NLP-MW0004-037.5-20150626 06-25-2015 4,670HMF-NLP-MW0004-037.5-20150923 09-23-2015 5,410
HMF-MW5I HMF-MW0005I-040.0-20050908 09-08-2005 49,200HMF-MW0005I-040.0-20051026 10-26-2005 36,200HMF-MW0005I-040.0-20051201 12-01-2005 2,660HMF-MW0005-040.0-122805 12-28-2005 60,600HMF-MW0005-040-20060125 01-25-2006 71,700HMF-MW0005-040.0-20060227 02-27-2006 51,000HMF-MW0005-040.0-20060328 03-28-2006 51,900HMF-MW0005-040.0-20060424 04-25-2006 8,240HMF-MW0005-040.0-20060525 05-25-2006 25,800HMF-MW0005-040.0-20060621 06-21-2006 87,900HMF-MW0005-040.0-20060726 07-26-2006 75,700HMF-MW0005-040.0-20060901 09-01-2006 42,800HMF-MW0005-040.0-20060928 09-28-2006 34,800HMF-MW0005-040.0-20061025 10-25-2006 18,600HMF-MW0005-040.0-20061129 11-29-2006 89,500HMF-MW0005-040.0-20061228 12-28-2006 51,500HMF-MW0005-040.0-20070131 01-31-2007 81,200HMF-MW0005-040.0-20070227 02-27-2007 78,100HMF-MW0005-040.0-20070329 03-29-2007 40,900
Table 2-2. Groundwater Data Summary by Monitoring Well (continued)
TCFM RESULT(μg/L)

MONITORING WELL
SAMPLE ID SAMPLE DATE
HMF-MW5I HMF-MW0005-040.0-20070430 04-30-2007 15,000(continued) HMF-MW0005-040.0-20070531 05-31-2007 6,310
HMF-MW0005-040.0-20070628 06-28-2007 4,290HMF-MW0005-040.0-20070731 07-31-2007 2,420HMF-MW0005-040.0-20070828 08-28-2007 826HMF-MW0005-040.0-20070926 09-26-2007 2,900HMF-MW0005-040.0-20071128 11-28-2007 698HMF-MW0005-040.0-20080131 01-31-2008 547HMF-MW0005-040.0-20080327 03-27-2008 469HMF-MW0005-040.0-20080528 05-28-2008 519HMF-MW0005-040.0-20080729 07-29-2008 69.6HMF-MW0005-040.0-20080925 09-25-2008 35.1HMF-MW0005-040.0-20081124 11-24-2008 328HMF-MW0005-040.0-20080130 01-30-2009 178HMF-MW0005-040.0-20090401 04-01-2009 290HMF-MW0005-040.0-20090526 05-26-2009 309HMF-MW0005-040.0-20090701 07-01-2009 82.2HMF-MW0005-040.0-20090729 07-29-2009 194HMF-MW0005-040.0-20090924 09-25-2009 315HMF-MW0005-040.0-20091027 10-27-2009 155HMF-MW0005-037.5-20091124 11-24-2009 142HMF-MW0005-037.5-20091229 12-29-2009 46.2HMF-MW0005-037.5-20100128 01-28-2010 71.6HMF-MW0005-037.5-20100224 02-24-2010 101HMF-MW0005-037.5-20100331 03-31-2010 51.1HMF-MW0005-037.5-20100527 05-27-2010 61.4HMF-MW0005-037.5-20100727 07-27-2010 3.8HMF-MW0005-037.5-20100831 08-31-2010 334HMF-MW0005-037.5-20100922 09-23-2010 89.4HMF-MW0005-037.5-20101229 12-29-2010 104HMF-MW0005-037.5-20110324 03-24-2011 197HMF-MW0005-037.5-20110622 06-22-2011 125HMF-MW0005-037.5-20110915 09-15-2011 118HMF-MW0005-037.5-20111216 12-16-2011 4.9HMF-MW0005-037.5-20120329 03-29-2012 4.5HMF-MW0005-037.5-20120621 06-21-2012 0.5 UHMF-MW0005-037.5-20121227 12-27-2012 3.4HMF-MW0005-037.5-20130327 03-27-2013 16.5HMF-MW0005-037.5-20130627 06-27-2013 58.6HMF-MW0005-037.5-20130926 09-26-2013 49.7HMF-MW0005-037.5-20131219 12-19-2013 30.3HMF-MW0005-037.5-20140327 03-27-2014 286HMF-MW0005-037.5-20140710 07-10-2014 2,650HMF-MW0005-037.5-20140923 09-23-2014 2,130HMF-MW0005-037.5-20141223 12-23-2014 506HMF-MW0005-037.5-20150331 03-31-2015 489HMF-MW0005-037.5-20150625 06-25-2015 337HMF-MW0005-037.5-20150923 09-23-2015 568
HMF-MW6I HMF-MW0006I-040.0-20050907 09-07-2005 2 U
TCFM RESULT(μg/L)
Table 2-2. Groundwater Data Summary by Monitoring Well (continued)

MONITORING WELL
SAMPLE ID SAMPLE DATE
HMF-MW6I HMF-MW0006I-040.0-20051026 10-26-2005 41.7(conti nued) HMF-MW0006I-040.0-20051201 12-01-2005 3.4
HMF-MW0006-040.0-122805 12-28-2005 15.1HMF-MW0006-040-20060125 01-25-2006 17.5HMF-MW0006-040.0-20060227 02-27-2006 9.8HMF-MW0006-040.0-20060328 03-28-2006 5HMF-MW0006-040.0-20060424 04-24-2006 2.3HMF-MW0006-040.0-20060525 05-25-2006 0.7HMF-MW0006-040.0-20060621 06-21-2006 0.5 UHMF-MW0006-040.0-20060726 07-26-2006 0.5 UHMF-MW0006-040.0-20060901 09-01-2006 0.5 UHMF-MW0006-040.0-20060928 09-28-2006 2.7HMF-MW0006-040.0-20061025 10-25-2006 2.7 UHMF-MW0006-040.0-20061129 11-29-2006 2.7 UHMF-MW0006-040.0-20061228 12-28-2006 1.6 IHMF-MW0006-040.0-20070131 01-31-2007 0.5 UHMF-MW0006-040.0-20070226 02-27-2007 0.5 UHMF-MW0006-040.0-20070329 03-29-2007 0.5 UHMF-MW0006-040.0-20070430 04-30-2007 4HMF-MW0006-040.0-20070531 05-31-2007 5.8HMF-MW0006-040.0-20070628 06-28-2007 0.5 UHMF-MW0006-040.0-20070731 07-31-2007 69.7HMF-MW0006-040.0-20070828 08-28-2007 2.1HMF-MW0006-040.0-20070926 09-26-2007 2.6HMF-MW0006-040.0-20071128 11-28-2007 2.2HMF-MW0006-040.0-20080131 01-31-2008 2.1HMF-MW0006-040.0-20080327 03-27-2008 5.2HMF-MW0006-040.0-20080925 09-25-2008 4.5HMF-MW0006-040.0-20090401 04-01-2009 1.4 IHMF-MW0006-040.0-20090924 09-25-2009 1.0 IHMF-MW0006-040.0-20100331 03-31-2010 0.4 UHMF-MW0006-040.0-20100922 09-23-2010 2.6HMF-MW0006-037.5-20110915 09-15-2011 0.5 UHMF-MW0006-037.5-20130926 09-26-2013 0.5 UHMF-MW0006-037.5-20140923 09-23-2014 14.1HMF-MW0006-037.5-20150923 09-23-2015 0.5 U
HMF-MW7I HMF-MW00071-040.0-20050909 09-09-2005 0.5 UHMF-MW00071-040.0-20051026 10-26-2005 6.3HMF-MW00071-040.0-20051201 12-01-2005 37.1HMF-MW0007-040.0-122805 12-28-2005 10.7HMF-MW0007-040-20060125 01-25-2006 11.4HMF-MW0007-040.0-20060227 02-27-2006 20.5HMF-MW0007-040.0-20060328 03-28-2006 17.3HMF-MW0007-040.0-20060424 04-24-2006 28HMF-MW0007-040.0-20060525 05-25-2006 2.3HMF-MW0007-040.0-20060621 06-21-2006 2HMF-MW0007-040.0-20060726 07-26-2006 51.2HMF-MW0007-040.0-20060901 09-01-2006 0.5
Table 2-2. Groundwater Data Summary by Monitoring Well (continued)
TCFM RESULT(μg/L)

MONITORING WELL
SAMPLE ID SAMPLE DATE
HMF-MW7I HMF-MW0007-040.0-20060928 09-28-2006 2.3(continued) HMF-MW0007-040.0-20061025 10-25-2006 2.3 U
HMF-MW0007-040.0-20061129 11-29-2006 2.3 UHMF-MW0007-040.0-20061228 12-28-2006 0.5 UHMF-MW0007-040.0-20070131 01-31-2007 0.5 UHMF-MW0007-040.0-20070226 02-27-2007 0.5 UHMF-MW0007-040.0-20070329 03-29-2007 40.3HMF-MW0007-040.0-20070430 04-30-2007 2.6HMF-MW0007-040.0-20070531 05-31-2007 2.9HMF-MW0007-040.0-20070628 06-28-2007 0.5 UHMF-MW0007-040.0-20070731 07-31-2007 13,100HMF-MW0007-040.0-20070828 08-28-2007 4.2HMF-MW0007-040.0-20070926 09-26-2007 6.1HMF-MW0007-040.0-20071128 11-28-2007 4.8HMF-MW0007-040.0-20080131 01-31-2008 4.3HMF-MW0007-040.0-20080327 03-27-2008 7.5HMF-MW0007-040.0-20080327 03-27-2008 7.5HMF-MW0007-040.0-20080925 09-25-2008 11.4HMF-MW0007-040.0-20090401 04-01-2009 12.8HMF-MW0007-040.0-20090924 09-25-2009 10.5HMF-MW0007-040.0-20100331 03-31-2010 1.1 IHMF-MW0007-040.0-20100922 09-23-2010 7.1HMF-MW0007-037.5-20110915 09-15-2011 6.5HMF-MW0007-037.5-20130926 09-26-2013 0.5 UHMF-MW0007-037.5-20140923 09-23-2014 0.5 UHMF-MW0007-037.5-20150923 09-23-2015 0.5 U
HMF-MW8I HMF-MW0008-039-20060126 01-26-2006 0.56 IHMF-MW0008-040.0-20060227 02-27-2006 9.2HMF-MW0008-040.0-20060326 03-26-2006 5 UHMF-MW0008-040.0-20060424 04-24-2006 4.7HMF-MW0008-040.0-20060525 05-25-2006 4.7HMF-MW0008-040.0-20060621 06-21-2006 0.5 UHMF-MW0008-040.0-20060726 07-26-2006 0.5 UHMF-MW0008-040.0-20060901 09-01-2006 0.5 UHMF-MW0008-040.0-20060928 09-28-2006 0.5 UHMF-MW0008-040.0-20061025 10-25-2006 0.5 UHMF-MW0008-040.0-20061129 11-29-2006 0.73 IHMF-MW0008-040.0-20061228 12-28-2006 0.84 IHMF-MW0008-040.0-20070131 01-31-2007 4.4HMF-MW0008-040.0-20070226 02-27-2007 0.5 UHMF-MW0008-040.0-20070329 03-29-2007 5.3HMF-MW0008-040.0-20070430 04-30-2007 2.5HMF-MW0008-040.0-20070531 05-31-2007 5.5HMF-MW0008-040.0-20070628 06-28-2007 0.68HMF-MW0008-040.0-20070731 07-31-2007 68.5HMF-MW0008-040.0-20070828 08-28-2007 0.51 UHMF-MW0008-040.0-20070926 09-26-2007 0.43 UHMF-MW0008-040.0-20071128 11-28-2007 0.43 UHMF-MW0008-040.0-20080131 01-31-2008 0.81 I
Table 2-2. Groundwater Data Summary by Monitoring Well (continued)
TCFM RESULT(μg/L)

MONITORING WELL
SAMPLE ID SAMPLE DATE
HMF-MW8I HMF-MW0008-040.0-20080327 03-27-2008 1.3 I(continued) HMF-MW0008-040.0-20080925 09-25-2008 5.1
HMF-MW0008-040.0-20090401 04-01-2009 6HMF-MW0008-040.0-20090924 09-25-2009 0.5 UHMF-MW0008-040.0-20100331 03-31-2010 0.4 UHMF-MW0008-040.0-20100922 09-23-2010 0.4 UHMF-MW0008-037.5-20110915 09-15-2011 0.5 UHMF-MW0008-037.5-20130926 09-26-2013 0.5 UHMF-MW0008-037.5-20140923 09-23-2014 0.93 IHMF-MW0008-037.5-20150923 09-23-2015 0.5 U
HMF-MW9I HMF-MW0009-040.0-20060126 01-26-2006 4.7HMF-MW0009-040.0-20060227 02-27-2006 0.69 IHMF-MW0009-040.0-20060328 03-28-2006 3.2HMF-MW0009-040.0-20060424 04-24-2006 5.3HMF-MW0009-040.0-20060525 05-25-2006 10.5HMF-MW0009-040.0-20060621 06-21-2006 31.5HMF-MW0009-040.0-20060726 07-26-2006 40.6HMF-MW0009-040.0-20060901 09-01-2006 1.6 IHMF-MW0009-040.0-20060928 09-28-2006 0.5 UHMF-MW0009-040.0-20061025 10-25-2006 94.3HMF-MW0009-040.0-20061129 11-29-2006 0.78HMF-MW0009-040.0-20061228 12-28-2006 3.8HMF-MW0009-040.0-20070131 01-31-2007 0.51 IHMF-MW0009-040.0-20070227 02-27-2007 0.5 UHMF-MW0009-040.0-20070329 03-29-2007 3.8HMF-MW0009-040.0-20070430 04-30-2007 2HMF-MW0009-040.0-20070531 05-31-2007 5HMF-MW0009-040.0-20070628 06-28-2007 0.92HMF-MW0009-040.0-20070731 07-31-2007 117HMF-MW0009-040.0-20070828 08-28-2007 1.7 IHMF-MW0009-040.0-20070926 09-26-2007 1.9 IHMF-MW0009-040.0-20070927 11-28-2007 3.2HMF-MW0009-040.0-20070928 01-31-2008 1.2 IHMF-MW0009-040.0-20080327 03-27-2008 3.1HMF-MW0009-040.0-20080925 09-25-2008 5.2HMF-MW0009-040.0-20090401 04-01-2009 0.5 UHMF-MW0009-040.0-20090924 09-25-2009 0.55 IHMF-MW0009-040.0-20100331 03-31-2010 0.4 UHMF-MW0009-040.0-20100922 09-23-2010 7.2HMF-MW0009-037.5-20110915 09-15-2011 0.5 UHMF-MW0009-037.5-20130926 09-26-2013 0.5 UHMF-MW0009-037.5-20140923 09-23-2014 45.4HMF-MW0009-037.5-20150923 09-23-2015 0.5 U
Bolded values indicate TCFM results greater than the GCTL (2,100 µg/L).Shaded cells indicate TCFM results greater than the MNA-DV (21,000 µg/L).I - Reported value is between method detection limit and U - Not detected at associated detection limit. practical quantitation limit. E - Above calibration range.L - Exceeds calibration limit.
Table 2-2. Groundwater Data Summary by Monitoring Well (continued)
TCFM RESULT(μg/L)

Monitoring WellTop of Well Casing
Elevation(feet amsl)
Screen Interval (feet BTOC)
Static Depth to Water
(feet BTOC)
Groundwater Elevation (feet amsl)
NLP-IW1I 2.09 35 - 40 0.85 1.24NLP-IW2I 5.42 37 - 42 4.43 0.99NLP-IW3I 0.33 35.5 - 40.5 NM --NLP-IW4I 1.87 35 - 40 3.95 -2.15(1)
HMF-MW5I 4.65 35 - 40 3.41 1.24HMF-MW6I 1.84 35 - 40 1.10 0.74HMF-MW7I 0.96 35 - 40 0.22 0.52
amsl = Above mean sea level.
1 Not used in potentiometric surface map due to apparently anomalous reading.BTOC = Below top of casing.
Table 2-3. Groundwater Elevation Data - October 29, 2015

SWMU 70, KENNEDY SPACE CENTER, FLORIDA
#S
#S #S
#S
#S
#S
#S #S
#S
#S#S #S
#S #S#S #S #S #S
#S
#S #S #S #S
#S
#S
#S
#S
#S
#S
#S
#S
#S
#S
#S
#S
#S
#S
#S
#S
#S
#S
#S
#S
#S
#S#S
"́
"́
"́
"́ "́
"́
"́
"́"́
"́"́
"́"́"́
9TH ST SE
NLP-IW4I 03/27/13 06/27/13 09/26/13 12/19/13 02/13/14 03/27/14 07/10/14 09/23/14 12/23/14 03/31/15 06/25/15 09/23/2015[35-40]TCFM 272 1,480 6,730* 10,300* 14,600* 26 123 3,370* 75.1 3,910* 4,670* 5,410* [2100]
HMF-MW8I 03/27/13 06/27/13 09/26/13 12/19/13 03/27/14 07/10/14 09/23/14 12/23/14 03/31/15 06/25/15 09/23/2015[35-40]TCFM NS NS 0.5 U NS NS NS 0.93 I NS NS NS 0.5 U [2100]
NLP-IW1S 03/27/13 06/27/13 09/26/13 12/19/13 03/27/14 07/10/14 09/23/14 12/23/14 03/31/15 06/25/15 09/23/2015[3.5-13.5]TCFM 95.2 123 51.4 83.9 192 117 132 54.9 81.4 117 52 [2100]NLP-IW1I 03/27/13 06/27/13 09/26/13 12/19/13 03/27/14 07/10/14 09/23/14 12/23/14 03/31/15 06/25/15 09/23/2015[35-40]TCFM 4.5 3.2 0.5 U 0.5 U 0.79 I 51.2 1.1 I 0.5 U 2.3 0.86 I 0.5 U [2100]
NLP-IW1D 03/27/13 06/27/13 09/26/13 12/19/13 03/27/14 07/10/14 09/22/14 12/23/14 03/31/15 06/25/15 09/23/2015[49.8-54.TCFM NS NS 0.5 U NS NS NS 10.3 NS NS NS 3.1 [2100]
HMF-MW7I 03/27/13 06/27/13 09/26/13 12/19/13 03/27/14 07/10/14 09/23/14 12/23/14 03/31/15 06/25/15 09/23/2015[35-40]TCFM NS NS 0.5 U NS NS NS 0.5 U NS NS NS 0.5 U [2100]
HMF-MW6I 03/27/13 06/27/13 09/26/13 12/19/13 03/27/14 07/10/14 09/23/14 12/23/14 03/31/15 06/25/15 09/23/2015[35-40]TCFM NS NS 0.5 U NS NS NS 14.1 NS NS NS 0.5 U [2100]
HMF-MW5I 03/27/13 06/27/13 09/26/13 12/19/13 03/27/14 07/10/14 09/23/14 12/23/14 03/31/15 06/25/15 09/23/2015[35-40]TCFM 16.5 58.6 49.7 30.3 286 2,650* 2,130* 506 489 337 568 [2100]
HMF-MW9I 03/27/13 06/27/13 09/26/13 12/19/13 03/27/14 07/10/14 09/23/14 12/23/14 03/31/15 06/25/15 09/23/2015[35-40]TCFM NS NS 0.5 U NS NS NS 45.4 NS NS NS 0.5 U [2100]
FIGURE 2-1 GROUNDWATER TCFM RESULTS SUMMARY
20150410
Legend
"́ Monitoring WellAir Sparging Well#S
HMF-MW5I 09/08/05[35-40]TCFM 49200 * [2100]
Monitoring WellSample DateWell Screen Interval, feet below ground surface
GCTLDetected Concentration (ug/l), * indicates GCTL exceedanceContaminant
TCFM - TrichlorofluoromethaneI - Reported value between MDL and PQLL - Exceeds calibration limit U - Not detected at or above MDLNS - Not Sampled
Note:
50 0 50 Feet
HMF AGW
MR Yr 10
Revision: 0January 2016

0
50,000
100,000
150,000
200,000
250,000
300,000
350,000
400,000
450,000
TC
FM C
once
ntra
tion
(µg/
L)
Sampling Date
Figure 2-2. TCFM Concentrations Versus Time
HMF-MW0005-040 (MW-5I) HMF-NLP-MW0001-040 (IW-1I) HMF-NLP-MW0004-040 (IW-4I)
Baseline Sampling Event
12th Month
24th Month
System Expansion(18th Month)
36th Month
48th Month
60th Month
72nd Month
81st Month
99th Month 114th Month

SWMU 70, KENNEDY SPACE CENTER, FLORIDA
#S
#S #S
#S
#S
#S
#S #S
#S
#S#S #S
#S #S#S #S #S #S
#S
#S #S #S #S
#S
#S
#S
#S
#S
#S
#S
#S
#S
#S
#S
#S
#S
#S
#S
#S
#S
#S
#S
#S
#S
#S#S
"́
"́
"́
"́
"́ "́
"́
"́
"́"́
"́"́
"́"́"́
HMF-MW7I 12/23/14 03/31/15 06/25/15 09/23/2015[35-40]TCFM NS NS NS 0.5 U [2100]
NLP-IW4I 12/23/14 03/31/15 06/25/15 09/23/2015[35-40]TCFM 75.1 3,910* 4,670* 5,410* [2100]
HMF-MW5I 12/23/14 03/31/15 06/25/15 09/23/2015[35-40]TCFM 506 489 337 568 [2100]
HMF-MW9I 12/23/14 03/31/15 06/25/15 09/23/2015[35-40]TCFM NS NS NS 0.5 U [2100]
HMF-MW6I 12/23/14 03/31/15 06/25/15 09/23/2015[35-40]TCFM NS NS NS 0.5 U [2100]
HMF-MW8I 12/23/14 03/31/15 06/25/15 09/23/2015[35-40]TCFM NS NS NS 0.5 U [2100]
NLP-IW1S 12/23/14 03/31/15 06/25/15 09/23/2015[3.5-13.5]TCFM 54.9 81.4 117 52 [2100]NLP-IW1I 12/23/14 03/31/15 06/25/15 09/23/2015[35-40]TCFM 0.5 U 2.3 0.86 I 0.5 U [2100]NLP-IW1D 12/23/14 03/31/15 06/25/15 09/23/2015[49.8-54.TCFM NS NS NS 3.1 [2100]
50 0 50 Feet
FIGURE 2-3 YEAR 10 ANNUAL GROUNDWATER TCFM RESULTS SUMMARY
Legend
"́ Monitoring WellAir Sparging Well#S
HMF-MW5I 09/08/05[35-40]TCFM 49200 * [2100]
Monitoring WellSample DateWell Screen Interval, feet below ground surface
GCTLDetected Concentration (ug/l), * indicates GCTL exceedanceContaminant
TCFM - TrichlorofluoromethaneE - Above calibration rangeI - Reported value between MDL and PQLU - Not detected at or above MDLNS - Not Sampled
Note:
HMF AGW
MR Yr 10
Revision: 0January 2016
20150410

0
1,000
2,000
3,000
4,000
5,000
6,000
7,000
8,000
TC
FM C
once
ntra
tion
(µg/
L)
Figure 2-4. Year 10 TCFM Concentrations Versus Time
HMF-MW0005-040 (MW-5I) HMF-NLP-MW0001-040 (IW-1I) HMF-NLP-MW0004-040 (IW-4I) HMF-NLP-MW0001-013 (IW-1S)
FDEP GCTL (2,100 µg/L)

SWMU 70, KENNEDY SPACE CENTER, FLORIDA
"A
"A"A
"A "A
"A
"A"A "A
"A "A"A "A "A "A
"A
"A "A "A "A
"A
"A
"A
"A
"A
"A
"A
"A
"A
"A
"A
"A
"A
"A
"A
"A
"A
"A
"A
"A"A
"A"A"́
"́ "́
"́"́"́
"́ "
NLP-IW1I[35-40]1.24
NLP-IW2I[37-42]0.99
HMF-MW5I[35-40]1.24
HMF-MW6I[35-40]0.74
HMF-MW7I[35-40]0.52
NLP-IW4I[35-40]
NANLP-IW3I
[35.5-40.5]NA
0.6
0.8
1.0
1.2
0.6
0.8
1.01.2
FIGURE 2-5 POTENTIOMETRIC SURFACE MAP - OCTOBER 2015
Legend
Air Sparging Well"́ Monitoring Well
Note:
Location Designation
Potentiometic surface elevation measured10/29/2015 in feet above MSLNA - Not applicable for potentiometric contour due to anomalous reading
Screen Interval in feet below ground surface
Potentiometric Contour in feet above MSL(Dashed Where Inferred)Groundwater Flow Direction
NLP-IW1I[35-40]2.05
"
#S
1) Abbreviated location ID shown.
50 0 50 Feet
20150410 02-02
HMF AGW
MR Yr 10
Revision: 0January 2016

HMF GWMR Yr 10 Revision 0 January 2016
3-1
SECTION 3
OBSERVATIONS AND RECOMMENDATIONS
This section provides observations about the results from the tenth year of CMI and
recommendations based on these observations.
During the project’s tenth year, the air sparging system remained off, and quarterly groundwater
monitoring events were conducted in December 2014 and March, June, and September 2015.
Groundwater sampling was conducted at the three source area wells (NLP-IW1I, NLP-IW4I, and
HMF-MW5I) and the shallow well (NLP-IW1S) during all four events, and during the
September 2015 annual event, deep well NLP-IW1D and perimeter wells HMF-MW6I, HMF-
MW7I, HMF-MW8I, and HMF-MW9I were also sampled.
Periodic operation of the air sparging system at HMF between 2005 and 2010 removed a
significant amount of TCFM, as evidenced by groundwater sampling results. While the system
was operational during the fourth and fifth years of implementation (2008 and 2009), TCFM
concentrations in the source area decreased to less than the GCTL; however, during periods
when the system was off line, TCFM concentrations greater than the GCTL were detected in the
source area. At the KSCRT Meeting in October 2011, the team reached consensus to install
additional sparging wells and to conduct additional air sparging to address rebounding TCFM
concentrations in the NLP-IW4I area, with the objective of site closure. The modified system,
which included three additional sparging wells with flow concentrated in the NLP-IW4I area,
operated from October 2012 to March 2013, when operations were discontinued based on two
rounds with TCFM concentrations less than the GCTL in all wells. However, concentrations at
NLP-IW4I increased to greater than the GCTL in September 2013 and increased further in
December 2013. KSCRT consensus in February 2014 included operation of the system for 5
months, with sparging concentrated in the NLP-IW4I area and a likely transition to long-term
monitoring only (i.e., no additional air sparging) if rebounding occurred after the 5 months of
operation. Based on rebounding TCFM concentrations at NLP-IW4I and HMF-MW5I, KSCRT

HMF GWMR Yr 10 Revision 0 January 2016
3-2
consensus was reached in November 2014 to conduct an additional year of quarterly monitoring,
in December 2014 and March, June, and September 2015, and if TCFM concentrations
continued to exceed the GCTL, a long-term monitoring plan would be developed for continued
monitoring. If concentrations decreased to and remained less than the GCTL in all wells, a
sampling period would be determined to support NFA. Also, based on KSCRT consensus at the
February 2014 meeting, NLP-IW4I can again be used as a compliance well because the required
1 year after use of the well as a sparging well ended in July 2015.
Based on the continued detection of TCFM at concentrations exceeding the GCTL at NLP-IW4I
during the tenth year of monitoring, it is recommended that the sampling frequency be reduced
from quarterly to biennial and that the number of wells sampled be reduced from four wells
during quarterly events and nine wells during the annual event to three wells, source area wells
NLP-IW4I and HMF-MW5I and downgradient well HMF-MW6I, during biennial events (see
Figure 3-1). Existing data were evaluated to determine whether any seasonal trends existed in
TCFM concentrations over time; no significant seasonal trends were observed. The first biennial
sampling event is scheduled for September 2016. The time of year for sample collection may be
re-evaluated in the future and may be modified to verify the lack of seasonal trends prior to site
closeout.

"́
"́
"́ "́
"́
"́"́"́"́
"́"́"́
9TH ST SE
HMF-MW5I (35-40)
HMF-MW6I (35-40)
NLP-IW3I (35.5-40.5)NLP-IW4I (35-40)
NLP-IW2I (37-42)
NLP-IW1S (3.5-13.5)NLP-IW1I (35-40)
NLP-IW1D (49.8-54.8)
M71411-IW1I (16-21)
HMF-MW9I (35-40)
HMF-MW7I (35-40)
HMF-MW8I (35-40)
SWMU 70, KENNEDY SPACE CENTER, FLORIDA
50 0 50 Feet
FIGURE 3-1 LONG-TERM MONITORING WELL LOCATION MAP
Legend"́ Monitoring Well (Well Screen Interval, feet below ground surface),
highlighted wells to be sampled biennially
20150410
HMF AGW
MR Yr 10
Revision: 0January 2016

HMF AGWMR Yr 10 Revision 0 January 2016
4-1
SECTION 4
REFERENCES
Geosyntec Consultants (Geosyntec), 2004. HMF Hazardous Waste South Staging Areas,
SWMU No. 70, Corrective Measures Design Report. Kennedy Space Center, Florida. Rev. 0,
November.
NASA, 2004. Sampling and Analysis Plan for the RCRA Corrective Action Program at the John
F. Kennedy Space Center, Florida, Revision 1 (KSC-TA-6196), May.
Tetra Tech, 2005a. CMI Work Plan, HMF Hazardous Waste South Staging Areas, SWMU No.
70, Kennedy Space Center, Florida, Revision 0, August.
Tetra Tech, 2005b. Site-Specific Safety and Health Plan for HMF Hazardous Work South
Staging Area, SWMU No. 70, Kennedy Space Center, Florida, Revision 0, July.
Tetra Tech 2006a. CMI Construction Completion and Semi-Annual HMF Hazardous Waste
South Staging Areas, SWMU No. 70 Report, SWMU No. 70, Kennedy Space Center, Florida,
Revision 0, June.(KSC-TA-8275)
Tetra Tech, 2006b. CMI Annual Report for the HMF Hazardous Waste South Staging Areas,
SWMU No. 70, Kennedy Space Center, Florida, Revision 0, October. (KSC-TA-8587)
Tetra Tech, 2007a. CMI System Expansion Construction Completion and Second Semi-Annual
Report for the HMF Hazardous Waste South Staging Areas, SWMU No. 70, Kennedy Space
Center, Florida, Revision 0, July. (KSC-TA-8836)
Tetra Tech, 2007b. CMI Second Annual Report for the HMF Hazardous Waste South Staging
Areas, SWMU No. 70, Kennedy Space Center, Florida, Revision 0, October. (KSC-TA-9086)

HMF AGWMR Yr 10 Revision 0 January 2016
4-2
Tetra Tech, 2008. CMI Third Annual Report for the HMF Hazardous Waste South Staging
Areas, SWMU No. 70, Kennedy Space Center, Florida, Revision 0, October. (KSC-TA-9746)
Tetra Tech, 2009. CMI Fourth Annual Report for the HMF Hazardous Waste South Staging
Areas, SWMU No. 70, Kennedy Space Center, Florida, Revision 0, October. (KSC-TA-10944)
Tetra Tech, 2010. CMI Fifth Annual Report for the HMF Hazardous Waste South Staging
Areas, SWMU No. 70, Kennedy Space Center, Florida, Revision 0, October. (KSC-TA-11420)
Tetra Tech, 2011. CMI Sixth Annual Report for the HMF Hazardous Waste South Staging
Areas, SWMU No. 70, Kennedy Space Center, Florida, Revision 0, October. (KSC-TA-11925)
Tetra Tech, 2012. Site-Specific Safety and Health Plan Addendum for the Installation of the Air
Sparging System at Hypergol Maintenance Facility (HMF) Hazardous Work South Staging Area,
Solid Waste Management Unit 70, John F. Kennedy Space Center, Florida, Revision 0, April.
Tetra Tech, 2013. CMI Corrective Measures Implementation System Modification and Annual
Report, Year 7, for the HMF Hazardous Waste South Staging Areas, SWMU 70, Kennedy
Space Center, Florida, Revision 0, October.
Tetra Tech, 2014. Corrective Measures Implementation, Annual Report, Year 8, for the
Hypergol Maintenance Facility Hazardous Waste South Staging Areas, SWMU 070, Kennedy
Space Center, Florida, Revision 0, March.
Tetra Tech, 2015. Corrective Measures Implementation, Annual Report, Year 9, for the
Hypergol Maintenance Facility Hazardous Waste South Staging Areas, SWMU 070, Kennedy
Space Center, Florida, Revision 0, January.

APPENDIX A
MEETING MINUTES


APPENDIX B
FIELD LOGBOOK


APPENDIX C
GROUNDWATER CHAIN-OF-CUSTODY FORMS
AND SAMPLE LOG SHEETS


APPENDIX D
ANALYTICAL RESULTS
GROUNDWATER MONITORING EVENTS
• 111th MONTH: DECEMBER 2014 – SDG FA21050
• 114th MONTH: MARCH 2015 – SDG FA23260
• 117th MONTH: JUNE 2014 – SDG FA25567
• 120th MONTH: SEPTEMBER 2015 – SDG FA27924
• Full analytical reports (SDG packages) provided on project CD

111th MONTH: DECEMBER 2014 – SDG FA21050

12/21/15
Technical Report for
Tetra Tech NUS
HMF
112G02382
Accutest Job Number: FA21050
Sampling Date: 12/23/14
Report to:
Tetra Tech, NUS
ATTN: Mark Jonnet
Total number of pages in report:
Certifications: FL (E83510), LA (03051), KS (E-10327), IA (366), IL (200063), NC (573), NJ (FL002), SC (96038001)
DoD ELAP (L-A-B L2229), CA (2937), TX (T104704404), PA (68-03573), VA (460177),
AK, AR, GA, KY, MA, NV, OK, UT, WA
This report shall not be reproduced, except in its entirety, without the written approval of Accutest Laboratories.
Test results relate only to samples analyzed.
Southeast • 4405 Vineland Road • Suite C-15 • Orlando, FL 32811 • tel: 407-425-6700 • fax: 407-425-0707 • http://www.accutest.com
Test results contained within this data package meet the requirements
of the National Environmental Laboratory Accreditation Program
and/or state specific certification programs as applicable.
Client Service contact: Andrea Colby 407-425-6700
Norm FarmerTechnical Director
Southeast
12/21/15
e-Hardcopy 2.0Automated Report
13
Accutest Laboratories is the sole authority for authorizing edits or modifications to thisdocument. Unauthorized modification of this report is strictly prohibited.
1 of 13FA21050

Table of Contents-1-
Sections:
Section 1: Sample Summary ................................................................................................... 3Section 2: Case Narrative/Conformance Summary .............................................................. 4Section 3: Summary of Hits .................................................................................................... 5Section 4: Sample Results ........................................................................................................ 6
4.1: FA21050-1: HMF-NLP-MW0001-037.5-20141223 .................................................... 74.2: FA21050-2: HMF-NLP-MW0001-008.5-20141223 .................................................... 84.3: FA21050-3: HMF-NLP-MW0004-037.5-20141223 .................................................... 94.4: FA21050-4: HMF-MW0005-037.5-20141223 ............................................................. 10
Section 5: Misc. Forms ............................................................................................................ 115.1: Chain of Custody ........................................................................................................... 12
12
34
5
2 of 13FA21050

Accutest LabLink@165007 11:38 21-Dec-2015
Sample Summary
Tetra Tech NUSJob No: FA21050
HMFProject No: 112G02382
Sample Collected Matrix Client Number Date Time By Received Code Type Sample ID
FA21050-1 12/23/14 13:00 SV 12/24/14 AQ Ground Water HMF-NLP-MW0001-037.5-20141223
FA21050-2 12/23/14 13:55 SV 12/24/14 AQ Ground Water HMF-NLP-MW0001-008.5-20141223
FA21050-3 12/23/14 14:45 SV 12/24/14 AQ Ground Water HMF-NLP-MW0004-037.5-20141223
FA21050-4 12/23/14 15:45 SV 12/24/14 AQ Ground Water HMF-MW0005-037.5-20141223
3 of 13FA21050
1

SAMPLE DELIVERY GROUP CASE NARRATIVE
Client: Tetra Tech NUS Job No: FA21050
Site: HMF Report Date: 1/7/2015 3:06:56 PM 4 Sample(s) were collected on 12/23/2014 and were received at Accutest SE on 12/24/2014 properly preserved, at 2.8 Deg. C and intact. These Samples received an Accutest job number of FA21050. A listing of the Laboratory Sample ID, Client Sample ID and dates of collection are presented in the Results Summary Section of this report.
Except as noted below, all method specified calibrations and quality control performance criteria were met for this job. For more information, please refer to QC summary pages.
Volatiles by GCMS By Method SW846 8260B Matrix: AQ Batch ID: VB4172 All samples were analyzed within the recommended method holding time. All method blanks for this batch meet method specific criteria. VB4172-BS: No MS/MSD available for this run. Matrix: AQ Batch ID: VB4173 All samples were analyzed within the recommended method holding time. All method blanks for this batch meet method specific criteria. Sample(s) FA21114-1MS, FA21114-1MSD were used as the QC samples indicated. Matrix: AQ Batch ID: VB4174 All samples were analyzed within the recommended method holding time. All method blanks for this batch meet method specific criteria. Sample(s) FA21114-17MS, FA21114-17MSD were used as the QC samples indicated. Accutest Laboratories Southeast (ALSE) certifies that this report meets the project requirements for analytical data produced for the samples as received at ALSE and as stated on the COC. ALSE certifies that the data meets the Data Quality Objectives for precision, accuracy and completeness as specified in the ALSE Quality Manual except as noted above. This report is to be used in its entirety. ALSE is not responsible for any assumptions of data quality if partial data packages are used. Narrative prepared by: ______________________________________ Date: January 7, 2015 Kim Benham, Client Services (signature on file)
Manual Integration Summary
Lab Sample ID Analysis Type File ID Manual Integrations FA21114-17MS MSVOA B103017.D tert-Butylbenzene VB4165-IC4165 MSVOA B102752.D Trichlorofluoromethane
2 Manual Integrations were found for FA21050
Wednesday, January 07, 2015 Page 1 of 1
4 of 13FA21050
2

Summary of Hits Page 1 of 1 Job Number: FA21050Account: Tetra Tech NUSProject: HMFCollected: 12/23/14
Lab Sample ID Client Sample ID Result/Analyte Qual PQL MDL Units Method
FA21050-1 HMF-NLP-MW0001-037.5-20141223
No hits reported in this sample.
FA21050-2 HMF-NLP-MW0001-008.5-20141223
Trichlorofluoromethane 54.9 4.0 1.0 ug/l SW846 8260B
FA21050-3 HMF-NLP-MW0004-037.5-20141223
Trichlorofluoromethane 75.1 4.0 1.0 ug/l SW846 8260B
FA21050-4 HMF-MW0005-037.5-20141223
Trichlorofluoromethane 506 20 5.0 ug/l SW846 8260B
5 of 13FA21050
3

Accutest LabLink@165007 11:38 21-Dec-2015
Sample Results
Report of Analysis
Southeast
Section 4
6 of 13FA21050
4
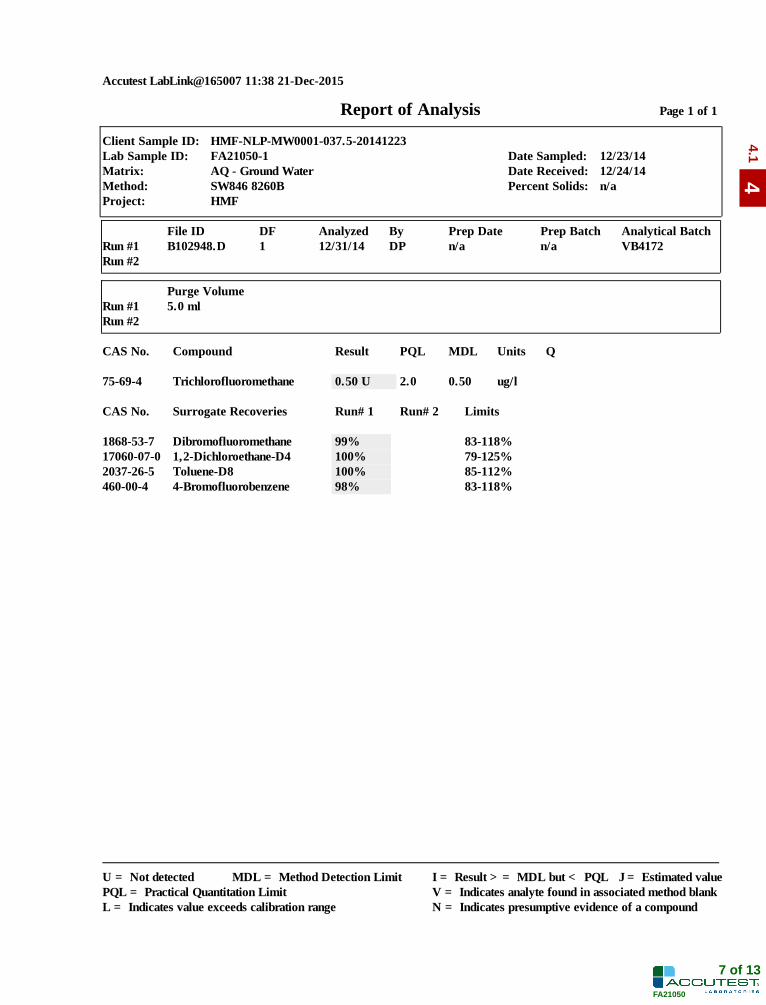
Accutest LabLink@165007 11:38 21-Dec-2015
Report of Analysis Page 1 of 1
Client Sample ID: HMF-NLP-MW0001-037.5-20141223 Lab Sample ID: FA21050-1 Date Sampled: 12/23/14 Matrix: AQ - Ground Water Date Received: 12/24/14 Method: SW846 8260B Percent Solids: n/a Project: HMF
File ID DF Analyzed By Prep Date Prep Batch Analytical BatchRun #1 B102948.D 1 12/31/14 DP n/a n/a VB4172Run #2
Purge VolumeRun #1 5.0 mlRun #2
CAS No. Compound Result PQL MDL Units Q
75-69-4 Trichlorofluoromethane 0.50 U 2.0 0.50 ug/l
CAS No. Surrogate Recoveries Run# 1 Run# 2 Limits
1868-53-7 Dibromofluoromethane 99% 83-118%17060-07-0 1,2-Dichloroethane-D4 100% 79-125%2037-26-5 Toluene-D8 100% 85-112%460-00-4 4-Bromofluorobenzene 98% 83-118%
U = Not detected MDL = Method Detection Limit I = Result >= MDL but < PQL J = Estimated valuePQL = Practical Quantitation Limit V = Indicates analyte found in associated method blankL = Indicates value exceeds calibration range N = Indicates presumptive evidence of a compound
7 of 13FA21050
44.1

Accutest LabLink@165007 11:38 21-Dec-2015
Report of Analysis Page 1 of 1
Client Sample ID: HMF-NLP-MW0001-008.5-20141223 Lab Sample ID: FA21050-2 Date Sampled: 12/23/14 Matrix: AQ - Ground Water Date Received: 12/24/14 Method: SW846 8260B Percent Solids: n/a Project: HMF
File ID DF Analyzed By Prep Date Prep Batch Analytical BatchRun #1 B102978.D 2 01/02/15 DP n/a n/a VB4173Run #2
Purge VolumeRun #1 5.0 mlRun #2
CAS No. Compound Result PQL MDL Units Q
75-69-4 Trichlorofluoromethane 54.9 4.0 1.0 ug/l
CAS No. Surrogate Recoveries Run# 1 Run# 2 Limits
1868-53-7 Dibromofluoromethane 109% 83-118%17060-07-0 1,2-Dichloroethane-D4 111% 79-125%2037-26-5 Toluene-D8 97% 85-112%460-00-4 4-Bromofluorobenzene 100% 83-118%
U = Not detected MDL = Method Detection Limit I = Result >= MDL but < PQL J = Estimated valuePQL = Practical Quantitation Limit V = Indicates analyte found in associated method blankL = Indicates value exceeds calibration range N = Indicates presumptive evidence of a compound
8 of 13FA21050
44.2

Accutest LabLink@165007 11:38 21-Dec-2015
Report of Analysis Page 1 of 1
Client Sample ID: HMF-NLP-MW0004-037.5-20141223 Lab Sample ID: FA21050-3 Date Sampled: 12/23/14 Matrix: AQ - Ground Water Date Received: 12/24/14 Method: SW846 8260B Percent Solids: n/a Project: HMF
File ID DF Analyzed By Prep Date Prep Batch Analytical BatchRun #1 B102979.D 2 01/02/15 DP n/a n/a VB4173Run #2
Purge VolumeRun #1 5.0 mlRun #2
CAS No. Compound Result PQL MDL Units Q
75-69-4 Trichlorofluoromethane 75.1 4.0 1.0 ug/l
CAS No. Surrogate Recoveries Run# 1 Run# 2 Limits
1868-53-7 Dibromofluoromethane 102% 83-118%17060-07-0 1,2-Dichloroethane-D4 102% 79-125%2037-26-5 Toluene-D8 96% 85-112%460-00-4 4-Bromofluorobenzene 101% 83-118%
U = Not detected MDL = Method Detection Limit I = Result >= MDL but < PQL J = Estimated valuePQL = Practical Quantitation Limit V = Indicates analyte found in associated method blankL = Indicates value exceeds calibration range N = Indicates presumptive evidence of a compound
9 of 13FA21050
44.3

Accutest LabLink@165007 11:38 21-Dec-2015
Report of Analysis Page 1 of 1
Client Sample ID: HMF-MW0005-037.5-20141223 Lab Sample ID: FA21050-4 Date Sampled: 12/23/14 Matrix: AQ - Ground Water Date Received: 12/24/14 Method: SW846 8260B Percent Solids: n/a Project: HMF
File ID DF Analyzed By Prep Date Prep Batch Analytical BatchRun #1 B102951.D 1 12/31/14 DP n/a n/a VB4172Run #2 B102997.D 10 01/05/15 DP n/a n/a VB4174
Purge VolumeRun #1 5.0 mlRun #2 5.0 ml
CAS No. Compound Result PQL MDL Units Q
75-69-4 Trichlorofluoromethane 506 a 20 5.0 ug/l
CAS No. Surrogate Recoveries Run# 1 Run# 2 Limits
1868-53-7 Dibromofluoromethane 102% 102% 83-118%17060-07-0 1,2-Dichloroethane-D4 103% 99% 79-125%2037-26-5 Toluene-D8 102% 98% 85-112%460-00-4 4-Bromofluorobenzene 99% 102% 83-118%
(a) Result is from Run# 2
U = Not detected MDL = Method Detection Limit I = Result >= MDL but < PQL J = Estimated valuePQL = Practical Quantitation Limit V = Indicates analyte found in associated method blankL = Indicates value exceeds calibration range N = Indicates presumptive evidence of a compound
10 of 13FA21050
44.4

Accutest LabLink@165007 11:38 21-Dec-2015
Misc. Forms
Custody Documents and Other Forms
Includes the following where applicable:
• Chain of Custody
Southeast
Section 5
11 of 13FA21050
5

FA21050: Chain of CustodyPage 1 of 2
12 of 13FA21050
55.1

FA21050: Chain of CustodyPage 2 of 2
13 of 13FA21050
55.1

114th MONTH: MARCH 2015 – SDG FA23260

12/21/15
Technical Report for
Tetra Tech NUS
HMF
112G02382
Accutest Job Number: FA23260
Sampling Date: 03/31/15
Report to:
Tetra Tech, NUS
ATTN: Mark Jonnet
Total number of pages in report:
Certifications: FL (E83510), LA (03051), KS (E-10327), IA (366), IL (200063), NC (573), NJ (FL002), SC (96038001)
DoD ELAP (L-A-B L2229), CA (2937), TX (T104704404), PA (68-03573), VA (460177),
AK, AR, GA, KY, MA, NV, OK, UT, WA
This report shall not be reproduced, except in its entirety, without the written approval of Accutest Laboratories.
Test results relate only to samples analyzed.
Southeast • 4405 Vineland Road • Suite C-15 • Orlando, FL 32811 • tel: 407-425-6700 • fax: 407-425-0707 • http://www.accutest.com
Test results contained within this data package meet the requirements
of the National Environmental Laboratory Accreditation Program
and/or state specific certification programs as applicable.
Client Service contact: Andrea Colby 407-425-6700
Norm FarmerTechnical Director
Southeast
12/21/15
e-Hardcopy 2.0Automated Report
13
Accutest Laboratories is the sole authority for authorizing edits or modifications to thisdocument. Unauthorized modification of this report is strictly prohibited.
1 of 13FA23260

Table of Contents-1-
Sections:
Section 1: Sample Summary ................................................................................................... 3Section 2: Case Narrative/Conformance Summary .............................................................. 4Section 3: Summary of Hits .................................................................................................... 5Section 4: Sample Results ........................................................................................................ 6
4.1: FA23260-1: HMF-NLP-MW0004-037.5-2015331 ...................................................... 74.2: FA23260-2: HMF-NLP-MW0005-037.7-2015331 ...................................................... 84.3: FA23260-3: HMF-NLP-MW0001I-037.5-2015331 ..................................................... 94.4: FA23260-4: HMF-NLP-MW0001S-008.5-2015331 .................................................... 10
Section 5: Misc. Forms ............................................................................................................ 115.1: Chain of Custody ........................................................................................................... 12
12
34
5
2 of 13FA23260
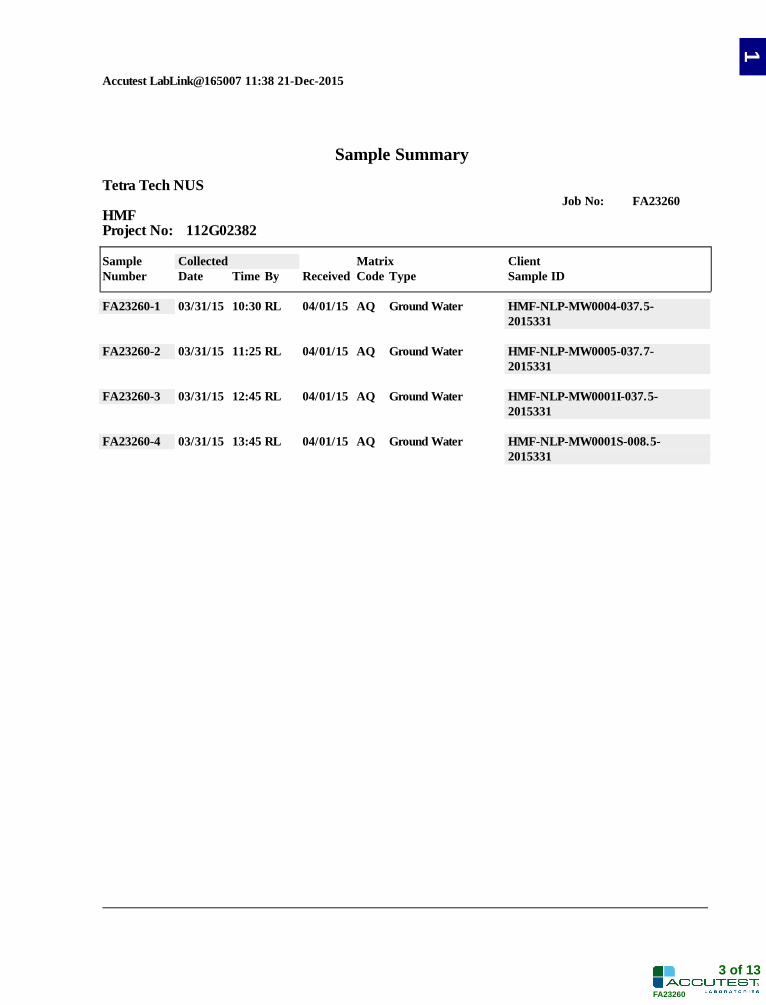
Accutest LabLink@165007 11:38 21-Dec-2015
Sample Summary
Tetra Tech NUSJob No: FA23260
HMFProject No: 112G02382
Sample Collected Matrix Client Number Date Time By Received Code Type Sample ID
FA23260-1 03/31/15 10:30 RL 04/01/15 AQ Ground Water HMF-NLP-MW0004-037.5-2015331
FA23260-2 03/31/15 11:25 RL 04/01/15 AQ Ground Water HMF-NLP-MW0005-037.7-2015331
FA23260-3 03/31/15 12:45 RL 04/01/15 AQ Ground Water HMF-NLP-MW0001I-037.5-2015331
FA23260-4 03/31/15 13:45 RL 04/01/15 AQ Ground Water HMF-NLP-MW0001S-008.5-2015331
3 of 13FA23260
1

SAMPLE DELIVERY GROUP CASE NARRATIVE
Client: Tetra Tech NUS Job No: FA23260
Site: HMF Report Date: 4/15/2015 3:17:32 PM 4 Sample(s) were collected on 03/31/2015 and were received at Accutest SE on 04/01/2015 properly preserved, at 3.6 Deg. C and intact. These Samples received an Accutest job number of FA23260. A listing of the Laboratory Sample ID, Client Sample ID and dates of collection are presented in the Results Summary Section of this report.
Except as noted below, all method specified calibrations and quality control performance criteria were met for this job. For more information, please refer to QC summary pages.
Volatiles by GCMS By Method SW846 8260B Matrix: AQ Batch ID: VP1182 All samples were analyzed within the recommended method holding time. All method blanks for this batch meet method specific criteria. Sample(s) FA23436-2MS, FA23436-2MSD were used as the QC samples indicated. FA23260-3: Sample was treated with an anti-foaming agent. Matrix: AQ Batch ID: VP1183 All samples were analyzed within the recommended method holding time. All method blanks for this batch meet method specific criteria. Sample(s) FA23471-6MS, FA23471-6MSD were used as the QC samples indicated. Accutest Laboratories Southeast (ALSE) certifies that this report meets the project requirements for analytical data produced for the samples as received at ALSE and as stated on the COC. ALSE certifies that the data meets the Data Quality Objectives for precision, accuracy and completeness as specified in the ALSE Quality Manual except as noted above. This report is to be used in its entirety. ALSE is not responsible for any assumptions of data quality if partial data packages are used. Narrative prepared by: ______________________________________ Date: April 15, 2015 Kim Benham, Client Services (signature on file)
Manual Integration Summary Lab Sample ID Analysis Type File ID Manual Integrations FA23260-3 MSVOA P31781.D Trichlorofluoromethane FA23260-4 MSVOA P31813.D Trichlorofluoromethane FA23436-2MS MSVOA P31783.D Carbon Tetrachloride FA23436-2MSD MSVOA P31784.D Carbon Tetrachloride FA23471-6MS MSVOA P31814.D Carbon Tetrachloride FA23471-6MSD MSVOA P31815.D Carbon Tetrachloride VP1161-IC1161 MSVOA P31196.D 1,4-Dichlorobenzene, Dichlorodifluoromethane, Trichlorofluoromethane VP1161-IC1161 MSVOA P31197.D Carbon Tetrachloride VP1161-IC1161 MSVOA P31198.D Carbon Tetrachloride VP1161-IC1161 MSVOA P31200.D Carbon Tetrachloride VP1161-IC1161 MSVOA P31201.D Carbon Tetrachloride VP1161-ICC1161 MSVOA P31199.D Carbon Tetrachloride VP1161-ICV1161 MSVOA P31203.D Carbon Tetrachloride VP1182-BS MSVOA P31760.D Carbon Tetrachloride VP1182-CC1161 MSVOA P31759.D Carbon Tetrachloride VP1183-BS MSVOA P31791.D Carbon Tetrachloride VP1183-CC1161 MSVOA P31790.D Carbon Tetrachloride
17 Manual Integrations were found for FA23260
Wednesday, April 15, 2015 Page 1 of 1 4 of 13
FA23260
2

Summary of Hits Page 1 of 1 Job Number: FA23260Account: Tetra Tech NUSProject: HMFCollected: 03/31/15
Lab Sample ID Client Sample ID Result/Analyte Qual PQL MDL Units Method
FA23260-1 HMF-NLP-MW0004-037.5-2015331
Trichlorofluoromethane 3910 100 25 ug/l SW846 8260B
FA23260-2 HMF-NLP-MW0005-037.7-2015331
Trichlorofluoromethane 489 20 5.0 ug/l SW846 8260B
FA23260-3 HMF-NLP-MW0001I-037.5-2015331
Trichlorofluoromethane a 2.3 2.0 0.50 ug/l SW846 8260B
FA23260-4 HMF-NLP-MW0001S-008.5-2015331
Trichlorofluoromethane 81.4 10 2.5 ug/l SW846 8260B
(a) Sample was treated with an anti-foaming agent.
5 of 13FA23260
3

Accutest LabLink@165007 11:38 21-Dec-2015
Sample Results
Report of Analysis
Southeast
Section 4
6 of 13FA23260
4
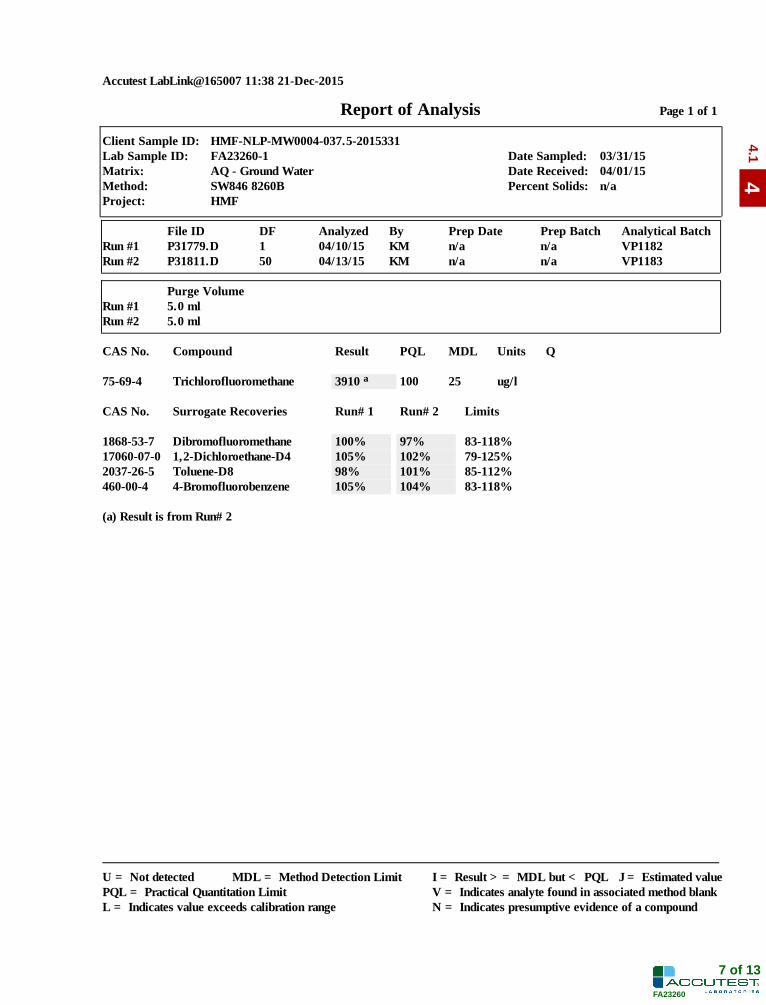
Accutest LabLink@165007 11:38 21-Dec-2015
Report of Analysis Page 1 of 1
Client Sample ID: HMF-NLP-MW0004-037.5-2015331 Lab Sample ID: FA23260-1 Date Sampled: 03/31/15 Matrix: AQ - Ground Water Date Received: 04/01/15 Method: SW846 8260B Percent Solids: n/a Project: HMF
File ID DF Analyzed By Prep Date Prep Batch Analytical BatchRun #1 P31779.D 1 04/10/15 KM n/a n/a VP1182Run #2 P31811.D 50 04/13/15 KM n/a n/a VP1183
Purge VolumeRun #1 5.0 mlRun #2 5.0 ml
CAS No. Compound Result PQL MDL Units Q
75-69-4 Trichlorofluoromethane 3910 a 100 25 ug/l
CAS No. Surrogate Recoveries Run# 1 Run# 2 Limits
1868-53-7 Dibromofluoromethane 100% 97% 83-118%17060-07-0 1,2-Dichloroethane-D4 105% 102% 79-125%2037-26-5 Toluene-D8 98% 101% 85-112%460-00-4 4-Bromofluorobenzene 105% 104% 83-118%
(a) Result is from Run# 2
U = Not detected MDL = Method Detection Limit I = Result >= MDL but < PQL J = Estimated valuePQL = Practical Quantitation Limit V = Indicates analyte found in associated method blankL = Indicates value exceeds calibration range N = Indicates presumptive evidence of a compound
7 of 13FA23260
44.1

Accutest LabLink@165007 11:38 21-Dec-2015
Report of Analysis Page 1 of 1
Client Sample ID: HMF-NLP-MW0005-037.7-2015331 Lab Sample ID: FA23260-2 Date Sampled: 03/31/15 Matrix: AQ - Ground Water Date Received: 04/01/15 Method: SW846 8260B Percent Solids: n/a Project: HMF
File ID DF Analyzed By Prep Date Prep Batch Analytical BatchRun #1 P31780.D 1 04/10/15 KM n/a n/a VP1182Run #2 P31812.D 10 04/13/15 KM n/a n/a VP1183
Purge VolumeRun #1 5.0 mlRun #2 5.0 ml
CAS No. Compound Result PQL MDL Units Q
75-69-4 Trichlorofluoromethane 489 a 20 5.0 ug/l
CAS No. Surrogate Recoveries Run# 1 Run# 2 Limits
1868-53-7 Dibromofluoromethane 101% 99% 83-118%17060-07-0 1,2-Dichloroethane-D4 105% 103% 79-125%2037-26-5 Toluene-D8 100% 101% 85-112%460-00-4 4-Bromofluorobenzene 104% 105% 83-118%
(a) Result is from Run# 2
U = Not detected MDL = Method Detection Limit I = Result >= MDL but < PQL J = Estimated valuePQL = Practical Quantitation Limit V = Indicates analyte found in associated method blankL = Indicates value exceeds calibration range N = Indicates presumptive evidence of a compound
8 of 13FA23260
44.2

Accutest LabLink@165007 11:38 21-Dec-2015
Report of Analysis Page 1 of 1
Client Sample ID: HMF-NLP-MW0001I-037.5-2015331 Lab Sample ID: FA23260-3 Date Sampled: 03/31/15 Matrix: AQ - Ground Water Date Received: 04/01/15 Method: SW846 8260B Percent Solids: n/a Project: HMF
File ID DF Analyzed By Prep Date Prep Batch Analytical BatchRun #1 a P31781.D 1 04/10/15 KM n/a n/a VP1182Run #2
Purge VolumeRun #1 5.0 mlRun #2
CAS No. Compound Result PQL MDL Units Q
75-69-4 Trichlorofluoromethane 2.3 2.0 0.50 ug/l
CAS No. Surrogate Recoveries Run# 1 Run# 2 Limits
1868-53-7 Dibromofluoromethane 100% 83-118%17060-07-0 1,2-Dichloroethane-D4 106% 79-125%2037-26-5 Toluene-D8 98% 85-112%460-00-4 4-Bromofluorobenzene 106% 83-118%
(a) Sample was treated with an anti-foaming agent.
U = Not detected MDL = Method Detection Limit I = Result >= MDL but < PQL J = Estimated valuePQL = Practical Quantitation Limit V = Indicates analyte found in associated method blankL = Indicates value exceeds calibration range N = Indicates presumptive evidence of a compound
9 of 13FA23260
44.3

Accutest LabLink@165007 11:38 21-Dec-2015
Report of Analysis Page 1 of 1
Client Sample ID: HMF-NLP-MW0001S-008.5-2015331 Lab Sample ID: FA23260-4 Date Sampled: 03/31/15 Matrix: AQ - Ground Water Date Received: 04/01/15 Method: SW846 8260B Percent Solids: n/a Project: HMF
File ID DF Analyzed By Prep Date Prep Batch Analytical BatchRun #1 P31782.D 1 04/10/15 KM n/a n/a VP1182Run #2 P31813.D 5 04/13/15 KM n/a n/a VP1183
Purge VolumeRun #1 5.0 mlRun #2 5.0 ml
CAS No. Compound Result PQL MDL Units Q
75-69-4 Trichlorofluoromethane 81.4 a 10 2.5 ug/l
CAS No. Surrogate Recoveries Run# 1 Run# 2 Limits
1868-53-7 Dibromofluoromethane 101% 102% 83-118%17060-07-0 1,2-Dichloroethane-D4 106% 106% 79-125%2037-26-5 Toluene-D8 100% 100% 85-112%460-00-4 4-Bromofluorobenzene 105% 104% 83-118%
(a) Result is from Run# 2
U = Not detected MDL = Method Detection Limit I = Result >= MDL but < PQL J = Estimated valuePQL = Practical Quantitation Limit V = Indicates analyte found in associated method blankL = Indicates value exceeds calibration range N = Indicates presumptive evidence of a compound
10 of 13FA23260
44.4

Accutest LabLink@165007 11:38 21-Dec-2015
Misc. Forms
Custody Documents and Other Forms
Includes the following where applicable:
• Chain of Custody
Southeast
Section 5
11 of 13FA23260
5

FA23260: Chain of CustodyPage 1 of 2
12 of 13FA23260
55.1

FA23260: Chain of CustodyPage 2 of 2
13 of 13FA23260
55.1

117th MONTH: JUNE 2014 – SDG FA25567

12/21/15
Technical Report for
Tetra Tech NUS
HMF
112G06773
Accutest Job Number: FA25567
Sampling Date: 06/25/15
Report to:
Tetra Tech, NUS
ATTN: Mark Jonnet
Total number of pages in report:
Certifications: FL (E83510), LA (03051), KS (E-10327), IA (366), IL (200063), NC (573), NJ (FL002), SC (96038001)
DoD ELAP (L-A-B L2229), CA (2937), TX (T104704404), PA (68-03573), VA (460177),
AK, AR, GA, KY, MA, NV, OK, UT, WA
This report shall not be reproduced, except in its entirety, without the written approval of Accutest Laboratories.
Test results relate only to samples analyzed.
Southeast • 4405 Vineland Road • Suite C-15 • Orlando, FL 32811 • tel: 407-425-6700 • fax: 407-425-0707 • http://www.accutest.com
Test results contained within this data package meet the requirements
of the National Environmental Laboratory Accreditation Program
and/or state specific certification programs as applicable.
Client Service contact: Andrea Colby 407-425-6700
Norm FarmerTechnical Director
Southeast
12/21/15
e-Hardcopy 2.0Automated Report
13
Accutest Laboratories is the sole authority for authorizing edits or modifications to thisdocument. Unauthorized modification of this report is strictly prohibited.
1 of 13FA25567

Table of Contents-1-
Sections:
Section 1: Sample Summary ................................................................................................... 3Section 2: Case Narrative/Conformance Summary .............................................................. 4Section 3: Summary of Hits .................................................................................................... 5Section 4: Sample Results ........................................................................................................ 6
4.1: FA25567-1: HMF-NLP-MW0005I-37.0-20150625 ..................................................... 74.2: FA25567-2: HMF-NLP-IW0004I-37.5-20150625 ....................................................... 84.3: FA25567-3: HMF-NLP-IW0001S-008.5-20150625 .................................................... 94.4: FA25567-4: HMF-NLP-IW0001I-37.5-20150625 ....................................................... 10
Section 5: Misc. Forms ............................................................................................................ 115.1: Chain of Custody ........................................................................................................... 12
12
34
5
2 of 13FA25567

Accutest LabLink@165007 11:37 21-Dec-2015
Sample Summary
Tetra Tech NUSJob No: FA25567
HMFProject No: 112G06773
Sample Collected Matrix Client Number Date Time By Received Code Type Sample ID
FA25567-1 06/25/15 11:35 RL 06/27/15 AQ Ground Water HMF-NLP-MW0005I-37.0-20150625
FA25567-2 06/25/15 12:45 RL 06/27/15 AQ Ground Water HMF-NLP-IW0004I-37.5-20150625
FA25567-3 06/25/15 13:35 RL 06/27/15 AQ Ground Water HMF-NLP-IW0001S-008.5-20150625
FA25567-4 06/25/15 16:30 RL 06/27/15 AQ Ground Water HMF-NLP-IW0001I-37.5-20150625
3 of 13FA25567
1

SAMPLE DELIVERY GROUP CASE NARRATIVE Client: Tetra Tech NUS Job No: FA25567 Site: HMF Report Date 7/13/2015 10:43:18 AM 4 Samples were collected on 06/25/2015 and were received at Accutest SE on 06/27/2015 properly preserved, at 3.2 Deg. C and intact. These Samples received an Accutest job number of FA25567. A listing of the Laboratory Sample ID, Client Sample ID and dates of collection are presented in the Results Summary Section of this report.
Except as noted below, all method specified calibrations and quality control performance criteria were met for this job. For more information, please refer to QC summary pages.
Volatiles by GCMS By Method SW846 8260B Matrix: AQ Batch ID: VB4320 All samples were analyzed within the recommended method holding time. All method blanks for this batch meet method specific criteria. Sample(s) FA25608-5MS, FA25608-5MSD were used as the QC samples indicated. Matrix: AQ Batch ID: VI767 All samples were analyzed within the recommended method holding time. All method blanks for this batch meet method specific criteria. Sample(s) FA25541-15MS, FA25541-15MSD were used as the QC samples indicated. Sample(s) FA25541-15MSD has surrogates outside control limits. Probable cause is due to matrix interference. Accutest Laboratories Southeast (ALSE) certifies that this report meets the project requirements for analytical data produced for the samples as received at ALSE and as stated on the COC. ALSE certifies that the data meets the Data Quality Objectives for precision, accuracy and completeness as specified in the ALSE Quality Manual except as noted above. This report is to be used in its entirety. ALSE is not responsible for any assumptions of data quality if partial data packages are used Narrative prepared by: ______________________________________ Date: July 13, 2015 Lovelie Metzgar, QA Officer (signature on file) Manual Integration Summary
Lab Sample ID Analysis Type File ID Manual Integrations FA25541-15MS MSVOA I31366.D Carbon Tetrachloride FA25541-15MSD MSVOA I31367.D Carbon Tetrachloride FA25567-4 MSVOA B106761.D Trichlorofluoromethane VB4317-IC4317 MSVOA B106670.D tert-Butylbenzene VB4317-ICC4317 MSVOA B106668.D Methylcyclohexane VB4320-CC4317 MSVOA B106751.D cis-1,2-Dichloroethylene VI765-IC765 MSVOA I31270.D 1,4-Dichlorobenzene, Acetone VI765-IC765 MSVOA I31271.D Carbon Tetrachloride VI765-IC765 MSVOA I31272.D Carbon Tetrachloride VI765-IC765 MSVOA I31274.D Carbon Tetrachloride VI765-IC765 MSVOA I31275.D Carbon Tetrachloride VI765-ICC765 MSVOA I31273.D Carbon Tetrachloride VI765-ICV765 MSVOA I31281.D Carbon Tetrachloride VI767-BS MSVOA I31342.D Carbon Tetrachloride VI767-CC765 MSVOA I31340.D Carbon Tetrachloride
15 Manual Integrations were found for FA25567
Monday, July 13, 2015 Page 1 of 1
4 of 13FA25567
2

Summary of Hits Page 1 of 1 Job Number: FA25567Account: Tetra Tech NUSProject: HMFCollected: 06/25/15
Lab Sample ID Client Sample ID Result/Analyte Qual PQL MDL Units Method
FA25567-1 HMF-NLP-MW0005I-37.0-20150625
Trichlorofluoromethane 377 20 5.0 ug/l SW846 8260B
FA25567-2 HMF-NLP-IW0004I-37.5-20150625
Trichlorofluoromethane 4670 100 25 ug/l SW846 8260B
FA25567-3 HMF-NLP-IW0001S-008.5-20150625
Trichlorofluoromethane 117 10 2.5 ug/l SW846 8260B
FA25567-4 HMF-NLP-IW0001I-37.5-20150625
Trichlorofluoromethane 0.86 I 2.0 0.50 ug/l SW846 8260B
5 of 13FA25567
3
Accutest LabLink@165007 11:37 21-Dec-2015
Sample Results
Report of Analysis
Southeast
Section 4
6 of 13FA25567
4

Accutest LabLink@165007 11:37 21-Dec-2015
Report of Analysis Page 1 of 1
Client Sample ID: HMF-NLP-MW0005I-37.0-20150625 Lab Sample ID: FA25567-1 Date Sampled: 06/25/15 Matrix: AQ - Ground Water Date Received: 06/27/15 Method: SW846 8260B Percent Solids: n/a Project: HMF
File ID DF Analyzed By Prep Date Prep Batch Analytical BatchRun #1 I31361.D 1 07/08/15 WV n/a n/a VI767Run #2 B106758.D 10 07/08/15 WV n/a n/a VB4320
Purge VolumeRun #1 5.0 mlRun #2 5.0 ml
CAS No. Compound Result PQL MDL Units Q
75-69-4 Trichlorofluoromethane 377 a 20 5.0 ug/l
CAS No. Surrogate Recoveries Run# 1 Run# 2 Limits
1868-53-7 Dibromofluoromethane 102% 99% 83-118%17060-07-0 1,2-Dichloroethane-D4 100% 104% 79-125%2037-26-5 Toluene-D8 100% 104% 85-112%460-00-4 4-Bromofluorobenzene 100% 110% 83-118%
(a) Result is from Run# 2
U = Not detected MDL = Method Detection Limit I = Result >= MDL but < PQL J = Estimated valuePQL = Practical Quantitation Limit V = Indicates analyte found in associated method blankL = Indicates value exceeds calibration range N = Indicates presumptive evidence of a compound
7 of 13FA25567
44.1

Accutest LabLink@165007 11:37 21-Dec-2015
Report of Analysis Page 1 of 1
Client Sample ID: HMF-NLP-IW0004I-37.5-20150625 Lab Sample ID: FA25567-2 Date Sampled: 06/25/15 Matrix: AQ - Ground Water Date Received: 06/27/15 Method: SW846 8260B Percent Solids: n/a Project: HMF
File ID DF Analyzed By Prep Date Prep Batch Analytical BatchRun #1 I31362.D 1 07/08/15 WV n/a n/a VI767Run #2 B106759.D 50 07/08/15 WV n/a n/a VB4320
Purge VolumeRun #1 5.0 mlRun #2 5.0 ml
CAS No. Compound Result PQL MDL Units Q
75-69-4 Trichlorofluoromethane 4670 a 100 25 ug/l
CAS No. Surrogate Recoveries Run# 1 Run# 2 Limits
1868-53-7 Dibromofluoromethane 107% 100% 83-118%17060-07-0 1,2-Dichloroethane-D4 104% 106% 79-125%2037-26-5 Toluene-D8 97% 105% 85-112%460-00-4 4-Bromofluorobenzene 99% 106% 83-118%
(a) Result is from Run# 2
U = Not detected MDL = Method Detection Limit I = Result >= MDL but < PQL J = Estimated valuePQL = Practical Quantitation Limit V = Indicates analyte found in associated method blankL = Indicates value exceeds calibration range N = Indicates presumptive evidence of a compound
8 of 13FA25567
44.2

Accutest LabLink@165007 11:37 21-Dec-2015
Report of Analysis Page 1 of 1
Client Sample ID: HMF-NLP-IW0001S-008.5-20150625 Lab Sample ID: FA25567-3 Date Sampled: 06/25/15 Matrix: AQ - Ground Water Date Received: 06/27/15 Method: SW846 8260B Percent Solids: n/a Project: HMF
File ID DF Analyzed By Prep Date Prep Batch Analytical BatchRun #1 I31363.D 1 07/08/15 WV n/a n/a VI767Run #2 B106760.D 5 07/08/15 WV n/a n/a VB4320
Purge VolumeRun #1 5.0 mlRun #2 5.0 ml
CAS No. Compound Result PQL MDL Units Q
75-69-4 Trichlorofluoromethane 117 a 10 2.5 ug/l
CAS No. Surrogate Recoveries Run# 1 Run# 2 Limits
1868-53-7 Dibromofluoromethane 104% 102% 83-118%17060-07-0 1,2-Dichloroethane-D4 105% 106% 79-125%2037-26-5 Toluene-D8 99% 105% 85-112%460-00-4 4-Bromofluorobenzene 99% 97% 83-118%
(a) Result is from Run# 2
U = Not detected MDL = Method Detection Limit I = Result >= MDL but < PQL J = Estimated valuePQL = Practical Quantitation Limit V = Indicates analyte found in associated method blankL = Indicates value exceeds calibration range N = Indicates presumptive evidence of a compound
9 of 13FA25567
44.3

Accutest LabLink@165007 11:37 21-Dec-2015
Report of Analysis Page 1 of 1
Client Sample ID: HMF-NLP-IW0001I-37.5-20150625 Lab Sample ID: FA25567-4 Date Sampled: 06/25/15 Matrix: AQ - Ground Water Date Received: 06/27/15 Method: SW846 8260B Percent Solids: n/a Project: HMF
File ID DF Analyzed By Prep Date Prep Batch Analytical BatchRun #1 B106761.D 1 07/08/15 WV n/a n/a VB4320Run #2
Purge VolumeRun #1 5.0 mlRun #2
CAS No. Compound Result PQL MDL Units Q
75-69-4 Trichlorofluoromethane 0.86 2.0 0.50 ug/l I
CAS No. Surrogate Recoveries Run# 1 Run# 2 Limits
1868-53-7 Dibromofluoromethane 98% 83-118%17060-07-0 1,2-Dichloroethane-D4 106% 79-125%2037-26-5 Toluene-D8 104% 85-112%460-00-4 4-Bromofluorobenzene 102% 83-118%
U = Not detected MDL = Method Detection Limit I = Result >= MDL but < PQL J = Estimated valuePQL = Practical Quantitation Limit V = Indicates analyte found in associated method blankL = Indicates value exceeds calibration range N = Indicates presumptive evidence of a compound
10 of 13FA25567
44.4

Accutest LabLink@165007 11:37 21-Dec-2015
Misc. Forms
Custody Documents and Other Forms
Includes the following where applicable:
• Chain of Custody
Southeast
Section 5
11 of 13FA25567
5

FA25567: Chain of CustodyPage 1 of 2
12 of 13FA25567
55.1

FA25567: Chain of CustodyPage 2 of 2
13 of 13FA25567
55.1

120th MONTH: SEPTEMBER 2015 – SDG FA27924

12/21/15
Technical Report for
Tetra Tech NUS
HMF
112G06773
Accutest Job Number: FA27924
Sampling Date: 09/23/15
Report to:
Tetra Tech, NUS
ATTN: Mark Jonnet
Total number of pages in report:
Certifications: FL (E83510), LA (03051), KS (E-10327), IA (366), IL (200063), NC (573), NJ (FL002), SC (96038001)
DoD ELAP (L-A-B L2229), CA (2937), TX (T104704404), PA (68-03573), VA (460177),
AK, AR, GA, KY, MA, NV, OK, UT, WA
This report shall not be reproduced, except in its entirety, without the written approval of Accutest Laboratories.
Test results relate only to samples analyzed.
Southeast • 4405 Vineland Road • Suite C-15 • Orlando, FL 32811 • tel: 407-425-6700 • fax: 407-425-0707 • http://www.accutest.com
Test results contained within this data package meet the requirements
of the National Environmental Laboratory Accreditation Program
and/or state specific certification programs as applicable.
Client Service contact: Andrea Colby 407-425-6700
Norm FarmerTechnical Director
Southeast
12/21/15
e-Hardcopy 2.0Automated Report
19
Accutest Laboratories is the sole authority for authorizing edits or modifications to thisdocument. Unauthorized modification of this report is strictly prohibited.
1 of 19FA27924

Table of Contents-1-
Sections:
Section 1: Sample Summary ................................................................................................... 3Section 2: Case Narrative/Conformance Summary .............................................................. 4Section 3: Summary of Hits .................................................................................................... 6Section 4: Sample Results ........................................................................................................ 7
4.1: FA27924-1: HMF-NLP-MW0001-008.5-20150923 .................................................... 84.2: FA27924-2: HMF-NLP-MW0001-037.5-20150923 .................................................... 94.3: FA27924-3: HMF-NLP-MW0001-051.5-20150923 .................................................... 104.4: FA27924-4: HMF-NLP-MW0004-037.5-20150923 .................................................... 114.5: FA27924-5: HMF-MW0005-037.5-20150923 ............................................................. 124.6: FA27924-6: HMF-MW0006-037.5-20150923 ............................................................. 134.7: FA27924-7: HMF-MW0007-037.5-20150923 ............................................................. 144.8: FA27924-8: HMF-MW0008-037.5-20150923 ............................................................. 154.9: FA27924-9: HMF-MW0009-037.5-20150923 ............................................................. 16
Section 5: Misc. Forms ............................................................................................................ 175.1: Chain of Custody ........................................................................................................... 18
12
34
5
2 of 19FA27924

Accutest LabLink@165007 11:37 21-Dec-2015
Sample Summary
Tetra Tech NUSJob No: FA27924
HMFProject No: 112G06773
Sample Collected Matrix Client Number Date Time By Received Code Type Sample ID
FA27924-1 09/23/15 08:00 SVRL 09/26/15 AQ Ground Water HMF-NLP-MW0001-008.5-20150923
FA27924-2 09/23/15 08:45 SVRL 09/26/15 AQ Ground Water HMF-NLP-MW0001-037.5-20150923
FA27924-3 09/23/15 09:45 SVRL 09/26/15 AQ Ground Water HMF-NLP-MW0001-051.5-20150923
FA27924-4 09/23/15 10:40 SVRL 09/26/15 AQ Ground Water HMF-NLP-MW0004-037.5-20150923
FA27924-5 09/23/15 11:30 SVRL 09/26/15 AQ Ground Water HMF-MW0005-037.5-20150923
FA27924-6 09/23/15 12:25 SVRL 09/26/15 AQ Ground Water HMF-MW0006-037.5-20150923
FA27924-7 09/23/15 15:05 SVRL 09/26/15 AQ Ground Water HMF-MW0007-037.5-20150923
FA27924-8 09/23/15 14:05 SVRL 09/26/15 AQ Ground Water HMF-MW0008-037.5-20150923
FA27924-9 09/23/15 13:10 SVRL 09/26/15 AQ Ground Water HMF-MW0009-037.5-20150923
3 of 19FA27924
1

SAMPLE DELIVERY GROUP CASE NARRATIVE
Client: Tetra Tech NUS Job No: FA27924
Site: HMF Report Date: 10/8/2015 3:10:01 PM 9 Sample(s) were collected on 09/23/2015 and were received at Accutest SE on 09/26/2015 properly preserved, at 3 Deg. C and intact. These Samples received an Accutest job number of FA27924. A listing of the Laboratory Sample ID, Client Sample ID and dates of collection are presented in the Results Summary Section of this report. Except as noted below, all method specified calibrations and quality control performance criteria were met for this job. For more information, please refer to QC summary pages.
Volatiles by GCMS By Method SW846 8260B Matrix: AQ Batch ID: VB4388 All samples were analyzed within the recommended method holding time. All method blanks for this batch meet method specific criteria. Sample(s) FA27924-3MS, FA27924-3MSD were used as the QC samples indicated. Matrix: AQ Batch ID: VB4389 All samples were analyzed within the recommended method holding time. All method blanks for this batch meet method specific criteria. Sample(s) FA27924-4MS, FA27924-4MSD were used as the QC samples indicated. Accutest Laboratories Southeast (ALSE) certifies that this report meets the project requirements for analytical data produced for the samples as received at ALSE and as stated on the COC. ALSE certifies that the data meets the Data Quality Objectives for precision, accuracy and completeness as specified in the ALSE Quality Manual except as noted above. This report is to be used in its entirety. ALSE is not responsible for any assumptions of data quality if partial data packages are used. Narrative prepared by: ______________________________________ Date: October 8, 2015 Kim Benham, Client Services (signature on file) Thursday, October 08, 2015 Page 1 of 2
4 of 19FA27924
2

Manual Integration Summary
Lab Sample ID Analysis Type File ID Manual FA27924-3MS MSVOA B108635.D Trichlorofluoromethane FA27924-3MSD MSVOA B108636.D Trichlorofluoromethane FA27924-4MS MSVOA B108678.D Trichlorofluoromethane FA27924-5 MSVOA B108668.D Trichlorofluoromethane VB4382-IC4382 MSVOA B108459.D 1,3-Butadiene, Isobutyl Alcohol, Methyl Methacrylate, Trichlorofluoromethane VB4382-IC4382 MSVOA B108460.D 1,3-Butadiene, Acetonitrile, Ethyl Alcohol, Isobutyl Alcohol, Methyl Methacrylate, tert-Butylbenzene, Trichlorofluoromethane VB4382-IC4382 MSVOA B108461.D 1,3-Butadiene, Acetonitrile, Chloroprene, Ethyl Alcohol, Isobutyl Alcohol, Methyl Methacrylate, tert-Butylbenzene VB4382-IC4382 MSVOA B108463.D 1,3-Butadiene, Methyl Methacrylate, tert-Butylbenzene, Trichlorofluoromethane VB4382-IC4382 MSVOA B108464.D Acetonitrile, Ethyl Alcohol, Isobutyl Alcohol, Methyl Methacrylate, tert-Butylbenzene, Trichlorofluoromethane VB4382-ICC4382 MSVOA B108462.D 1,3-Butadiene, Acetonitrile, Ethyl Alcohol, Methyl Methacrylate, Trichlorofluoromethane VB4382-ICV4382 MSVOA B108466.D Cyclohexanone, tert-Butylbenzene, Trichlorofluoromethane VB4388-BS MSVOA B108626.D Trichlorofluoromethane VB4389-BS MSVOA B108664.D Trichlorofluoromethane VB4389-IC4389 MSVOA B108656.D 1,2-Dichlorotrifluoroethane, Tert-Butyl Alcohol VB4389-IC4389 MSVOA B108657.D Ethyl Alcohol, Trichlorofluoromethane VB4389-IC4389 MSVOA B108660.D tert-Butylbenzene, Trichlorofluoromethane VB4389-IC4389 MSVOA B108661.D tert-Butylbenzene, Trichlorofluoromethane VB4389-ICV4389 MSVOA B108663.D tert-Butylbenzene, Trichlorofluoromethane
18 Manual Integrations were found for FA27924
Thursday, October 08, 2015 Page 2 of 2
5 of 19FA27924
2

Summary of Hits Page 1 of 1 Job Number: FA27924Account: Tetra Tech NUSProject: HMFCollected: 09/23/15
Lab Sample ID Client Sample ID Result/Analyte Qual PQL MDL Units Method
FA27924-1 HMF-NLP-MW0001-008.5-20150923
Trichlorofluoromethane 52.0 2.0 0.50 ug/l SW846 8260B
FA27924-2 HMF-NLP-MW0001-037.5-20150923
No hits reported in this sample.
FA27924-3 HMF-NLP-MW0001-051.5-20150923
Trichlorofluoromethane 3.1 2.0 0.50 ug/l SW846 8260B
FA27924-4 HMF-NLP-MW0004-037.5-20150923
Trichlorofluoromethane 5410 400 100 ug/l SW846 8260B
FA27924-5 HMF-MW0005-037.5-20150923
Trichlorofluoromethane 568 20 5.0 ug/l SW846 8260B
FA27924-6 HMF-MW0006-037.5-20150923
No hits reported in this sample.
FA27924-7 HMF-MW0007-037.5-20150923
No hits reported in this sample.
FA27924-8 HMF-MW0008-037.5-20150923
No hits reported in this sample.
FA27924-9 HMF-MW0009-037.5-20150923
No hits reported in this sample.
6 of 19FA27924
3

Accutest LabLink@165007 11:37 21-Dec-2015
Sample Results
Report of Analysis
Southeast
Section 4
7 of 19FA27924
4

Accutest LabLink@165007 11:37 21-Dec-2015
Report of Analysis Page 1 of 1
Client Sample ID: HMF-NLP-MW0001-008.5-20150923 Lab Sample ID: FA27924-1 Date Sampled: 09/23/15 Matrix: AQ - Ground Water Date Received: 09/26/15 Method: SW846 8260B Percent Solids: n/a Project: HMF
File ID DF Analyzed By Prep Date Prep Batch Analytical BatchRun #1 B108628.D 1 10/06/15 WV n/a n/a VB4388Run #2
Purge VolumeRun #1 5.0 mlRun #2
CAS No. Compound Result PQL MDL Units Q
75-69-4 Trichlorofluoromethane 52.0 2.0 0.50 ug/l
CAS No. Surrogate Recoveries Run# 1 Run# 2 Limits
1868-53-7 Dibromofluoromethane 103% 83-118%17060-07-0 1,2-Dichloroethane-D4 99% 79-125%2037-26-5 Toluene-D8 98% 85-112%460-00-4 4-Bromofluorobenzene 102% 83-118%
U = Not detected MDL = Method Detection Limit I = Result >= MDL but < PQL J = Estimated valuePQL = Practical Quantitation Limit V = Indicates analyte found in associated method blankL = Indicates value exceeds calibration range N = Indicates presumptive evidence of a compound
8 of 19FA27924
44.1

Accutest LabLink@165007 11:37 21-Dec-2015
Report of Analysis Page 1 of 1
Client Sample ID: HMF-NLP-MW0001-037.5-20150923 Lab Sample ID: FA27924-2 Date Sampled: 09/23/15 Matrix: AQ - Ground Water Date Received: 09/26/15 Method: SW846 8260B Percent Solids: n/a Project: HMF
File ID DF Analyzed By Prep Date Prep Batch Analytical BatchRun #1 B108629.D 1 10/06/15 WV n/a n/a VB4388Run #2
Purge VolumeRun #1 5.0 mlRun #2
CAS No. Compound Result PQL MDL Units Q
75-69-4 Trichlorofluoromethane 0.50 U 2.0 0.50 ug/l
CAS No. Surrogate Recoveries Run# 1 Run# 2 Limits
1868-53-7 Dibromofluoromethane 101% 83-118%17060-07-0 1,2-Dichloroethane-D4 98% 79-125%2037-26-5 Toluene-D8 98% 85-112%460-00-4 4-Bromofluorobenzene 101% 83-118%
U = Not detected MDL = Method Detection Limit I = Result >= MDL but < PQL J = Estimated valuePQL = Practical Quantitation Limit V = Indicates analyte found in associated method blankL = Indicates value exceeds calibration range N = Indicates presumptive evidence of a compound
9 of 19FA27924
44.2

Accutest LabLink@165007 11:37 21-Dec-2015
Report of Analysis Page 1 of 1
Client Sample ID: HMF-NLP-MW0001-051.5-20150923 Lab Sample ID: FA27924-3 Date Sampled: 09/23/15 Matrix: AQ - Ground Water Date Received: 09/26/15 Method: SW846 8260B Percent Solids: n/a Project: HMF
File ID DF Analyzed By Prep Date Prep Batch Analytical BatchRun #1 B108630.D 1 10/06/15 WV n/a n/a VB4388Run #2
Purge VolumeRun #1 5.0 mlRun #2
CAS No. Compound Result PQL MDL Units Q
75-69-4 Trichlorofluoromethane 3.1 2.0 0.50 ug/l
CAS No. Surrogate Recoveries Run# 1 Run# 2 Limits
1868-53-7 Dibromofluoromethane 103% 83-118%17060-07-0 1,2-Dichloroethane-D4 100% 79-125%2037-26-5 Toluene-D8 101% 85-112%460-00-4 4-Bromofluorobenzene 103% 83-118%
U = Not detected MDL = Method Detection Limit I = Result >= MDL but < PQL J = Estimated valuePQL = Practical Quantitation Limit V = Indicates analyte found in associated method blankL = Indicates value exceeds calibration range N = Indicates presumptive evidence of a compound
10 of 19FA27924
44.3

Accutest LabLink@165007 11:37 21-Dec-2015
Report of Analysis Page 1 of 1
Client Sample ID: HMF-NLP-MW0004-037.5-20150923 Lab Sample ID: FA27924-4 Date Sampled: 09/23/15 Matrix: AQ - Ground Water Date Received: 09/26/15 Method: SW846 8260B Percent Solids: n/a Project: HMF
File ID DF Analyzed By Prep Date Prep Batch Analytical BatchRun #1 B108667.D 200 10/07/15 WV n/a n/a VB4389Run #2
Purge VolumeRun #1 5.0 mlRun #2
CAS No. Compound Result PQL MDL Units Q
75-69-4 Trichlorofluoromethane 5410 400 100 ug/l
CAS No. Surrogate Recoveries Run# 1 Run# 2 Limits
1868-53-7 Dibromofluoromethane 98% 83-118%17060-07-0 1,2-Dichloroethane-D4 103% 79-125%2037-26-5 Toluene-D8 99% 85-112%460-00-4 4-Bromofluorobenzene 100% 83-118%
U = Not detected MDL = Method Detection Limit I = Result >= MDL but < PQL J = Estimated valuePQL = Practical Quantitation Limit V = Indicates analyte found in associated method blankL = Indicates value exceeds calibration range N = Indicates presumptive evidence of a compound
11 of 19FA27924
44.4

Accutest LabLink@165007 11:37 21-Dec-2015
Report of Analysis Page 1 of 1
Client Sample ID: HMF-MW0005-037.5-20150923 Lab Sample ID: FA27924-5 Date Sampled: 09/23/15 Matrix: AQ - Ground Water Date Received: 09/26/15 Method: SW846 8260B Percent Solids: n/a Project: HMF
File ID DF Analyzed By Prep Date Prep Batch Analytical BatchRun #1 B108668.D 10 10/07/15 WV n/a n/a VB4389Run #2
Purge VolumeRun #1 5.0 mlRun #2
CAS No. Compound Result PQL MDL Units Q
75-69-4 Trichlorofluoromethane 568 20 5.0 ug/l
CAS No. Surrogate Recoveries Run# 1 Run# 2 Limits
1868-53-7 Dibromofluoromethane 104% 83-118%17060-07-0 1,2-Dichloroethane-D4 107% 79-125%2037-26-5 Toluene-D8 104% 85-112%460-00-4 4-Bromofluorobenzene 104% 83-118%
U = Not detected MDL = Method Detection Limit I = Result >= MDL but < PQL J = Estimated valuePQL = Practical Quantitation Limit V = Indicates analyte found in associated method blankL = Indicates value exceeds calibration range N = Indicates presumptive evidence of a compound
12 of 19FA27924
44.5

Accutest LabLink@165007 11:37 21-Dec-2015
Report of Analysis Page 1 of 1
Client Sample ID: HMF-MW0006-037.5-20150923 Lab Sample ID: FA27924-6 Date Sampled: 09/23/15 Matrix: AQ - Ground Water Date Received: 09/26/15 Method: SW846 8260B Percent Solids: n/a Project: HMF
File ID DF Analyzed By Prep Date Prep Batch Analytical BatchRun #1 B108633.D 1 10/06/15 WV n/a n/a VB4388Run #2
Purge VolumeRun #1 5.0 mlRun #2
CAS No. Compound Result PQL MDL Units Q
75-69-4 Trichlorofluoromethane 0.50 U 2.0 0.50 ug/l
CAS No. Surrogate Recoveries Run# 1 Run# 2 Limits
1868-53-7 Dibromofluoromethane 103% 83-118%17060-07-0 1,2-Dichloroethane-D4 102% 79-125%2037-26-5 Toluene-D8 102% 85-112%460-00-4 4-Bromofluorobenzene 103% 83-118%
U = Not detected MDL = Method Detection Limit I = Result >= MDL but < PQL J = Estimated valuePQL = Practical Quantitation Limit V = Indicates analyte found in associated method blankL = Indicates value exceeds calibration range N = Indicates presumptive evidence of a compound
13 of 19FA27924
44.6

Accutest LabLink@165007 11:37 21-Dec-2015
Report of Analysis Page 1 of 1
Client Sample ID: HMF-MW0007-037.5-20150923 Lab Sample ID: FA27924-7 Date Sampled: 09/23/15 Matrix: AQ - Ground Water Date Received: 09/26/15 Method: SW846 8260B Percent Solids: n/a Project: HMF
File ID DF Analyzed By Prep Date Prep Batch Analytical BatchRun #1 B108640.D 1 10/06/15 WV n/a n/a VB4388Run #2
Purge VolumeRun #1 5.0 mlRun #2
CAS No. Compound Result PQL MDL Units Q
75-69-4 Trichlorofluoromethane 0.50 U 2.0 0.50 ug/l
CAS No. Surrogate Recoveries Run# 1 Run# 2 Limits
1868-53-7 Dibromofluoromethane 98% 83-118%17060-07-0 1,2-Dichloroethane-D4 105% 79-125%2037-26-5 Toluene-D8 101% 85-112%460-00-4 4-Bromofluorobenzene 105% 83-118%
U = Not detected MDL = Method Detection Limit I = Result >= MDL but < PQL J = Estimated valuePQL = Practical Quantitation Limit V = Indicates analyte found in associated method blankL = Indicates value exceeds calibration range N = Indicates presumptive evidence of a compound
14 of 19FA27924
44.7

Accutest LabLink@165007 11:37 21-Dec-2015
Report of Analysis Page 1 of 1
Client Sample ID: HMF-MW0008-037.5-20150923 Lab Sample ID: FA27924-8 Date Sampled: 09/23/15 Matrix: AQ - Ground Water Date Received: 09/26/15 Method: SW846 8260B Percent Solids: n/a Project: HMF
File ID DF Analyzed By Prep Date Prep Batch Analytical BatchRun #1 B108644.D 1 10/06/15 WV n/a n/a VB4388Run #2
Purge VolumeRun #1 5.0 mlRun #2
CAS No. Compound Result PQL MDL Units Q
75-69-4 Trichlorofluoromethane 0.50 U 2.0 0.50 ug/l
CAS No. Surrogate Recoveries Run# 1 Run# 2 Limits
1868-53-7 Dibromofluoromethane 100% 83-118%17060-07-0 1,2-Dichloroethane-D4 100% 79-125%2037-26-5 Toluene-D8 102% 85-112%460-00-4 4-Bromofluorobenzene 109% 83-118%
U = Not detected MDL = Method Detection Limit I = Result >= MDL but < PQL J = Estimated valuePQL = Practical Quantitation Limit V = Indicates analyte found in associated method blankL = Indicates value exceeds calibration range N = Indicates presumptive evidence of a compound
15 of 19FA27924
44.8

Accutest LabLink@165007 11:37 21-Dec-2015
Report of Analysis Page 1 of 1
Client Sample ID: HMF-MW0009-037.5-20150923 Lab Sample ID: FA27924-9 Date Sampled: 09/23/15 Matrix: AQ - Ground Water Date Received: 09/26/15 Method: SW846 8260B Percent Solids: n/a Project: HMF
File ID DF Analyzed By Prep Date Prep Batch Analytical BatchRun #1 B108649.D 1 10/06/15 WV n/a n/a VB4388Run #2
Purge VolumeRun #1 5.0 mlRun #2
CAS No. Compound Result PQL MDL Units Q
75-69-4 Trichlorofluoromethane 0.50 U 2.0 0.50 ug/l
CAS No. Surrogate Recoveries Run# 1 Run# 2 Limits
1868-53-7 Dibromofluoromethane 102% 83-118%17060-07-0 1,2-Dichloroethane-D4 103% 79-125%2037-26-5 Toluene-D8 104% 85-112%460-00-4 4-Bromofluorobenzene 104% 83-118%
U = Not detected MDL = Method Detection Limit I = Result >= MDL but < PQL J = Estimated valuePQL = Practical Quantitation Limit V = Indicates analyte found in associated method blankL = Indicates value exceeds calibration range N = Indicates presumptive evidence of a compound
16 of 19FA27924
44.9

Accutest LabLink@165007 11:37 21-Dec-2015
Misc. Forms
Custody Documents and Other Forms
Includes the following where applicable:
• Chain of Custody
Southeast
Section 5
17 of 19FA27924
5

FA27924: Chain of CustodyPage 1 of 2
18 of 19FA27924
55.1

FA27924: Chain of CustodyPage 2 of 2
19 of 19FA27924
55.1