hygroscopicity of the submicrometer aerosol at the high-alpine site
TRANSCRIPT
Atmos. Chem. Phys., 8, 5715–5729, 2008www.atmos-chem-phys.net/8/5715/2008/© Author(s) 2008. This work is distributed underthe Creative Commons Attribution 3.0 License.
AtmosphericChemistry
and Physics
Hygroscopicity of the submicrometer aerosol at the high-alpine siteJungfraujoch, 3580 m a.s.l., Switzerland
S. Sjogren1, M. Gysel1, E. Weingartner1, M. R. Alfarra 1, J. Duplissy1, J. Cozic1, J. Crosier2, H. Coe2, andU. Baltensperger1
1Laboratory of Atmospheric Chemistry, Paul Scherrer Institut, 5232 Villigen, Switzerland2School of Earth, Atmospheric and Environmental Science, University of Manchester, Manchester, UK
Received: 16 August 2007 – Published in Atmos. Chem. Phys. Discuss.: 19 September 2007Revised: 7 July 2008 – Accepted: 21 July 2008 – Published: 30 September 2008
Abstract. Data from measurements of hygroscopic growthof submicrometer aerosol with a hygroscopicity tandem dif-ferential mobility analyzer (HTDMA) during four campaignsat the high alpine research station Jungfraujoch, Switzerland,are presented. The campaigns took place during the years2000, 2002, 2004 and 2005, each lasting approximately onemonth. Hygroscopic growth factors (GF, i.e. the relativechange in particle diameter from dry diameter,D0, to diam-eter measured at higher relative humidity, RH) are presentedfor three distinct air mass types, namely for: 1) free tropo-spheric winter conditions, 2) planetary boundary layer influ-enced air masses (during a summer period) and 3) Saharandust events (SDE). TheGF values at 85% RH (D0=100 nm)were 1.40±0.11 and 1.29±0.08 for the first two situationswhile for SDE a bimodalGF distribution was often found.No phase changes were observed when the RH was variedbetween 10–90%, and the continuous water uptake could bewell described with a single-parameter empirical model. Thefrequency distributions of the average hygroscopic growthfactors and the width of the retrieved growth factor distri-butions (indicating whether the aerosol is internally or exter-nally mixed) are presented, which can be used for modelingpurposes.
Measurements of size resolved chemical compositionwere performed with an aerosol mass spectrometer in par-allel to theGF measurements. This made it possible to esti-mate the apparent ensemble meanGF of the organics (GForg)using inverse ZSR (Zdanovskii-Stokes-Robinson) modeling.GForg was found to be∼1.20 ataw=0.85, which is at the up-per end of previous laboratory and field data though still inagreement with the highly aged and oxidized nature of theJungfraujoch aerosol.
Correspondence to:E. Weingartner([email protected])
1 Introduction
Aerosol particles in the atmosphere affect the earth’s radi-ation balance in various ways (e.g. Solomon et al., 2007).Firstly, aerosol particles absorb and scatter radiation. This di-rect aerosol effect is influenced by the hygroscopicity of theaerosol particles, which is determined mainly by their chemi-cal composition. Secondly, the tendency for cloud formationand resulting cloud properties similarly depend on chemicalcomposition as well as on size distribution of the aerosol par-ticles (e.g. McFiggans et al., 2006). Thus the cloud albedoand the radiative properties of cloud droplets are influenced;this is termed the indirect aerosol effect. The presence ofparticulate water allows for physical processes (e.g., shapemodification) or heterogeneous chemical reactions, which inturn influences the chemical composition. These processesare commonly referred to as the aging of aerosols.
Aerosols and their properties, such as hygroscopicity, arecurrently modeled in global climate models (GCMs), mostlyto better predict the scattering properties and size distri-bution under varying humidity conditions (Randall et al.,2007). Relatively few measurements of background aerosolfrom the lower free troposphere exist (e.g. Kandler andSchutz, 2007; Swietlicki et al., 2008). To increase avail-able data and validation possibilities four measurement cam-paigns at the high alpine site Jungfraujoch (JFJ), with a du-ration of about one month each, are presented here. During2000, 2002, 2004 and 2005 the CLACE (CLoud andAerosolCharacterizationExperiment) field studies were performedwithin international collaborations, including both summerand winter seasons. The general goals of the field campaignswere i) a physical, chemical, and optical characterization ofthe aerosol at the JFJ in order to better quantify the directaerosol effect, and ii) an investigation of the interaction ofaerosol with clouds, for a better quantification of the indi-rect effect. The cloud forming processes were studied under
Published by Copernicus Publications on behalf of the European Geosciences Union.

5716 S. Sjogren et al.: Aerosol hygroscopicity at Jungfraujoch, Switzerland
different meteorological conditions, with a special focus onaerosol-cloud partitioning in mixed-phase clouds (Cozic etal., 2007; Verheggen et al., 2007). Further topics were thephysical and chemical characterization of ice nuclei (Cozic etal., 2008b; Mertes et al., 2007), and the processes responsiblefor the formation of new particles in the free troposphere. In-strumentation was deployed to characterize the aerosol sizedistribution (scanning particle mobility sizer and optical par-ticle counter), size segregated chemical composition (Aero-dyne aerosol mass spectrometer, AMS) and hygroscopicity(hygroscopicity tandem differential mobility analyzer, HT-DMA). In this study AMS and HTDMA results will be ana-lyzed in greater detail.
Atmospheric aerosol components can be classified into in-organic and organic fractions (e.g. Kanakidou et al., 2005).The hygroscopic properties of most inorganic salts presentin the atmospheric aerosol are known. Of the many organicspecies identified in the aerosol (e.g. Putaud et al., 2004),the hygroscopic properties of quite a few substances havebeen investigated. Inorganic salts (for instance ammoniumsulfate, (NH4)2SO4, and sodium chloride, NaCl, can show ahysteresis behavior during uptake and loss of water, i.e. byexhibiting a difference between the deliquescence and efflo-rescence relative humidities (DRH/ERH), and with a higherwater content of the deliquesced than the effloresced particlesin this relative humidity (RH) range. Conversely, organicconstituents of the aerosol often do not show efflorescencewhich can contribute to an uptake of water at lower RH thanthe DRH of inorganic salts.
A method for characterizing water uptake of aerosol par-ticles is the HTDMA (Liu et al., 1978; Rader and Mc-Murry, 1986; Weingartner et al., 2002). The set-up usedin three of the campaigns was a low-temperature HTDMA(−10◦C during the winter campaigns and 0.5◦C during thesummer campaign), and in the winter campaign 2005 mea-surements were done at laboratory temperature (25–33◦C).Furthermore, measurements with an AMS supplied time-and mass-resolved chemical composition of sulfate, nitrate,ammonium and organics during the campaigns 2002, 2004and 2005. The hygroscopic growth was predicted with theZdanovskii-Stokes-Robinson (ZSR) relation using the mea-sured composition from the AMS (Gysel et al., 2007; Stokesand Robinson, 1966), and compared with the hygroscopicitymeasured by the HTDMA.
2 Methods
2.1 Site and air mass types
The JFJ is a European high-alpine background site located onan exposed mountain col in the Bernese Alps, Switzerland,at 3580 m altitude (46.33◦ N, 7.59◦ E). Throughout the yearthe station is within clouds about one third of the time (Bal-tensperger et al., 1998). During winter it is predominantly
in lower free tropospheric air masses. During summer theaerosol sampled is influenced by injections of air from theplanetary boundary layer (PBL) (Baltensperger et al., 1997;Nyeki et al., 2000). The station is surrounded by glaciersand rocks, and no local vegetation is present. The JFJ boaststhe highest European (electrical) railway station and is eas-ily accessible throughout the year. Within the World Mete-orological Organization (WMO) Global Atmosphere Watch(GAW) program continuous measurements of aerosol param-eters have been performed at the JFJ site since 1995 (Col-laud Coen et al., 2007). The research station is also partof the Swiss National Monitoring Network for Air Pollution(NABEL) and the Swiss Meteorological Institute (SMI).
The aerosol at the JFJ shows an annual cycle with highestmass concentrations in August to July and minimum con-centrations in January to February, furthermore, the organicfraction increases during summer season (e.g. Cozic et al.,2008a; Nyeki et al., 1998; Weingartner et al., 1999). Theseare the major factors influencing the hygroscopic propertiesstudied in this article. Based on comparison with the continu-ous aerosol measurements that are available for the JFJ since1995, campaigns in 2000 and 2004 appear as typical win-ter conditions (with low aerosol concentration present in thefree troposphere), while the campaign in 2002 is typical ofsummer conditions, and the 2005 campaign can be consid-ered as spring-like conditions, with features situated in be-tween winter and summer. In the following, the data are sep-arated accordingly to these cases: non-disturbed lower freetropospheric winter conditions (abbreviated FT) and PBLinfluenced summer conditions (abbreviated PBL INF). Fur-ther, at times the JFJ is influenced by Saharan dust events(SDE). These events were detected according to the methoddescribed by Collaud Coen et al. (2004), which shows thatduring SDE the Angstrom exponent of the single scatteringalbedo (SSA) is negative. This method was also corroboratedby size resolved chemical analysis by ion chromatography,where, during dust events,∼6% of the total calcium concen-tration was found in the PM1 samples. Thus, a third typeof air mass (abbreviated SDE) is distinguished here. Thecriterion used to identify SDE was an Angstrom exponentof the SSA less than−0.1 for more than three hours. Con-versely non-disturbed FT air masses were defined as the pe-riods where the Angstrom exponent of the SSA was positive,and furthermore 1 h around each SDE was removed from thedata to avoid transition periods.
2.2 Measurements
Several different inlets were used during the experiments.During three campaigns an interstitial inlet was operatedwith a PM1 or PM2.5 cyclone and sampled only the intersti-tial submicron-sized aerosol, with hydro-meteors being pre-cipitated in the cyclone. A heated total inlet (25◦C) wasused during the last campaign, which was designed to evap-orate the condensed water from cloud hydro-meteors thus
Atmos. Chem. Phys., 8, 5715–5729, 2008 www.atmos-chem-phys.net/8/5715/2008/
S. Sjogren et al.: Aerosol hygroscopicity at Jungfraujoch, Switzerland 5717
Table 1. Overview of the campaigns.
Dry diameter,D0 [nm]50 100 250
2000–WinterDate 21.02 to 27.03.2000Number of scans* at RH=85% 1698 1855 1648Number of humidograms 11 15 11T setting HTDMA, inlet type −10◦C, interstitial, PM1
2002–SummerDate 08.07 to 17.07.2002Number of scans* at RH=85% 528 746 517Number of humidograms 4 43 4T setting HTDMA, inlet type 0.5◦C, interstitial, PM1
2004–WinterDate 01.03 to 01.04.2004Number of scans* at RH=85% 499 1767 1295Number of humidograms 4 4 4T setting HTDMA, inlet type −10◦C (as well as shortly 20◦C), interstitial, PM2.5
2005–Spring-likeDate 13.02 to 16.03.2005Number of scans* at RH=85% 306 1533 162Number of humidograms 6 6 6T setting HTDMA, inlet type 25◦C, total inlet
*Each scan had a duration of 300 s.
sampling the sum of all particles including both cloud dropletresidual and interstitial particles. The total inlet has an upper50% cut-off diameter of 40µm at wind speeds up to 20 ms−1
according to calculations by Weingartner et al. (1999). Thepercentage of time during which wind speeds above 20 ms−1
were encountered at the site over the last 9 years was low:2.6%. It is important to ensure that the actual cut-off is suf-ficiently large to sample cloud droplets efficiently and thatthe heating does not disturb the particle size distributions.Henning et al. (2002) showed by differentiating size distri-butions measured downstream of both total and interstitialinlets and comparison to cloud microphysical measurements(FSSP) that the total inlet has a sufficient sampling efficiencyfor cloud droplets under the given conditions and that theheating does not otherwise disturb the particle size distribu-tions. The difference in response downstream of the two dif-ferent inlets provides insight into the fractionation of aerosolparticles between the cloud phase and the interstitial phase.Table 1 lists the dates for the campaigns as well as details ofinstruments used and setup of the HTDMA.
2.3 AMS (Aerosol Mass Spectrometer)
An Aerodyne quadruple AMS (Jayne et al., 2000) was usedto provide on-line, quantitative measurements of the totalmass and size distributed non refractory chemical compo-sition of the submicron ambient aerosol at a high temporal
resolution. The instrument works by sampling air through anaerodynamic lens to form a particle beam in a vacuum andaccelerating the focused beam of particles as a function oftheir momentum towards a tungsten heater (550◦C) that flashvaporizes the particles. The volatilization stage is performedadjacent to an electron impact ionizer (about 70 eV) and theions are analyzed by a quadruple mass spectrometer (QMA410, Balzers, Liechtenstein) with unit mass-to-charge (m/z)
resolution. In typical field operation, the AMS alternates be-tween two modes: (i) in the mass-spectrum (MS) mode theaveraged chemical composition of the non-refractory (NR)aerosol ensemble is determined by scanning them/z spec-trum with the quadruple mass spectrometer, without size re-solved information, (ii) using the aerosol time-of-flight (ToF)mode selectedm/z representative of key chemical compo-nents can be resolved as a function of the vacuum aero-dynamic diameter of the particles. More detailed descrip-tions of the AMS measurement principles and various cal-ibrations (Canagaratna et al., 2007; Jayne et al., 2000), itsmodes of operation (Jimenez et al., 2003) and data process-ing and analysis (Allan et al., 2003; Allan et al., 2004) areavailable. The AMS supplies the concentrations of inorganicions, i.e. sulfate, nitrate and ammonium. These ions accountfor 96% of the composition of inorganic ions at the JFJ (Co-zic et al., 2008a; Henning et al., 2003; Krivacsy et al., 2001).Furthermore the total concentration of the organic content is
www.atmos-chem-phys.net/8/5715/2008/ Atmos. Chem. Phys., 8, 5715–5729, 2008
5718 S. Sjogren et al.: Aerosol hygroscopicity at Jungfraujoch, Switzerland
supplied, although no detailed speciation is possible. Massloadings at the JFJ site are generally low. Therefore 3-h av-erages were calculated as a compromise between countingstatistics and time resolution.
2.4 Black carbon concentration
During the first two campaigns 2000 and 2002 the blackcarbon (BC) concentration was measured with an AE31Aethalometer (wavelengthλ=880 nm was used) (Weingart-ner et al., 2003). During the last two campaigns BC was mea-sured with a multiple angle absorption photometer (MAAP,at λ=630 nm) as well as with an AE31 Aethalometer (atλ=880 nm). A mass absorption efficiency of 7.6 m2g−1 forwinter and 11.1 m2g−1 for summer was used for the MAAPdata (Cozic et al., 2008a). BC concentrations from theaethalometer were determined accordingly, taking advantageof a high correlation between these two instruments duringsimultaneous measurements (Cozic et al., 2008a). As no sizeresolved BC measurements were available it was assumedthat the BC fraction in each size range was independent ofsize and thus equal to the BC fraction in PM1 (defined asthe sum of the AMS and the BC data). The choice of themass absorption efficiency for the BC concentration and itssize independence are not critical due to the low sensitiv-ity of the hygroscopicity closure to these assumptions. Themeasured BC volume fraction during the CLACE campaignswas always less than 10%. Therefore even completely ignor-ing BC in the ZSR predicitions increases predictedGFs lessthan 0.02, which is well within our stated uncertainty.
2.5 HTDMA (Hygroscopicity Tandem Differential Mobil-ity Analyzer)
Briefly, the HTDMA functions as follows: a differential mo-bility analyzer (DMA1) selects a monodisperse aerosol sizecut with mobility diameter,D0, under dry conditions. Theaerosol then passes through a humidifier with a controlledhigher RH, and the mobility diameterD is measured witha second DMA (DMA2). The two DMAs are similar tothe TSI 3071 type. The relevant RH in DMA2 was deter-mined by measurement of the system temperature and theDMA2 excess sheath air dew point using a dew point mir-ror (model 2002 Dewprime, EdgeTech). The accuracy of theRH measurement at RH=85% is1RH=±1.1%, with temper-ature gradients<0.1K in DMA2 and an accuracy of the mea-sured temperature difference between dew point and DMA2temperature of±0.2 K. The residence time of the sampledaerosol at the set RH was∼20 s before size measurement(Sjogren et al., 2007). The HTDMAs were employed inslightly different ways during the different campaigns (seeTable 1). In general the HTDMA measured at a constant RHwhich was set to 85%. On occasions the RH-dependenceof the hygroscopic growth was investigated by both increas-ing and decreasing the RH in DMA2 between 10 and 85%.
These are known as the dehydration and hydration modes ofoperation, respectively. This allows for detecting potentialhysteresis effects in the hygroscopic growth behavior withdistinct efflorescence and deliquescence transitions. The hy-dration mode, where the mono-modal dry particles were ex-posed to a monotonically increasing RH in the HTDMA priorto the size measurement in DMA2 (allowing measurementsof DRH), was applied during all campaigns, and is also themode of operation used during measurements at constantRH. The dehydration mode, where the dry particles are firstexposed to RH>80% using a pre-humidifier before mono-tonically lowering the RH towards the RH in DMA2 (Gyselet al., 2004; Sjogren et al., 2007), was mainly applied duringthe 2004 winter campaign (allowing measurements of ERH).
The hygroscopic growth factor (GF) indicates the relativeincrease in mobility diameter of particles due to water ab-sorption at a certain RH, and is defined as
GF(RH)=D(RH)
D0(1)
whereD(RH) is the mobility diameter at a specific RH andD0 is the particle mobility diameter measured under dry con-ditions (91% of the data were with DMA1 at RH<15%.However to increase available data we included periodswhere the RH in DMA1 was up to 35%, where theGF isrelatively low (<1.03) for the ambient aerosol (see below).
Mobility diameter growth factors obtained with an HT-DMA are only equal to volume equivalent growth factors ifthe particles do not change their shape during water uptake.This assumption is justified as the hygroscopicity was char-acterized by a continuous growth curve for the majority ofthe time (see below), thus the particles can be considered liq-uid and consequently roughly spherical at all measured RH.
During the first three campaigns both DMAs and the hu-midifier were inserted in a well-circulated water bath, ensur-ing constant temperature as indicated. The aerosol line wascooled and insulated from the outside of the building to theentry of the first DMA. This ensured that no artifacts duringthe sampling occurred (i.e. volatilization of semi-volatile ma-terial), as the measurements were performed close to ambienttemperatures (Gysel et al., 2002; Weingartner et al., 2002).During the campaign in 2005 the first DMA was maintainedat the laboratory temperature (25–33◦C) and only DMA2was kept at a constant temperature in a water bath (22.8◦C)(Sjogren et al., 2007). This was done because of the func-tionality of the HTDMA used, and because it was deducedfrom the three first campaigns that temperature artifacts werenegligible (i.e. compared to measurement uncertainties). TheHTDMA data were averaged to 3 h, in order to match theAMS time series. The performance of the instruments wasverified with extensive testing with (NH4)2SO4 and NaClbefore the campaigns. During 2004 and 2005 these saltswere also measured at the JFJ. The growth of (NH4)2SO4 andNaCl particles was compared with the theoretical prediction
Atmos. Chem. Phys., 8, 5715–5729, 2008 www.atmos-chem-phys.net/8/5715/2008/
S. Sjogren et al.: Aerosol hygroscopicity at Jungfraujoch, Switzerland 5719
using the Aerosol Diameter-Dependent Equilibrium Model(ADDEM) (Topping et al., 2005a, b), and corresponded towithin less than 0.04 inGF at 85% RH.
2.5.1 Inversion algorithm
Atmospheric particles of a defined dry size typically exhibitdifferent growth factors. This is due to either external mixingof particles in an air sample or variable relative fractions ofdifferent compounds in individual particles (the latter here-inafter referred to as quasi-internally mixed). A mono-modalgrowth distribution without spread can only be expected invery clean and homogeneous air parcels. For further de-tails on mixing states see e.g. Buzorius et al. (2002). Growthfactor probability density functions (GF-PDF, (cGF)) are re-trieved from each measurement, and normalized such that∫
c(GF)dGF=1. The inversion method applied to the rawdata (Gysel et al., 20081) has been tested and applied toambient HTDMA data previously (Gysel et al., 2007; Al-lan et al., 2008). This method uses a full TDMA transferforward function in combination with aχ2 minimization al-gorithm to retrieve the GF-PDF from the measuredGF dis-tribution. This approach is similar to the TDMAfit algo-rithm by Stolzenburg and McMurry (1988) with the differ-ence that the GF-PDF is assumed to be a piecewise linearfunction with fixed support points instead of a superposi-tion of multiple Gaussians. Using a piecewise linear func-tion with fixed support points is similar to the inversion algo-rithm described by Cubison et al. (2005). Here a resolutionof 1GF=0.15 was chosen for the support points. The AMSprovides chemical composition data for the bulk submicronaerosol in the air sample, whereas no information on themixing state of the aerosol is obtained. GF-PDFs obtainedwith the HTDMA provide some information on the mixingstate. The ensemble mean growth factorGF∗ is defined asvolume weighted (3rd-moment) mean growth factor of the
GF-PDF:GF∗=(∫
GF3 c(GF) dGF)1/3
. GF∗ represents thegrowth factor that would be observed if the absorbed waterwas equally distributed among all particles in a sample. ThusGF∗ is the quantity to be compared with growth factor pre-dictions based on bulk chemical composition data obtainedby the AMS (see below), also for externally mixed aerosols.However, this is not the case if a significant mass fractioncannot be measured by the AMS because of large contribu-tions of refractory material such as dust, black carbon or seasalt.
The standard deviationσ of the inverted GF-PDF is usedas a measure for the spread of growth factors. The lowerdetection limit for spread of growth factors isσ=0.10 witha resolution of1GF=0.15 as chosen here for the HTDMAdata inversion. The spread obtained with pure ammonium
1Gysel, M., McFiggans, G. B., and Coe, H.: Inversion ofTandem Differential Mobility Analyser (TDMA) Measurements, J.Aerosol Sci., submitted, 2008.
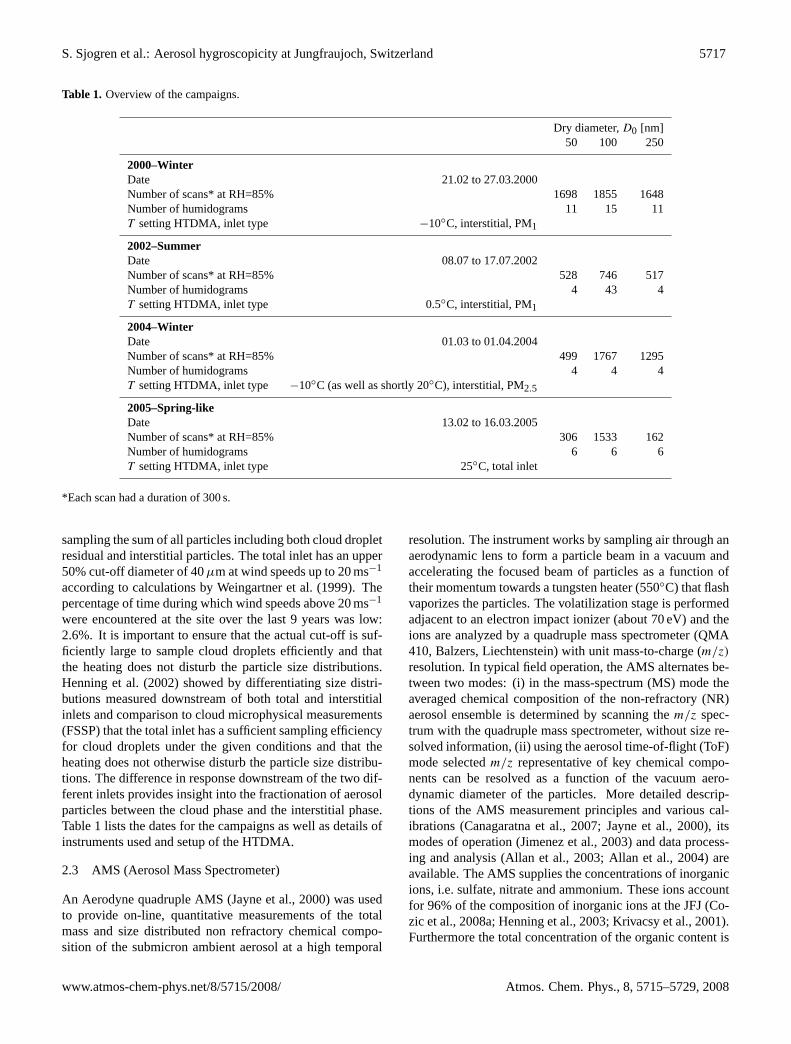
sulfate at 85% RH isσ<0.05, however, such smallσ canonly be detected when counting statistics allow for inversionwith higher resolution. Therefore anyσ ≥0.15 shows thatthe aerosol is externally mixed or quasi-internally mixed withsubstantial spread of growth factors, while anyσ ≤0.10 indi-cates absence of distinct growth modes, i.e. an internal mix-ture or a quasi-internal mixture with limited spread of growthfactors. We use theσ not only to describe the spread of a sin-gle mode, but also in the sense of describing a broader distri-bution, or describing cases which are clearly bimodal. TwoHTDMA measurement examples (red) and corresponding in-verted growth factor distributions (green) as well as the in-verted growth distribution reprocessed through the HTDMAforward model (blue) are shown in Fig. 1. Panel (A) shows anaerosol (Do=100 nm) observed during undisturbed FT con-ditions withGF∗=1.28 andσ=0.08, indicating that it was in-ternally mixed. Panel (B) shows an aerosol observed duringan SDE withσ=0.22. This aerosol is obviously externallymixed with two distinct modes atGF=1.05 andGF=1.45,whereof the former can be attributed to mineral dust. TheGF∗ is 1.227 and is not representative of the hygroscopicbehavior of the aerosol but would be the value to comparewith the predicted hygroscopicity from the ensemble chemi-cal composition, which would need to take mineral dust intoaccount. In this case the blue line does not exactly follow themeasurement because of the limited resolution of the inver-sion. However, better results cannot be obtained even withincreasing the resolution, because the measurement uncer-tainties are too big at such a low number of measured counts.
2.5.2 Correction of HTDMA data to 85% RH
The measurements were generally done at 85% RH. To ob-tain a more complete time series data set, data between 80and 90% RH were corrected to 85% RH using the followingequation:
k(GF, aw) =(GF3
− 1)(1 − aw)
aw
⇔ (2)
GF(aw, k) =
(1 + k
aw
1 − aw
)1/3
wherek captures all solute properties.aw is the water activ-ity. First thek-value was calculated from the measuredGFand RH (first line of Eq. 2), and then the corresponding cor-rectedGF at 85% was calculated using thisk (second line ofEq. (2). Equation (2) is equivalent to Eq. (4) in the paper byGysel et al. (2004) withk=(Mwρs is)/(ρw Ms), whereMw
is the molar mass andρw the density of water, andMs themolar mass,ρs the density andis the van’t Hoff factor of thesolute. Equation (2) is also equivalent to Eq. (1) in the paperby Dick et al. (2000) witha=k andb=c=0, wherea, b, andc are their model parameters. More details about the theoret-ical background of the functionality of Eq. (2) are given in
www.atmos-chem-phys.net/8/5715/2008/ Atmos. Chem. Phys., 8, 5715–5729, 2008

5720 S. Sjogren et al.: Aerosol hygroscopicity at Jungfraujoch, Switzerland
29
Fig. 1. Typical examples of growth factor distributions at RH=85%of D0=100 nm particles (GF=1.28) andσ=0.08 (Panel (A), 12 July2002 18:00) and ofD0=250 nm particles during a SDE (Panel (B),17 March 2000 20:24), with a first mode atGF=1.05 and a secondmode atGF=1.45 (overallσ=0.22). The red line and points (leftaxis) refer to measured particle counts, the green line is the invertedGF distribution (right axis) and the blue line inverted growth distri-bution reprocessed through the forward model (left axis). Error barsindicate the estimated counting uncertainty of the measurement.
Kreidenweis et al. (2005). Using a constantk-value for RHcorrections is equivalent to a constant van’t Hoff factor. Thisassumption is justified for differences of±5% RH as chosenhere.
2.6 Prediction of hygroscopic growth factors
Prediction of hygroscopic growth factors with Kohler theoryrequires detailed knowledge of particle composition as wellas a thermodynamic model, which describes the concentra-tion dependence of the water activity for such a mixture. Thehygroscopic growth factor of a mixture,GFmixed, can be esti-mated from the growth factors of the individual componentsof the aerosol and their respective volume fractions,ε, withthe ZSR relation (Stokes et al., 1966):
GFmixed=
(∑k
εkGF3k
)1/3
(3)
where the summation is performed over all compoundspresent in the particles. Solute-solute interactions are ne-glected in this model and volume additivity is also assumed.
Table 2. Hygroscopic growth factors for pure substances and phys-ical properties used (Bulk properties, Topping et al., 2005a).
Substance GF (ataw = 0.85) Density [kg m−3]
(NH4)2SO4 1.56 1769NH4HSO4 1.62 1780NH4NO3 1.59 1720H2SO4 1.88 1830BC 1.0 2000Organics 1.20a 1400b
a The growth factor of the organics was chosen to give a best fitbetween measurement and model. See Section3.1for discussion ofthis value.b The density of organics was chosen to represent oxidized organicsin aged atmospheric aerosol (Alfarra et al., 2006; Dinar et al., 2006).
The AMS measured size-resolved mass concentrations ofammonium (NH+4 ), sulfate (SO2−
4 ), nitrate (NO−
3 ), and or-ganics with high temporal resolution during the last threecampaigns: 2002, 2004 and 2005. The PM1 aerosol at theJFJ was mostly neutralized with ammonium (Cozic et al.,2008a), according to AMS data and PM1 filter samples. Thepairing of the inorganic ions, which is required for the ZSRrelation, is unambiguous for aerosols neutralized by a singlecation. However, occasionally the measured ammonium con-centration was insufficient to fully neutralize the sulfate, thusindicating an acidic aerosol. In such cases the ion-pairingbecomes ambiguous and therefore an adequate ion-pairingscheme must be applied. We used the simplified ion-pairingscheme presented by Gysel et al. (2007), which has a di-rect analytical solution and deviations of corresponding ZSRpredictions from full thermodynamic models are minusculefor the relevant inorganic mixtures. Growth factors of pureinorganic salts are obtained from ADDEM (Topping et al.,2005a, b; see Table 2). Densities used to convert mass frac-tions measured by the AMS into volume fractions requiredfor the ZSR relation (Eq.3) are also provided in Table 2.
The AMS composition data were integrated over a narrowsize range from 88–196 nm vacuum aerodynamic diameter(dva), which corresponds to a volume weighted mean mo-bility diameter ofdmob=100 nm (49–122 nm). The chosenwidth of the size range is a compromise between size reso-lution and signal statistics. Conversion of vacuum aerody-namic diameters into mobility diameters was done accordingto the equations provided in Zelenyuk et al. (2006), assuminga dynamic shape factor of one and using a particles density of1565 kg/m3, as calculated from the campaign average com-position.
The growth factor of the organic aerosol fraction, the onlyremaining unknown variable in the ZSR equation (Eq.3),cannot be calculated based on the chemical information
Atmos. Chem. Phys., 8, 5715–5729, 2008 www.atmos-chem-phys.net/8/5715/2008/

S. Sjogren et al.: Aerosol hygroscopicity at Jungfraujoch, Switzerland 5721
30
1.40
1.35
1.30
1.25
1.20
1.15
1.10
1.05
1.00Hygro
scop
ic G
row
th F
acto
r D
/D0
908070605040302010
Relative Humidity RH [%]
CLACE 2 example humidograms
15.07.02 13:00
23.07.02 23:30 17.07.02 07:00
solid lines: fitted k-curves
dashed lines: fitted γ-curves
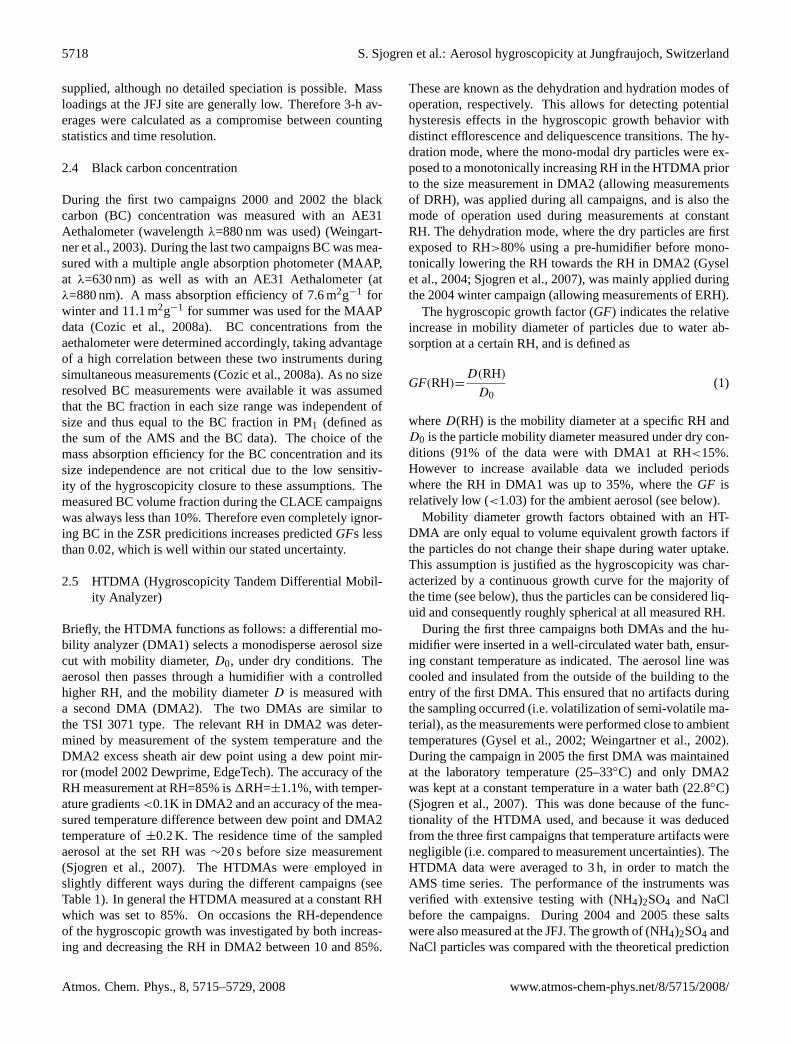
Fig. 2. Typical humidograms of particles withD0=100 nm sized particles during July 2002 (the other campaigns gave similar results). Thehygroscopicity at the JFJ varies with varying season and origin of air parcels, but the water uptake at a specific time can be well described asa function of RH with a single-parameter model (solid lines).
obtained with the AMS. Therefore the ZSR model could beused to infer the apparent ensemble mean growth factor ofthe organics,GForg, as detailed in Sect.3.2.
3 Results
3.1 Hygroscopicity at the JFJ
The RH-dependence ofGF was measured by variation ofthe RH in the HTDMA between 10 and 85%. Figure 2shows three examples of typical humidograms showing thefeatures observed at the JFJ. Generally a continuous growthwithout differences between hydration and dehydration op-erating mode was found, thus indicating absence of phasechanges. This does not exclude existence of efflorescence atRH<10%, because our measurements were technically lim-ited to RH>∼10%. Such continuous growth is expected andhas been reported for complex mixtures with an increasingnumber of organic components (Marcolli et al., 2004; Mar-colli and Krieger, 2006). The aerosol at the JFJ seems toexist predominantly as dissolved liquid or amorphous parti-cles. Furthermore, the growth curves can be well describedwith the single-parameter (k) semi-empirical model given inEq. (2), as can be seen from the solid lines in Fig. 2. Thegrowth curves were also fitted with an empirical power law fitGF=(1−aw)γ (Swietlicki et al., 2000), dashed lines in Fig. 2,but for this model we found consistently largerχ2-residualsthan with the former model. As can be seen from Figs. 2,3 and 4 the magnitude of the hygroscopic growth at the JFJvaries substantially over time, but the RH-dependence at anytime can be captured with a single parameter (k).
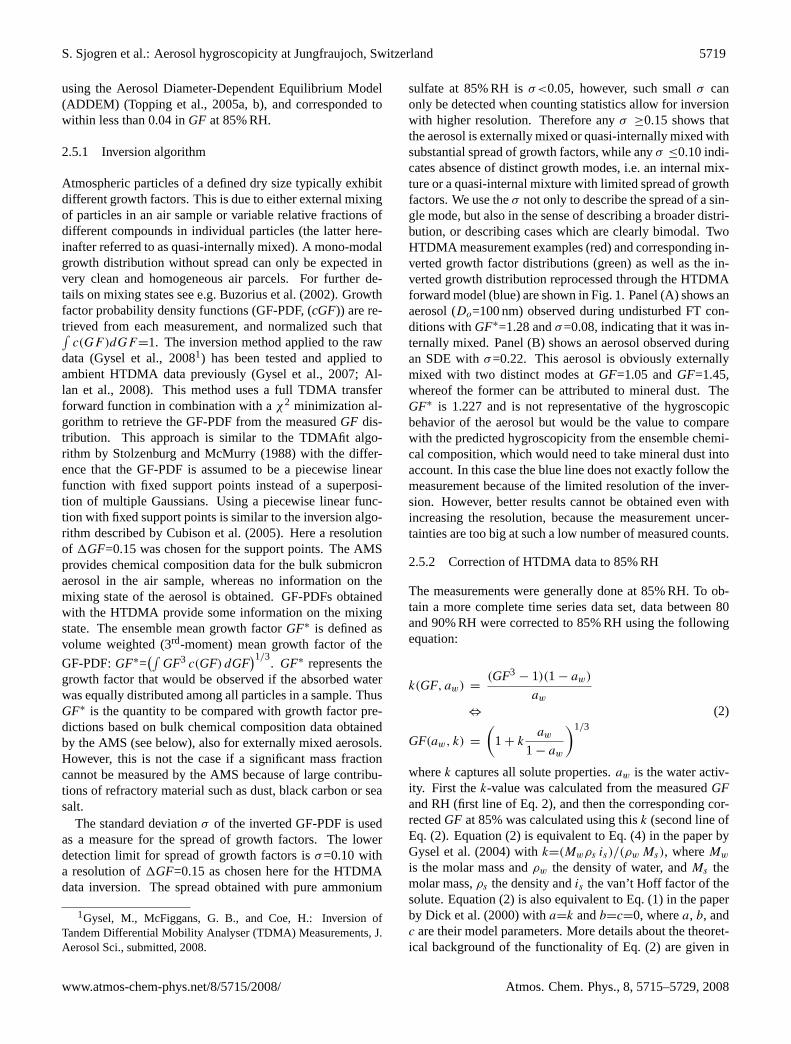
Figure 3 shows the temporal evolution ofGF distributionsfor a period of the campaign in 2000. Several SDE wereobserved, as indicated with the shaded areas in Panel (A).During undisturbed FT conditions, a size dependence of thegrowth factor can be seen, with larger growth for larger par-ticles. This feature, which has previously been shown byWeingartner et al. (2002), was also observed during the othercampaigns and is attributed to a size dependent chemicalcomposition. This is confirmed by largerk-values at largerdry diameters (top panel of Fig. 3), which are a measure ofthe hygroscopicity without the influence of the Kelvin effect.The ensemblek-values have been calculated from the en-semble mean growth factorGF∗ using Eq. (2), whereas thewater activity corresponding to the measured RH has beencalculated assuming a surface tension of pure water. Thesize dependence of the hygroscopicity can most likely be at-tributed to an increasing fraction of organic compounds withdecreasing dry diameter, as observed with AMS measure-ments during the summer 2002 campaign (Alfarra, 2004).During major SDE two distinct growth modes can be seen forthe 250 nm particles, while no clear change in hygroscopicbehavior is seen for the 50 nm particles. This is also re-flected in strongly decreasingk-values atD0=250 nm, whilelittle or no changes occur atD0=100 and 50 nm. Thus min-eral dust particles are only found at larger sizes. As dur-ing SDE larger sized particles are more externally mixed,the reduction of thek-value in these periods only reflectsthe influence of the increasing amount of particles, presum-ably mineral dust, with lower hygroscopicity, not thek-valueof each mode. Some externally mixed particles with lowerhygroscopicity can also be found when the site is not influ-enced by a pronounced SDE event (e.g. Fig. 3,D0=250 nm,13.03.–15.03.00). However, such external mixing is much
www.atmos-chem-phys.net/8/5715/2008/ Atmos. Chem. Phys., 8, 5715–5729, 2008

5722 S. Sjogren et al.: Aerosol hygroscopicity at Jungfraujoch, Switzerland
Fig. 3. Temporal evolution ofGF distributions forGF all measured sizes (D0=50, 100, 250 nm) at RH=85%, during year 2000. Panel(a)shows thek-values indicating the hygroscopicity of the aerosol. The red lines on panels(b), (c) and(d) represent the ensemble mean growthfactorGF∗.
Table 3. Summary of meanGF∗, medianGF∗ and mean spreadσ of theGF distributions for the campaigns.
Campaign date Feb–Mar 2000 Jul 2002 Mar 2004 Feb–Mar 2005Season Winter Summer Winter Spring-likeDry diameterD0[nm] 50 100 250 50 100 250 50 100 250 50 100 250
MeanGF∗ at 85% RH 1.33 1.40 1.41 1.26 1.29 1.35 1.34 1.40 1.47 1.30 1.35 1.42−Std.dev. ofGF∗ 0.091 0.104 0.133 0.090 0.076 0.081 0.122 0.112 0.114 0.081 0.076 0.076Number of scans 1698 1855 851 528 746 517 499 1767 1295 306 1533 162Mean spreadσ 0.13 0.15 0.19 0.08 0.10 0.12 0.11 0.13 0.15 0.17 0.16 0.16−Std.dev. ofσ 0.041 0.046 0.070 0.045 0.043 0.043 0.050 0.055 0.063 0.095 0.058 0.089MedianGF∗ at 85% RH 1.34 1.41 1.44 1.25 1.29 1.36 1.33 1.41 1.48 1.31 1.34 1.41
less frequent and less pronounced than during SDE events,as discussed below with the overall statistics.
In summer, a strong diurnal variation is typically foundin most aerosol variables (Lugauer et al., 2000). During the2002 campaign this diurnal variation was also present in theobserved mass loadings, though to a slightly lesser extent(Alfarra, 2004). However, the mass fractions of differentcomponents did not vary to a large degree during this diur-nal variation, resulting in a fairly constant hygroscopicity ona timescale of hours seen both in the HTDMA results and inthe closure (Fig. 4). However, more data with days showing astrong diurnal variation are required for a conclusive descrip-tion of this influence. As can be seen from the meanGF∗
values in Table 3, the summer campaign is characterized bylower hygroscopicity, due to a higher organic loading (68%in summer compared to 42% in winter). This is most proba-
bly due to higher emission rates of secondary organic aerosol(SOA) precursors and higher photo-oxidation activity, whichcan also be transported upwards through valley venting.
3.2 Apparent growth factor of the organics
The growth factor of the organic aerosol fraction cannotbe calculated from the AMS data, because neither a de-tailed speciation nor a characterization in terms of functionalgroups and molecule sizes is available. Therefore the ap-parent ensemble mean growth factor of the organics,GForg,was determined with an inverse modelling approach:GForgwas fitted such that best possible agreement between mea-sured growth factors and corresponding ZSR predictions wasachieved. We name it “apparentGForg” because it may wellbe different from the ensemble mean growth factor of the
Atmos. Chem. Phys., 8, 5715–5729, 2008 www.atmos-chem-phys.net/8/5715/2008/
S. Sjogren et al.: Aerosol hygroscopicity at Jungfraujoch, Switzerland 5723
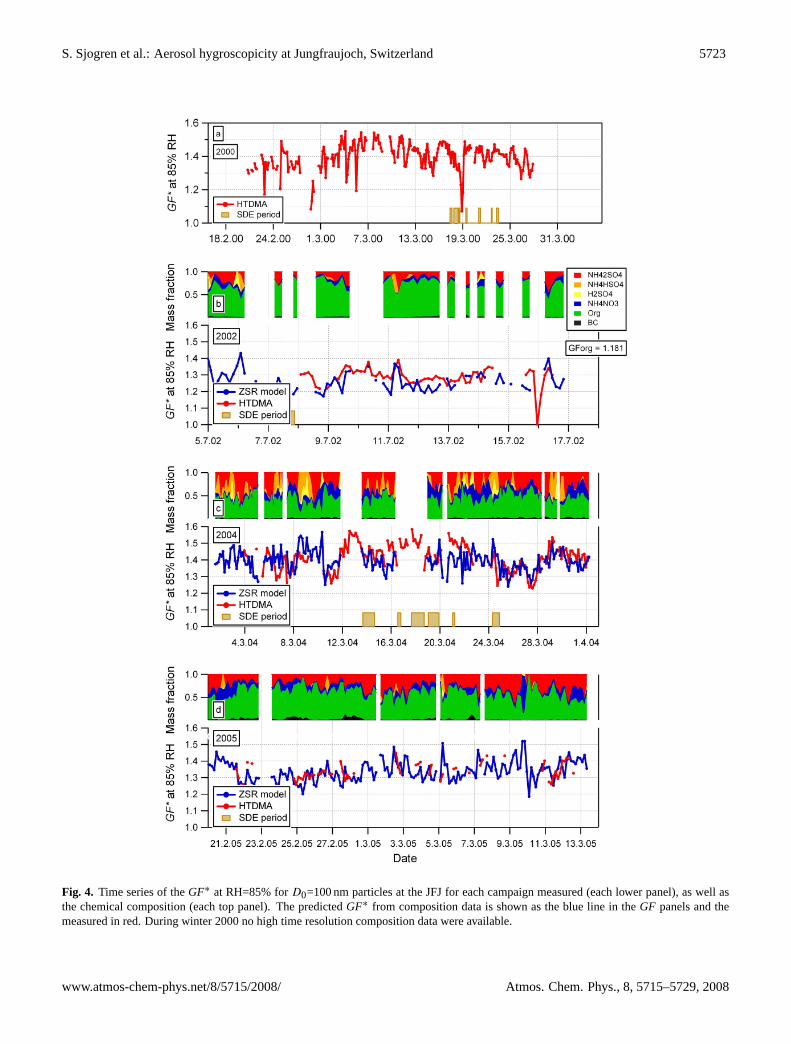
Fig. 4. Time series of theGF∗ at RH=85% forD0=100 nm particles at the JFJ for each campaign measured (each lower panel), as well asthe chemical composition (each top panel). The predictedGF∗ from composition data is shown as the blue line in theGF panels and themeasured in red. During winter 2000 no high time resolution composition data were available.
www.atmos-chem-phys.net/8/5715/2008/ Atmos. Chem. Phys., 8, 5715–5729, 2008
5724 S. Sjogren et al.: Aerosol hygroscopicity at Jungfraujoch, Switzerland
organics in pure form. For example positive/negative interac-tions between the organic and inorganic solutes in the mixedsolution would result in an enhanced/reduced apparentGForgcompared to the growth of the organics in pure form. A con-stant (time independent)GForg can either be fitted such thatthe sum of all residuals between each pair of measured andpredictedGF∗ is minimised, or alternatively such that thecorrelation between all measured and predictedGF∗ has aunit slope. These two approaches deliver equivalent resultswith less than two percent difference in fittedGForg. Thelatter alternative is presented in the following because it sim-plifies the discussion and sensitivity analysis of the results.
Figure 4 shows a time series of the volume weightedensemble mean growth factor,GF∗, measured by the HT-DMA for D0=100 nm particles along with the correspond-ing ZSR predictions using the best fit apparentGForg, whichwas found to be∼1.2 ataw=0.85 for the campaigns 2002,2004 and 2005 (no high time resolution composition datawere available for 2000). Note, this value ofGForg corre-sponds to a growth factor of∼1.18 for 100 nm particles atRH=85% due to the influence of the Kelvin effect. Corre-lation coefficients of r≈0.35–0.60 are achieved for the threecampaigns with the above constantGForg. This seems ratherlow, however, the actual variability ofGF∗ is small com-pared to the measurement uncertainties imposed by statisticalnoise in both HTDMA and AMS data due to very low aerosolloadings at the Jungfraujoch, thus explaining relatively lowcorrelation coefficients. For the same reason no sensible re-sults can be achieved by fitting a time dependentGForg andhence it is not possible to extract temporal trends of the ap-parentGForg. Reduction of the apparentGForg to 1.15, 1.10and 1.00 ataw=0.85 decreases the slope of the correlationsto ∼0.93,∼0.86 and∼0.75, respectively, indicating that theapparentGForg is likely to be≥1.15 and most likely>1.10.
An apparentGForg in the order of 1.2 ataw=0.85 is at theupper end of the range reported in laboratory experimentsfor SOA (e.g. Varutbangkul et al., 2006; Baltensperger et al.,2005) or humic-like substances (HULIS) extracted from am-bient samples (e.g. Gysel et al., 2004). However, Duplissyet al. (2008) have shown that theGF of SOA measured insmogchamber experiments can be substantially higher whenusing lower, atmospherically relevant precursor concentra-tions. Furthermore the SOAGF increases continuouslywith ongoing photochemical reaction and can reach∼1.2 ataw=0.85 forα-pinene SOA. EnsembleGFs derived for theorganic aerosol fraction in previous ambient hygroscopicityclosure studies looking at SOA dominated or aged air massesare slightly smaller (Aklilu et al., 2006; Gysel et al., 2007)or comparable (Carrico et al., 2005) to the findings in thisstudy. The air masses at the JFJ are representative of an agedaerosol and therefore a relatively high ensemble organicGFcan be expected. This is corroborated by the fact that themass spectra obtained by the AMS at the Jungfraujoch arecharacterized by the absence of the hydrocarbon mass frag-ments pattern from the ion series Cn H+
2n+1 (i.e. m/z 43, 57,
71, 85), indicating that little unprocessed primary organicmaterial is present (Zhang et al., 2005; Alfarra et al., 2006).On the other hand, the spectra are dominated by mass frag-mentm/z 44 which arises from CO+2 as a result of the ther-mal decomposition of highly oxygenated organic compoundsin the AMS. This mass spectral pattern is typical for pro-cessed and aged organic aerosol (Alfarra et al., 2006; Zhanget al., 2007). These findings indicate on the one hand thatthe apparentGForg tends to increase from polluted towardsremote locations, and on the other hand that it is unlikely toreach values significantly higher thanGForg≈1.2 ataw=0.85as estimated for the Jungfraujoch.
During SDE there will be an increased fraction of mostlyinsoluble mineral dust material (Vlasenko et al., 2006) whichis not detected in the AMS. This will lead to an increase inthe predictedGF compared to the measured one. However,during 2004 some SDE were detected when both instrumentswere in operation, but the residuals from measured minuspredicted hygroscopicity for these SDE were similar to FTconditions. Probably the mass fraction of mineral dust com-ponents were not sufficiently high at sizes<250 nm to sig-nificantly influence the ensemble mean growth factorGF∗.
Recently, Aklilu et al. (2006) and Gysel et al. (2007) havefound significant discrepancies between measured and pre-dicted GFs if substantial mass fractions of ammonium ni-trate were present. Aklilu et al. (2006) speculated that theZSR relation may not hold in the presence of ammonium ni-trate, whereas Gysel et al. (2007) concluded that the mostlikely cause for the discrepancies in their case was an evap-oration artifact of ammonium nitrate in the HTDMA, whichwas operated at∼25◦C and with a residence time of∼60 s.No systematic prediction bias for data points with high am-monium nitrate mass fraction was found in the data set pre-sented here, indicating that no evaporation artifacts occurred.An important difference is that the HTDMA measurementsof this study were mostly done at low temperatures (T =−10to 0.5◦C) and the residence time was kept short (∼20 s), thusminimizing potential evaporation artifacts.
3.3 Frequency distributions ofGF∗ andσ
Panels (A), (D) and (G) of Fig. 5 show the averages of thenormalized measuredGF distributions for each dry size stud-ied and for each air mass category. The air mass types dis-tinguished in this analysis are the SDE, the non-disturbed FTconditions as well as the cases influenced by injections fromplanetary boundary layer air (i.e., during summer, PBL INF).These averaged growth distributions illustrate the mean num-ber fraction of particles in a defined air mass type exhibitinga certain growth factor, unlike Fig. 1 which shows snapshotgrowth distributions for a specific time. Thus the averagesdo not necessarily indicate the mixing state of the aerosolas the temporal variability increases the spread. Most of thetime at the JFJ one expects to encounter non-disturbed FTconditions or PBL INF during summer. It has been shown
Atmos. Chem. Phys., 8, 5715–5729, 2008 www.atmos-chem-phys.net/8/5715/2008/

S. Sjogren et al.: Aerosol hygroscopicity at Jungfraujoch, Switzerland 5725
33
Fig. 5. Results for RH=85% and dry sizesD0=250, 100, 50 nm are presented from top to bottom row. First column shows theGF distributionfor SDE, FT and PBL INF conditions. Second column shows the frequency distribution ofGF∗. Third column shows the frequencydistribution of the spreadσ , a measure for the broadening of theGF distribution.
in Collaud Coen et al. (2004) that SDE are present only 5%of the time (yearly average). For the FT conditions the 50and 100 nm particles appear internally mixed, however with asmall fraction of particles with aGF between 1.0–1.2, whichis not easily resolved with the inversion considering the in-strument limits and the low mass loading. For the 50 nm par-ticles this shoulder at lowGFs is less pronounced, but thisis to some extent a consequence of the smaller hygroscopic-ity of the main mode, which is slightly overlapping with thisshoulder. Kandler and Schutz (2007) also reportedGF valuesfor March 2000 at the JFJ (measured at 90% RH at∼20◦C),which are in agreement with theGFs shown here. Kandlerand Schutz (2007) indicated a bimodal distribution for allsizes, however they do not show the relative number frac-tions in each mode, which, if small for the lowerGF mode,would be in agreement with our data. The PBL INF measure-ments show a more homogeneousGF distribution, but thehygroscopicity is also lower. SDE only occurred during thetwo winter campaigns, and for these cases theD0=250 nmparticles showed an increase of non-hygroscopic particles ina distinct mode with aGF of 1.0. The hygroscopic prop-erties of theD0=50 and 100 nm particles do not differ be-tween SDE/FT. Panels (B), (E), and (H) of Fig. 5 show thefrequency distribution ofGF∗, from which the mean and me-dian GF∗ presented in Table 3 have been calculated. Bothsummer and winter measurements revealed a size depen-dence of growth factors. This trend is stronger than just the
influence of the Kelvin effect, as can be seen from the k-values shown in Fig. 3a. Furthermore, the observed growthfactors were generally smaller in summer compared to win-ter, which is explained by a higher organic mass fraction insummer.
Panels C, F and I of Fig. 5 show the frequency distribu-tion of σ averaged for each of the relevant periods. Theσ
of individual scans can be used to distinguish between quasi-internally mixed aerosols with limited growth factor spread(σ≤0.1) and externally or quasi-internally mixed aerosolswith substantial spread (σ≥0.15). The frequency distribu-tion of σ thus indicates the fraction of time of each periodthat a certain mixing state (σ ) is encountered. The most fre-quent spread observed in summer isσ=∼0.125 which is in-ternally mixed, whereas larger spread is seen in winter FTconditions. This can be attributed to a larger separation of themain growth mode from the minor fraction of particles withgrowth factors<1.2. For the same reason the spread also in-creases with particle size in winter withσ=∼0.1, 0.125 and0.15 forD0=50, 100 and 250 nm particles, respectively. Thisindicates that even under FT conditions observed during win-ter the aerosol contains a fraction of particles which appearto remain less processed and thus less hygroscopic also at aremote location. The mineral dust during SDE mostly influ-ences the larger particles withD0=250 nm, as already exem-plified in Figs. 3 and 5A. Here it has to be stressed that differ-ent scenarios can end up with a bimodal shape of the mean
www.atmos-chem-phys.net/8/5715/2008/ Atmos. Chem. Phys., 8, 5715–5729, 2008
5726 S. Sjogren et al.: Aerosol hygroscopicity at Jungfraujoch, Switzerland
GF distributions as shown in Fig. 5A. Either theGF distri-bution is always bimodal with similar number fractions ofparticles in both modes, or only monomodal but theGF dis-tribution are observed with the mode centered atGF=∼1.0or GF=∼1.45 during 50% of the time each. Frequent oc-currence ofσ ≥0.2 andGF∗=1.3–1.5 forD0=250 nm dur-ing SDE indicates that the former alternative with simultane-ous presence of non-hygroscopic mineral dust and more hy-groscopic background particles, both in comparable numberfractions, dominates. No clear influence of SDE onσ andGF∗ is seen at 50 and 100 nm confirming the finding fromPanels (D) and (G).
The frequency distributions of theGF∗ and σ can beused to simulate internally or quasi-internally mixed hy-groscopic behavior of particles in different air masses en-countered at the JFJ. Additionally to the frequency distri-butions it has to be known whetherGF∗ and σ are de-pendent on each other. We explored the relationship be-tween the two distributions, but no dependence betweenGF∗
and σ was found. This is different from results found byAklilu and Mozurkewich (2004) in the Lower Fraser Valley,British Colombia, who reported a horseshoe-shaped relation-ship with maximumσ values at intermediateGF.
4 Conclusions
A statistical analysis of measurements from four field cam-paigns of about one month each at the high alpine siteJungfraujoch is presented. During the winter season whenthe station was in the undisturbed free troposphere, the av-erageGF measured with an HTDMA was 1.40±0.11 at85% RH forD0=100 nm particles. During the summer sea-son, due to higher SOA formation, theGF was 1.29±0.08 at85% RH. During mineral dust eventsGF distributions werepartly bimodal forD0=250 nm particles. The frequency dis-tributions of the width of the retrieved growth factor (in-ternally/externally mixed) distributions are presented, whichcan be used for comparison with simulations of the hygro-scopic behavior of the aerosol encountered at the JFJ.
The apparent ensemble meanGF of the organics encoun-tered at the Jungfraujoch was estimated to beGForg≈1.20 ataw=0.85 based on inverse ZSR modelling. This value is atthe upper end of previous laboratory and field data thoughstill in agreement with the highly aged and oxidized natureof the Jungfraujoch aerosol.
Acknowledgements.This work was supported by the Swiss Na-tional Science Foundation Switzerland (grant no 200021-100280),MeteoSwiss in the framework of the Global Atmosphere WatchProgram as well as the EC projects ACCENT and EUSAAR. TheUMan measurements were supported by the UK Natural Environ-ment Research Council. We thank the International FoundationHigh Altitude Research Stations Jungfraujoch and Gornergrat(HFSJG), who made it possible for us to carry out our experimentsat the High Altitude Research Station at Jungfraujoch, and also thecaretakers at the station.
Edited by: W. Conant
References
Aklilu, Y. A. and Mozurkewich, M.: Determination of externaland internal mixing of organic and inorganic aerosol componentsfrom hygroscopic properties of submicrometer particles during afield study in the Lower Fraser Valley, Aerosol Sci. Technol., 38,140–154, 2004.
Aklilu, Y., Mozurkewich, M., Prenni, A. J., Kreidenweis, S. M.,Alfarra, M. R., Allan, J. D., Anlauf, K., Brook, J., Leaitch, W.R., Sharma, S., Boudries, H., and Worsnop, D. R.: Hygroscopic-ity of particles at two rural, urban influenced sites during Pacific2001: Comparison with estimates of water uptake from particlecomposition, Atmos. Environ., 40, 2650–2661, 2006.
Alfarra, M. R.: Insights into atmospheric organic aerosols usingan aerosol mass spectrometer, PhD thesis, The University ofManchester, 7, 162–201, 2004.
Alfarra, M. R., Paulsen, D., Gysel, M., Garforth, A. A., Dommen,J., Prevot, A. S. H., Worsnop, D. R., Baltensperger, U., and Coe,H.: A mass spectrometric study of secondary organic aerosolsformed from the photooxidation of anthropogenic and biogenicprecursors in a reaction chamber, Atmos. Chem. Phys., 6, 5279–5293, 2006,http://www.atmos-chem-phys.net/6/5279/2006/.
Allan, J. D., Jimenez, J. L., Williams, P. I., Alfarra, M. R., Bower,K. N., Jayne, J. T., Coe, H., and Worsnop, D. R.: Quantitativesampling using an Aerodyne aerosol mass spectrometer: 1. Tech-niques of data interpretation and error analysis, J. Geophys. Res.,108, 4090, doi:10.1029/2002JD002358, 2003.
Allan, J. D., Delia, A. E., Coe, H., Bower, K. N., Alfarra, M.R., Jimenez, J. L., Middlebrook, A. M., Drewnick, F., Onasch,T. B., Canagaratna, M. R., Jayne, J. T., and Worsnopf, D. R.:A generalised method for the extraction of chemically resolvedmass spectra from Aerodyne aerosol mass spectrometer data, J.Aerosol Sci., 35(7), 909–922, 2004.
Allan, J. D., Baumgardner, D., Raga, G. B., Mayol-Bracero, O.L., Morales-Garcıa, F., Garcıa-Garcıa, F., Montero-Martınez, G.,Borrmann, S., Schneider, J., Mertes, S., Walter, S., Gysel, M.,Dusek, U., Frank, G. P., and Kramer, M.: Clouds and aerosols inPuerto Rico – a new evaluation, Atmos. Chem. Phys., 8, 1293–1309, 2008,http://www.atmos-chem-phys.net/8/1293/2008/.
Baltensperger, U., Gaggeler, H. W., Jost, D. T., Lugauer, M.,Schwikowski, M., Weingartner, E., and Seibert, P.: Aerosol cli-matology at the high-alpine site Jungfraujoch, Switzerland, J.Geophys. Res., 102, 19 707–19 715, 1997.
Baltensperger, U., Schwikowski, M., Jost, D. T., Nyeki, S.,Gaggeler, H. W., and Poulida, O.: Scavenging of atmosphericconstituents in mixed phase clouds at the high-alpine site
Atmos. Chem. Phys., 8, 5715–5729, 2008 www.atmos-chem-phys.net/8/5715/2008/

S. Sjogren et al.: Aerosol hygroscopicity at Jungfraujoch, Switzerland 5727
Jungfraujoch part I: Basic concept and aerosol scavenging byclouds, Atmos. Environ., 32, 3975–3983, 1998.
Baltensperger, U., Kalberer, M., Dommen, J., Paulsen, D., Alfarra,M. R., Coe, H., Fisseha, R., Gascho, A., Gysel, M., Nyeki, S.,Sax, M., Steinbacher, M., Prevot, A. S. H., Sjogren, S., Wein-gartner, E., and Zenobi, R.: Secondary organic aerosols fromanthropogenic and biogenic precursors, Faraday Discuss., 130,265–278, 2005.
Buzorius, G., Zelenyuk, A., Brechtel, F., and Imre, D.: Simul-taneous determination of individual ambient particle size, hy-groscopicity and composition. Geophys. Res. Lett., 29, 1974,doi:10.1029/2001GL014221, 2002.
Canagaratna, M. R., Jayne, J. T., Jimenez, J. L., Allan, J. D., Al-farra, M. R., Zhang, Q., Onasch, T. B., Drewnick, F., Coe, H.,Middlebrook, A., Delia, A., Williams, L. R., Trimborn, A. M.,Northway, M. J., DeCarlo, P. F., Kolb, C. E., Davidovits, P., andWorsnop, D. R.: Chemical and microphysical characterization ofambient aerosols with the Aerodyne aerosol mass spectrometer,Mass Spectrom. Rev., 26, 185–222, 2007.
Carrico, C. M., Kreidenweis, S. M., Malm, W. C., Day, D. E.,Lee, T., Carrillo, J., McMeeking, G. R., and Collett Jr., J. L.:Hygroscopic growth behavior of a carbon-dominated aerosol inYosemite National Park, Atmos. Environ., 39, 1393–1404, 2005.
Collaud Coen, M., Weingartner, E., Schaub, D., Hueglin, C., Cor-rigan, C., Henning, S., Schwikowski, M., and Baltensperger, U.:Saharan dust events at the Jungfraujoch: detection by wavelengthdependence of the single scattering albedo and first climatologyanalysis, Atmos. Chem. Phys., 4, 2465–2480, 2004,http://www.atmos-chem-phys.net/4/2465/2004/.
Collaud Coen, M., Weingartner, E., Nyeki, S., Cozic, J., Hen-ning, S., Verheggen, B., Gehrig, R., and Baltensperger, U.:Long-term trend analysis of aerosol variables at the high-alpine site Jungfraujoch, J. Geophys. Res., 112, D13213,doi:10.1029/2006JD007995, 2007.
Cozic, J., Verheggen, B., Mertes, S., Connolly, P., Bower, K., Pet-zold, A., Baltensperger, U., and Weingartner, E.: Scavengingof black carbon in mixed phase clouds at the high alpine siteJungfraujoch, Atmos. Chem. Phys., 7, 1797–1807, 2007,http://www.atmos-chem-phys.net/7/1797/2007/.
Cozic, J., Verheggen, B., Weingartner, E., Crosier, J., Bower, K.N., Flynn, M., Coe, H., Henning, S., Steinbacher, M., Henne, S.,Collaud Coen, M., Petzold, A., and Baltensperger, U.: Chemi-cal composition of free tropospheric aerosol for PM1 and coarsemode at the high alpine site Jungfraujoch, Atmos. Chem. Phys.,8, 407–423, 2008a,http://www.atmos-chem-phys.net/8/407/2008/.
Cozic, J., Mertes, S., Verheggen, B., Cziczo, D. J., Gallavardin,S. J., Walter, S., Baltensperger, U., and Weingartner, E.: Blackcarbon enrichment in atmospheric ice particle residuals observedin lower tropospheric mixed phase clouds, J. Geophys. Res., 113,D15209, doi:10.1029/2007JD009266, 2008b.
Cubison, M. J., Coe, H., and Gysel, M.: A modified hygroscopictandem DMA and a data retrieval method based on optimal esti-mation, J. Aerosol Sci., 36, 846–865, 2005.
Dick, W. D., Saxena, P., and McMurry, P. H.: Estimation of wateruptake by organic compounds in submicron aerosols measuredduring the Southeastern Aerosol and Visibility Study, J. Geo-phys. Res., 105, 1471–1479, 2000.
Dinar, E., Mentel, T. F., and Rudich, Y.: The density of humic acids
and humic like substances (HULIS) from fresh and aged woodburning and pollution aerosol particles, Atmos. Chem. Phys., 6,5213–5224, 2006,http://www.atmos-chem-phys.net/6/5213/2006/.
Duplissy, J., Gysel, M., Alfarra, M. R., Dommen, J., Metzger, A.,Prevot, A. S. H., Weingartner, E., Laaksonen, A., Raatikainen, T.,Good, N., Turner, S. F., McFiggans, G., and Baltensperger, U.:The cloud forming potential of secondary organic aerosol undernear atmospheric conditions, Geophys. Res. Lett., 35, L03818,doi:10.1029/2007GL031075, 2008.
Gysel, M., Weingartner, E., and Baltensperger, U.: Hygroscopicityof aerosol particles at low temperatures. 2. Theoretical and exper-imental hygroscopic properties of laboratory generated aerosols,Environ. Sci. Technol., 36, 63–68, 2002.
Gysel, M., Weingartner, E., Nyeki, S., Paulsen, D., Baltensperger,U., Galambos, I., and Kiss, G.: Hygroscopic properties ofwater-soluble matter and humic-like organics in atmospheric fineaerosol, Atmos. Chem. Phys., 4, 35–50, 2004,http://www.atmos-chem-phys.net/4/35/2004/.
Gysel, M., Crosier, J., Topping, D. O., Whitehead, J. D., Bower, K.N., Cubison, M. J., Williams, P. I., Flynn, M. J., McFiggans, G.B., and Coe, H.: Closure study between chemical compositionand hygroscopic growth of aerosol particles during TORCH2,Atmos. Chem. Phys., 7, 6131–6144, 2007,http://www.atmos-chem-phys.net/7/6131/2007/.
Henning, S., Weingartner, E., Schmidt, S., Wendisch, M., Gaggeler,H. W., and Baltensperger, U.: Size-dependent aerosol activationat the high-alpine site Jungfraujoch (3580 m a.s.l.), Tellus, 54B,82–95, 2002.
Henning, S., Weingartner, E., Schwikowski, M., Gaggeler, H. W.,Gehrig, R., Hinz, K. P., Trimborn, A., Spengler, B., and Bal-tensperger, U.: Seasonal variation of water-soluble ions of theaerosol at the high-alpine site Jungfraujoch (3580 m a.s.l.), J.Geophys. Res., 108, 4030, doi:10.1029/2002JD002439, 2003.
Jayne, J. T., Leard, D. C., Zhang, X. F., Davidovits, P., Smith, K.A., Kolb, C. E., and Worsnop, D. R.: Development of an aerosolmass spectrometer for size and composition analysis of submi-cron particles, Aerosol Sci. Technol., 33, 49–70, 2000.
Jimenez, J. L., Jayne, J. T., Shi, Q., Kolb, C. E., Worsnop, D. R.,Yourshaw, I., Seinfeld, J. H., Flagan, R. C., Zhang, X. F., Smith,K. A., Morris, J. W., and Davidovits, P.: Ambient aerosol sam-pling using the Aerodyne Aerosol Mass Spectrometer, J. Geo-phys. Res., 108, 8425, doi:10.1029/2001JD001213, 2003.
Kanakidou, M., Seinfeld, J. H., Pandis, S. N., Barnes, I., Dentener,F. J., Facchini, M. C., Van Dingenen, R., Ervens, B., Nenes, A.,Nielsen, C. J., Swietlicki, E., Putaud, J. P., Balkanski, Y., Fuzzi,S., Horth, J., Moortgat, G. K., Winterhalter, R., Myhre, C. E.L., Tsigaridis, K., Vignati, E., Stephanou, E. G., and Wilson, J.:Organic aerosol and global climate modelling: a review, Atmos.Chem. Phys., 5, 1053–1123, 2005,http://www.atmos-chem-phys.net/5/1053/2005/.
Kandler, K. and Schutz, L.: Climatology of the average water-soluble volume fraction of atmospheric aerosol, Atmos. Res., 83,77–92, 2007.
Kreidenweis, S. M., Koehler, K., DeMott, P. J., Prenni, A. J., Car-rico, C., and Ervens, B.: Water activity and activation diametersfrom hygroscopicity data - Part I: Theory and application to in-organic salts, Atmos. Chem. Phys., 5, 1357–1370, 2005,http://www.atmos-chem-phys.net/5/1357/2005/.
www.atmos-chem-phys.net/8/5715/2008/ Atmos. Chem. Phys., 8, 5715–5729, 2008

5728 S. Sjogren et al.: Aerosol hygroscopicity at Jungfraujoch, Switzerland
Krivacsy, Z., Gelencser, A., Kiss, G., Meszaros, E., Molnar, A.,Hoffer, A., Meszaros, T., Sarvari, Z., Temesi, D., Varga, B., Bal-tensperger, U., Nyeki, S., and Weingartner, E.: Study on thechemical character of water soluble organic compounds in fineatmospheric aerosol at the Jungfraujoch, J. Atmos. Chem., 39,235–259, 2001.
Liu, B. Y. H., Pui, D. Y. H., Whitby, K. T., Kittelson, D. B.,Kousaka, Y., and McKenzie, R. L.: The Aerosol MobilityChromatograph: a new detector for sulfuric acid aerosols, At-mos. Environ., 12, 99–104, 1978.
Lugauer, M., Baltensperger, U., Furger, M., Gaggeler, H. W., Jost,D. T., Nyeki, S., and Schwikowski, M.: Influences of verticaltransport and scavenging on aerosol particle surface area andradon decay product concentrations at the Jungfraujoch (3454 ma.s.l.), J. Geophys. Res., 105, 19 869–19 879, 2000.
Marcolli, C., Luo, B. P., and Peter, T.: Mixing of the organic aerosolfractions: Liquids as the thermodynamically stable phases, J.Phys. Chem., 108, 2216–2224, 2004.
Marcolli, C. and Krieger, U. K.: Phase changes during hygroscopiccycles of mixed organic/inorganic model systems of troposphericaerosols, J. Phys. Chem., 110, 1881–1893, 2006.
McFiggans, G., Artaxo, P., Baltensperger, U., Coe, H., Facchini, M.C., Feingold, G., Fuzzi, S., Gysel, M., Laaksonen, A., Lohmann,U., Mentel, T. F., Murphy, D. M., O’Dowd, C. D., Snider, J.R., and Weingartner, E.: The effect of physical and chemi-cal aerosol properties on warm cloud droplet activation, Atmos.Chem. Phys., 6, 2593–2649, 2006,http://www.atmos-chem-phys.net/6/2593/2006/.
Mertes, S., Verheggen, B., Walter, S., Ebert, M., Connolly, P., Wein-gartner, E., Schneider, J., Bower, K. N., Inerle-Hof, M., Cozic,J., Baltensperger, U., and Heintzenberg, J.: Counterflow virtualimpactor based collection of small ice particles in mixed-phaseclouds for the physico-chemical characterisation of troposphericice nuclei: sampler description and first case study, Aerosol Sci.Technol., 41, 848–864, 2007.
Nyeki, S., Li, F., Weingartner, E., Streit, N., Colbeck, I., Gaggeler,H. W., and Baltensperger, U.: The background aerosol size dis-tribution in the free troposphere: An analysis of the annual cycleat a high-alpine site, J. Geophys. Res., 103, 31 749–31 761, 1998.
Nyeki, S., Kalberer, M., Colbeck, I., De Wekker, S., Furger, M.,Gaggeler, H. W., Kossmann, M., Lugauer, M., Steyn, D., Wein-gartner, E., Wirth, M., and Baltensperger, U.: Convective bound-ary layer evolution to 4 km a.s.l. over high-alpine terrain: Air-borne lidar observations in the Alps, Geophys. Res. Lett., 27,689–692, 2000.
Putaud, J. P., Raes, F., Van Dingenen, R., Bruggemann, E., Fac-chini, M. C., Decesari, S., Fuzzi, S., Gehrig, R., Huglin, C.,Laj, P., Lorbeer, G., Maenhaut, W., Mihalopoulos, N., Mulller,K., Querol, X., Rodriguez, S., Schneider, J., Spindler, G., tenBrink, H., Torseth, K., and Wiedensohler, A.: European aerosolphenomenology-2: chemical characteristics of particulate matterat kerbside, urban, rural and background sites in Europe, Atmos.Environ., 38, 2579–2595, 2004.
Rader, D. J. and McMurry, P. H.: Application of the tandem differ-ential mobility analyzer to studies of droplet growth or evapora-tion, J. Aerosol Sci., 17, 771–787, 1986.
Randall, D. A., Wood, R. A., Bony, S., Colman, R., Fichefet, T.,Fyfe, J., Kattsov, V., Pitman, A., Shukla, J., Srinivasan, J., Stouf-fer, R. J., Sumi, A., and Taylor, K. E.: Contribution of Working
Group I to the Fourth Assessment Report of the Intergovernmen-tal Panel on Climate Change – Climate Models and their Evalua-tion, Cambridge University Press, Cambridge, United Kingdomand New York, 589–662, 2007.
Sjogren, S., Gysel, M., Weingartner, E., Baltensperger, U., Cubison,M. J., Coe, H., Zardini, A. A., Marcolli, C., Krieger, U. K., andPeter, T.: Hygroscopic growth and water uptake kinetics of two-phase aerosol particles consisting of ammonium sulfate, adipicand humic acid mixtures, J. Aerosol Sci., 38, 157–171, 2007.
Solomon, S., Qin, D., Manning, M., Alley, R. B., Berntsen, T.,Bindoff, N. L., Chen, Z., Chidthaisong, A., Gregory, J. M.,Hegerl, G. C., Heimann, M., Hewitson, B., Hoskins, B. J., Joos,F., Jouzel, J., Kattsov, V., Lohmann, U., Matsuno, T., Molina,M., Nicholls, N., Overpeck, J., Raga, G., Ramaswamy, V., Ren,J., Rusticucci, M., Somerville, R., Stocker, T. F., Whetton, P.,Wood, R. A., and Wratt, D.: Contribution of Working Group Ito the Fourth Assessment Report of the Intergovernmental Panelon Climate Change – Technical Summary, Cambridge UniversityPress, Cambridge, UK and NY, 19–92, 2007.
Stokes, R. H. and Robinson, R. A.: Interactions in aqueous non-electrolyte solutions. I. Solute-solvent equilibria, J. Phys. Chem,70, 2126–2130, 1966.
Stolzenburg, M. R. and McMurry, P. H.: TDMAFIT user’s manual,University of Minnesota, Department of Mechanical Engineer-ing, Particle Technology Laboratory, 1–80, Minneapolis, 1988.
Swietlicki, E., Zhou, J. C., Covert, D. S., Hameri, K., Busch, B.,Vakeva, M., Dusek, U., Berg, O. H., Wiedensohler, A., Aalto, P.,Makela, J., Martinsson, B. G., Papaspiropoulos, G., Mentes, B.,Frank, G., and Stratmann, F.: Hygroscopic properties of aerosolparticles in the northeastern Atlantic during ACE-2, Tellus, 52,201–227, 2000.
Swietlicki, E., Hansson, H.-C., Hameri, K., Svenningsson, B.,Massling, A., McFiggans, G., McMurry, P. H., Petaja, T.,Tunved, P., Gysel, M., Topping, D., Weingartner, E., Bal-tensperger, U., Rissler, J., Wiedensohler, A., and Kulmala, M.:Hygroscopic properties of sub-micrometer atmospheric aerosolparticles measured with H-TDMA instruments in various envi-ronments – a review, Tellus B, 60, 432-469, 2008.
Topping, D. O., McFiggans, G. B., and Coe, H.: A curved mul-ticomponent aerosol hygroscopicity model framework: Part 2 –Including organic compounds, Atmos. Chem. Phys., 5, 1223–1242, 2005a,http://www.atmos-chem-phys.net/5/1223/2005/.
Topping, D. O., McFiggans, G. B., and Coe, H.: A curved mul-ticomponent aerosol hygroscopicity model framework: Part 1– Inorganic compounds, Atmos. Chem. Phys., 5, 1205–1222,2005b,http://www.atmos-chem-phys.net/5/1205/2005/.
Varutbangkul, V., Brechtel, F. J., Bahreini, R., Ng, N. L., Keywood,M. D., Kroll, J. H., Flagan, R. C., Seinfeld, J. H., Lee, A., andGoldstein, A. H.: Hygroscopicity of secondary organic aerosolsformed by oxidation of cycloalkenes, monoterpenes, sesquiter-penes, and related compounds, Atmos. Chem. Phys., 6, 2367–2388, 2006,http://www.atmos-chem-phys.net/6/2367/2006/.
Verheggen, B., Cozic, J., Weingartner, E., Bower, K., Mertes, S.,Connolly, P., Flynn, M., Gallagher, M., Choularton, T., and Bal-tensperger, U.: Aerosol partitioning between the interstitial andthe condensed phase in mixed-phase clouds, J. Geophys. Res.,112, D23202, doi:10.1029/2007JD008714, 2007.
Vlasenko, A., Sjogren, S., Weingartner, E., Stemmler, K., Gaggeler,H. W., and Ammann, M.: Effect of humidity on nitric acid uptake
Atmos. Chem. Phys., 8, 5715–5729, 2008 www.atmos-chem-phys.net/8/5715/2008/
S. Sjogren et al.: Aerosol hygroscopicity at Jungfraujoch, Switzerland 5729
to mineral dust aerosol particles, Atmos. Chem. Phys., 6, 2147–2160, 2006,http://www.atmos-chem-phys.net/6/2147/2006/.
Weingartner, E., Nyeki, S., and Baltensperger, U.: Seasonal anddiurnal variation of aerosol size distributions (10<D<750 nm) ata high-alpine site (Jungfraujoch 3580 m a.s.l.), J. Geophys. Res.,104, 26 809–26 820, 1999.
Weingartner, E., Gysel, M., and Baltensperger, U.: Hygroscopicityof aerosol particles at low temperatures. 1. New low-temperatureH-TDMA instrument: Setup and first applications, Environ. Sci.Technol., 36, 55–62, 2002.
Weingartner, E., Saathoff, H., Schnaiter, M., Streit, N., Bitnar, B.,and Baltensperger, U.: Absorption of light by soot particles: de-termination of the absorption coefficient by means of aethalome-ters, J. Aerosol Sci., 34, 1445–1463, 2003.
Zelenyuk, A., Cai, Y., and Imre, D.: From agglomerates of spheresto irregularly shaped particles: Determination of dynamic shapefactors from measurements of mobility and vacuum aerodynamicdiameters, Aerosol Sci. Technol., 40, 197–217, 2006.
Zhang, Q., Alfarra, M. R., Worsnop, D. R., Allan, J. D., Coe, H.,Canagaratna, M. R., and Jimenez, J. L.: Deconvolution and quan-tification of hydrocarbon-like and oxygenated organic aerosolsbased on aerosol mass spectrometry, Environ. Sci. Technol., 39,4938–4952, 2005.
Zhang, Q., Jimenez, J. L., Canagaratna, M. R., Allan, J. D., Coe,H., Ulbrich, I., Alfarra, M. R., Takami, A., Middlebrook, A.M., Sun, Y. L., Dzepina, K., Dunlea, E., Docherty, K., De-Carlo, P. F., Salcedo, D., Onasch, T., Jayne, J. T., Miyoshi,T., Shimono, A., Hatakeyama, S., Takegawa, N., Kondo, Y.,Schneider, J., Drewnick, F., Borrmann, S., Weimer, S., Demer-jian, K., Williams, P., Bower, K., Bahreini, R., Cottrell, L.,Griffin, R. J., Rautiainen, J., Sun, J. Y., Zhang, Y. M., andWorsnop, D. R.: Ubiquity and dominance of oxygenated speciesin organic aerosols in anthropogenically-influenced NorthernHemisphere midlatitudes, Geophys. Res. Lett., 34, L13801,doi:10.1029/2007GL029979, 2007.
www.atmos-chem-phys.net/8/5715/2008/ Atmos. Chem. Phys., 8, 5715–5729, 2008