hydroxylamine electrochemistry at polycrystalline platinum in acidic media: a voltammetric, dems and...
TRANSCRIPT
Journal ofElectroanalytical
Chemistry
Journal of Electroanalytical Chemistry 566 (2004) 53–62
www.elsevier.com/locate/jelechem
Hydroxylamine electrochemistry at polycrystalline platinum inacidic media: a voltammetric, DEMS and FTIR study
Victor Rosca *, Guillermo L. Beltramo, Marc T.M. Koper *
Laboratory of Inorganic Chemistry and Catalysis, Schuit Institute of Catalysis, Eindhoven University of Technology, 5600 MB Eindhoven,
The Netherlands
Received 7 November 2003; accepted 12 November 2003
Abstract
The electrochemical activity of hydroxylamine on polycrystalline Pt in acidic media has been characterized using cyclic vol-
tammetry, on-line differential electrochemical mass spectrometry (DEMS) and in situ FTIR. The electrochemistry of hydroxylamine
(HAM) is essentially controlled by other species that interact strongly with the electrode surface. Therefore, quite moderate current
densities, both in oxidation and reduction, are observed in a wide potential window between ca 0 and 1 V. The HAM electrore-
duction is a slow process and is masked by the Hupd. No formation of gaseous products was detected in this region; hence, ammonia
must be the main product of HAM reduction. The HAM electro-oxidation is strongly influenced by the adsorption of its products,
as well as their chemical transformations in solution. The key intermediate in HAM oxidation is NO, based both on voltammetric
and spectroscopic evidence. Nitric oxide forms an adsorbed layer, stable over a wide potential region between ca. 0.55 and 0.75 V.
At higher potentials NOads is oxidized to form (adsorbed) HNO2. At potentials above ca. 0.9 V the accumulation of HNO2 in
solution, accompanied by its partial oxidation to NO2, is postulated. N2O formation, observed in the potential region between ca.
0.5 and 1 V, has multiple sources. The most important source of N2O is a homogeneous reaction between HNO2 and HAM. The
Tafel slope analysis suggests the second electron transfer to be the rate-determining step in HAM oxidation to NOads. A tentative
mechanism for this reaction is proposed.
� 2003 Elsevier B.V. All rights reserved.
Keywords: Hydroxylamine; Polycrystalline platinum; Electrocatalysis; Voltammetry; DEMS; FTIR
1. Introduction
Hydroxylamine reactivity in an electrochemical en-
vironmental is important from a fundamental point of
view – in the context of the redox chemistry of inorganic
nitrogen compounds – as well as from a technological
point of view, mostly in relation to its industrial syn-
thesis. In industry, hydroxylamine (HAM), a key inter-
mediate in e-caprolactam production and a compound
with various applications in technology, is obtained bythe liquid-phase catalytic hydrogenation of nitric oxide
(NO) or nitrate at carbon-supported platinum or pal-
ladium catalysts [1,2]. The relevance of the electro-
* Corresponding authors. Tel.: +31-40-247-4916; fax: +31-40-245-
5054.
E-mail addresses: [email protected] (V. Rosca), M.T.M.Koper@
tue.nl (M.T.M. Koper).
0022-0728/$ - see front matter � 2003 Elsevier B.V. All rights reserved.
doi:10.1016/j.jelechem.2003.11.011
chemical studies on similar and model systems for
understanding the processes practiced in industry is wellaccepted [2].
This paper is a first step towards extending our pre-
vious mechanistic studies on NO electrochemistry on Pt
– so far oriented mainly toward the environmentally
important reduction to N2 or the complete reduction to
ammonia [3–5] – to investigating the factors controlling
selectivity toward HAM. However, the investigation of
these factors is hampered by a lack of experimental dataon HAM electrochemistry itself. This is particularly true
for HAM reduction on platinum electrodes in acidic
media [6], which are the conditions of interest from a
practical point of view.
The mechanisms of the electrochemical reactions of
HAM on Pt appear complex [6], and only few detailed
mechanistic studies have been reported so far. In a series
of studies, M€oller and Heckner [7,8] addressed the

54 V. Rosca et al. / Journal of Electroanalytical Chemistry 566 (2004) 53–62
reduction of HAM on bright Pt, using voltammetry and
the rotating disk electrode (RDE) technique. The ad-
sorption of HAM was shown to be the first step in HAM
reduction. The electroreduction on Pt proved difficult to
study, as it is strongly masked by the hydrogen ad-sorption and hydrogen evolution reaction (her). Thus,
M€oller and Heckner [7] interpreted their preliminary
results on HAM reduction at a Pt RDE in acidic media
(pH<3) by the hydrogen adsorption reaction:
NH3OHþads þ e� ! NH2OHþHads ð1Þ
In alkaline media HAM was much more active and re-
duction to ammonia was postulated, although with no
reference to the nature of the adsorbed intermediates. In
a later, more detailed, study, the authors argued for the
possibility of breaking the N–O bond in acidic media as
well. The rate-determining step was formulated as fol-
lows [8]:
NH3OHþads þ e� ! ðNH3Þads þ ðOH�Þads ð2Þ
The low reduction activity of HAM was explained by
the blocking effect of (NH3)ads.
M€oller and Heckner [9–12] also extensively studiedHAM electro-oxidation on bright Pt. Both NH2OH and
NH3OHþ were perceived as reactive species, depending
on pH. The HAM oxidation was described in terms of
successive dehydrogenation steps, paralleled by chemical
side reactions involving the reaction intermediates. In
acidic solution, the first two reaction steps of the
mechanism were formulated as follows:
NH3OHþads ! HNOHþ e� þ 2Hþ ð3Þ
HNOH ! NOH þ e� þHþ: ð4ÞBoth intermediates (which presumably may be consid-ered as adsorbed) were supposed to form N2, HNOH by
dimerization and disproportionation, and NOH by re-
action with HAM. Furthermore, by referring to the
homogeneous association–dissociation of the HNO/
H2N2O2 couple and the decomposition of H2N2O2 to
N2O (see [6] and references therein), the authors took
the experimentally observed N2O evolution as a proof
for NOH formation. It was suggested that nitrate is themain product of HAM oxidation in acidic media and
neutral media, while nitrite is perceived as a stable in-
termediate, particularly in alkaline media.
More recently, Karabinas et al. [13] presented a de-
tailed study of HAM anodic behavior on polycrystalline
Pt in neutral (buffered) and acid solutions by combining
voltammetry and on-line differential electrochemical
mass spectrometry (DEMS). In their mechanism, theauthors accepted the dehydrogenation scenario, result-
ing in NOH formation. The dimerization of NOH to
hyponitrous acid (H2N2O2) and its subsequent decom-
position to N2O and water were also suggested. At po-
tentials up to 0.7 V vs. RHE (pH 6.5, phosphate buffer)
NOH is partially oxidized to NO. As soon as Pt–OH
species become available at the surface, NOH was pro-
posed to be oxidized directly to HNO2, the latter being
considered to be a stable intermediate. The reaction of
HNO2 with HAM was held responsible for the forma-tion of N2O at potentials around 1 V. Above ca. 1.1 V
nitrite is oxidized to nitrate. Oxidation via Pt–OH spe-
cies was perceived as the main reaction pathway in
neutral solutions, while in acidic media the reaction can
partially proceed via NO2 formation.
The present paper describes a new detailed study on
HAM electrochemistry on Pt electrodes, oriented espe-
cially towards the effect of adsorption phenomena. Theelectrochemical data presented here are augmented by
results obtained with on-line DEMS – a technique al-
lowing detection of gaseous products. In order to iden-
tify adsorbates and (adsorbed) intermediates we have
also employed in situ FTIR spectroscopy. As a result,
we will put forward quite a detailed picture of HAM
transformations on polycrystalline Pt in acidic media, as
well as suggest some mechanistic interpretations.
2. Experimental
The H2SO4 and HClO4 working solutions were pre-
pared from their respective concentrated acids (‘‘Su-
prapur’’, Merck) and ultra-pure water (Millipore Milli-
Q system, 18.2 MX cm, 2 ppb total organic carbon). Theinfrared experiments aimed at detection of nitric oxide
and hydroxylamine were performed in H2SO4 solution
prepared with deuterium oxide (Merck, 99.8%). Hy-
droxylamine solutions were prepared by dissolving hy-
droxylammonium sulfate (‘‘Pro Analysi’’, Merck) in
ultra-pure water or deuterium oxide. Prior to each ex-
periment, all solutions were deoxygenated by purging
with argon.A platinum flag electrode was used as the working
electrode during the electrochemical measurements. For
the in situ FTIR measurements, a Pt disk electrode of 10
mm diameter was used. Prior to each experiment, the
working electrode was flame-annealed, cooled down in
an Ar atmosphere for ca. 20 s, quenched in ultra-pure
water and transferred to the cell.
Electrochemical measurements were performed in aconventional single-compartment three-electrode glass
cell, using a computer-controlled potentiostat (Auto-
Lab-PGSTAT20, Eco Chemie, Utrecht, The Nether-
lands). The cell and all the glassware were cleaned by
boiling in a 1:3 mixture of concentrated nitric and sul-
furic acids, followed by repeated boiling with ultra-pure
water. A platinum coiled wire served as the counter
electrode. In H2SO4 solutions a saturatedHgjHg2SO4jK2SO4 electrode, connected via a Luggin
capillary, was used as the reference. In HClO4 solutions
the reference electrode was an internal reversible hy-

Fig. 1. Cyclic voltammograms recorded at a polycrystalline Pt elec-
trode in the presence of hydroxylamine in solution. The numbers in the
legend indicate the upper potential limit of the corresponding cycle.
Experimental conditions: 0.5 M H2SO4; 5� 10�3 M NH2OH; poten-
tial sweep rate 5 mV s�1. Start potential 0.06 V.
V. Rosca et al. / Journal of Electroanalytical Chemistry 566 (2004) 53–62 55
drogen electrode (RHE). However, all potentials are
reported against the RHE.
On-line DEMS measurements were performed with a
computer-assisted Balzers Prisma QMS 200 mass spec-
trometer. The experimental setup was similar to thatdescribed elsewhere [14]. The working electrode, a
freshly platinized Pt gauze (with a roughness factor of
ca. 70–80), was laid on the hydrophobic Teflon mem-
brane (Schleicher and Sch€ull, pore size 0.02 lm), me-
chanically supported by a steel frit that separates the cell
from the vacuum chamber. The response time constant
was about 1 s. The mass signal for m=z 30 (NO) was
corrected for the ion fragmentation probability. Allmass intensities are given in arbitrary units.
The in situ Fourier transform infrared reflection ab-
sorption spectroscopy (FTIRRAS) measurements were
performed under external reflection conditions. The
spectrometer used was a Br€uker IFS113V, equipped
with a narrow-band MCT detector. The spectroelect-
rochemical cell [15] featured a prismatic CaF2 window
beveled at 60�. To acquire FTIRRAS data 500 inter-ferograms, at a resolution of 8 cm�1, were collected at
each potential. The reflectance spectra were calculated
as ðR� R0Þ=R0, where R and R0 are the reflectances at
the sample and reference potentials, respectively. Con-
sequently, the DR=R ratio gives negative bands for spe-
cies that are formed and positive bands for species that
are consumed at the sample potential, as compared to
the reference potential.
3. Results and discussion
3.1. Cyclic voltammetry
The voltammetric profile recorded at a Pt electrode at
low scan rate in the presence of HAM in solution isshown in Fig. 1. In order to avoid HAM oxidation, the
potential sweep experiments were always started in the
hydrogen underpotential deposition (Hupd) region at ca.
0.06 V. Within the limits of the Hupd region (approx.
0.06–0.4 V) HAM is apparently involved in reduction
process(es) only. These seem to be quite sluggish irre-
versible processes, as the increase of the potential sweep
rate up to moderate values (50–100 mV s�1) results in aprofile almost identical to the blank profile, though the
H adsorption peaks are somewhat broader and slightly
shifted towards negative potentials.
Remarkably, around the resting potential (ca. 0.42 V,
as determined from open circuit potential measure-
ments) both HAM reduction and oxidation may take
place simultaneously, which is in agreement with the fact
that HAM may disproportionate in the presence of a Ptcatalyst [1]. Hence, there is no well-defined boundary
between the HAM electroreduction and electro-oxida-
tion. A gradual increase of the upper potential limit
gives rise to the oxidation feature EO4, followed by a
region (0.55–0.75 V) of low positive current. Above ca.
0.75 V another oxidation feature emerges (EO5). In the
negative-going part of the cyclic voltammograms, pre-
sented in Fig. 1, an important increase in height and a
slight change in position of the reduction peak ER2, as
well as the development of the feature ER1 are observed,
while peak ER3 does not change. Similar experiments inperchloric acid give a qualitatively identical picture
(Fig. 2). However, slightly higher positive current den-
sities are observed in the potential region between 0.4
and 0.9 V, most probably due to the absence of any
significant anion adsorption, resulting also in lower
potentials at which the surface oxidation occurs. The
qualitative effect of anion co-adsorption was well de-
fined in all experiments performed in perchloric acid, inspite of introducing a small amount of sulfate by adding
hydroxylammonium sulfate.
These voltammetric features can be explained in
terms of HAM oxidation to NO (anodic peak EO4),
resulting in the formation of an NO ad-layer, and its
subsequent reductive stripping in the negative-going
sweep (cathodic features ER1, ER2, ER3). The following
considerations support this conclusion. First, the posi-tion of the three reduction features is very close to those
observed in the case of the reductive stripping of an NO
ad-layer under the same experimental conditions [3].
Second, the Tafel slope analysis of the peaks ER2 and
ER3, when plotted as peak position ðEpÞ vs. logarithm of
the scan rate (log(m)) [16,17], gives slopes of ca. 50 and
19 mV dec�1 (Fig. 3), respectively, values close to those
observed for the corresponding features in the case of

Table 1
The results of the least-square linear regression analysis of the peak
current vs. the potential sweep rate dependence for the features (peaks)
presented in Fig. 1
Peak H2SO4 HClO4
105 (intercept�SDa)
(A s V�1)
105 (intercept�SDa)
(A s V�1)
ER2 )5.60� 0.88 )5.94� 0.16
ER3 )8.43� 0.18 )11.84� 0.02
EO4 3.79� 0.52 3.26� 0.40
Experimental conditions: as in Fig. 1. 5–10 experimental points
were used in regression analysis. The square of the correlation coeffi-
cient ðR2Þ was higher than 0.999 in all cases.a Standard deviation of the intercept.
Fig. 2. Cyclic voltammograms recorded at a polycrystalline Pt elec-
trode in the presence of hydroxylamine in solution. The numbers in the
legend indicate the upper potential limit of the corresponding cycle.
Experimental conditions: 0.5 M HClO4; 5� 10�3 M NH2OH; poten-
tial sweep rate 5 mV s�1. Start potential 0.06 V.
Fig. 3. Tafel slope analysis of the reduction peaks ER2 and ER3 (see
Fig. 1). Experimental conditions: 0.5 M H2SO4; 5� 10�3 M NH2OH.
The CV profiles analyzed were obtained according to the following
potential program: (i) after a potential of 0.7 V was applied for 10 s, (ii)
the potential was swept in the negative direction.
56 V. Rosca et al. / Journal of Electroanalytical Chemistry 566 (2004) 53–62
NO ad-layer stripping (54 and 20 mV dec�1) [3]. Im-portantly, the ER3 peak should be considered as a vol-
tammetric feature corresponding to the hydrogen
adsorption with some contribution of the co-adsorbed
HAM and the adsorbed NO reduction (if any NO was
generated at higher potentials). However, the value of
the Tafel slope, though of no mechanistic value, is likely
to be determined by the presence of the adsorbed NO.
Once formed, the NO ad-layer essentially blocks further
HAM oxidation in the potential region between 0.55
and 0.75 V. Nevertheless, from the effect of the upper
potential limit on the reduction peak ER2 and reductionfeature ER1, it can be concluded that in this region slow
oxidation of HAM and NO ad-layer formation are still
taking place.
Further evidence for adsorbed NO as the main
(stable) intermediate of HAM oxidation is provided by
transfer experiments. The working electrode was im-
mersed in a deoxygenated electrolyte solution (sulfate)
containing 10 mM of HAM for 1 min. Next, the elec-trode was thoroughly washed with ultra pure water and
immediately transferred to another electrochemical cell
containing no HAM. Then, the electrode potential was
swept in the negative-going direction. The resulted
voltammetric profile strongly resembles that observed
in the case of the NO ad-layer stripping [3]. Further-
more, a single potential sweep was enough to recover
the blank voltammogram of clean platinum. The NOcoverage, determined from the charge analysis, ranged
between 0.2 and 0.3. In conclusion, adsorbed NO is the
only adsorbed intermediate detected in the transfer
experiments.
From a linear regression analysis of the peak height
ðIpÞ vs. potential sweep rate ðmÞ dependence (Table 1) it
can be concluded that the processes corresponding to
features ER2, ER3 and EO4 are all surface confined, bothin sulfuric and perchloric acid. For the features ER2 and
ER3 the intercepts (extrapolated to zero scan rate) are
slightly different from zero in both media, as the NO
reductive stripping is paralleled by the H adsorption and
slow HAM reduction. Similarly, the small non-zero in-
tercept in case of the oxidation feature EO4, also ob-
served by Karabinas et al. [13] in neutral (buffered)
media, may point to the existence of a slow parallel(continuous) oxidation process.
Fig. 4 shows voltammetric profiles recorded at dif-
ferent HAM concentrations. As can be seen from the
data for the lowest concentration, the positive-going

Fig. 4. The effect of the hydroxylamine concentration on the voltam-
metric profile recorded at a polycrystalline Pt electrode. Experimental
conditions: as in Fig. 1. The hydroxylamine concentration as indicated
by the numbers in the legend.
Fig. 5. The Tafel slope analysis for the oxidation peak EO4 in sulfuric
acid. Experimental conditions: as in Fig. 1.
Fig. 6. The Tafel slope analysis for the oxidation peak EO4 in per-
chloric acid. Experimental conditions: as in Fig. 2.
V. Rosca et al. / Journal of Electroanalytical Chemistry 566 (2004) 53–62 57
scan, started at 0.06 V, shows a gradual increase of the
negative current within the Hupd region, with a maxi-
mum at ca. 0.3 V. This could imply that the reduction of
HAM may be simply blocked by the Hupd, as is also the
case for the nitrate reduction on Pt [18].
The Tafel slope analysis of the oxidation feature EO4
gives values of 41 and 38 mV dec�1 in sulfuric andperchloric acid, respectively, thus suggesting the second
electron transfer to be rate-limiting in the oxidation
process. Interestingly, in a narrow window of sweep
rates, the Tafel slope linearity breaks down (Figs. 5 and
6), both in sulfuric and perchloric acid. At higher sweep
rates the slope apparently re-establishes its value as that
observed at low sweep rates. This effect is more pro-
nounced for data obtained in perchloric acid (Fig. 6).Again, this points towards to the occurrence of a sur-
face-confined process in parallel with a (slow) continu-
ous oxidation process. We will discuss a possible
candidate for this latter process in the next two sections.
3.2. On-line DEMS measurements
Differential electrochemical mass spectrometry is atechnique enabling detection and, under certain condi-
tions, measuring the formation rate of gaseous as well as
volatile products as a function of the applied electrode
potential [14,19]. The ion current is recorded simulta-
neously with the cyclic voltammetry run. The resulting
curves are usually referred to as mass spectrometric
cyclic voltammograms (MSCVs). The technique is par-
ticularly useful in the case of electrochemical transfor-mations of inorganic nitrogen-containing compounds,
as the formation of various gaseous products is possible
[3,4,13,18,20].
The cyclic voltammograms recorded at the DEMS
working electrode, along with the corresponding
MSCVs for selected m=z ratios, recorded both in sulfuric
and perchloric acid, are presented in Figs. 7 and 8, re-spectively. It should be mentioned that evolution of the
m=z 28 signal (N2), also shown in Figs. 7 and 8, is dif-
ficult to interpret in terms of in situ electrolytic forma-
tion of N2, as the background signal was too high for
this mass. In sulfuric acid there is a wide potential
window between ca. 0 and 0.8 V where hardly any
gaseous products could be detected in the positive going
sweep (see Fig. 7). First, this result indicates that nosignificant formation of gaseous products takes place in
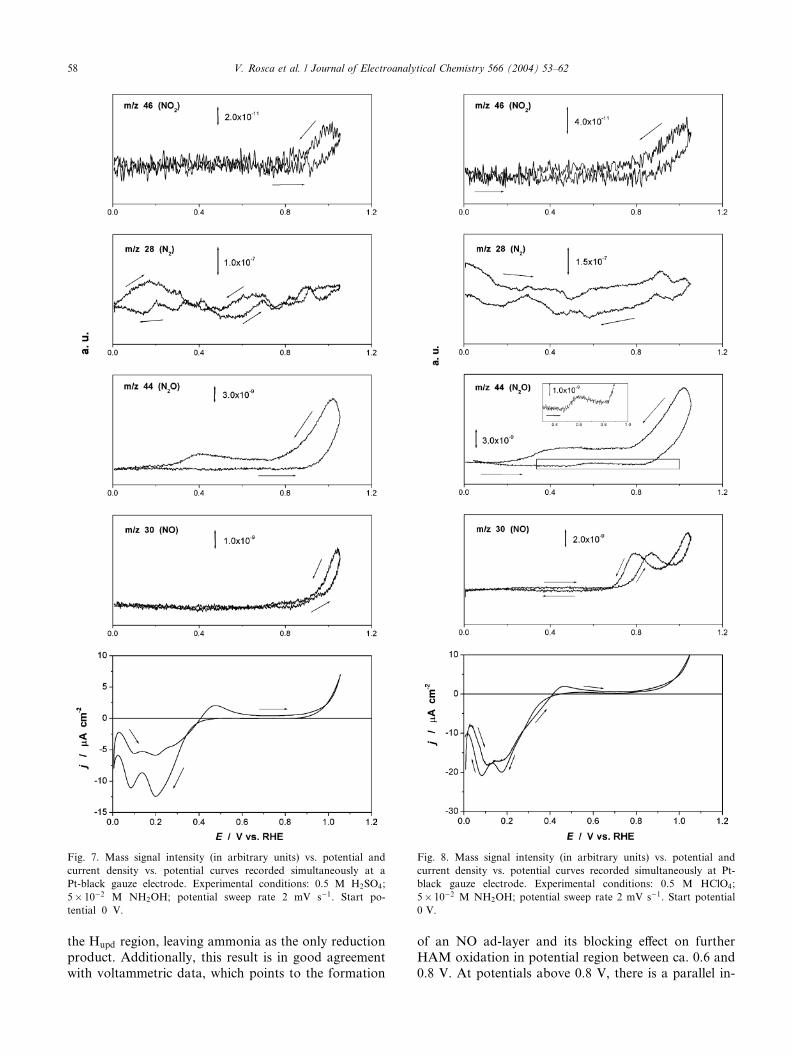
Fig. 8. Mass signal intensity (in arbitrary units) vs. potential and
current density vs. potential curves recorded simultaneously at Pt-
black gauze electrode. Experimental conditions: 0.5 M HClO4;
5� 10�2 M NH2OH; potential sweep rate 2 mV s�1. Start potential
0 V.
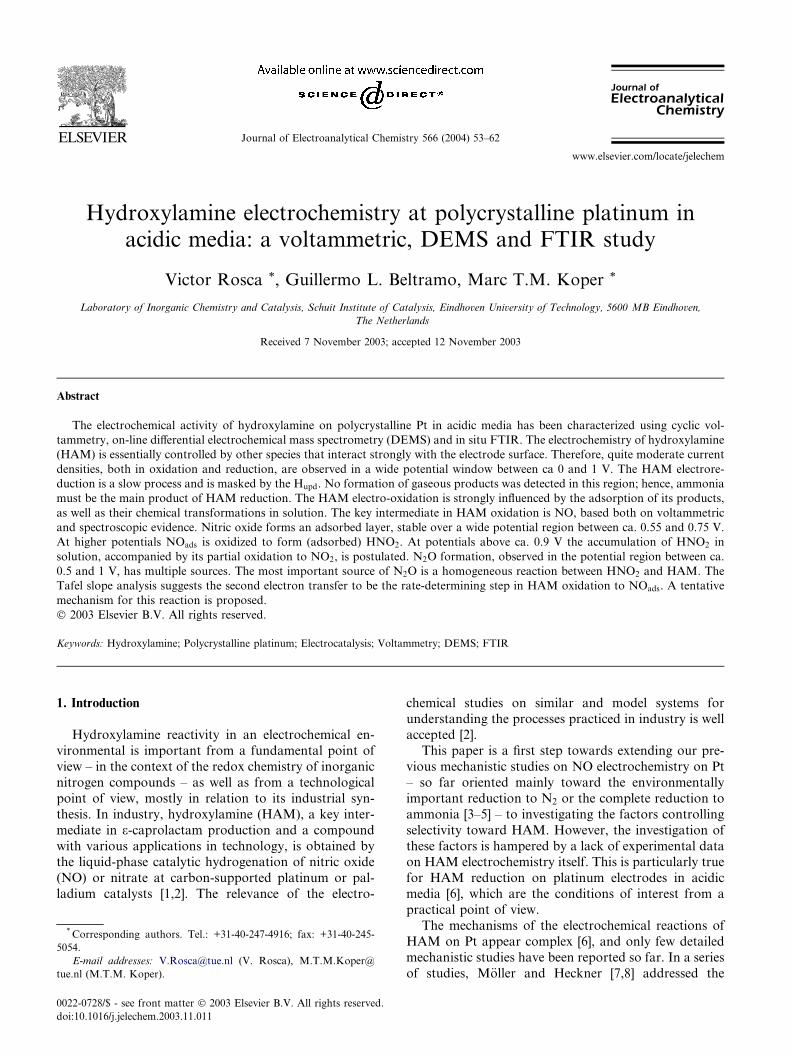
Fig. 7. Mass signal intensity (in arbitrary units) vs. potential and
current density vs. potential curves recorded simultaneously at a
Pt-black gauze electrode. Experimental conditions: 0.5 M H2SO4;
5� 10�2 M NH2OH; potential sweep rate 2 mV s�1. Start po-
tential 0 V.
58 V. Rosca et al. / Journal of Electroanalytical Chemistry 566 (2004) 53–62
the Hupd region, leaving ammonia as the only reduction
product. Additionally, this result is in good agreement
with voltammetric data, which points to the formation
of an NO ad-layer and its blocking effect on further
HAM oxidation in potential region between ca. 0.6 and
0.8 V. At potentials above 0.8 V, there is a parallel in-
V. Rosca et al. / Journal of Electroanalytical Chemistry 566 (2004) 53–62 59
crease of the electrical current density and the formation
of NO (m=z 30), N2O (m=z 44) and NO2 (m=z 46).In order to facilitate further discussion of the DEMS
results, it will be useful to summarize briefly the mech-
anisms of NO oxidation on Pt. The final product of theadsorbed NO oxidation on Pt in acidic media is nitrate,
while nitrite, or nitrous acid, is perceived as an impor-
tant intermediate [21]. However, adsorbed NO proved
to be quite resistant to complete oxidation, the process
being accompanied by the oxidation of the Pt surface
[22]. From the Tafel slope analysis, an EC mechanism
for the oxidation of adsorbed NO on Pt was proposed.
The following electrochemical equilibrium is assumed:
NOads þH2O¡ðHNO2Þads þHþ þ e� ð5ÞThe subsequent rate-determining chemical step is at
present unclear. Kinetic analysis, based on results from
rotating disk experiments, indicates that continuous NO
oxidation proceeds via HNO2 to nitrate as the finalproduct [23].
Having established the formation of HNO2, N2O
formation at potentials higher than ca. 0.8 V (Fig. 7, m=z44) can be explained by a reaction of HNO2 with HAM
present in solution, as also argued by Karabinas et al.
[13] in the case of HAM electro-oxidation in neutral
(buffered) media. Curiously, formation of some N2O is
also observed well below 0.8 V in the negative-goingpart of MSCVs with a maximum at ca. 0.4 V. As the
simultaneously recorded CV shows low current densities
in the region under consideration, this could still be a
homogeneous reaction between residual HNO2 and
HAM, though the maximum at ca. 0.4 V suggests the
existence of an additional source of N2O formation,
possibly electrochemical. Interestingly, based on DEMS
measurements, Nishimura et al. [24] argued for the di-rect electrolytic HNO2 reduction to N2O in a potential
region between 0.2 and 0.8 V vs. RHE in 0.5 M H2SO4.
In a more recent FTIR study, Bae et al. [25] have con-
firmed this conclusion.
In strong acids (see [6] and references therein), NO2 is
perceived as the main product of HNO2 oxidation and
the primary intermediate of HNO2 oxidation to nitrate
in moderately acidic (pH 0.5–3) and neutral solution[26]. This could account for the onset of the mass signal
corresponding to m=z 46 (NO2) at potentials just above
0.8 V (Fig. 7). The MSCV at m=z 30 is non-zero even
after correction for the ion fragmentation. This fact
points to accumulation of some NO in solution. Possible
sources of NO could be homogeneous disproportion-
ation of HNO2 (see [6] and references therein) or, per-
haps, partial desorption of the NO ad-layer.The MSCVs recorded in perchloric acid give a picture
qualitatively similar to that in sulfuric acid, though
higher electrical current densities as well as mass signals
for the 46, 28 and 30 m=z values are observed (Fig. 8).
This is probably due to the lower potentials at which
oxygen adsorption on Pt begins in perchloric acid (see
the blank CV in Fig. 2). The NO accumulation in so-
lution starts at ca. 0.7 V, ca. 100 mV lower compared to
sulfuric acid. Additionally, two peaks in NO formation
(m=z 30) can be seen, suggesting multiple sources of NO.Interestingly, formation of some N2O in perchloric acid
is observed at potentials as low as ca. 0.5 V (see the inset
in the plot for m=z 44, Fig. 8) in the positive-going
sweep, compared to ca. 0.8 V in sulfuric acid. A possible
explanation for this result is a slow catalytic reaction
between HAM and adsorbed NO, as suggested by van
de Moesdijk [1] from catalytic studies on carbon-sup-
ported Pt, although admittedly the effect of the catalystpotential and electrolyte composition are not known.
M€oller and Heckner [7] and later Karabinas et al. [13]
have suggested a dimerization of NOH on the surface
and the subsequent disproportionation of the dimer as
the possible source of N2O. However, our own results
have shown that the reduction of adsorbed NO does not
yield N2O unless there is NO in solution [3].
When presenting CV data, we have argued for am-monia to be the main, if not the only, product of HAM
reduction in the Hupd region. However, as suggested in
early studies on electrochemical reduction of HAM on
mercury [27,28] and later argued in a detailed mecha-
nistic study by Heyrowsky and Vavricka [29], HAM
may be involved in enhancing the hydrogen reduction.
In order to check the occurrence of this effect on Pt, we
have followed the influence of the HAM concentrationon the m=z 2 (H2) mass signal. The applied potential was
0.06 V, i.e. the negative potential limit of Hupd region. A
gradual increase of the HAM concentration indeed
brought about a (statistically) significant gradual in-
crease of the m=z 2 mass signal. A leveling of the mass
signal was observed at ca. 50 mM HAM. The mass
current reached was ca. 3% higher than that in the ab-
sence of NH2OH in solution. Hence, the effect may bestatistically significant but certainly not catalytically
significant.
3.3. In situ FTIR measurements
The consumption of HAM as well as the accumula-
tion of the intermediates and products of its oxidation in
the thin layer and on the platinum surface can bemonitored as a function of the applied potential by in
situ FTIRRAS, once their characteristic spectroscopic
features are well separated from the others. The band
displayed at ca. 1460 cm�1 [30] was assigned to the –
NOH bending ðdÞ mode in NH3OHþ and used for
HAM detection. This assignment is confirmed by values
calculated with the Gaussian 98 software package [31],
predicting a value of 1507 cm�1 for the –NOH bendingðdÞ mode in H3NOHþ and 1486 cm�1 in D3NOHþ.Other possible vibrational modes are well separated
from the 1460–1500 cm�1 frequency range (see Table 2).

Table 2
Vibration frequences corresponding to different vibrational modes in hydroxylamine and ammonia in UHV, as calculated with the Gaussian 98
software package or as cited in the literature
Species Vibration frequency (cm�1) Ref.
ðdÞ-N–H2 ðdÞ-N–O–H ðmÞ-N–O–
H3NOHþ 1598–1686 1507 1196 This work
D3NOHþ 1205–1219 1486 991
D3NODþ 1205–1219 1159 988
NHþ4 1680 – – [31]
NDþ4 1215 – –
60 V. Rosca et al. / Journal of Electroanalytical Chemistry 566 (2004) 53–62
Note that –(H–N–H) ðdÞ mode exhibits an isotopic shift
of 400 cm�1 compared to –(D–N–D) (Table 2). An
isotopic effect is also expected for the –N–O–H ðdÞmode, when H is replaced by D (Table 2). However, this
effect is not expected, as in our experiments we have
used fully hydrogenated HAM, and the H atom in –
NOH group is not exchangeable. Bulk N2O gives anasymmetric stretch ðm1Þ band, centered at 2231 cm�1
[32]. In principle, detection of NO, both in adsorbed and
dissolved forms, is possible, though the assignment of
the vibrational modes of NO adsorbed on the Pt surface
must be carried out with great care. In all IR experi-
ments to be described below, the upper potential limit
was 0.9 V, in order to avoid massive HAM depletion in
the thin layer. In all cases the reference spectrum was thespectrum collected at 0.1 V.
Fig. 9 shows the IR spectra for selected frequency
ranges and electrode potentials. From Fig. 9(A) and (B)
consumption of HAM and formation of N2O in the thin
layer can be deduced. The band frequencies of adsorbed
Fig. 9. Potential difference FTIR spectra collected at a polycrystalline Pt elec
0.1 V. Experimental conditions: 0.1 M H2SO4 + 1.5� 10�2 M NH2OH; in H
NO are situated in a wide frequency range between 1450
and 1800 cm�1, depending on both coverage and applied
potential (see for example [33] and references therein).
As shown in Fig. 9, spectrum (C), in this frequency
window a series of negative-going spectroscopic features
is observed. Some of these, in particular the feature(s) in
the 1550–1650 cm�1 frequency range, can be tentativelyassigned to the vibrational modes of multifold coordi-
nated NO [34]. Features in the 1550–1650 cm�1 range as
well as a bipolar band centered at ca. 1760 cm�1 (as
compared to the negative-going band at ca. 1720 cm�1
in Fig. 9(C)) were observed by Gootzen et al. [35] for
NO ad-layers on polycrystalline platinum.
The integrated area of the bands corresponding to
different vibrational modes provides a measure of theconsumption or formation of that species in the thin layer.
By plotting the integrated area vs. potential, trends in
HAM consumption and N2O formation can be followed.
From such a plot (Fig. 10), it can be deduced that HAM is
consumed over the whole potential region examined.
trode at different applied potentials (as indicated). Reference potential
2O (B) and in D2O (A and C); p-polarized light.
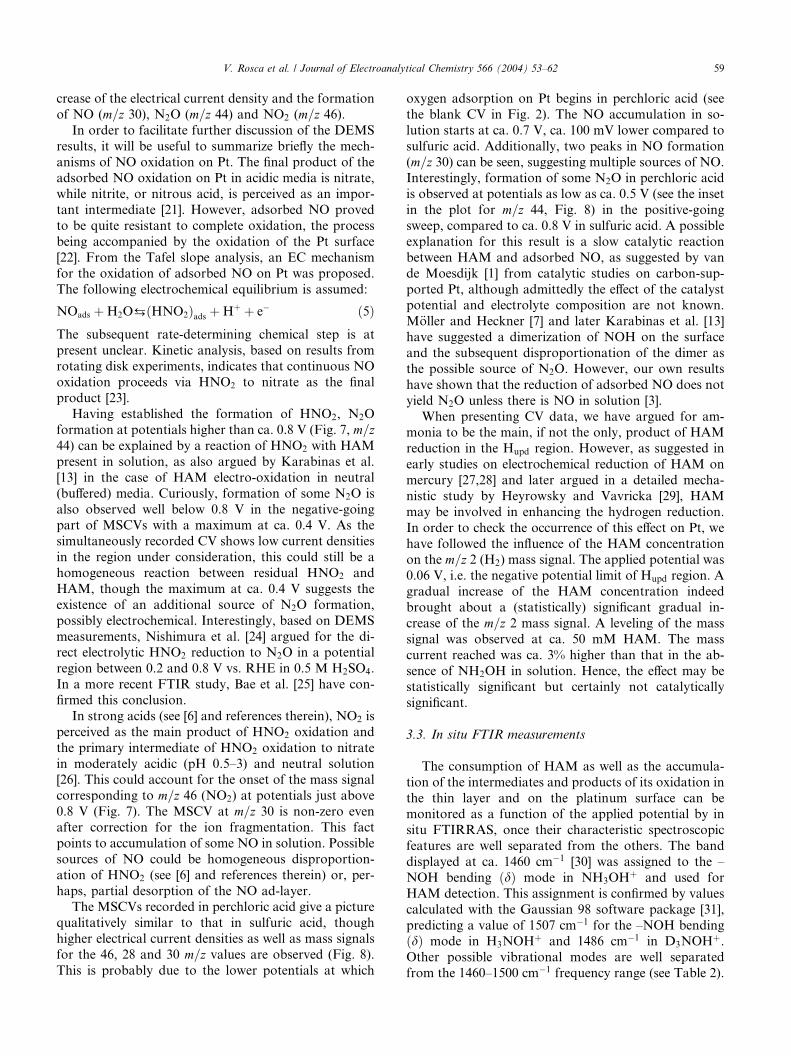
Fig. 10. Trends in hydroxylamine consumption and N2O formation as
a function of the applied potential. See text for details. Experimental
conditions: as in Fig. 9.
V. Rosca et al. / Journal of Electroanalytical Chemistry 566 (2004) 53–62 61
Apparently,HAMconsumption slows down at potentials
where the EO4 oxidation feature occurs, thus confirming
the surface blocking effect of adsorbed NO, as also de-
duced from the voltammetric profile (Fig. 1). From thesame plot it can be seen that N2O formation starts at ca.
0.45 V, close to the potential at which N2O formation is
observed in perchloric acid by DEMS (Fig. 8). This result
allows us to conclude that N2O formation starts at ca.
0.45 V in both sulfuric and perchloric acid, although the
extent of its formation is controlled by the nature of the
anion. This is a strong indication for the N2O formation
being the (slow) continuous oxidation process parallel toNOads formation, as from Figs. 5 and 6 this process is
expected to begin around 0.5 V.
3.4. Mechanistic implications for HAM oxidation
The results of the Tafel slope analysis suggest the
second electron transfer to be the rate-determining step
in HAM oxidation to surface-bonded NO. The follow-ing simplified reaction scheme is tentatively proposed:
H3NOHþ¡H3NOHþ
ads ð6Þ
H3NOHþads¡H2NOads þ 2Hþ þ e� ð7Þ
H2NOads ! HNOads þHþ þ e� rds ð8Þ
HNOads ! NOads þHþ þ e� ð9ÞThe HNO and H2NO intermediates are suggested on
the basis of their lower energy in vacuum compared to the
NOH and HNOH species, as deduced from theoretical
calculations [3,5]. However, it has to be admitted that the
stability of surface-bonded species is not known. It was
also suggested [5] that in the back reaction to reaction (9)
the proton is transferred directly from the solution. Thisidea is also supported by the position of the oxidation
feature EO4, which occurs at a potential where the H
coverage is negligible, if not zero. We have assumed here
that the protonated form of HAM is the active species,
although it is commonly assumed that both NH2OH and
NH3OHþ are reactive species, depending on pH (see [6]
and references therein). As discerned from the DEMS as
well as FTIR results, starting at ca. 0.5 V, the process is
paralleled by the (slow) formation ofN2O,most probablythrough a reaction between adsorbedNOandHAMfrom
the solution. At potentials above ca. 0.8 V, adsorbed NO
is subjected to further oxidation.
It is informative to compare the reaction scheme
proposed for HAM oxidation to NOads and the mech-
anism proposed for reduction of NOads [3,5]. The NOads
reduction is perceived as a stepwise hydrogenation
process, in which the formation of HNO and H2NOintermediates is assumed:
NOads þHþ þ e�¡HNOads equilibrium ð10Þ
HNOads þHþ þ e� ! H2NOads rds ð11Þ
H2NOads þ 4Hþ þ 3e� ! NHþ4 þH2O: fast ð12Þ
Ammonia was shown to be themain product of reduction
of the adsorbed NO on platinum. Importantly, the pro-
tons in reactions (10) and (11) seem to be transferred di-
rectly from a solution hydronium species [5]. Comparingreactions (8) and (11), it is noticed that these reactions are
the forward and back reactions of the same transforma-
tion and, at the same time, rate-determining steps in the
corresponding reaction schemes. This suggests that the
energetic barrier for theHNO$H2NO transformation is
the highest barrier in the whole NO$NH2OH chain of
transformations, whatever the direction.
3.5. Mechanistic implications for HAM reduction
The HAM electroreduction on platinum is strongly
masked by the Hupd and the her at higher overpotentials.
Most importantly, the experimental data presented
above strongly suggest the absence of any formation of
gaseous products in the Hupd region, thus pointing to
ammonia as the main, if not the only, product of HAMcathodic activity:
NH3OHþads þ 2e� þ 2Hþ ! NHþ
4 þH2O: ð13ÞAt high hydrogen coverage the HAM reduction is in-
hibited, as the HAM adsorption sites are blocked by theHupd. The nature and adsorption geometry of the ad-
sorbate corresponding to the nitrogen oxidation state in
HAM is currently not known. Finally, a catalytic effect
of HAM toward the hydrogen reduction process on
platinum, as claimed for Hg electrodes, does not appear
significant.
4. Conclusions
In this paper we have reported on the electrochemical
activity of hydroxylamine on polycrystalline Pt in acidic
62 V. Rosca et al. / Journal of Electroanalytical Chemistry 566 (2004) 53–62
media, as discerned from cyclic voltammetry, on-line
DEMS and in situ FTIRRAS.
Since HAM appears to adsorb relatively weakly on
platinum, HAM electrochemistry seems to be controlled
by other species that interact strongly with the electrodesurface, e.g. hydrogen or (bi)sulfate anion. This can be
seen even better from studies on single-crystal Pt elec-
trodes [36]. Therefore, quite moderate current densities,
both in oxidation and reduction, are observed in a wide
potential window between ca 0 and 1 V.
The HAM electroreduction is a slow process and is
strongly masked by the Hupd. At the same time, HAM
reduction is possible in the Hupd region only. We did notobserve formation of gaseous products in this region;
hence, ammonia must be the main product of HAM
reduction.
The HAM electro-oxidation is strongly influenced by
the adsorption of its products, as well as their chemical
transformations in solution. The key intermediate in
HAM oxidation is NO. It forms an adsorbed layer,
virtually stable over a wide potential region between ca.0.55 and 0.75 V. It acts as a poison for further HAM
oxidation, in a fashion very similar to the way adsorbed
CO poisons methanol oxidation. At higher potentials,
where oxygen adsorption starts, NOads is oxidized to
form (adsorbed) HNO2. At potentials as high as ca. 0.9
V the accumulation of HNO2 in solution, accompanied
by its partial oxidation to NO2, are postulated. N2O
formation, observed in the potential region between ca.0.5 and 1.0 V, probably has multiple sources. The most
important source of N2O is a homogeneous reaction
between HNO2 and HAM [37], since a dramatic increase
in N2O formation is observed at potentials where NO is
oxidized to HNO2.
The Tafel slope analysis suggests the second electron
transfer to be the rate-determining step in HAM oxi-
dation to NOads, the latter being perceived as the stableintermediate in the total oxidation. Our results are lar-
gely in agreement with the mechanistic picture given by
Karabinas et al. [13]. Firstly, we have also observed N2O
formation starting at ca. 0.5 V. Furthermore, the
mechanism of HAM oxidation to NO, proposed in this
paper, assumes formation of two intermediates, corre-
sponding to the HAM dehydrogenation steps. The main
difference between our mechanism and that suggestedpreviously lies in the identification of the key adsorbed
intermediate. Whereas Karabinas et al. have suggested
NOH, our results seem to point to NO as the stable
intermediate in HAM oxidation, based on voltammetric
as well as spectroscopic evidence.
Acknowledgements
This work was supported by a grant from the Neth-
erlands Organization for Scientific Research (NWO).
Technical assistance by Jos van Wolput in the IR mea-
surements is gratefully acknowledged.
References
[1] C.G.M. van de Moesdijk, Ph.D. Thesis, Eindhoven University of
Technology, 1979.
[2] G.R. Tauszik, P. Crocetta, Appl. Catal. 17 (1985) 1.
[3] A.C.A. de Vooys, M.T.M. Koper, R.A. van Santen, J.A.R. van
Veen, Electrochim. Acta 46 (2001) 923.
[4] A.C.A. de Vooys, M.T.M. Koper, R.A. van Santen, J.A.R. van
Veen, J. Catal. 202 (2001) 387.
[5] G.L. Beltramo, M.T.M. Koper, Langmuir 19 (2003) 8907.
[6] W.J. Plieth, in: A.J. Bard (Ed.), Encyclopedia of Electrochemistry
of the Elements, vol. 8, Marcel Dekker, New York, 1978, p. 422.
[7] D. M€oller, K.H. Heckner, Z. Chem. 11 (4) (1971) 157.
[8] D. M€oller, K.H. Heckner, Z. Phys. Chem. 255 (1) (1974) 33.
[9] D. M€oller, K.H. Heckner, Z. Chem. 11 (1) (1971) 32.
[10] D. M€oller, K.H. Heckner, Z. Chem. 11 (9) (1971) 356.
[11] D. M€oller, K.H. Heckner, Z. Chem. 10 (12) (1970) 477.
[12] D. M€oller, K.H. Heckner, Z. Phys. Chem. 251 (1–2) (1974) 81.
[13] P. Karabinas, O. Wolter, J. Heitbaum, Ber. Bunsenges. Phys.
Chem. 88 (1984) 1191.
[14] O. Wolter, J. Heitbaum, Ber. Bunsenges. Phys. Chem. 88 (1984) 2.
[15] T. Iwasita, F.C. Nart, W. Vielstich, Ber. Bunsenges. Phys. Chem.
94 (1990) 1030.
[16] P.A. Christensen, A. Hamnett, Techniques and Mechanisms in
Electrochemistry, Blackie Academic and Professional, Glasgow,
1994, p. 61.
[17] M.T.M. Koper, A.P.J. Jansen, R.A. van Santen, J.J. Lukkien,
P.A.J. Hilbers, J. Chem. Phys. 109 (1998) 6051.
[18] G.E. Dima, A.C.A. de Vooys, M.T.M. Koper, J. Electroanal.
Chem. 554–555 (2003) 15.
[19] S. Bruckenstein, R.R. Gadde, J. Am. Chem. Soc. 93 (1971) 793.
[20] A.C.A. de Vooys, M.T.M. Koper, R.A. van Santen, J.A.R. van
Veen, J. Electroanal. Chem. 506 (2001) 127.
[21] A.C.A. de Vooys, G.L. Beltramo, B. van Riet, J.A.R. van Veen,
M.T.M. Koper, Electrochim. Acta, in press.
[22] A.C.A. de Vooys, Ph.D. Thesis, Eindhoven University of Tech-
nology, 2001.
[23] D. Dutta, D. Landolt, J. Electrochem. Soc. 119 (1972) 1320.
[24] K. Nishimura, K. Machida, M. Enyo, Electrochim. Acta 36 (1991)
877.
[25] I.T. Bae, R.L. Barbour, D.A. Scherson, Anal. Chem. 69 (1997) 249.
[26] G. Raspi, F. Pergola, Chim. Ind. (Milan) 45 (1963) 1398.
[27] S.J. Zdanov, A.N. Frumkin, Dokl. Akad. Nauk SSSR 92 (1953)
789.
[28] M.V. Stackelberg, W. Hans, W. Jensch, Z. Electrochem. 62 (1958)
839.
[29] M. Heyrowsky, S. Vavricka, Collect. Czech. Chem. Commun. 34
(1969) 1204.
[30] C.J. Pouchert, The Aldrich Library of Infrared Spectra, Aldrich
Chemical, Milwaukee, 1981.
[31] M.J. Frisch et al., Gaussian 98, Gaussian Inc., Pittsburgh, PA,
1999.
[32] K. Nakamoto, Infrared and Raman Spectra of Inorganic and
Coordination Compounds, Wiley, New York, 1986.
[33] R. Gomez, A. Rodes, J.M. Orts, J.M. Feliu, J.M. Perez, Surf. Sci.
342 (1995) L1104.
[34] M.J. Weaver, S. Zou, C. Tang, J. Chem. Phys. 111 (1999) 365.
[35] J.F.E.Gootzen,R.M. vanHardeveld,W.Visscher, R.A. van Santen,
J.A.R. van Veen, Recl. Trav. Chim. Pays-Bas 115 (1996) 480.
[36] V. Rosca, G.L. Beltramo, M.T.M. Koper, manuscript in prepa-
ration.
[37] C. Doring, H. Gehlen, Z. Anorg. Allg. Chem. 312 (1961) 32.