hydrothermal alteration and main structures mapping … · áreas que presentan alteración...
TRANSCRIPT

Hydrothermal alteration and main structures mapping using TMimages in La Primavera geothermal field (Mexico)
Fernández de la Vega-Márquez, T.1, R. M. Prol-Ledesma2 and G. Orozco3
1 Facultad de Filosofía, UNAM, México2 Instituto de Geofísica, UNAM, México3 Schlumberger, Melbourne, Australia
Received: April 13, 2000; accepted: May 21, 2001.
RESUMENImágenes Landsat TM del campo geotérmico de La Primavera se utilizaron para identificar estructuras principales, y localizar
áreas que presentan alteración hidrotermal. Los métodos utilizados en el procesamiento de las imágenes incluyen análisis estadísticounivariado y multivariado, así como realce espectral y espacial. La vegetación en el área no se compone de plantas con hojasgrandes; sin embargo, sí se presenta interferencia entre el espectro de la vegetación y él de la alteración hidrotermal. Para superaresta interferencia, se utilizaron la técnica de Crosta y el método de Loughlin (Crosta and Moore 1989; Loughlin 1991). Comoresultado de este procesado, se logró detectar la presencia de minerales que contienen óxidos de hierro e hidroxilos. Las imágenesresultantes fueron desplegadas en tonos de gris y en composiciones de falso color para resaltar las estructuras principales y lasrocas alteradas, respectivamente. Las zonas de alteración identificadas presentan una correlación con los flujos de descarga delyacimiento geotérmico, así como con las estructuras principales que controlan la permeabilidad del yacimiento y de la capa sello.Por lo tanto, la localización en la superficie de las rocas alteradas será de gran utilidad en la identificación de la presencia dedescargas de fluidos del yacimiento geotérmico.
PALABRAS CLAVE: Geotermia, alteración, imágenes TM, percepción remota, México.
ABSTRACTLandsat TM images of the La Primavera geothermal field area were used to identify the main structures within the field, and
to locate areas that show hydrothermal alteration. The methods used in the processing of the images include univariate andmultivariate statistical analysis, spectral and spatial enhancement. Vegetation in the area is not composed by wide leaf plants;however, there is interference between the spectra of vegetation and hydrothermal alteration. In order to overcome this interfer-ence, the Crosta technique and the Loughlin method were used (Crosta and Moore 1989; Loughlin 1991). As a result, iron oxidesand hydroxyl minerals were detected in the area. The resulting images were displayed in gray tones and false color composites toenhance main structures and the altered rocks respectively.
The identified alteration zones were correlated with the discharged flows from the geothermal reservoir, and with the mainstructures that control the permeability of the reservoir and the cap rock; therefore, locating hydrothermally altered rocks in thesurface will help to determine the presence of upflows from the geothermal reservoir.
KEY WORDS: Geothermal, alteration, TM images, remote sensing, Mexico.
INTRODUCTION
Geothermal energy exploration with satellite images isuseful in the early stages of exploration. Thematic mappingmultispectral images from Landsat satellites cover the vis-ible and infrared spectrum of hydrothermal alterations (Hunt1977, 1979; Hunt and Ashley, 1979). Identification of alter-ations in a geothermal area may be used to locate faults thatgenerate secondary permeability. The use of satellite imagesin geothermal exploration has been reported in a few cases(Mongillo et al., 1995; Deroin et al., 1996). However, inmining exploration, satellite images have been widely usedto identify hydrothermally altered areas and to identify faultsand areas of mineralization (Goetz and Rowan, 1983;
Kauffmann 1988; Crosta and Moore 1989; Loughlin 1991;Wester, 1992; Van der Meer et al., 1995).
La Primavera geothermal field (Figure 1) is located inthe western Mexican Volcanic Belt (MVB), 15 km NW ofGuadalajara (103º28’-103º43’ W and 20°32’-20° 43’N). Thefield is located in the intersection of the Colima, Chapalaand Tepic grabens (Luhr et al., 1995). The Tepic fault sys-tem is the most important in the region (Kruger, 1988), andit generates the secondary permeability that characterizes thereservoir.
The geothermal field is located in a rhyolitic volcaniccomplex (Mahood, 1980). The oldest eruptive activity re-
Geofísica Internacional (2001), Vol. 40, Num. 3, pp. 147-162
147

T. Fernández de la Vega-Márquez et al.
148
Fig. 1. General location and geology of the caldera La Primavera (after Mahood, 1980).

Mapping using TM images in La Primavera
149
ported is 120 000 years, followed by a strong explosive eventabout 95 000 years ago that produced the Tala tuff with avolume of approximately 25 km3. This eruption caused thecollapse of the magmatic chamber and the formation of an11-km diameter caldera surrounded by rhyolitic domes. Thiscaldera contained a lake where sedimentation took place.Volcanic activity resumed with the eruption of rhyolitic domesin the southern part of the caldera. The latest activity formedthe central Nejahuete and Colli domes, about 20 000 yearsago (Figure 1). The caldera collapse generated local faultsstriking NW-SE and NE-SW.
After the dome eruption, a hydrothermal system devel-oped with hot springs and fumaroles (Mahood et al., 1983;Gutiérrez-Negrín, 1991). Surface manifestations are locatedalong faults that strike NW-SE, NE-SW and N-S.
SPECTRAL RESPONSE OF HYDROTHERMALALTERATION MINERALS
Thematic Mapper bands are too wide to allow the iden-tification of single minerals; however, they serve to identifygroups of minerals for exploration purposes in the near and
middle infrared, belonging to the hydroxyl and sulfate groups.Iron oxide is frequently observed in the outcrops of hydro-thermally altered rocks as a result of weathering; its identifi-cation is a useful key to define areas that contain weatheredhydrothermally altered rocks.
These minerals have spectral features in the visible andinfrared parts (0.4 - 2.5 µm) (Figure 2). The main problem inthe identification of the minerals is the interference fromvegetation that also has a strong reflectance in the infrared.When iron oxides are present, the rock color is red, brown,orange or yellow. The presence of clay minerals usually yieldpale yellow, violet, green or beige. The jarosite reflectancecurve shows well defined absorption features at 0.43 and 0.92µm; hematite has a reflectance minimum at 0.85µm, and go-ethite at about 0.94 µm (Hunt and Ashley, 1979). Absorptionanomalies at wavelengths less than 0.9 µm are a good indi-cation of hematite. When the anomalies are at wavelengthsabove 0.9 µm, jarosite or goethite are more abundant (Huntand Ashley, 1979).
The middle infrared region of the spectrum, between1.1 and 2.5 µm, can provide more information about the min-
Fig. 2.- Spectra of materials to be identified in the studied image: a) vegetation (large and acicular leaf); b) oxide and c) hydroxyl minerals(after Hunt 1977, 1979; Hunt and Ashley, 1979)
aaaaa

T. Fernández de la Vega-Márquez et al.
150
eralogical composition than the spectral features observedin the visible and near infrared regions. The middle infraredcontains high reflectance anomalies for most rocks (basalt,gabbro, etc.) and minerals (clays, micas, sulfates, carbon-ates) at about 1.65 µm and high absorption at approximately2.2 µm (Goetz and Rowan 1983).
Vegetation shows absorption features from 0.45 to 0.68µm, and high reflectance in the near infrared, between 1.6
bbbbb
Fig. 2. Continued.
µm and 2.2 µm, due to the chlorophyll absorption. The ab-sorption bands at about 1.4 µm and 1.9 µm are related to thewater content.
Iron oxides and vegetation show similar reflectance inTM Band 1 (0.45-0.52 µm) and TM Band 2 (0.52-0.60 µm),therefore these bands are not very useful for separating thesematerials. On the other hand, TM3 band (0.63-0.69 µm)shows high reflectance for the iron oxides and a strong ab-

Mapping using TM images in La Primavera
151
IMAGE PROCESSING
A section from the Thematic Mapper (TM) Landsat 5image (path 29- row 46), taken in April 1992, which con-tains La Primavera geothermal field, was used in this study.The thermal band was not used because of its low resolution(100 m2 pixel).
Preprocessing of the image included radiometric cor-rection to remove the atmospheric effects. The correction
ccccc
Fig. 2. Continued.
sorption for vegetation. This is useful to differentiate oxidesfrom vegetation (Figure 2 a, b, c). Band TM4 (0.76-0.90 µm)is used for vegetation identification; it contains also an ab-sorption band for iron oxides at 0.90 µm. Both features canbe used to separate oxides from vegetation.
TM5 (1.55-1.75 µm) and TM7 (2.08-2.35 µm) bandsare very helpful for distinguishing vegetation from hydroxyland iron oxides.
Alunite
Gypsum
JarositeTalc
Chlorite
Dolomite
Calcite
Pyrophyllite
KaoliniteMuscovite
MontmorilloniteIllite

T. Fernández de la Vega-Márquez et al.
152
was calculated according to Jensen (1996), by subtractingthe minimum values for each band. No other corrections wereapplied as the image did not show stripping or line drop-outs. Band 5 is shown in Figure 3 after stretching with satu-ration of 5% of the histogram was performed.
We enhanced the spectral response of hydrothermalalteration minerals to identify surface hydrothermal activityin the study area. The information contained in the bands ofthe La Primavera image is displayed using color compos-ites, after band ratio and principal component analysis. Theidentification of altered rocks is performed by comparisonof the spectral response of the alteration minerals and theDN of the pixels in the bands of the image. In addition to the
identification of the alteration minerals, the vegetation wasidentified and its response minimized.
False color composites included the bands where thespectral response of the minerals indicates a maximum intheir reflectance. This enhancement is achieved by combin-ing bands in the visible and the infrared (Crosta and Moore1989; Drury,1990).
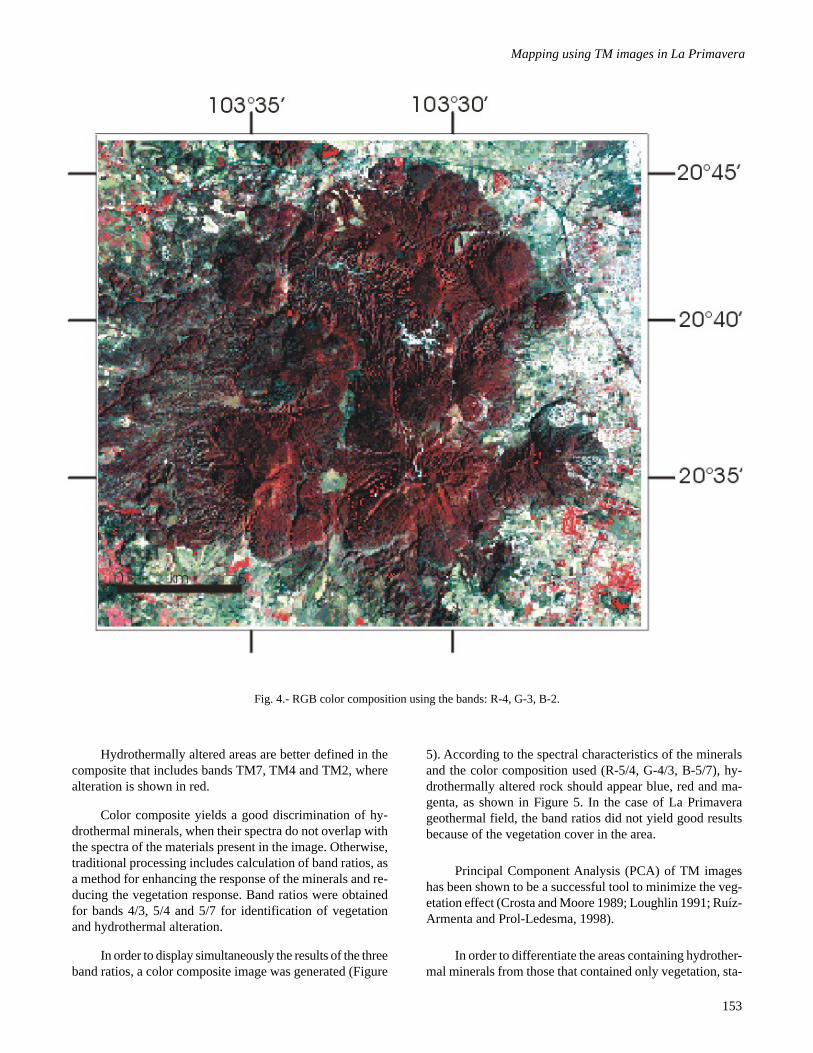
The false color composite (RGB) of bands TM4, TM3and TM2 was obtained with the aim of displaying the oxideminerals in green and vegetation in red (Figure 4). Urbanareas have a similar reflectance in the three bands used inthis composite (Jensen,1996); they are displayed in greytones.
Fig. 3.- Display in 256 tones of grey of La Primavera TM image band 5.
Mapping using TM images in La Primavera
153
Fig. 4.- RGB color composition using the bands: R-4, G-3, B-2.
Hydrothermally altered areas are better defined in thecomposite that includes bands TM7, TM4 and TM2, wherealteration is shown in red.
Color composite yields a good discrimination of hy-drothermal minerals, when their spectra do not overlap withthe spectra of the materials present in the image. Otherwise,traditional processing includes calculation of band ratios, asa method for enhancing the response of the minerals and re-ducing the vegetation response. Band ratios were obtainedfor bands 4/3, 5/4 and 5/7 for identification of vegetationand hydrothermal alteration.
In order to display simultaneously the results of the threeband ratios, a color composite image was generated (Figure
5). According to the spectral characteristics of the mineralsand the color composition used (R-5/4, G-4/3, B-5/7), hy-drothermally altered rock should appear blue, red and ma-genta, as shown in Figure 5. In the case of La Primaverageothermal field, the band ratios did not yield good resultsbecause of the vegetation cover in the area.
Principal Component Analysis (PCA) of TM imageshas been shown to be a successful tool to minimize the veg-etation effect (Crosta and Moore 1989; Loughlin 1991; Ruíz-Armenta and Prol-Ledesma, 1998).
In order to differentiate the areas containing hydrother-mal minerals from those that contained only vegetation, sta-

T. Fernández de la Vega-Márquez et al.
154
tistical techniques based on the analysis of principal compo-nents were applied to the images (Chavez and Yaw Kwarteng1989), taking into account the spectral characteristics of theminerals.
The results of PCA of six bands in the La Primaveraimage are presented in Table 1. The correlation matrix showsthat the three bands in the visible are highly correlated; alsothe middle infrared bands have a high correlation. The firstprincipal component contains 91.98% of the variance.
Component 5 shows oxide areas as dark pixels, andcomponent 4 shows the hydroxyl minerals. The negative ofthese images would display the altered areas as bright pix-
els. Vegetation spectral response is contained in principalcomponent 2 as bright pixels.
False color composition of the images correspondingto the negative of component 5 (R), component 4 (G) andthe sum of both in the blue channel (O, H, O+H) allows theidentification of altered rocks (Figure 6).
SPATIAL ENHANCEMENT
The fractures and faults in the rocks are commonlyshown like borders or segments of lines that form “linea-ments” in aerial photographs and satellite images (Ruiz-Armenta and Prol-Ledesma, 1995. These lineaments can be
Fig. 5.- RGB color composition using the band ratios: R-5/4, G-4/3, B-5/7.

Mapping using TM images in La Primavera
155
Table 1
Results of the Principal Components Analysis of La Primavera image:variance-covariance matrix, correlation matrix and band load matrix.
VAR/COVAR primab1 primab2 primab3 primab4 primab5 primab7
primab1 140.19 91.55 142.72 80.89 255.76 185.68
primab2 91.55 61.81 96.26 57.89 174.04 124.83
primab3 142.72 96.26 153.92 88.75 287.16 205.06
primab4 80.89 57.89 88.75 88.90 169.16 109.20
primab5 255.76 174.04 287.16 169.16 666.39 446.90
primab7 185.68 124.83 205.06 109.20 446.90 317.24
COR MATRX primab1 primab2 primab3 primab4 primab5 primab7
primab1 1.000000 0.983511 0.971591 0.724622 0.836777 0.880499
primab2 0.983511 1.000000 0.986887 0.780947 0.857538 0.891500
primab3 0.971591 0.986887 1.000000 0.758755 0.896625 0.927983
primab4 0.724622 0.780947 0.758755 1.000000 0.695011 0.650259
primab5 0.836777 0.857538 0.896625 0.695011 1.000000 0.971976
primab7 0.880499 0.891500 0.927983 0.650259 0.971976 1.000000
COMPONENT C 1 C 2 C 3 C 4 C 5 C 6
% var. 91.98 4.76 2.56 0.44 0.21 0.04
eigenval. 1313.92 68.01 36.63 6.35 2.97 0.55
eigvec.1 0.297454 0.496127 -0.366203 -0.187773 -0.655065 -0.258661
eigvec.2 0.202082 0.327144 -0.130823 -0.083683 0.078691 0.906548
eigvec.3 0.327749 0.379665 -0.230329 -0.182935 0.745878 -0.324938
eigvec.4 0.192786 0.485595 0.795463 0.294938 -0.045387 -0.072253
eigvec.5 0.701240 -0.474271 0.281654 -0.444123 -0.079363 0.021371
eigvec.6 0.484108 -0.204826 -0.289203 0.800025 -0.002290 -0.001686
LOADING C 1 C 2 C 3 C 4 C 5 C 6
primab1 0.910647 0.345564 -0.187180 -0.039965 -0.095373 -0.016271
primab2 0.931741 0.343171 -0.100707 -0.026824 0.017255 0.085886
primab3 0.957599 0.252376 -0.112357 -0.037158 0.103639 -0.019508
primab4 0.741164 0.424735 0.510583 0.078829 -0.008298 -0.005708
primab5 0.984661 -0.151514 0.066030 -0.043355 -0.005300 0.000617
primab7 0.985226 -0.094838 -0.098266 0.113191 -0.000222 -0.000071

T. Fernández de la Vega-Márquez et al.
156
formed by a variety of elements of the landscape, includingtopography, tectonics, drainage, vegetation and tones of thesoil or rock. Almost all lineaments are discontinuous (Ruiz-Armenta and Prol-Ledesma, 1995).
Spatial enhancement was applied to the La Primaveraimage, with the purpose of bringing out the predominant faultsystems, and to determine their relationship to the hydro-thermal activity of the area.
Spatial enhancement was performed on the first princi-pal component PC1, that contains 91.98% of the variance,and therefore it contains information related with the topog-raphy and the albedo of the six non thermal bands.
Figure 7 shows the results of the edge Laplacian en-hancement filter. The caldera is clearly observed. The faultsrelated to the rhyolitic domes within and in the borders ofthe caldera are enhanced (see Figure 7).
The method developed by Moore and Waltz (l983) wasused with the purpose of extracting the size, location andorientation of lineaments. This method consists of 5 steps:
1) Removing the high frequencies (noise) with a low-passfilter.
2) Generation of directional components with convolutionalgorithms. In this step the contrast of borders and seg-
Fig. 6.- Oxide and hydroxyl minerals identified using the principal components analysis of the 6 non-thermal bands of La Primavera image.False color composition using the band ratios: R-3/1, G-5/7, B-O+H.

Mapping using TM images in La Primavera
157
ments of lines is increased only for those lineaments per-pendicular to the applied kernel (Ruiz-Armenta and Prol-Ledesma, 1995).
3) A low-pass filter is applied again to the image after step 2,in order to reduce the creation of artificial lineaments inthe filter direction.
4) Extraction of segments of lines and prominent borders.The brightness values of the smoothed image from step(3) are enhanced for visualization by applying a contraststretch with 2% saturation.
5) The visualization is improved by adding the obtained im-age to the first principal component.
The kernels used in step (2) are Prewitt filters (Table2). They were applied in all directions. The fracturing withinthe field is controlled mainly by the stages of maximum de-formation related to the caldera formations that may havereactivated older structures in the reservoir strata related tothe three structural systems in the surroundings of the LaPrimavera geothermal field: E-W (Chapala graben), N-S(Colima graben) and NW-SE (Tepic graben) (Garduño andLópez, 1986).
The best results were obtained with filters NE-SW andNW-SE, wich are perpendicular and paralell, respectively,to one of the main fault systems. The results are shown inFigures 8 and 9 respectively.
Fig. 7.- Laplacian Edge Enhancement filter applied to the first principal component of the La Primavera image. Lines indicate faultschecked in the field.

T. Fernández de la Vega-Márquez et al.
158
Fig. 8.- NE quadrant of La Primavera image resulting of application of NE-SW directional filter. Lines indicate faults and dots- surfacemanifestations.
Table 2
Prewitt filters.

Mapping using TM images in La Primavera
159
In Figure 8, the NE quadrant of the image is shownafter a NE-SW filter was applied. The lineament correspondsto La Gotera fault. The Caldera ring fractures, the Río Calientefaults, and a portion of the Mesa El Nejahuete fault werealso identified. Some lineaments are also observed amongthe domes Pinar de la Venta, Arroyo La Cuadrilla and MesaLa Lobera (Figure 9) which had not been reported.
The radial pattern of the drainage is clearly shown, aswell as the dendritic drainage in the lower left.
DISCUSSION AND CONCLUSIONS
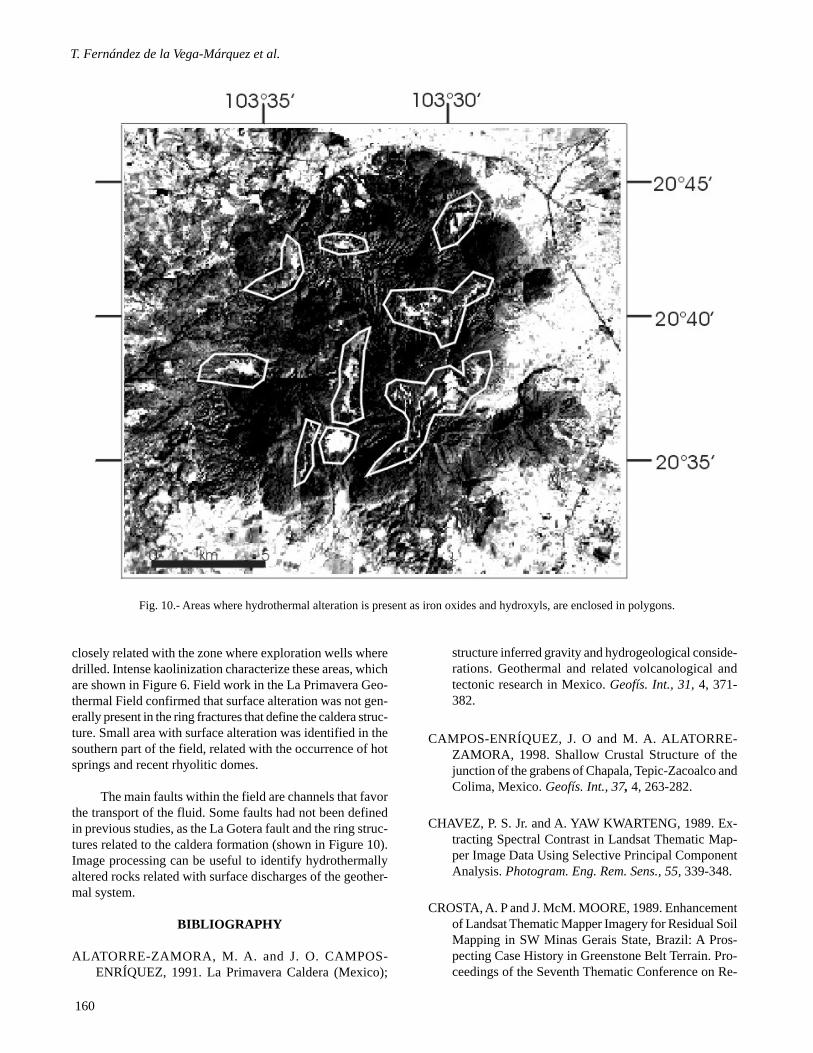
Band ratios, false color compositions, and principalcomponents analysis were used to spectrally enhance theresponse of different minerals. They allowed the identifica-tion of areas where hydrothermal alteration is present as iron
oxides and hydroxyls, as is the case of La Primavera geo-thermal field (Figure 10).
The identification of alteration minerals was best ac-complished with the Crosta technique, as shown in Figures5 and 6 . The presence of vegetation was interfering with thespectral response of alteration minerals, specially in the in-frared bands (5 and 7); therefore the band ratios did not yieldgood results. False color compositions were also affected bythe strong reflection of vegetation in the infrared bands (Fig-ures 4 and 5 ). The minimization of the vegetation interfer-ence was obtained with the results of the principal compo-nents analysis, which identified the altered rocks. The re-sults were checked by field observations.
The areas where hydrothermally altered rocks can beidentified are constrained to the central part of the caldera,
Fig. 9.- Directional filter NW-SE applied to the first principal component of La Primavera image. Lines and dots as in Fig. 8.
T. Fernández de la Vega-Márquez et al.
160
closely related with the zone where exploration wells wheredrilled. Intense kaolinization characterize these areas, whichare shown in Figure 6. Field work in the La Primavera Geo-thermal Field confirmed that surface alteration was not gen-erally present in the ring fractures that define the caldera struc-ture. Small area with surface alteration was identified in thesouthern part of the field, related with the occurrence of hotsprings and recent rhyolitic domes.
The main faults within the field are channels that favorthe transport of the fluid. Some faults had not been definedin previous studies, as the La Gotera fault and the ring struc-tures related to the caldera formation (shown in Figure 10).Image processing can be useful to identify hydrothermallyaltered rocks related with surface discharges of the geother-mal system.
BIBLIOGRAPHY
ALATORRE-ZAMORA, M. A. and J. O. CAMPOS-ENRÍQUEZ, 1991. La Primavera Caldera (Mexico);
structure inferred gravity and hydrogeological conside-rations. Geothermal and related volcanological andtectonic research in Mexico. Geofís. Int., 31, 4, 371-382.
CAMPOS-ENRÍQUEZ, J. O and M. A. ALATORRE-ZAMORA, 1998. Shallow Crustal Structure of thejunction of the grabens of Chapala, Tepic-Zacoalco andColima, Mexico. Geofís. Int., 37, 4, 263-282.
CHAVEZ, P. S. Jr. and A. YAW KWARTENG, 1989. Ex-tracting Spectral Contrast in Landsat Thematic Map-per Image Data Using Selective Principal ComponentAnalysis. Photogram. Eng. Rem. Sens., 55, 339-348.
CROSTA, A. P and J. McM. MOORE, 1989. Enhancementof Landsat Thematic Mapper Imagery for Residual SoilMapping in SW Minas Gerais State, Brazil: A Pros-pecting Case History in Greenstone Belt Terrain. Pro-ceedings of the Seventh Thematic Conference on Re-
Fig. 10.- Areas where hydrothermal alteration is present as iron oxides and hydroxyls, are enclosed in polygons.
Mapping using TM images in La Primavera
161
mote Sensing for Exploration Geology, Calgary,Alberta, Canada, Oct. 2-6, pp. ERIM, 1173-1187.
DEROIN, J. P., G. R. COCHRANE, M. A. MONGILLOand P. R. L. BROWNE, 1995. Methods of remote sens-ing in geothermal regions: the geodynamic setting ofthe Taupo Volcanic Zone (North Island, New Zealand).Int. J. Rem. Sens., 16, 1663-1677.
DRURY, S. A. 1990. A guide to Remote Sensing: Interpret-ing images of the Earth. Oxford Science Publications.199 pp.
GARDUÑO, H. and A. LÓPEZ, 1986. Fracturamiento decampos geotérmicos. Geotermia, 2, 277-296.
GOETZ, A. F., F. H. ROCK and B. N. ROWAN, 1983. Re-mote Sensing for Exploration: An Overview. EconomicGeology, 78, 573-590.
GUTIÉRREZ-NEGRÍN, L. C. A., 1991. RecursosGeotérmicos en La Primavera, Jalisco. Ciencia y De-sarrollo, 16, 96, 57-69.
HUNT, G. R., 1977. Spectra Signatures of Particulate Min-erals in the Visible and Near Infrared. Geophysics, 42,501-513.
HUNT, G. R., 1979. Near-Infrared (1.3-2.4 m) Spectra ofAlteration Minerals Potential for Use in Remote Sens-ing. Geophysics, 44, 1974-1986.
HUNT, G. R. and R. P. ASHLEY, 1979. Spectra of AlteredRocks in the Visible and Near Infrared. Economic Ge-ology, 74, 1613-1629.
JENSEN, J. R., 1996. Introductory digital image processing:A remote sensing perspective. 2nd ed. Prentice Hall se-ries in Geographic information science. 318 pp.
KAUFFMANN, H. 1988. Mineral Exploration along theAqaba-Levant Structure by use of TM-data: Concepts,processing and results. Int. J. Rem. Sens., 9, 1639-1658.
LILLESAND, Th. M. and R. W. KIEFER, 1987. Remote
Sensing and Image Interpretation, 2nd ed.Wiley, 721 pp.
LOUGHLIN, W. P., 1991. Principal Component Analysisfor Alteration Mapping. Photogram. Eng. Rem. Sens.,57, 1163-1169.
LUHR, J. F., S. NELSON, J. ALLAN and J.CARMICHAEL, 1985. Active rifting in South-westernMexico: Manifestations of an incipient fastward spread-ing- ridge jump. Geology, 13, 54-57.
MAHOOD, G. A., 1980a. Geological Evolution of a Pleis-tocene Rhyolitic Center: Sierra La Primavera, Jalisco,México. J. Volcanol. Geotherm. Res., 8, 199-230.
MAHOOD, G. A., 1980b. Chemical Evolution of a Pleis-tocene Rhyolitic Center: Sierra La Primavera, Jalisco,México. Contrib. Mineral. Petrol., 77, 129-149.
MAHOOD, G. A., A. H. TRUESDELL and L. A. TEMPLOS,1983. A reconaissance geochemical study of LaPrimavera geothermal area, Jalisco, México. J. Volc.Geoth. Res., 16 , 247-261.
MONGILLO, M. A., G. R. COCHANE, P. R. L. BROWNEand J. P. DEROIN, 1995. Application of satellite imag-ery to explore and monitor geothermal systems. Pro-ceed. World Geoth. Congress., V. II, 951-956.
MOORE, G. K. and F. A. WALTZ, 1983. Objective proce-dure for lineaments enhancement and extraction. Pho-togram. Eng. Rem. Sens., 79. 5, 641- 647.
O’LEARY, D. W., 1979. Lineament, linear, lineation; someproposed new standards for old terms. Geol. Soc. Am.Bull., 87, 10, 1463-1469.
PROL-LEDESMA, R. M., 2000. Evaluation of thereconnaissance results in geothermal exploration usingGIS. Geothermics, 29, 83-103.
RUIZ-ARMENTA, J. R. and R. M. PROL-LEDESMA,1995. Técnicas de procesamiento de imágenes en la ex-ploración de yacimientos minerales de origenhidrotermal. Física de la Tierra, 7, 105-137.
RUIZ-ARMENTA, J. R. and R. M. PROL-LEDESMA,1998. Techniques for enhancing the spectral responseof hydrothermal alteration minerals in Thematic Map-per Images of Central Mexico. Int. J. Rem. Sens. 19,10, 1981-2000.
VAN DER MEER, F., P. M. VAN DIJK and A. B.WESTERHOF, 1995. Digital Classification of the con-tact metamorphic aureole along the Los Pedrochesbatholith, south-central Spain, using Landsat ThematicMapper data. Int. J. Rem. Sens., 16, 1043-1062.

T. Fernández de la Vega-Márquez et al.
162
VENEGAS-SALGADO, S., G. RAMIREZ-SILVA, C. RO-MERO-GONZALEZ, 1988. Campo Geotérmico de LaPrimavera, Jalisco. Geología Económica de México.Fondo de Cultura Económica, 127-141.
VILLA, S. J., M. CHACON and G. MEDINA, 1987. Utili-zación de la relación atómica (Na/K) para identificar zo-nas de mayor actividad hidrotermal en el campogeotérmico de La Primavera, Jalisco. Geotermia. Re-vista Mexicana de Geoenergía, 3, 3, 241-254.
WESTER, K., 1992. Spectral signature measurements andimage processing for geological remote sensing: PhDThesis, Department of Physical Geography, StockholmUniversity, Stockholm, 130 p.
_______________
Fernández de la Vega-Márquez, T.1, R. M. Prol-Ledesma2 and G. Orozco3
1 Facultad de Filosofía, UNAM, 04510 México, D.F. Mexico2 Instituto de Geofísica, UNAM, 04510 México, D.F. Mexico3 Schlumberger, Melbourne, Australia