hydrology regional annual water yield from forest lands and its
TRANSCRIPT

Available online at www.sciencedirect.com
SCIENCE D I R E C T ' @ Journal of
Journal of Hydrology 308 (2005) 258-268 Hydrology
www.elsevier.comflocate/jhydrol
Regional annual water yield from forest lands and its response to potential deforestation across the southeastern United States
G. suna7*, S.G. McNultya, J. L U ~ , D.M. Arnatyac, Y. ~ i a n ~ ~ , R.K. Kolkae
asouthem Global Change Program, USDA Forest Service, North Carolina State University, Raleigh, 920 Main Campus Dr., Venture II, Suite 300, Raleigh, NC 27606, USA
b~eparhnent of Forestry, North Carolina State University, North Carolina, NC 27606, USA 'Center for Forested Wetland Research, USDA Forest Service, Charleston, SC, USA
d ~ ~ I ~ ~ , Inc., Sacramento, CA, USA eEcology and Management of Riparian and Aquatic Ecosystems, USDA Forest Service, Grand Rapids, MN, USA
Received 24 October 2003; revised 10 November 2004; accepted 12 November 2004
Abstract
Regional water yield at a meso-scale can be estimated as the difference between precipitation input and evapotranspiration output. Forest water yield from the southeastern US varies greatly both in space and time. Because of the hot climate and high evapotranspiration, less than half of the annual precipitation that falls on forest lands is available for stream flow in this water- rich region. Water yield is highest in the mountainous regions that receive the highest precipitation and have the lowest air temperature, and the lowest in the coastal regions that are dominated by wetlands receiving moderate rainfall but high evapotranspiration. Water resource management for both floods and droughts demands an accurate estimation of water yield from forests. Projected climate and land use changes further increase the variability of water yield in the region. The objectives of this study were to (1) develop a simple annual water yield modeling procedure by testing and calibrating a generalized global evapotranspiration model, (2) to apply the validated model to estimate regional forest water yield and to predict potential water yield response to forest removal. Hydrologic databases at a watershed-scale and a regional-scale were developed for model development, calibration, and validation. We applied the water yield model to the southern region by integrating land cover and high resolution climate databases by using a Geographic Information System (GIs). The model developed in this paper can be used to examine the spatial and temporal variability for water yield and predict the effects of climate and land cover changes at the regional scale. O 2004 Elsevier B.V. All rights reserved.
Keywords: Evapotranspiration; Forest hydrology; Hydrologic modeling; Water yield; Deforestation; Climate change
1. Introduction
* Corresponding author. Tel.: + 1 919 515 9498; fax: + 1 919 513 It has long been recognized that forests, currently 2978. covering over 50% of the southeastern US, play
E-nzail address: [email protected] (G. Sun). a great role in regulating the water resources in
0022-1694/$ - see front matter O 2004 Elsevier B.V. All rights reserved. doi:10.1016/j.jhydro1.2004.11.021
G. Sun er al. /Journal of Hydrology 308 (2005) 258-268 259
the region (Douglass, 1983). The integrated southern forest resource assessment that involves both the government and the public concluded that the forest cover is a vital factor in maintaining and improving water quality and aquatic ecosystems in the southern US (Wear and Greis, 2002). Because of the rapid socioeconomic development in the region, increased water use demands, and climate variability, this water-rich region is experiencing water stress. For example, during an exceptional drought in 2002 in the region, most of the wetlands were dried out and a majority of water supply systems in the region were depleted. Although forest lands provide the best water among land uses, there are many concerns in the southern US about hydrologic responses and cumu- lative impacts on water quality from intensive forest management practices that include timber harvesting, bedding, drainage, fertilization, and prescribed burn- ing. Annually, approximately 3600 miles of rivers and streams were considered potentially impaired by pollution from silvicultural activities throughout the region (Fulton and West, 2002). Past studies suggest that the most obvious and immediate response of a watershed to a forest management activity is change in water yield due to the change in total ecosystem evapotranspiration (ET) (Riekerk, 1989). Associated with this increase in runoff is elevated nutrient and sediment loading to streams (Swank et al., 2001).
Recent studies suggest the magnitude of hydro- logic response and the time required to recover to pre- disturbance levels differs greatly for various systems (i.e. forested wetlands vs. upland mountains) (Sun et al., 2001). Both climate (precipitation and ET) and topographic features control the hydrologic processes and responses to hydrologic disturbances. As in any other region, precipitation and temperature in the southern US are affected by latitude and altitude (Calvo-Alvarado and Gregory, 1997). Redistribution of energy across latitude and elevation gradients results in a diverse forest community and hydrologic processes. For example, shallow groundwater tables dictate the slow moving streamflow processes on the flat coastal plains with over 70% of precipitation returning to the atmosphere as evapotranspiration (Lu et al., 2003). Absolute values of hydrologic responses in both peakflow and flow volumes in coastal forested wetlands were found to be relatively low and short- lived. In contrast, upland watersheds in the piedmont
and mountain regions have lower ET (30-70% of precipitation) but higher streamflow peaks and volumes (Lu et al., 2003; Sun et al., 2002). The magnitude of hydrologic response is relatively higher and recovery time is longer for hilly upland systems. Therefore, it is important to recognize the hydrologic differences in the region to develop sound manage- ment plans.
There have been several attempts to model the hydrologic response to forest management at a large scale in the southern USA, and to examine all the factors and their interactions that affect watershed responses. Douglass (1983) derived a general empiri- cal equation to estimate water yield increase for the Appalachian hardwoods. The empirical model suggests that the first year hydrologic response in the Appalachian is mainly affected by the forest basal area removed and solar radiation received at a site. Unfortunately, the model does not include precipi- tation as an independent variable, thus it has limited use for other similar mountain regions. The empirical WRENSS water yield methodology derived from dynamic hydrologic models and experimental data is the first effort to model hydrologic response to forest management at a regional scale (US Forest Service, 1980; Huff et al., 1999). However, this approach has not been computerized and applied in the southeast, a rainfall-dominated region with complex climate and topographic conditions. Lu et al. (2003) developed a regression model that correlates watershed evapo- transpiration to watershed characteristics and environ- mental factors. Their study suggests patterns of water loss from forests to the atmosphere are mostly controlled by air temperature and precipitation distribution with landcover playing a second role. McNulty et al. (1996); Liang et al. (2002) examined potential climate change impacts on regional forest water yield using two monthly time step, stand level forest ecosystem models (PnET-IIS and PnET-3SL), respectively. The PnET family models linked forest growth and productivity and water use (ET), and proved applicable to a variety of mature forests, but they could not simulate non-forest lands. Hence, both PnET-IIS and PnET-II3SL have limitations for examining the effects of forest conversions and climate change impacts on landscapes with mixed land use. Existing regional scale hydrologic models for global change studies are developed on watershed

260 G. Sun et al. /Journal of Hydrology 308 (2005) 258-268
hydrologic principles such as HLJMUS (Brown et al., 1999) or simplified water balances (Vorosmarty et al., 1998; Hay and McCabe, 2002). HUMUS, modified from the Soil Water Assessment Tool (SWAT) model, was applied to the continental US (Brown et al., 1999). However, the simulation results for averaged annual water yield in large basins were not satisfac- tory, especially for the southeastern US (Brown et al., 1999). Previous modeling efforts in the southern US suggests that no single conceptual or physically based computer model describes the hydrological processes of the southern forest ecosystems.
Another issue that concerns the water resource in the region is projected climate change. The US national assessment on climate change suggests that climate change and variability will have dramatic effects on both water and forests in the southern US (US Global Change Program, 2000). As indicated by historical records and projected by several Global Circulation Models (GCMs), the southern US is becoming wetter (more streamflow) due to increased precipitation and water quality is degrading due to intensive agricultural practices, urban development, coastal processes, and mining activities. Water resource managers demand practical tools to estimate water yield potentials from forest lands and evaluate how management and climate change may affect the hydrologic regimes.
This paper reports the development of a general- ized water yield model to examine the annual water yield response to forest harvesting, land use change, and climatic change across a climatic and topographic gradient in the southeastern US. Our ultimate goals were to assess the potential regional impacts of silvicultural practices, projected climate change, and their combined effects on water quantity and quality at a regional level.
2, Methods
2.1. Model development
Regional annual water yield (Y) at a meso-scale can be estimated as the difference between precipi- tation (P) input and actual evapotranspiration
(AET) output
Historical regional annual precipitation is gener- ally derived from point data recorded at local weather stations using various interpolation methods. Future regional precipitation distributions are products down-scaled from projected results of global circula- tion models (GCMs) with a coarse resolution. With reasonable accuracy, annual actual evapotranspiration can be estimated as a fraction of potential evapo- transpiration (PET) or standard pan evaporation with consideration of land surface characteristics rep- resented by vegetation characteristics (e.g. canopy conductance). One of these types of methods was developed by Zhang et al. (2001). Using hydrologic data from over 250 watersheds worldwide across a wide range of climatic zones and biomes, Zhang et al. (2001) correlated mean annual actual evapotranspira- tion (AET), annual precipitation (P), and Priestley and Taylor equation for potential evapotranspiration (PET). The AEiT can be described and estimated by the following formula
1 + w y AETIP =
l + w ? + & -
where, w is the plant-available water coefficient and represents the relative differences of water use for transpiration. The w parameter was reported as 0.5 for shortgrass and crops and 2.0 for forests. For a watershed with mixed land uses
where, J;: is the percentage of land use i including conifers, deciduous, mixed forest, grasslands/corps, and water bodies.
In lieu of net solar radiation data, this study calculated PET for each watershed using Hamon's temperature based method as described in Federer and Lash (1978), a simple but comparable in prediction accuracy to other more sophisticated approaches (Vorosmarty et al., 1998; Lu, 2003). Forest conver- sion study in the southern Appalachian mountains found that upland conifer forests use as much as 20% more water than deciduous forests (Swank and Douglass, 1974). However, an evapotranspiration comparison study suggests water loss from pond

G. Sun er al. / Joun~a l of Hydrology 308 (2005) 258-268 261
cypress (deciduous) wetlands does not differ from that of slash pine plantations at an ecosystem level (Liu, 1996). Therefore, instead of lumping forests as one single land cover, we classified forests into conifers, deciduous, and mixed forest in this study to reflect the differences of water use among forest types in the upland regions. We used Baily's (1995) ecoregion classification system to divide the entire region into upland and lowland regions to reflect the effects of topography (upland vs. lowland) on AET. Therefore, by fitting the AET data as calculated by Eq. (1) from measured streamflow and precipitation to the pre- dicted values by Eqs. (2) and (3), a different set of w parameter and procedures from those reported by Zhang et al. (2001) were developed in this study.
2.2. Databases for model validation at a watershed scale and a regional scale
The water yield model (Eq. (1)) was first calibrated with streamflow data at the watershed level to derive the plant w parameter in Eq. (2). Then, the calibrated model was applied to the region and validated with a gridded continental scale streamflow database pro- vided by the US Geological Survey (USGS) that represents regional averaged annual streamflow during 1951-1980 (Gerbert et al., 1987).
Watershed land cover and long-term hydro- meteorological data for 38 forested watersheds across the southern US, with sizes ranging from 25.0 to 821,285 ha, were assembled into a Geographic Information Systems (GIs) database (Fig. 1; Table 1). Daily streamflow data for the 31 larger watersheds were downloaded from the USGS web page, while data for the seven smaller fully forested watersheds were obtained from collaborators. Repre- senting major forest ecosystems in the south, the seven small fully forested watersheds (< 17 krn2 in size) were long-term forest experimental sites located in Branford Forest, Florida; Santee Experimental Forest, South Carolina; Cateret 7, North Carolina; Park Tract, North Carolina; Coweeta Hydrologic Laboratory, North Carolina (Sun et al., 2002); Walker Branch, Tennessee; and Robinson Forest, Kentucky (Table 1). Precipitation and air temperature data for the USGS gauged basins were obtained from the weather stations closest to the watersheds. Land cover types for each of the 32 USGS large basins were derived from the National Land Cover Data set (NLCD) remote sensing data and were further aggregated into six land types (Fig. 1). Two watersheds were found to be outliers. One located in Mississippi has a large portion classified as a water body. Another one in western North Carolina was
Fig. 1. Selected watersheds and landuseflandcover across the southern US.

262 G. Sun et al. /Journal of Hydrology 308 (2005) 258-268
Table 1 Physical and hydrometeorolgical characteristics of watersheds for model development
ID Watershed Area (km2) Mean Forest cover % Mean Mean Mean Mean elevation Deciduous Conifer Mixed tzmperature precip. water yield water (m) ( c ) (mmlyear) (mrnlyear) yieldP
ratio
AL03 140303 AL03 150203 FL03 120003 LA08070202 MS03170002 MS03180002 MS08060203 TX12030201 TX12040103 ARllOlOOOl KY05 100203 KY05070203 TN06010204 TN06040004 VA02080201 VA05050002 Bradford Forest, Florida Santee-80, NC Carteret, NC Coweeta#14, N. Carolina Walker Branch, Tennessee NC02092500 NC02053200 NC02082950 NC02085070 NC02085500 NC02133500 NC02118500 NC02113000 NC03 16 1000 NC03443000 NC03500000 Coles Fork, Kentucky GA03 130005 GA03070103 GA03070101 SC03050110 Parker, N. Carolina
suspected to have problems in precipitation values watershed balance equation (Eq. (I)), assuming that were too low when compared to observations at change in storage is negligible over a long term nearby stations, presumably due to topographic period. The watershed AET data were used for model effects. Watershed a T was estimated from the calibration through best-fitting between modeled

G. Sun et al. / Joumul of Hydrology 308 (2005) 258-268 263
(Eq. (3)) and calculated AET (Eq. (1)). As indicated by the averaged water yield to precipitation ratio that ranges from 0.18 in Florida to 0.63 in western North Carolina, the selected watersheds cover a large spectrum of hydrologic conditions (Table 1). Lu et al. (2003) developed a regression model for predicting watershed evapotranspiration as a function of annual rainfall, watershed latitude, altitude, and forest cover percentage by employing a similar database to Table 1.
A historic (1961-1990) VEMAP climate database (0.5 degree or 46 km resolution) (Kittel et al., 1997) was used to validate the water yield model (Eq. (1)) at a regional scale in the southern region, encompassing thirteen states. The AET values for each of the VEMAP cell were computed from the calibrated model described in Eq. (3). Land cover composition within each of the 0.5 degree cells was derived from the 30 m land cover data. The gridded USGS stream- flow data (Gerbert et al., 1987) were then scaled up to the 0.5 degree resolution and compared to predicted values by the revised model on a cell by cell basis across the entire region.
2.3. Model application at the regional scale
The calibrated hydrologic model was applied to the southern region to examine the spatial variability of annual water yield from forest areas at a regional scale. Averaged long-term high resolution (4 km) climate datasets for the continental US (Daly et al.,
2000) were acquired to estimate water yield from forest lands using the plant parameters derived from this study. The land cover data for the region were used as a base map to display the predicted hydrologic variables at a finer spatial scale (30 m) for three forest types (conifers, deciduous, and mixed forest).
3. Results and discussion
3.1. Model calibration at the watershed scale
The AET model (Eq. (2)) that uses default w parameters of 0.5 and 2.0 for grasslands and forest lands and the Hamon's PET method greatly over- estimated AET for upland watersheds that were dominated by deciduous trees (Fig. 2). The discre- pancy between modeled and estimated AET by the water balance equation (Precipitation-Measured streamflow) was most pronounced for the upland hardwoods watersheds located in the northwestern North Carolina, western Virginia, Kentucky, and Tennessee (Watershed IDS: 12- 16, 20-21). Several reasons may explain the discrepancies: (1) The AET model by Zhang et al. (2001) does not differentiate forest types (conifers vs. deciduous) and does not handle the effects of landscape topographic features (i.e. slopes) on water yield and AET, (2) the PET values calculated by the Hamon's temperature-based method may differ from those estimated by the Priestley and Taylor model employed in Zhang et al.
I ZOO
Watershed ID
-
Fig. 2. Comparisons of measured AET with default and revised model predictions.
CI Observed A Revised model s Zhang et a1 (2001) model

264 G. Sun er al. /Journal of Hydrology 308 (2005) 258-268
(2001), andfor the PET model used in this study may over-estimate PET for the mountain watersheds, and (3) errors may exist in the precipitation and air temperature data set itself. Data errors for the highly heterogeneous large mountain watersheds may result in errors in estimated AET values by the water balance calculations.
We increased the w parameter for conifers and deciduous forests from 2.0 to 2.8 to achieve the best fit
regression R~ being equal to 0.83 and a slope of 1.05 (Fig. 3). We forced the regression intercept to be zero, so one can compare the regression slope to 1.0 directly. The calibration results on annual water yield prediction are comparable to those simulated by other sophisticated physically based dynamic models such as PnET-II3SL that was applied to the same region (Liang et al., 2002).
to all the data points. Based on reports that evergreen 3.2. Model validation at the regional scale forests use 20% more water than hardwoods at an ecosystem level due to canopy interception differ- ences (Swank and Douglass, 1974), we reduced predicted AET (w = 2.8) for mountain and piedmont hardwood forests by 20%. We also increased w parameter from 0.5 to 2.0 to achieve a better fit to the water-balance-estimated AET data for grasslands in the large basins with mixed land uses. For urban lands, w was set as 0.0. For wetlands or water bodies that presumably have no soil moisture limitations in ET losses, we assume that AET equals the smallest of the two variables, precipitation and PET. This assumption ensures that AET is always less than PET or Precipitation, and is realistic for both the dry and wet regions in the study areas. Measured streamflow data compared well to predicted (Precipitation- Predicted AET) values for the 38 watersheds (Fig. 3). Linear regression analysis found that when the intercept was set as zero, measured and predicted streamflow data were highly correlated, with
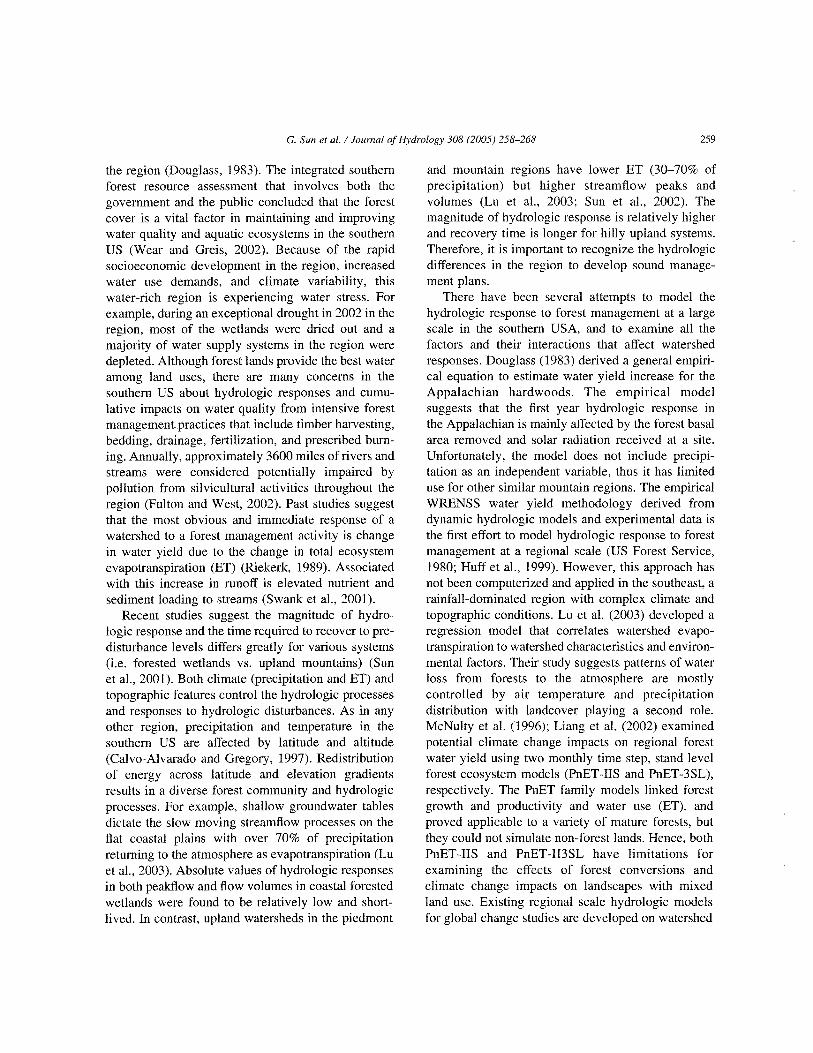
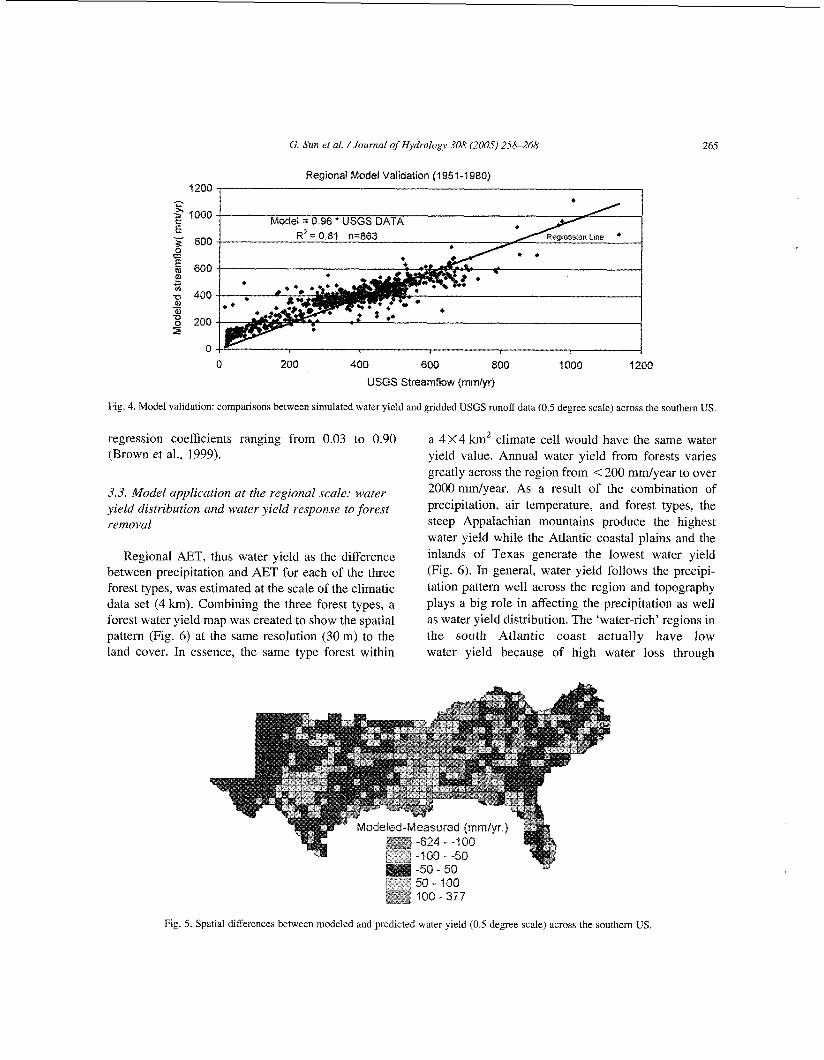
Using the same calibrated parameters and pro- cedures developed at the watershed-scale, modeled water yield values for each of the 0.5OX0.5" cells were compared against the gridded USGS measured data set (Fig. 4). A fairly high regression coefficient (R') of 0.81 and a slope of 0.96 were achieved when the intercept was set to zero. The model over- estimated somewhat for the dry shrub lands region in western Texas (runoff less than 300 mmjyear), suggesting some uncertainty of the AET model for this land cover type. Nevertheless, overall, the model performed well across the region, especially for the forested areas (Fig. 5). Our regional validation results for annual water yield are considered superior to similar simulations using more sophisticated dynamic watershed hydrological models such as HUMUS (Brown et al.. 1999). Simulated water yield by HUMUS compared poorly with USGS data at the regional scale for the southeastern region with
Streamflow Simulated vs Measured 140
l V V 1 Simulated Streamflow = 1.05 * Measured Streamflow */ I
Measured streamflow (mmlyr)
Fig. 3. Model calibration: correlations between predicted water yield and measured streamflow for thirty eight forest-dominated watersheds.
G. Sun et al. /Journal of Hydrology 308 (2005) 258-268
Regional Model Validation (2 95 1-1 980) 1200 , I
0 200 400 600 800 I000 1200
USGS Streamflow fmmfyr)
Fig. 4. Model validation: comparisons between simulated water yield and gridded USGS runoff data (0.5 degree scale) across the southern US.
regression coefficients ranging from 0.03 to 0.90 (Brown et al., 1999).
3.3. Model application at the regional scale: water yield distribution and water yield response to forest removal
Regional AEiT, thus water yield as the difference between precipitation and AET for each of the three forest types, was estimated at the scale of the climatic data set (4 km). Combining the three forest types, a forest water yield map was created to show the spatial pattern (Fig. 6 ) at the same resolution (30 m) to the land cover. In essence, the same type forest within
a 4 x 4 km2 climate cell would have the same water yield value. Annual water yield from forests varies greatly across the region from < 200 mmlyear to over 2000 mmlyear. As a result of the combination of precipitation, air temperature, and forest types, the steep Appalachian mountains produce the highest water yield while the Atlantic coastal plains and the inlands of Texas generate the lowest water yield (Fig. 6). In general, water yield folIows the precipi- tation pattern well across the region and topography plays a big role in affecting the precipitation as well as water yield distribution. The 'water-rich' regions in the south Atlantic coast actually have low water yield because of high water loss through
P
3- zoo gfgg I00 - 377
Fig. 5. Spatial mfferences between modeled and predicted water yield (0.5 degree scale) across the southern US

G. Sun et nl. /Journal of Hydrology 308 (2005) 258-268
Annual Water Yield across the Southern Forests
Fig. 6. Predicted long-term annual water yield for southern forests at a 4 km spatial resolution. Values are displayed at a 30 m landusellandcover resolution.
evapotranspiration. In fact, surface waters are limited and water supply in the region depends mainly on deep groundwater systems.
In this study, clearcutting effects on water yield were approximated by a reduction of the w parameter from 2.8 to 0.0. Because deciduous forests are assumed to use 20% less water, tree removal had less impact on water yield when compared to
evergreen forests at the same climatic and topographic regions. As indicated in Eq. (I), total precipitation, PET and forest type distribution patterns are the three factors that influence regional hydrologic responses. Annual water yield increase was predicted to range widely from 440 mmlyear to less than 50 mdyear in the dry region (Fig. 7). A worldwide review on hydrologic response to deforestation suggests
Fig. 7. Predicted water yield response to deforestation at a 4 km spatial resolution across the southeastern US. Values are expressed at a 30 m landusellandcover resolution.

G. Sun et al. /Journal of Hydrology 308 12005) 258-268 267
a similar magnitude (Bosch and Hewlett, 1982). We References found that the regions with the highest hydrologic response in the piedmont regions between the Bailey, R.G., 1995. Description of the ecoregions of the United
mountains and the coast did not overlap the areas States, seconded. US Department of Agriculture, Forest Service (Miscellaneous Publication 1391. (Map scale 1 :7,5000,000);
with the highest runoff (Fig. 6). P. 108). Bosch, J.M., Hewlett, J.D., 1982. A review of catchment
experiments to determine the effect of vegetation changes on water yield and evapotranspiration. Journal of Hydrology 55,
4. Conclusions 3-23. Brown, R.A., Rosenberg, N.J., Izarraulde, R.C., 1999. Responses
of US regional water resources to C02-fertilization and We developed a modeling procedure to estimate Hadley center climate model projections of greenhouse-
regional water yield from forest lands. The new water forced climate change: a continental scale simulation using
yield model was based on a revision of an existing the HUMUS model. Pacific Northwest National Laboratory pp. 1-29.
AET by two forest types and a Calvo-Alvarado, J.C., Gregory, J.D., 1997. Predicting mean annual simpler PET model. The water yield model was first ~ n o f f and suspended sediment yield in rural watersheds in calibrated at a watershed scale and then validated at a North Carolina. Water Resources Research Institute, Report No.
regional scale, using long-term measured climatic and hydrologic data across the southeastern US. The resulting validated model adequately described the regional distribution patterns of long-term annual evapotranspiration and water yield from forest lands in the region. One advantage of the simple annual time step model developed in this study is that it requires fewer parameters and input variables. This model has the potential to be applied to examine the sensitivity of water yield response to land use and climate change on a long-term basis. Model appli- cations in the region suggest that forest removal will increase water yield with a large spatial variation across the southern region. We predict that land use changes from forest to urban (i.e. clearcutting deforestation) will pose the highest impact in areas with high precipitation and pine forest covers. The model can also be used to study the effects of global climate change on water yield since the model is sensitive to air temperature and precipitation changes.
Acknowledgements
307, University of North Carolina, p. 120. Daly, C., Taylor, G.H., Gibson, W.P., Parzybok, T.W.,
Johnson, G.L., Pasteris, P.A., 2000. High-quality spatial climate data sets for the United States and beyond. American Society of Agricultural Engineers 43 (6), 1957-1962.
Douglass, J.E., 1983. The potential for water yield augmentation from forest management in the eastern United States. Water Resources Bulletin 19, 351-358.
Federer, C.A., Lash, D., 1978. BROOK: A hydrologic simulation model for eastern forested. Water Resources Research Center, University of New Hampshire, Durham, NH. Research Report 19, p. 84.
Fulton, S., West, B., 2002. Forestry impacts on water quality. In: Wear, D., Greis, J., (Eds.). Southern forest resource assessment. Gen. Tech. Rep. SRS-53, Asheville, NC: U.S. Department of Agriculture, Forest Service, Southern Research Station, pp. 501-518.
Gerbert, W.W., Graczkyk, D.J., Krug, W.R., 1987. Average annual runoff in the United States, 1951-1980. Hydrol Invest Atlas HA- 710. USGS, Reston, VA.
Hay, L.E., McCabe, G.J., 2002. Spatial variability in water-balance model performance in the conterminous United States. Journal of the American Water Resources Association 38, 847-859.
Huff, D.D., Hargrove, W.W., Graham, R.L., 1999. Adaptation of WRENSS-FORTRAN-77 for a GIs application for water yield changes, ORNLlTM-13747. ESD Publication Number 4860. Oak Ridge National Laboratory, Oak Ridge, TN, p. 39.
Kittel, T.G.F., Royle, J.A., Daly, C., Rosenbloom, N.A., Gibson, W.P., Fisher, N.H., Schimel, D.S., Berliner, L.M., VEMAP2 Participants, 1997. A gridded historical (1895-1993) bioclimate dataset for the conterminous United States, pp. 219-222, in:
The Walker Branch data were acquired from the Proceedings of the Tenth Conference on Applied Climatology, Oak Ridge National Laboratory with support from the 20-24 October 1997, Reno, NV. American Meteorological
US Department of Energy's Office of Biological and Society, Boston. Liang, Y., Durrans, S.R., Lightsey, T., 2002. A revised version of
Environmental Research. We acknowledge the finan- PnET-I1 to simulate the hydrologic cycle in southeastern cia1 support from the Southern Global Change forested areas. Journal of the American Water Resources
Program, USDA Forest Service, USA. Association 38 (I), 79-89.

268 G. Sun er al. /Journal of Hydrology 308 (2005) 258-268
Liu, S., 1996. Evapotranspiration from cypress (Taxodium ascen- dens) wetlands and slash pine (Pinus elliotti) uplands in north- central Eloirda. PhD dissertation. University of Florida, Gainesville, FL.
Lu, J., Sun, G., Amatya, D.M., McNulty, S.G., 2003. Modeling actual evapotranspiration from forested watersheds across the Southeastern United States. Journal of American Water Resources Association 39, 887-896.
McNulty, S.G., Vose, J.M., Swank, W.T., 1996. Loblolly pine hydrology and productivity across the Southern United States. Forest Ecology and Management 86, 241-251.
Riekerk, H., 1989. Influence of silvicultural practices on the hydrology of pine flatwoods in Florida. Water Resources Research 25, 713-719.
Sun, G., McNulty, S.G., Shepard, J.P., Amatya, D.M., Riekerk, H., Comerford, N.B., Skaggs, R.W., Swift Jr., L.W., 2001. Effects of timber management on wetland hydrology in the eastern United States. Forest Ecology and Management 143, 227-236.
Sun, G., McNulty, S.G., Amatya, D.M., Skaggs, R.W., Swift, L.W., Shepard, J.P., Riekerk, H., 2002. A comparison of the hydrology of the coastal forested wetlandslpine flatwoods and the mountainous uplands in the southern US. Journal of Hydrology 263,92-104.
Swank, W.T., Douglass, J.E., 1974. Streamflow greatly reduced by converting hardwoods to pine. Science 185, 857-859.
Swank, W.T., Vose, J.M., Ellion, K.J., 2001. Long-term hydrologic and water quality responses following clearcutting of mixed hardwoods on a southern Applachian catchment. Forest Ecology and Management 143, 163-178.
US Global Change Program, 2000. Climate Change Impacts on the United States: The Potential Consequences of Climate Varia- bility and Change. Overview, A Report to the National Assessment SynthesisTeam. Cambridge University Pressp. 154.
US Forest Service, 1980. An approach to water resources evaluation of non-point silvicultural sources (A procedural handbook). US Environmental Protection Agency, Environmental Research Laboratory, Office of Research Development, Athens, GA.
Vorosmarty, C.J., Federer, C.A., Schloss, A.L., 1998. Potential evaporation functions compared on US watersheds: possible implications for global-scale water balance and terrestrial ecosystem. Journal of Hydrology 207, 147-169.
Wear, D.N., Greis, J.G., 2002. Southern Forest Resources Assess- ment. Department of Agriculture, Gorest Service, Southern Research Station, Gen. Tech. Rep. SRS-53. Asheville NC p. 635.
Zhang, L., Dawes, W.R., Walker, G.R., 2001. Response of mean annual evapotranspiration to vegetation changes at catchment scale. Water Resources Research 37, 701-708.
