hydrology-driven chemical loads transported by the green
TRANSCRIPT
U.S. Department of the InteriorU.S. Geological Survey
Scientific Investigations Report 2018–5133
Prepared in cooperation with the Washington State Department of Ecology
Hydrology-Driven Chemical Loads Transported by the Green River to the Lower Duwamish Waterway near Seattle, Washington, 2013–17

Cover: Photograph showing oil sheen on Duwamish River near Seattle, Washington. Photograph by Kathleen Conn, U.S. Geological Survey, August 2, 2016.

Hydrology-Driven Chemical Loads Transported by the Green River to the Lower Duwamish Waterway near Seattle, Washington, 2013–17
By Kathleen E. Conn, Robert W. Black, Craig A. Senter, Norman T. Peterson, and Ann Vanderpool-Kimura
Prepared in cooperation with the Washington State Department of Ecology
Scientific Investigations Report 2018-5133
U.S. Department of the InteriorU.S. Geological Survey

U.S. Department of the InteriorRYAN K. ZINKE, Secretary
U.S. Geological SurveyJames F. Reilly II, Director
U.S. Geological Survey, Reston, Virginia: 2018
For more information on the USGS—the Federal source for science about the Earth, its natural and living resources, natural hazards, and the environment—visit https://www.usgs.gov or call 1–888–ASK–USGS.
For an overview of USGS information products, including maps, imagery, and publications, visit https://store.usgs.gov.
Any use of trade, firm, or product names is for descriptive purposes only and does not imply endorsement by the U.S. Government.
Although this information product, for the most part, is in the public domain, it also may contain copyrighted materials as noted in the text. Permission to reproduce copyrighted items must be secured from the copyright owner.
Suggested citation: Conn, K.E., Black, R.W., Senter, C.A., Peterson, N.T., and Vanderpool-Kimura, A., 2018, Hydrology-driven chemical loads transported by the Green River to the Lower Duwamish Waterway near Seattle, Washington, 2013–17: U.S. Geological Survey Scientific Investigations Report 2018-5133, 37 p., https://doi.org/10.3133/sir20185133.
ISSN 2328-0328 (online)

iii
ContentsAbstract ...........................................................................................................................................................1Introduction.....................................................................................................................................................3Methods...........................................................................................................................................................6
Continuous Real-Time Monitoring......................................................................................................6Tidal Studies...........................................................................................................................................7Field Sampling and Processing ..........................................................................................................7Analytical Methods...............................................................................................................................7Data Analysis .......................................................................................................................................10
Hydrology and River Condition ..................................................................................................................12Streamflow and Suspended Sediment ............................................................................................12River Condition during Chemistry Sampling ...................................................................................15
Chemical Concentrations ...........................................................................................................................15Summary Statistics of Water Samples ............................................................................................15Summary Statistics of Suspended-Sediment Samples ................................................................15
Chemical Load Estimates............................................................................................................................23Approach 1—Summary Statistics ...................................................................................................23Approach 2—River Condition Bins ..................................................................................................25Approach 3—Linear Regressions ....................................................................................................26Approach 4—Non-Linear Regressions ...........................................................................................26
Site-Specific Polychlorinated Biphenyl Partition Coefficient ..............................................................27Estuary Characteristics...............................................................................................................................29Sediment and Chemical Loading Dynamics in the Green/Duwamish Watershed ............................33Summary........................................................................................................................................................34Acknowledgments ......................................................................................................................................35References Cited..........................................................................................................................................36

iv
Figures
1. Map showing locations of U.S. Geological Survey (USGS) measurement sites relative to the Lower Duwamish Waterway, Seattle, Washington.......................................4
2. Map showing Green/Duwamish watershed and subwatershed land cover, west-central Washington ............................................................................................................5
3. Photographs showing field sampling activities including collection of a depth- and width-integrated sample for water chemistry (A), continuous-flow centrifugation through a collection bowl (inset) for suspended sediment chemistry (B), and pumping of centrifuge outflow through a filter for colloidal chemical analysis (inset) and XAD resin (back left) for dissolved chemical analysis (C) at U.S. Geological Survey streamgage 12113390, Duwamish River at Golf Course at Tukwila, Washington ....................................................................................................................8
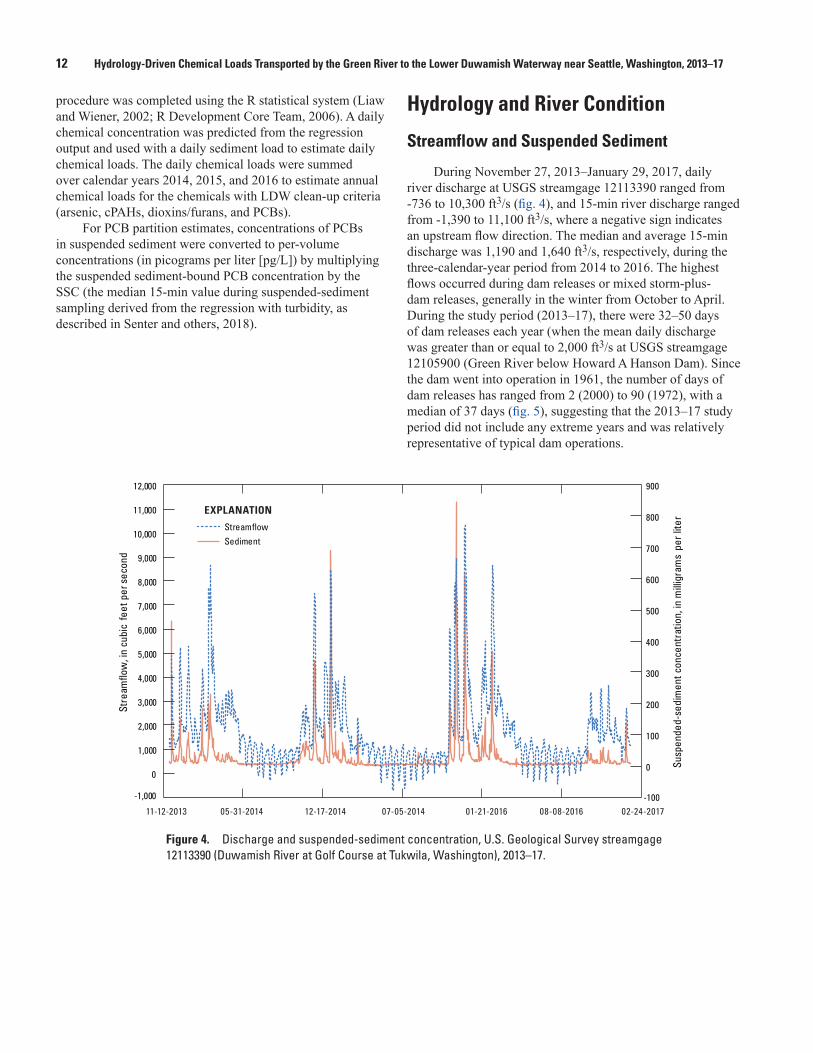
4. Hydrograph showing discharge and suspended-sediment concentration, U.S. Geological Survey streamgage 12113390 (Duwamish River at Golf Course at Tukwila, Washington), 2013–17 .................................................................................................12
5. Graph showing number of days of dam releases each year (diamonds) since the Howard A Hanson Dam went into operation on the Green River, Washington, in 1961 ...................................................................................................................13
6. Example hydrographs showing river discharge measured at U.S. Geological Survey (USGS) streamgages 12113390, 12113000, and 12105900 on the Duwamish and Green Rivers (A); and turbidity measured at USGS streamgage 12113390 on the Duwamish River (B) during and after a large release from the Howard A Hanson Dam, Washington, January 2–16, 2015....................................................................................14
7. Graphs showing comparison of the sum of particulate-bound and dissolved concentrations to concentrations measured in unfiltered water samples for arsenic (A), lead (B), copper (C), and organic carbon (D), Duwamish River, Washington, 2013–17..................................................................................................................23
8. Pie diagrams showing percentage of the 2014–16 calendar years in which each Duwamish River condition contributed to time, sediment load, and select chemical loads for arsenic, carcinogenic polycyclic aromatic hydrocarbons (cPAHs), dioxins/furans, and polychlorinated biphenyls (PCBs) using the river condition bins approach ......................................................................................................................................25
9. Graph showing polychlorinated biphenyl concentration on suspended sediment and colloidal material, and in the dissolved phase as compared to the corresponding unfiltered water sample during various river conditions, Duwamish River, Washington, 2016–17 .......................................................................................................28
10. Graphs showing vertical profiles of salinity (A) and water temperature (B), and sampling time period (gray shaded area) (C) during flood tide at four measurement sites in the Duwamish estuary, Washington, August 2, 2016 ..............................................30
11. Graphs showing vertical profiles of salinity (A) and water temperature (B), and sampling time period (gray shaded area) (C) during ebb tide at three measurement sites in the Duwamish estuary, Washington, January 17, 2017 ..........................................31
12. Graphs showing vertical profiles of salinity (A) and water temperature (B), and sampling time period (gray shaded area) (C), at three equal-width increment stations (left, center, right) at U.S. Geological Survey (USGS) measurement site 12113425 (Duwamish River at 102nd Street Bridge at Duwamish, Washington, at river kilometer 8.9), June 22, 2017 ............................................................................................32

v
Tables
1. Analytical parameter groups, methods, and analyzing laboratories for samples collected during Phases 1, 2, and 3 at U.S. Geological Survey streamgage 12113390 (Duwamish River at Golf Course at Tukwila, Washington), 2013–17 ...................9
2. Summary statistics of concentrations of total organic carbon and chemicals detected in at least one-half of unfiltered-water samples, Duwamish River, Washington, 2013–17..................................................................................................................16
3. Summary statistics of concentrations of dissolved organic carbon and metals detected in at least one-half of filtered-water samples, Duwamish River, Washington, 2013–17..................................................................................................................17
4. Summary statistics of concentrations of chemicals detected in at least one-half of suspended-sediment samples, Duwamish River, Washington, 2013–17 ......................18
5. Summary statistics of organic carbon-normalized concentrations of chemicals detected in at least one-half of suspended-sediment samples, Duwamish River, Washington, 2013–17..................................................................................................................19
6. Comparison of Bed Composition Model input values with measured suspended sediment-bound chemical concentrations from three studies, Duwamish River, Washington ..................................................................................................................................21
7. Median concentration of select chemicals on suspended sediment during various river conditions, Duwamish River, Washington, 2013–17 ......................................22
8. Estimates of annual suspended sediment-bound loads of arsenic, carcinogenic polycyclic aromatic hydrocarbons, dioxins/furans, and polychlorinated biphenyls using various approaches, Duwamish River, Washington, 2014–16 ..................................24
9. Statistical metrics of daily suspended sediment-bound load estimates of arsenic, carcinogenic polycyclic aromatic hydrocarbons, dioxins/furans, and polychlorinated biphenyls using various approaches, Duwamish River, Washington, 2014–16..................................................................................................................24
10. Two most significant (highest coefficient of determination [R2]) linear regressions between select suspended sediment-bound chemical concentrations (y) and explanatory hydrologic or climatic variables (x) ..........................26
11. Regression output from the most significant (highest pseudo coefficient of determination [R2]) Random Forest regressions between select suspended sediment-bound chemical concentrations (y) and explanatory hydrologic or climatic variables (x) ..................................................................................................................27
vi
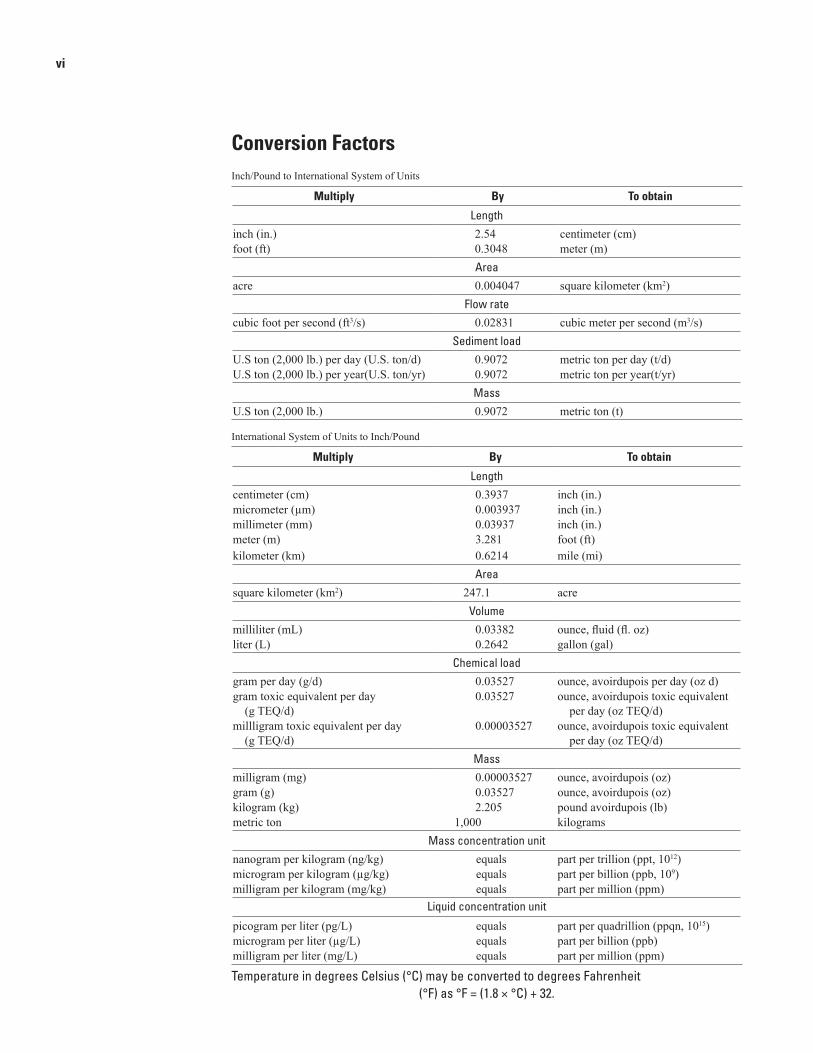
Conversion FactorsInch/Pound to International System of Units
Multiply By To obtain
Lengthinch (in.) 2.54 centimeter (cm)foot (ft) 0.3048 meter (m)
Areaacre 0.004047 square kilometer (km2)
Flow ratecubic foot per second (ft3/s) 0.02831 cubic meter per second (m3/s)
Sediment loadU.S ton (2,000 lb.) per day (U.S. ton/d) 0.9072 metric ton per day (t/d)U.S ton (2,000 lb.) per year(U.S. ton/yr) 0.9072 metric ton per year(t/yr)
MassU.S ton (2,000 lb.) 0.9072 metric ton (t)
International System of Units to Inch/Pound
Multiply By To obtain
Lengthcentimeter (cm) 0.3937 inch (in.)micrometer (µm) 0.003937 inch (in.)millimeter (mm) 0.03937 inch (in.)meter (m) 3.281 foot (ft) kilometer (km) 0.6214 mile (mi)
Areasquare kilometer (km2) 247.1 acre
Volumemilliliter (mL) 0.03382 ounce, fluid (fl. oz)liter (L) 0.2642 gallon (gal)
Chemical loadgram per day (g/d) 0.03527 ounce, avoirdupois per day (oz d)gram toxic equivalent per day
(g TEQ/d)0.03527 ounce, avoirdupois toxic equivalent
per day (oz TEQ/d)millligram toxic equivalent per day
(g TEQ/d)0.00003527 ounce, avoirdupois toxic equivalent
per day (oz TEQ/d)Mass
milligram (mg) 0.00003527 ounce, avoirdupois (oz)gram (g) 0.03527 ounce, avoirdupois (oz)kilogram (kg) 2.205 pound avoirdupois (lb)metric ton 1,000 kilograms
Mass concentration unitnanogram per kilogram (ng/kg) equals part per trillion (ppt, 1012)microgram per kilogram (µg/kg) equals part per billion (ppb, 109)milligram per kilogram (mg/kg) equals part per million (ppm)
Liquid concentration unit
picogram per liter (pg/L) equals part per quadrillion (ppqn, 1015)microgram per liter (µg/L) equals part per billion (ppb)milligram per liter (mg/L) equals part per million (ppm)
Temperature in degrees Celsius (°C) may be converted to degrees Fahrenheit (°F) as °F = (1.8 × °C) + 32.

vii
Abbreviations
BCM Bed Composition ModelcPAHs carcinogenic polycyclic aromatic hydrocarbonsDOC dissolved organic carbonEcology Washington State Department of EcologyEPA U.S. Environmental Protection Agency HPAHs high molecular-weight polycyclic aromatic hydrocarbonsLDW Lower Duwamish WaterwayLPAHs low molecular-weight polycyclic aromatic hydrocarbonsNOAA National Oceanic and Atmospheric AdministrationOC organic carbonPAHs polycyclic aromatic hydrocarbonsPCBs polychlorinated biphenylsPSD particle-size distributionRF random forestsRKM river kilometerR2 coefficient of determinationSSC suspended-sediment concentration SSL suspended-sediment load SSLFINES fine suspended-sediment load (diameter <0.0625 mm)STM Sediment Transport ModelTEQ toxic equivalentTOC total organic carbonUSGS U.S. Geological Survey
DatumsGage height is referenced to the North American Vertical Datum of 1988 (NAVD 88).
Horizontal coordinate information is referenced to the North American Datum of 1983 (NAD 83).
Supplemental InformationSpecific conductance is given in microsiemens per centimeter at 25 degrees Celsius (µS/cm at 25 °C).
Turbidity is given in Formazin Nephelometric Units (FNU).
Concentrations of chemical constituents in water are given in milligrams per liter (mg/L), micrograms per liter (µg/L), or picograms per liter (pg/L).


AbstractThe sediments in the Lower Duwamish Waterway
Superfund site in Seattle, Washington, are contaminated with chemicals including metals such as arsenic, polychlorinated biphenyls (PCBs), carcinogenic polycyclic aromatic hydrocarbons (cPAHs), and dioxins/furans from decades of intense anthropogenic activities. In support of sediment remediation within the site (the final 8-kilometer reach of the Green/Duwamish River), the Washington State Department of Ecology is identifying and controlling ongoing sources of sediment and chemicals. The Green/Duwamish watershed upstream of the site was previously identified as the largest source of new sediment, transported by the river, to the Lower Duwamish Waterway. However, there was large uncertainty in the timing and magnitude of sediment and sediment-bound chemicals to the site. The U.S. Geological Survey collected new data from 2013 to 2017, including three complete calendar years (2014–16) to estimate sediment and chemical loads transported by the Green/Duwamish River to the Lower Duwamish Waterway Superfund site. Chemical loads were calculated as the product of river suspended-sediment loads and suspended sediment-bound chemical concentrations measured at river kilometer 16.7. The site was selected because it was close to the upstream boundary of the Superfund site and incorporated most watershed inputs. The site was tidally influenced—the river reversed flow direction during high tides from June through October. However, it was upstream of the maximum extent of the tidal saltwater reach, which was measured as far upstream as river kilometer 12.7 during summer high tide/low flow conditions. Therefore, the load estimates primarily represent watershed-derived sources of sediment-bound chemicals and are minimally affected by Superfund-derived sediment and chemicals that may be resuspended and transported upstream during high tides.
We identified four general river conditions during the current study: (1) low-flow baseline conditions (71 percent of the time), (2) storm events (17 percent of the time), (3) periods of high streamflow and sediment concentrations owing to large releases from the Howard A Hanson Dam in the upper watershed (7 percent of the time), and (4) periods when both storm events and large dam releases were occurring (4 percent of the time). Suspended-sediment concentration was measured using U.S. Geological Survey methods and suspended sediment-bound chemical concentrations were measured using a novel continuous-flow centrifugation field technique during 42 events spanning the range of streamflow and sediment conditions.
Sediment loads were estimated from a regression between discrete measurements of suspended-sediment concentration and continuous measurements of turbidity and streamflow. Turbidity was a better sediment surrogate than streamflow, which was used in previous sediment load estimates for the Green/Duwamish River, because of the multiple sediment sources and transport mechanisms in the watershed. The average suspended-sediment load estimate for 2014–16 was 117,000 U.S. tons per year (U.S. tons/yr). Most of the suspended-sediment load (73.5 percent) was fine sediment with a particle-size diameter of less than 0.0625 millimeter. Large dam releases, either with or without a coincident storm event, occurred infrequently—on a cumulative 32–50 days per year during the study period, or an average of 11 percent of the time—but accounted for a disproportionately large amount of the annual sediment load (79 percent). Sediment loads during these large dam releases averaged 2,220 U.S. tons per day (U.S. tons/d), with a maximum of 18,000 U.S. tons/d. In contrast, sediment loads averaged 212 U.S. tons/d during storm events without a coincident dam release, and 43 U.S. tons/d during baseline conditions.
Hydrology-Driven Chemical Loads Transported by the Green River to the Lower Duwamish Waterway near Seattle, Washington, 2013–17
By Kathleen E. Conn, Robert W. Black, Craig A. Senter, Norman T. Peterson, and Ann Vanderpool-Kimura

2 Hydrology-Driven Chemical Loads Transported by the Green River to the Lower Duwamish Waterway near Seattle, Washington, 2013–17
A suite of chemicals with site-specific cleanup goals (including arsenic, cPAHs, dioxins/furans, and PCBs) were detected on river suspended sediment at river kilometer 16.7 during all river conditions. Suspended sediment-bound chemical concentrations generally were low, but high concentrations did occur, especially during short intense summer storms, “first flush” autumn runoff events, and prolonged precipitation events (greater than 2 inches of rainfall within 48 hours). Concentrations ranged from 6.6 to 28 milligrams per kilogram (mg/kg; mean = 16 mg/kg) for arsenic, from 3.7 to 454 micrograms toxic equivalent per kilogram (µg TEQ/kg; mean = 100 µg TEQ/kg) for cPAHs, from 0.526 to 20.6 nanograms (ng) TEQ/kg (mean = 6.04 ng TEQ/kg) for dioxins/furans, and from 0.448 to 83.9 micrograms (µg)/kg (mean = 14.5 µg/kg) for PCBs. Toxic equivalents often are required by regulatory agencies and express mass concentration as a weighted measure of the total toxicity of a group of chemicals, based on the toxicity of each individual chemical relative to the most toxic chemical of the group.
Median suspended sediment-bound concentrations were 2.5–3 times higher during storm events than baseline conditions, and 10–27 times higher during storm events than during dam releases for anthropogenic chemicals including cPAHs, dioxins/furans, and PCBs. One plausible explanation is that large dam releases mobilize relatively clean sediment impounded behind the dam from the upper forested watershed and scour and resuspend riverbed sediment, whereas storm events move sediment and associated contaminants from the more urban and industrial lower watershed into the river through the stormwater conveyance system. In contrast, median suspended sediment-bound arsenic concentrations were 2–3 times higher during baseline conditions as compared to storm events, dam releases, and storm-plus-dam releases, which may be owing to a lack of dilution of naturally occurring arsenic concentrations during low-flow baseline conditions.
Measured chemical concentrations in the 42 discrete samples were used to estimate a continuous record of suspended sediment-bound chemical concentrations using four different approaches, referred to as (1) summary statistics, (2) river condition bins, (3) linear regressions, and (4) non-linear regressions. Using the 2014–16 dataset, annual suspended sediment-bound chemical load estimates transported by the river to the Lower Duwamish Waterway were in the range of 1,120–1,470 kg arsenic, 2,810–8,200 grams (g) TEQ cPAHs, 205–407 mg TEQ dioxins/furans, and 340–1,180 g PCBs. As expected, storm events contributed a disproportionately large amount of the load of anthropogenic organic compounds such as cPAHs (54 percent), dioxins/furans (44 percent), and PCBs (52 percent) as compared to overall time (17 percent). Chemical loads of cPAHs during storm events, with or without a coincident dam release, averaged 27.6 g TEQ/d, with a maximum of 280 g TEQ/d. In contrast, cPAH loads averaged three times lower (9.24 g TEQ/d) during dry-weather
dam releases, and 17 times lower (1.60 g TEQ/d) during baseline conditions. Chemical loads of dioxins/furans during storm events averaged 2.21 mg TEQ/d, with a maximum of 25.9 mg TEQ/d. Dioxin/furan loads averaged two times lower (1.19 mg TEQ/d) during dry-weather dam releases and 20 times lower (0.112 mg TEQ/d) during baseline conditions. Chemical loads of PCBs during storm events averaged 3.79 g/d, with a maximum of 37.7 g/d. PCB loads averaged four times lower (0.952 g/d) during dry-weather dam releases, and 14 times lower (0.272 g/d) during baseline conditions. Arsenic loads were distributed more evenly between the four conditions. This is partially because arsenic concentrations were highest during baseline conditions (compared to storms for the organic chemicals) and also likely owing to source differences—arsenic occurs naturally in watershed soils and river sediments, whereas cPAHs, dioxins/ furans, and PCBs have anthropogenic land and atmospheric sources.
Chemical concentrations and load estimates often were underestimated using results from unfiltered water analysis only, especially in samples with high suspended-sediment concentrations and for hydrophobic organic chemicals such as cPAHs that prefer to sorb to particulates and are at low concentrations near or below the analytical limits of water methods. For metals and PCBs, the dissolved concentration was relatively low and consistent between sampling events, whereas the suspended sediment-bound chemical concentrations contributed most of the chemical concentration in the water column during periods of high river suspended-sediment concentrations. However, the dissolved fraction, on average, contributed more than one-third of the estimated total chemical load in the river system for arsenic and PCBs, even given the hydrophobic nature of the chemicals. These results suggest that the sum of the chemical concentrations measured on two separate fractions— the particulate fraction and the dissolved fraction—more fully represents the total chemical concentration as compared to analysis of an unfiltered water sample, especially in samples with high suspended-sediment concentrations.
Most of the suspended sediment load (97 percent) and sediment-bound chemical load (92–94 percent) occurred during the wet winter half of the year from October 15 to April 14. However, the highest sediment-bound chemical concentrations often occurred during short intense storms or “first flush” autumn runoff events during the dry summer half of the year from April 15 to October 14. Because of the highly variable and dynamic river system characteristics (including precipitation, discharge, sediment concentration, and tidal fluctuations), it is critical to characterize the occurrence, frequency, concentrations, and loads during extreme conditions (for example, when the river is affected by storm-derived runoff) rather than time-averaged conditions. These short extreme events have a high potential for acute effects on ecological and human health, and may have a great influence on the effectiveness of the sediment remediation activities that are underway in the Lower Duwamish Waterway.

Introduction 3
IntroductionThe Lower Duwamish Waterway (LDW) is the final
8-km-long reach of the Green/Duwamish River. The LDW enters the Puget Sound Elliott Bay in Seattle, Washington (fig. 1), and is the site of intense current and historical anthropogenic influence that has resulted in contaminated sediments. In 2001–02, the U.S. Environmental Protection Agency (EPA) and the Washington State Department of Ecology (Ecology) required remedial investigations and feasibility studies on the 1.8-km2 LDW pursuant to the Federal Superfund law and the Washington Model Toxics Control Act because of concerns about human health risks from exposure to contaminated sediments. The main contaminants of concern for human health include polychlorinated biphenyls (PCBs), dioxins/furans, carcinogenic polycyclic aromatic hydrocarbons (cPAHs), and arsenic. Additionally, about 41 compounds (including individual metals, PCBs, polycyclic aromatic hydrocarbons [PAHs], phthalates, and other semivolatile organic compounds) have been identified as contaminants of concern for protection of the benthic community (Washington State Department of Ecology, 2013). The EPA final cleanup plan was released in November 2014 and included using combinations of dredging, capping, natural sedimentation, and enhanced natural recovery (U.S. Environmental Protection Agency, 2014).
To support the implementation of a cleanup plan of contaminated sediments in the LDW, Ecology is leading source control activities and a watershed-scale pollutant loading assessment to identify sources of sediment recontamination adjacent to and upstream of the LDW. The Green/Duwamish River originates in the Central Cascade Mountains north of Mount Rainier at an elevation of about 1,290 m above North American Datum of 1983 and flows 150 river kilometers (RKM) northwest to Elliott Bay, Puget Sound, Washington, in downtown Seattle. The river drains an approximately 1,200-km2 watershed (fig. 2), divided into four subwatersheds of varying land cover (Homer and others, 2015). The Upper Green subwatershed in the Cascade Mountains is 95-percent forested. The Howard A Hanson Dam was built in 1961 at RKM 103 to regulate flows between minimum summer flows of 300 ft3/s and maximum winter flows of 12,000 ft3/s primarily for flood control. Below the dam, the Middle Green subwatershed includes increasing amounts of developed (33 percent) and agricultural (9.9 percent) land uses. The Lower Green subwatershed is highly developed (83 percent) with some agriculture (4.3 percent). The Duwamish estuary is heavily urbanized (91 percent developed) and is an important commercial and industrial corridor. A large and complex series of storm drain networks throughout the watershed below the Howard A Hanson Dam transport overland runoff of water, particulates, and chemicals to the river.
Average annual precipitation is about 85 in. in the upper watershed, and falls primarily as snow in winter, with spring snowmelt generally from April to June. Average annual precipitation is about 40 in. in the lower watershed, and falls primarily as rain from October to March, with some large late-spring storms. Precipitation totals and types transition between these two conditions in the middle watershed. Summer months from July through September are very dry, with generally trace amounts of precipitation.
The river changes name from the Green River to the Duwamish River at RKM 18. The Duwamish River is a highly stratified estuary with a distinct saltwater wedge that intrudes beneath a surface freshwater lens. The saltwater wedge can extend nearly 14 km inland from the river mouth during high tide/low flow conditions (Stoner, 1967; Santos and Stoner, 1972), which complicates modeling of hydrodynamics, sediment, and chemical transport and settling behavior within the LDW.
The Sediment Transport Model (STM) developed by a consulting group for the LDW during the Remedial Investigation/Feasibility Study phase (Lower Duwamish Waterway Group, 2008) predicted that greater than 99 percent of the sediment that enters the LDW each year originates from upstream sources that are transported by the Green River. The STM estimated suspended- and bed-sediment loading to the LDW from upstream sources. That physical model was then coupled with contaminant concentration data to create a Bed Composition Model (BCM) for the final feasibility study (AECOM, 2012). This model has several limitations. First, the sediment loading estimates were based on a flow-rating curve for the Green River using historical discharge data and sediment samples from 1960 to 1980 (Santos and Stoner, 1972) and from 1996 to 1998 (Embrey and Frans, 2003). Methods for representative sampling of discharge and sediment have improved since then. Second, the discharge data were from a U.S. Geological Survey (USGS) streamgage in Auburn, Washington (USGS streamgage 12113000, Green River near Auburn, Washington), more than 40 RKM upstream of the LDW. Inputs from tributaries and storm drains downstream of the streamgage and the tidal influence in the river were not represented. Third, the upstream contaminant data that were used in the BCM primarily originated from surface bed-sediment data, and it was acknowledged that those values were estimates of actual contaminant concentrations because the suspended-sediment fraction was not fully represented. Additionally, suspended sediment-associated chemical concentrations and loadings likely are temporally variable—affected by sediment source, antecedent precipitation, streamflow, seasonality, sediment organic carbon content, and particle-size distribution—and are not well-represented with average values.

4 Hydrology-Driven Chemical Loads Transported by the Green River to the Lower Duwamish Waterway near Seattle, Washington, 2013–17
Figure 1. Locations of U.S. Geological Survey (USGS) measurement sites relative to the Lower Duwamish Waterway, Seattle, Washington. Modified from Hydrology and Hydraulics Committee (1969) and Conn and Black (2014).
tac18-1245_fig01
122°15'122°18'122°21'
121134258.9
1211341510.9
1211340612.7
1211340015.0
1211339016.7
18.0
2013 NAIP (National Agricultural Imagery Program) 1 meter imagery,USDA's Farm Service Agency, Washington State Plane South,North American Datum of 1983
Tukwila
Elliott Bay
Lake Washington
47°33'
47°30'
Green River
Duw
amish
River
0 2 MILES1
0 2 KILOMETERS1
EXPLANATION
Lower Duwamish Waterway
USGS streamgage or site—Number is streamgage or site No. (top) and river kilometers (bottom)
Continuous discharge record
Continuous record stage measurement
Water-quality monitoring site with chemical and temperature measurements
River kilometer
1211341510.9
1211339016.7
18.0
1211340612.7
ElliottBay
PugetSound
LowerDuwamishWaterway
Seattle
WASHINGTON
Study area

Introduction 5
tac18-1245_fig02
" "
"
"
"
""
""
"
"
0 10 205 MILES
0 10 205 KILOMETERS
121°30'122°00'122°30'
47°40'
47°20'
Base map modified from U.S. Geological Survey and other digital data, various dates.Lambert Conformal Conic, North American Datum of 1983
Newaukum Creek
Newaukum CreekPuyallup River
Puyallup River
White River
White River
Muck CreekMuck Creek
Green River
Green River
White River
White River
Green RiverGreen River
White River
White River
Cedar R
iver
Cedar R
iver
KentKent
TacomaTacoma
AuburnAuburn
RentonRenton
SeattleSeattle
LakewoodLakewood PuyallupPuyallup EnumclawEnumclaw
BellevueBellevue
CovingtonCovington
Federal WayFederal Way
KING
PIERCE
KITTITAS
KITSAP
YAKIMA
Upper GreenUpper Green
Middle GreenMiddle Green
LowerGreenLowerGreen
NearshoreNearshore
DuwamishEstuary
DuwamishEstuary
LakeWashingtonLakeWashington
Lake SammamishLake Sammamish
Lake TappsLake Tapps
Keechelus LakeKeechelus Lake
Chester Morse Lake
Chester Morse Lake
Lake YoungsLake Youngs
Howard A Hanson Reservoir
Howard A Hanson Reservoir
Lake SawyerLake Sawyer
Lake MeridianLake Meridian
Angle LakeAngle Lake
Lake DesireLake Desire
WASHINGTON
Study area
EXPLANATIONLand-cover classification within the Duwamish watershed
Open WaterDevelopedForest, shrub, grassland, barren, and wetlandsAgriculture
Green/Duwamish watershedGreen/Duwamish subwatersheds
Figure 2. Green/Duwamish watershed and subwatershed land cover, west-central Washington.
6 Hydrology-Driven Chemical Loads Transported by the Green River to the Lower Duwamish Waterway near Seattle, Washington, 2013–17
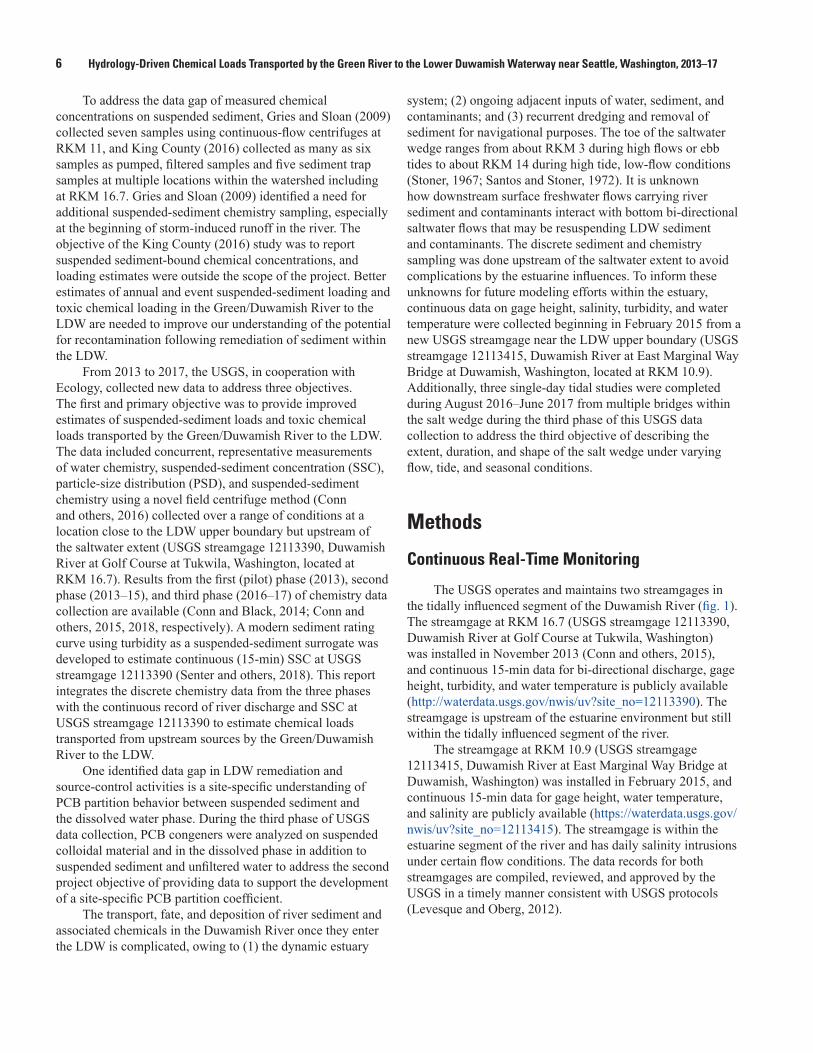
To address the data gap of measured chemical concentrations on suspended sediment, Gries and Sloan (2009) collected seven samples using continuous-flow centrifuges at RKM 11, and King County (2016) collected as many as six samples as pumped, filtered samples and five sediment trap samples at multiple locations within the watershed including at RKM 16.7. Gries and Sloan (2009) identified a need for additional suspended-sediment chemistry sampling, especially at the beginning of storm-induced runoff in the river. The objective of the King County (2016) study was to report suspended sediment-bound chemical concentrations, and loading estimates were outside the scope of the project. Better estimates of annual and event suspended-sediment loading and toxic chemical loading in the Green/Duwamish River to the LDW are needed to improve our understanding of the potential for recontamination following remediation of sediment within the LDW.
From 2013 to 2017, the USGS, in cooperation with Ecology, collected new data to address three objectives. The first and primary objective was to provide improved estimates of suspended-sediment loads and toxic chemical loads transported by the Green/Duwamish River to the LDW. The data included concurrent, representative measurements of water chemistry, suspended-sediment concentration (SSC), particle-size distribution (PSD), and suspended-sediment chemistry using a novel field centrifuge method (Conn and others, 2016) collected over a range of conditions at a location close to the LDW upper boundary but upstream of the saltwater extent (USGS streamgage 12113390, Duwamish River at Golf Course at Tukwila, Washington, located at RKM 16.7). Results from the first (pilot) phase (2013), second phase (2013–15), and third phase (2016–17) of chemistry data collection are available (Conn and Black, 2014; Conn and others, 2015, 2018, respectively). A modern sediment rating curve using turbidity as a suspended-sediment surrogate was developed to estimate continuous (15-min) SSC at USGS streamgage 12113390 (Senter and others, 2018). This report integrates the discrete chemistry data from the three phases with the continuous record of river discharge and SSC at USGS streamgage 12113390 to estimate chemical loads transported from upstream sources by the Green/Duwamish River to the LDW.
One identified data gap in LDW remediation and source-control activities is a site-specific understanding of PCB partition behavior between suspended sediment and the dissolved water phase. During the third phase of USGS data collection, PCB congeners were analyzed on suspended colloidal material and in the dissolved phase in addition to suspended sediment and unfiltered water to address the second project objective of providing data to support the development of a site-specific PCB partition coefficient.
The transport, fate, and deposition of river sediment and associated chemicals in the Duwamish River once they enter the LDW is complicated, owing to (1) the dynamic estuary
system; (2) ongoing adjacent inputs of water, sediment, and contaminants; and (3) recurrent dredging and removal of sediment for navigational purposes. The toe of the saltwater wedge ranges from about RKM 3 during high flows or ebb tides to about RKM 14 during high tide, low-flow conditions (Stoner, 1967; Santos and Stoner, 1972). It is unknown how downstream surface freshwater flows carrying river sediment and contaminants interact with bottom bi-directional saltwater flows that may be resuspending LDW sediment and contaminants. The discrete sediment and chemistry sampling was done upstream of the saltwater extent to avoid complications by the estuarine influences. To inform these unknowns for future modeling efforts within the estuary, continuous data on gage height, salinity, turbidity, and water temperature were collected beginning in February 2015 from a new USGS streamgage near the LDW upper boundary (USGS streamgage 12113415, Duwamish River at East Marginal Way Bridge at Duwamish, Washington, located at RKM 10.9). Additionally, three single-day tidal studies were completed during August 2016–June 2017 from multiple bridges within the salt wedge during the third phase of this USGS data collection to address the third objective of describing the extent, duration, and shape of the salt wedge under varying flow, tide, and seasonal conditions.
Methods
Continuous Real-Time Monitoring
The USGS operates and maintains two streamgages in the tidally influenced segment of the Duwamish River (fig. 1). The streamgage at RKM 16.7 (USGS streamgage 12113390, Duwamish River at Golf Course at Tukwila, Washington) was installed in November 2013 (Conn and others, 2015), and continuous 15-min data for bi-directional discharge, gage height, turbidity, and water temperature is publicly available (http://waterdata.usgs.gov/nwis/uv?site_no=12113390). The streamgage is upstream of the estuarine environment but still within the tidally influenced segment of the river.
The streamgage at RKM 10.9 (USGS streamgage 12113415, Duwamish River at East Marginal Way Bridge at Duwamish, Washington) was installed in February 2015, and continuous 15-min data for gage height, water temperature, and salinity are publicly available (https://waterdata.usgs.gov/nwis/uv?site_no=12113415). The streamgage is within the estuarine segment of the river and has daily salinity intrusions under certain flow conditions. The data records for both streamgages are compiled, reviewed, and approved by the USGS in a timely manner consistent with USGS protocols (Levesque and Oberg, 2012).

Methods 7
Tidal Studies
To help describe the extent, shape, and mixing dynamics of saltwater intrusion in the Duwamish estuary under low-flow or mid-flow conditions, vertical and cross-sectional profiles of water-quality field parameters were collected simultaneously from multiple bridges within the estuary over three tidal cycles at different times of the year. The first study on August 2, 2016, targeted a maximum flooding tide (from a -0.5-m lower-low tide to a 3.4-m higher-high tide) during summer low-flow conditions (discharge at USGS streamgage 12113000, Green River near Auburn, Washington, was about 350 ft3/s) to document the farthest upstream extent of the salt wedge. The second study on January 17, 2017, targeted a winter high tide as it began to recede (from a 3.6-m higher-high tide to a 1.3-m higher-low tide) at winter low-flow conditions (discharge at USGS streamgage 12113000 was about 600 ft3/s). The third study on June 22, 2017, targeted the seaward extent of the salt wedge and its shape during a flooding tide (from a -0.7-m lower-low tide to a 3.3-m lower-high tide at spring mid-flow conditions (discharge at USGS streamgage 12113000 was about 1,000 ft3/s).
During each study, USGS teams were located on 2–4 bridges (fig. 1) from RKMs 8.9 to RKM 15.0. Each team recorded hourly measurements over 4–9 hours of water temperature, pH, dissolved oxygen, specific conductance, and turbidity using a calibrated sonde (6920 V2-2, YSI Inc.™, Yellow Springs, Ohio) at as much as five depths at three equal-width cross-sectional stations (left, center, and right, looking downstream). The data were reviewed and approved, and are stored in the USGS National Water Information System (U.S. Geological Survey, 2018) under station IDs 12113425 (RKM 8.9), 12113415 (RKM 10.9), 12113406 (RKM 12.7), and 12113400 (RKM 15.0).
Field Sampling and Processing
Discrete samples of water and suspended-sediment were collected for chemical analysis by the USGS from the Duwamish River at RKM 16.7 (USGS streamgage 12113390) over a 4-year period from February 2013 to March 2017 (Conn and Black, 2014; Conn and others, 2015, 2018). All discrete sediment and chemistry sampling was done at the upstream site, which is upstream of the saltwater influence but within the influence of tidal backwaters. There were 42 discrete sampling periods resulting in the collection of 39 unfiltered water samples, 32 filtered water samples, 39 suspended sediment samples, 12 colloidal samples, and 12 dissolved samples. Samples were collected during periods of differing hydrological conditions representing seasonal, storm-, and dam-related variations in flow and turbidity. The methods and study design have been described previously (Conn and Black, 2014; Conn and others, 2015, 2016, 2018). Briefly, during each sampling period, multiple tasks were completed, including (1) monitoring of field parameters, (2) collection of a depth- and width-integrated water sample
for chemical analysis (fig. 3A), (3) collection of a depth- and width-integrated water sample for SSC and PSD, and (4) collection of a point sample of suspended sediment by centrifugation for chemical analysis (fig. 3B). The point sample was collected from a location about 9 m from the left edge of water and 0.5 m above the bed at the sampling bridge. Large volumes of water—1,000–10,000 L per event—were pumped from the point location over multiple hours to multiple days through continuous-flow centrifuges to collect suspended sediment of sufficient quality and quantity for chemical analysis (Conn and others, 2016). During Phase 3 (2016–17), two additional types of samples were collected for PCB analysis—(1) a colloid sample on 0.45-µm filters from the water exiting the centrifuges, and (2) a dissolved sample on XAD-2 resin from the water exiting the filters (fig. 3C).
Analytical Methods
Unfiltered-water and suspended sediment samples were analyzed by Washington State-accredited laboratories for a large suite of chemical compounds using EPA-approved methods (table 1), including the 209 PCB congeners, dioxins and furans, PAHs and other semivolatile compounds, butyltins, trace elements including mercury, and total organic carbon. Filtered-water samples were analyzed for metals and dissolved organic carbon. Colloidal and dissolved samples were analyzed for PCBs only. Analytical parameter groups, methods, and analyzing laboratories are summarized in table 1. Method details and results for individual compounds have been published previously (Conn and Black, 2014; Conn and others 2015, 2018). Results are presented in this report only for frequently detected chemicals (detected in 50 percent or more of samples per matrix type), including:
• Total PCBs (summed concentration of 209 congeners);
• Low molecular-weight PAHs (LPAHs; summed concentration of naphthalene, acenaphthylene, acenaphthene, fluorene, phenanthrene, and anthracene);
• High molecular-weight PAHs (HPAHs; summed concentration of fluoranthene, pyrene, benz[a]anthracene, chrysene, total benzofluoranthenes [sum of b-, j-, and k- isomers]), benzo[a]pyrene, indeno[1,2,3-cd]pyrene, dibenzo[a,h]anthracene, and benzo[ghi]perylene);
• cPAHs (summed concentration of benz[a]anthracene, chrysene, benzo[a]pyrene, indeno[1,2,3-cd]pyrene, dibenz[a,h]anthracene, and total benzofluoranthenes [sum of b-, j-, and k- isomers]);
• Dioxins/furans (summed concentration of 17 congeners);
• Arsenic and other metals;
• Phthalates; and
• Total organic carbon.

8 Hydrology-Driven Chemical Loads Transported by the Green River to the Lower Duwamish Waterway near Seattle, Washington, 2013–17
tac18-1245_fig 03
A
C
B
Figure 3. Field sampling activities including collection of a depth- and width-integrated sample for water chemistry (A), continuous-flow centrifugation through a collection bowl (inset) for suspended sediment chemistry (B), and pumping of centrifuge outflow through a filter for colloidal chemical analysis (inset) and XAD resin (back left) for dissolved chemical analysis (C) at U.S. Geological Survey streamgage 12113390, Duwamish River at Golf Course at Tukwila, Washington.

Methods 9
Ana
lytic
al
para
met
er
Sam
ple
type
Ana
lysi
s
met
hod
Ana
lysi
s m
etho
d
desc
ript
ion
Ana
lyzi
ng
labo
rato
ryU
nfilt
ered
w
ater
Filte
red
wat
erSu
spen
ded
sedi
men
tG
lass
-fib
er
filte
rsXA
D-2
re
sin
Dio
xins
/fura
ns1,
2,3
–1,
2,3
––
1613
BH
igh-
reso
lutio
n ga
s chr
omat
ogra
phy/
m
ass s
pect
rom
etry
AX
YS
209
poly
chlo
rinat
ed
biph
enyl
con
gene
rs1,
2,3
–1,
2,3
33
1668
CH
igh-
reso
lutio
n ga
s chr
omat
ogra
phy/
m
ass s
pect
rom
etry
AX
YS
Org
anic
car
bon
1,2,
32,
31,
2,3
––
5310
B (w
ater
), PS
EP, 1
986
(sed
imen
t)H
igh-
tem
pera
ture
com
bust
ion
AR
I (1,
2);
MEL
(3)
Trac
e el
emen
ts1,
2,3
2,3
1,2,
3–
–60
20In
duct
ivel
y co
uple
d pl
asm
a-m
ass
spec
trom
etry
AR
I (1,
2);
MEL
(3)
Low
-leve
l mer
cury
1,2,
32,
31,
2,3
––
7470
A (w
ater
, Pha
ses 1
,2),
1631
E (w
ater
, Pha
se 3
), 74
71B
(sed
imen
t)
Col
d-va
por a
tom
ic a
bsor
ptio
n sp
ectro
met
ryA
RI (
1,2)
; M
EL (3
)
But
yltin
s1,
2,3
–1,
2,3
––
8270
DG
as c
hrom
atog
raph
y/m
ass s
pect
rom
etry
AR
ISe
miv
olat
ile c
ompo
unds
1,2,
3–
1,2,
3–
–82
70D
Gas
chr
omat
ogra
phy/
mas
s spe
ctro
met
ryA
RI
Low
-leve
l pol
ycyc
lic
arom
atic
hyd
roca
rbon
s1,
2,3
–1,
2,3
––
8270
D S
IMG
as c
hrom
atog
raph
y/m
ass s
pect
rom
etry
AR
I
Ultr
a lo
w-le
vel p
olyc
yclic
ar
omat
ic h
ydro
carb
ons
3–
––
–82
70D
SIM
with
larg
e-vo
lum
e in
ject
ion
Gas
chr
omat
ogra
phy/
mas
s spe
ctro
met
ryK
CEL
Vola
tile
orga
nic
com
poun
ds1,
2–
1,2
––
8260
CG
as c
hrom
atog
raph
y/m
ass s
pect
rom
etry
AR
IPo
lych
lorin
ated
bip
heny
l A
rocl
ors
1,2
–1,
2–
–80
82A
Gas
chr
omat
ogra
phy/
elec
tron
capt
ure
dete
ctor
AR
I
Pest
icid
es1,
2–
1,2
––
8081
BG
as c
hrom
atog
raph
y/el
ectro
n ca
ptur
e de
tect
orA
RI
Hex
aval
ent c
hrom
ium
1,2
–1,
2–
–71
96A
Col
orim
etric
AR
ISu
spen
ded-
sedi
men
t co
ncen
tratio
n1,
2,3
––
––
AST
M D
3977
-97(
2013
)e1
Wei
ght o
f ove
n-dr
ied
solid
sC
VO
Susp
ende
d-se
dim
ent p
artic
le
size
dis
tribu
tion
1,2,
3–
––
–G
uy, 1
969
Wet
siev
e (>
0.06
25 m
m) a
nd fa
ll di
amet
er
(<0.
0625
mm
)C
VO
Tabl
e 1.
An
alyt
ical
par
amet
er g
roup
s, m
etho
ds, a
nd a
naly
zing
labo
rato
ries
for s
ampl
es c
olle
cted
dur
ing
Phas
es 1
, 2, a
nd 3
at U
.S. G
eolo
gica
l Sur
vey
stre
amga
ge 1
2113
390
(Duw
amis
h Ri
ver a
t Gol
f Cou
rse
at T
ukw
ila, W
ashi
ngto
n), 2
013–
17.
[Sam
ple
type
: Num
bers
indi
cate
pha
se (1
, 2, o
r 3) d
urin
g w
hich
the
para
met
er w
as a
naly
zed.
Ana
lysi
s met
hod:
AST
M, A
mer
ican
Soc
iety
for T
estin
g an
d M
ater
ials
; PSE
P, P
uget
Sou
nd E
stua
ry P
rogr
am;
SIM
, sel
ecte
d io
n m
onito
ring;
SM
, sta
ndar
d m
etho
ds. U
nles
s an
alte
rnat
e re
fere
nce
is g
iven
, met
hod
num
bers
refe
r to
the
U.S
. Env
ironm
enta
l Pro
tect
ion
Age
ncy
SW-8
46 p
ublic
atio
n en
title
d “T
est M
etho
ds
for E
valu
atin
g So
lid W
aste
, Phy
sica
l/Che
mic
al M
etho
ds”
(U.S
. Env
ironm
enta
l Pro
tect
ion
Age
ncy,
201
7). A
naly
zing
labo
rato
ry: A
RI,
Ana
lytic
al R
esou
rces
, Inc
., Tu
kwila
, Was
hing
ton;
AX
YS,
SG
S A
XY
S A
naly
tical
Ser
vice
s Ltd
, Sid
ney,
Brit
ish
Col
umbi
a, C
anad
a; C
VO
, U.S
. Geo
logi
cal S
urve
y C
asca
des V
olca
no O
bser
vato
ry S
edim
ent L
abor
ator
y; K
CEL
, Kin
g C
ount
y En
viro
nmen
tal L
abor
ator
y, S
eattl
e,
Was
hing
ton;
MEL
, Man
ches
ter E
nviro
nmen
tal L
abor
ator
y, P
ort O
rcha
rd, W
ashi
ngto
n. A
bbre
viat
ion
and
sym
bols
: mm
, mill
imet
er; –
, not
ana
lyze
d fo
r; <,
less
than
; >, g
reat
er th
an]

10 Hydrology-Driven Chemical Loads Transported by the Green River to the Lower Duwamish Waterway near Seattle, Washington, 2013–17
Data Analysis
All analytical chemistry results were EPA Level 2 validated and all high-resolution mass spectrometry data (PCBs and dioxins/furans) were EPA Level 4 validated. Estimated data (results between the reporting limit and detection limit) are included in the summed or calculated values. Toxic equivalent (TEQ) concentrations are reported for dioxins/furans and cPAHs for comparison with regulatory values and previous Duwamish datasets. Toxic equivalents express mass concentration as a weighted measure of the total toxicity of a group of chemicals, based on the toxicity of each individual chemical relative to the most toxic chemical of the group. Total dioxins/furans were reported as a TEQ according to the World Health Organization 2005 guidelines (Van den Berg and others, 2006). Total cPAHs were reported as a TEQ according to the potency equivalency factors adopted by the California Environmental Protection Agency (2005). For non-detected compounds, one-half the detection limit was used.
Organic carbon-normalized concentrations were calculated by dividing the dry weight concentration by the fraction of organic carbon in the sample. Summary statistics were computed for chemicals that were detected in 50 percent or more of the samples per matrix type. The Kaplan-Meier estimator was used for datasets with non-detects (Helsel and Hirsch, 2002).
A regression between discrete samples of SSC and continuous 15-min turbidity and discharge data was developed to estimate 15-min SSC at USGS streamgage 12113390 (Senter and others, 2018). A suspended-sediment load (SSL; the mass of suspended sediment transported per unit time) was estimated by multiplying discharge by SSC at a 15-min resolution. Because many chemicals preferentially sorb to fine sediment (particle-size diameter less than 0.0625 mm), a second regression was developed to estimate 15-min SSLFINES, the fine suspended-sediment load (Senter and others, 2018). Daily SSL and daily SSLFINES were calculated as the sum of the 96 15-min values for each day of the study period.
Suspended sediment-bound chemical loads were estimated by multiplying SSL or SSLFINES by suspended sediment-bound chemical concentrations at a 15-min or daily resolution over the study period (2013–17). To compare approaches and avoid a seasonal bias, chemical loads for three complete calendar years are reported: 2014, 2015, and 2016. Four approaches were used to assign a chemical concentration to each 15-min or daily data point:
• Approach 1—Summary statistics
• Approach 2—River condition bins
• Approach 3—Linear regressions
• Approach 4—Non-linear regressions
For Approach 1, suspended sediment-bound chemical loads were estimated as the product of SSL or SSLFINES and three summary statistics—the 10th percentile, the median, and the 90th percentile—of the 39 measured suspended sediment-bound chemical concentrations. A suspended sediment-bound chemical load was calculated for every 15-min data point during the sediment record (November 27, 2013–January 29, 2017). The 15-min chemical loads were averaged for calendar years 2014, 2015, and 2016 to estimate annual chemical loads for the chemicals with LDW clean-up criteria (arsenic, cPAHs, dioxins/furans, and PCBs). Four values are reported for each chemical:
• A low-end bound, based on the product of the 10th percentile chemical concentration and the SSLFINES, which assumes the chemical is only bound to fine particles;
• A median-SSLFINES value, based on the product of the median chemical concentration and the SSLFINES;
• A median-SSL value, based on the product of the median chemical concentration and the SSL; and
• A high-end bound, based on the product of the 90th percentile chemical concentration and the SSL, which assumes the chemical is bound to all particle sizes.
Statistical metrics (minimum, median, average, and maximum) of daily loads were estimated by multiplying the median chemical concentration by the SSL.
For Approach 2, the median chemical concentration of discrete samples collected during each of four river conditions was calculated. The river conditions were as follows:
• Storm—Forty-eight-hour antecedent rainfall at the National Oceanic and Atmospheric Administration (NOAA) Seattle-Tacoma International Airport weather station (station ID WBAN:24233) was greater than or equal to 0.4 in. (1 cm),
• Dam release—Previous day mean river discharge at USGS streamgage 12105900 (Green River below Howard A Hanson Dam, Washington) was greater than or equal to 2,000 ft3/s,
• Storm-plus-Dam—Both of the above conditions were true, and
• Baseline—Neither of the above conditions were true.The previous day mean daily river discharge at USGS streamgage 12105900 was used to account for the travel time between USGS streamgage 12105900 (Green River below Howard A Hanson Dam, Washington) and USGS streamgage 12113390 (Duwamish River at Golf Course at Tukwila, Washington) (about 15 hours). Each day of the

Methods 11
1,160-day period of record was assigned a river condition. The daily SSL or SSLFINES was multiplied by the median chemical concentration for that river condition to estimate a daily chemical load. The daily chemical loads were summed over calendar years 2014, 2015, and 2016 to estimate annual chemical loads for the chemicals with LDW clean-up criteria (arsenic, cPAHs, dioxins/furans, and PCBs).
For Approach 3, linear regressions were developed between measured suspended sediment-bound chemical concentrations (and organic carbon [OC]-normalized concentrations for organic compounds) and time-varying hydrologic and climatic explanatory variables. The sediment chemistry parameters were arsenic, cadmium, chromium, copper, lead, mercury, zinc, cPAHs, cPAHs (OC normalized), dioxins/furans, dioxins/furans (OC normalized), PCBs, and PCBs (OC normalized). Explanatory variables included:
• The previous day mean daily discharge from USGS streamgage 12105900 (Green River below Howard A Hanson Dam, Washington);
• The day-of sampling median discharge at USGS streamgage 12113390 (Duwamish River at Golf Course at Tukwila, Washington);
• The day-of sampling median turbidity at USGS streamgage 12113390 (Duwamish River at Golf Course at Tukwila, Washington);
• The day-of sampling precipitation total at—
dThe NOAA Seattle-Tacoma International Airport weather station (station ID WBAN:24233),
dKing County 11U station in Des Moines,
dKing County Auburn City Hall station (“AUB_RAIN”),
dKing County 40U station in the Middle Green, and
dKing County 44U station in Enumclaw;
• The day-before-sampling precipitation total at each of the above rain gages;
• The 2 days-before-sampling precipitation total at each of the above rain gages;
• The sum of the 2 days-before- and day-before sampling precipitation total at each of the above rain gages;
• The 3-day total (sample day plus previous 2 days) at each of the above rain gages;
• The 5-day total at each of the above rain gages;
• The 10-day total at each of the above rain gages;
• Number of days since at least 0.25 in. of rain was recorded at the NOAA Seattle-Tacoma International Airport weather station;
• Number of days since at least 0.5 in of rain was recorded at the NOAA Seattle-Tacoma International Airport weather station; and
• Number of days since at least 1 in. of rain was recorded at the NOAA Seattle-Tacoma International Airport weather station.
A chemical concentration was estimated for the most significant watershed variable using 15-min or daily data, which was then multiplied by a concurrent sediment load to estimate a chemical load. The 15-min or daily chemical loads were summed over calendar years 2014, 2015, and 2016 to estimate annual chemical loads for the chemicals with LDW clean-up criteria (arsenic, cPAHs, dioxins/furans, and PCBs). Simple linear, rather than multi-linear, regressions were developed in this coarse first-cut exercise because the explanatory variables are highly correlated (for example, precipitation and discharge).
For Approach 4, a statistical technique known as random forests (RF) regression (Prasad and others, 2006; Cutler and others, 2007) was used to investigate relations between sediment-bound chemical concentrations and hydrologic and climatic factors. RF is a type of regression tree analysis that does not rely on inferred assumptions about the relation between response and predictor variables and allows for interactions and nonlinearities among variables. RF produces numerous regression trees from a bootstrapped sample of 70 percent of the observations for each node or branch in the regression tree. The remaining 30 percent of the observations are used to evaluate each branch. With this approach, each observation is left out of about one-third of the tree, and the final prediction for each observation is obtained by averaging the predictions across all the trees where it was excluded.
RF methods have a number of benefits over other regression tree methods. First, RF methods limit overfitting, which enhances its predictive capabilities. Second, the RF can model complex interactions among predictor variables. For example, when predictor variables are highly collinear but are good predictors of a response variable, traditional stepwise and criterion-based variable selection procedures typically will retain only one or two of the collinear variables and discard the rest. RF procedures distribute the importance of the collinear predictor variables and guard against eliminating predictor variables that may be mechanistically important, but are correlated with other predictors (Cutler and others, 2007). Finally, RF has a robust approach to characterizing the importance of predictor variables. The most important predictors will have the largest decrease in model accuracy when they are removed from the model. The RF method also identifies the percent variance explained for each model, also referred to as a pseudo R2.
RF regressions were developed for the LDW chemicals with criteria (arsenic, cPAHs, dioxins/furans, and PCBs) using more than 40 discharge and precipitation explanatory variables from different locations in the watershed, including the ones described earlier in this section for Approach 3. The RF
12 Hydrology-Driven Chemical Loads Transported by the Green River to the Lower Duwamish Waterway near Seattle, Washington, 2013–17
procedure was completed using the R statistical system (Liaw and Wiener, 2002; R Development Core Team, 2006). A daily chemical concentration was predicted from the regression output and used with a daily sediment load to estimate daily chemical loads. The daily chemical loads were summed over calendar years 2014, 2015, and 2016 to estimate annual chemical loads for the chemicals with LDW clean-up criteria (arsenic, cPAHs, dioxins/furans, and PCBs).
For PCB partition estimates, concentrations of PCBs in suspended sediment were converted to per-volume concentrations (in picograms per liter [pg/L]) by multiplying the suspended sediment-bound PCB concentration by the SSC (the median 15-min value during suspended-sediment sampling derived from the regression with turbidity, as described in Senter and others, 2018).
Hydrology and River Condition
Streamflow and Suspended Sediment
During November 27, 2013–January 29, 2017, daily river discharge at USGS streamgage 12113390 ranged from -736 to 10,300 ft3/s (fig. 4), and 15-min river discharge ranged from -1,390 to 11,100 ft3/s, where a negative sign indicates an upstream flow direction. The median and average 15-min discharge was 1,190 and 1,640 ft3/s, respectively, during the three-calendar-year period from 2014 to 2016. The highest flows occurred during dam releases or mixed storm-plus-dam releases, generally in the winter from October to April. During the study period (2013–17), there were 32–50 days of dam releases each year (when the mean daily discharge was greater than or equal to 2,000 ft3/s at USGS streamgage 12105900 (Green River below Howard A Hanson Dam). Since the dam went into operation in 1961, the number of days of dam releases has ranged from 2 (2000) to 90 (1972), with a median of 37 days (fig. 5), suggesting that the 2013–17 study period did not include any extreme years and was relatively representative of typical dam operations.
tac18-1245_fig 04
-100
0
100
200
300
400
500
600
700
800
900
-1,000
0
1,000
2,000
3,000
4,000
5,000
6,000
7,000
8,000
9,000
10,000
11,000
12,000
Susp
ende
d-se
dim
ent c
once
ntra
tion,
in m
illig
ram
s pe
r lite
r
Stre
amflo
w, i
n cu
bic
feet
per
seco
nd
11-12-2013 05-31-2014 12-17-2014 07-05-2014 01-21-2016 08-08-2016 02-24-2017
StreamflowSediment
EXPLANATION
Figure 4. Discharge and suspended-sediment concentration, U.S. Geological Survey streamgage 12113390 (Duwamish River at Golf Course at Tukwila, Washington), 2013–17.

Hydrology and River Condition 13
During the study period, mean daily discharge at USGS streamgage 12113390 was about 15 percent higher than mean daily discharge at USGS streamgage 12113000 (Green River near Auburn, Washington) at RKM 51.5. This likely is owing to additional flow contributions between the two streamgages from sources such as the Black River and numerous stormwater outfalls. The Auburn streamgage historically has been used to estimate water, sediment, and chemical loads to the LDW; therefore, those previous estimates may have underrepresented actual loads.
For the entire period of the sediment record at USGS streamgage 12113390 (November 27, 2013–January 29, 2017), the 15-min turbidity ranged from less than 1 to 260 Formazin Nephelometric Units (FNU), with a median and average of 4.3 and 10 FNU, respectively. Similarly, during the study load calculation period of calendar years 2014–16, turbidity ranged from less than 1 to 260 FNU, with a median and average 4.1 and 10 FNU, respectively. The highest turbidity values occurred during dam releases, when large amounts of suspended sediment were transported downstream with the increased river flows. The sediment may have originated from several different sources, including (1) lake sediment impounded behind the dam, (2) watershed sources transported to the river through overland runoff or
wet deposition during mixed storm-plus-dam release events, (3) scour and resuspension of riverbed sediments, or (4) other unknown sources. River discharge and suspended sediment often remained elevated for days after the flows decreased below 2,000 ft3/s from the dam (fig. 6), likely from releases of stored water from tributaries and from river bank storage in the Middle and Lower Green River.
Based on the regression between discrete measurements of SSC and continuous measurements of turbidity at USGS streamgage 12113390, 15-min SSC ranged from less than 1 to 872 mg/L, with a median of 9.5 mg/L, during the 1,160-day study period (Senter and others, 2018). The average annual SSL from 2014 to 2016 was 117,000 U.S. tons (106,000 metric tons), with large daily load variability depending on river condition. The daily SSL ranged from -0.98 U.S. tons/d during summer low-flow conditions to 18,000 U.S. tons/d during a winter dam-release event. Large dam releases, either with or without a coincident storm event, occurred infrequently—on 32–50 days per year during the study period, or an average of 11 percent of the time—but accounted for a disproportionately large amount of the annual sediment load (79 percent). Sediment loads during large dam releases, with or without a coincident storm, averaged 2,220 U.S. tons/d, with a maximum of 18,000 U.S. tons/d.
tac18-1245_fig 05
Num
ber o
f day
s in
yea
r in
whi
ch m
ean
daily
disc
harg
e at
U.S
. Geo
logi
cal S
urve
y st
ream
gage
121
0590
0w
as g
reat
er th
an o
r equ
al to
2,0
00 c
ubic
feet
per
sec
ond 100
90
80
70
60
50
40
30
20
10
01960 1970 1980 1990 2000 2010 2020
Figure 5. Number of days of dam releases each year (diamonds) since the Howard A Hanson Dam went into operation on the Green River, Washington, in 1961. Gray box is the current study period. Solid horizontal line is the median for the 56 years since the dam went into operation.

14 Hydrology-Driven Chemical Loads Transported by the Green River to the Lower Duwamish Waterway near Seattle, Washington, 2013–17
tac18-1245_fig 06
0
100
200
300
400
500
600
01-02-2015 01-04-2015 01-06-2015 01-08-2015 01-10-2015 01-12-2015 01-14-2015 01-16-2015
0
1,000
2,000
3,000
4,000
5,000
6,000
7,000
8,000
9,000
10,000A
B
Disc
harg
e, in
cub
ic fe
et p
er s
econ
dTu
rbid
ity, i
n Fo
rmaz
in N
ephe
lom
etric
Uni
ts
USGS streamgage 12113390—Duwamish River at Golf Course at Tukwila, Washington (river kilometer 16. 7)
USGS streamgage 12113000—Green River near Auburn, Washington (river kilometer 51.5)
USGS streamgage 12105900—Green River below Howard A Hanson Dam, Washington (river kilometer 103)
EXPLANATION
Figure 6. Example hydrographs showing river discharge measured at U.S. Geological Survey (USGS) streamgages 12113390, 12113000, and 12105900 on the Duwamish and Green Rivers (A); and turbidity measured at USGS streamgage 12113390 on the Duwamish River (B) during and after a large release from the Howard A Hanson Dam, Washington, January 2–16, 2015.

Chemical Concentrations 15
In contrast, sediment loads averaged 212 U.S. tons/d during storm events without a coincident dam release, and 43 U.S. tons/d during baseline conditions. Most of the suspended-sediment load (73.5 percent) was fine sediment with less than 0.0625 millimeter particle-size diameter, resulting in a fine sediment load of 86,200 U.S. tons/yr for 2014–16. During 2014–16, 97 percent of the total annual SSL was contributed during the wet half of the year (October 15–April 14) when storms and dam releases were more prevalent, whereas only 3 percent was contributed during April 15–October 14. Large inter-annual variability of sediment loads is expected in the Green/Duwamish River system, controlled by the frequency and intensity of precipitation events and the number and duration of dam releases. Peak flows at Auburn (USGS streamgage 12113000) during 2014–16 were 9,420, 8,810, and 10,900 ft3/s, which were slightly higher than the 55-year average (8,630 ft3/s). This, in addition to the near-average number of dam release days (fig. 5), suggests that the 2014–16 sediment load may be indicative of near-average annual loads.
Each year during summer (approximately June–October), there were frequent tidal reverse flows of as much as -1,390 ft3/s at RKM 16.7 (USGS streamgage 12113390). This resulted in upstream transport of suspended sediment, although during these low-flow, low-sediment conditions, the upstream sediment transport was negligible (0.001 percent of the downstream sediment load) at the streamgage. The streamgage is upstream of the salt wedge, so an upstream sediment load associated with the toe of the salt wedge (referred to as the estimated turbidity maximum) is not relevant at this streamgage. The upstream sediment load likely contributes more to the total sediment load farther downstream within the Duwamish estuary, where tidal resuspension is more prominent.
River Condition during Chemistry Sampling
The 42 discrete sampling periods occurred from February 2013 to March 2017 over a range of hydrologic conditions including the four previously defined river conditions: (1) 21 storms, (2) 4 dam releases, (3) 5 storm-plus-dam releases, and (4) 12 baseline periods. There were more samples collected during the wet winter half of the year (29 samples from October 15 to April 14) than during dry summer half of the year (11 samples from April 15 to October 14) because the study design targeted high-flow and high-sediment events. Sampling captured a wide range of river and hydrologic conditions during the study period—48-hour antecedent precipitation ranged from 0 to 2.95 in.; water temperature ranged from 3.2 to 17.5 °C; specific conductance ranged from 37 to 159 µS/cm; discharge ranged from less than 10 to 7,400 ft3/s; and SSC ranged from 6 to 555 mg/L.
Chemical Concentrations
Summary Statistics of Water Samples
Parameters that were detected in 50 percent or more of the unfiltered water samples included total organic carbon (TOC), 11 inorganic species, total dioxins/furans, and total PCBs (table 2). Other compounds were detected less frequently, including PAHs, butyltins, phthalates, and other semi-volatile compounds. Results for individual compounds for each sampling event previously have been reported (Conn and Black, 2014; Conn and others, 2015, 2018). TOC ranged from 1.37 to 7.39 mg/L, with a median of 2.29 mg/L. At least one-half of the TOC was in the dissolved form (DOC) in every sample, and DOC contributed 80 percent or more of the TOC in 23 of 30 paired samples. Filtered water samples were only analyzed for metals and DOC (table 3). Chemical concentrations in unfiltered and filtered water samples generally were low. For example, median (and maximum) arsenic concentrations were 0.9 µg/L (2.9 µg/L) and 0.50 µg/L (0.76 µg/L) in unfiltered and filtered water samples, respectively. The median concentration of total PCBs was 148 pg/L, with a maximum of 6,790 pg/L.
Summary Statistics of Suspended-Sediment Samples
A larger suite of chemicals was detected in suspended-sediment samples than in corresponding water samples, including PAHs, phthalates and other semivolatile compounds, in addition to TOC, metals, dioxin/furans, and PCBs (table 4). The chemicals with LDW cleanup goals (arsenic, cPAHs, dioxins/furans, and PCBs) were detected in all suspended-sediment samples collected from the Duwamish River at RKM 16.7 regardless of river condition (baseline, storm, dam release, storm-plus-dam release), even when concentrations were less than detection thresholds in paired water samples. Arsenic concentrations on suspended sediment ranged from 6.6 to 28.0 mg/kg (median = 13.8 mg/kg). Concentrations of cPAHs ranged from 3.7 to 454 µg TEQ/ kg (median = 60.3 µg TEQ/kg). Concentrations of dioxins/furans (sum of 17 congeners) ranged from 0.526 to 20.6 ng TEQ/ kg (median = 3.83 ng TEQ/kg). Concentrations of PCBs (sum of 209 congeners) ranged from 0.448 to 83.9 µg/kg (median = 11.1 µg/kg). Organic carbon-normalized concentrations (table 5) were low; for example, the maximum LPAH concentration was 9.05 mg/kg organic carbon and the maximum PCB concentration was 1,450 µg/kg organic carbon.

16 Hydrology-Driven Chemical Loads Transported by the Green River to the Lower Duwamish Waterway near Seattle, Washington, 2013–17
Para
met
er
Uni
t
Num
ber o
f de
tect
ions
/ n
umbe
r of
sam
ples
Min
imum
(o
f det
ectio
ns)
10 p
erce
nt25
per
cent
Med
ian
75 p
erce
nt90
per
cent
Max
imum
(o
f det
ectio
ns)
Mea
nSt
anda
rd
devi
atio
n
Tota
l org
anic
car
bon
mg/
L36
/39
1.37
1.48
1.65
2.29
3.16
6.30
7.39
2.74
1.52
Ars
enic
µg/L
39/3
90.
50.
60.
70.
91.
32.
02.
91.
10.
62B
ariu
mµg
/L39
/39
3.10
3.38
3.95
5.8
14.8
28.7
55.1
11.6
12.0
Chr
omiu
mµg
/L29
/39
0.18
0.19
0.28
0.43
1.80
4.00
5.28
1.22
1.47
Cob
alt
µg/L
27/2
90.
110.
110.
150.
201.
131.
913.
60.
700.
88C
oppe
rµg
/L37
/39
0.52
0.65
0.90
1.96
3.66
6.7
12.1
2.86
2.76
Lead
µg/L
38/3
90.
10.
100.
200.
501.
002.
53.
710.
820.
92M
anga
nese
µg/L
29/2
942
.947
.758
.684
.812
318
426
210
362
.0M
ercu
ryµg
/L19
/38
0.00
10.
001
0.00
20.
003
0.00
80.
019
0.02
10.
006
0.00
9M
olyb
denu
mµg
/L22
/29
0.16
NA
0.16
0.20
0.25
0.33
0.42
0.22
0.07
Nic
kel
µg/L
34/3
90.
260.
310.
430.
802.
004.
805.
311.
501.
58Va
nadi
umµg
/L39
/39
0.8
0.84
1.09
1.50
3.83
8.75
19.0
3.53
4.06
Dio
xins
/fura
ns, t
otal
pg/L
31/3
70.
935
1.00
6.14
17.1
37.2
87.4
287
40.6
68.1
Dio
xins
/fura
ns, t
otal
pg T
EQ/L
31/3
70.
792
0.80
00.
892
0.93
80.
993
1.27
1.55
0.94
30.
291
PCB
s, to
tal1
pg/L
37/3
71.
4123
.756
148
300
1,61
06,
790
531
1,23
01 PC
Bs,
tota
l is a
sum
med
con
cent
ratio
n of
209
con
gene
rs.
Tabl
e 2.
Su
mm
ary
stat
istic
s of
con
cent
ratio
ns o
f tot
al o
rgan
ic c
arbo
n an
d ch
emic
als
dete
cted
in a
t lea
st o
ne-h
alf o
f unf
ilter
ed-w
ater
sam
ples
, Duw
amis
h Ri
ver,
Was
hing
ton,
20
13–1
7.
[Par
amet
er: P
CB
s, po
lych
lorin
ated
bip
heny
ls. U
nit:
μg/
L, m
icro
gram
per
lite
r; m
g/L,
mill
igra
m p
er li
ter;
pg/L
, pic
ogra
m p
er li
ter;
pg T
EQ/L
, pic
ogra
m to
xic
equi
vale
nt p
er li
ter.
Abb
revi
atio
n: N
A, n
ot
appl
icab
le]
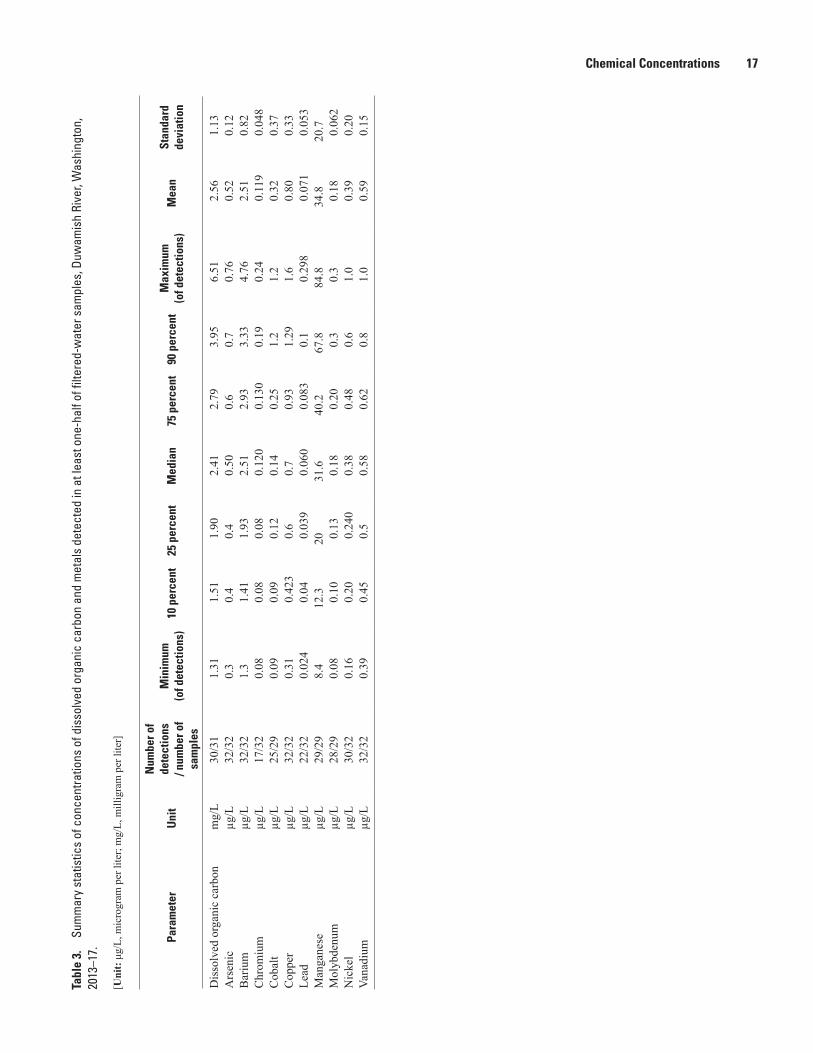
Chemical Concentrations 17
Para
met
er
Uni
t
Num
ber o
f de
tect
ions
/ n
umbe
r of
sam
ples
Min
imum
(o
f det
ectio
ns)
10 p
erce
nt25
per
cent
Med
ian
75 p
erce
nt90
per
cent
Max
imum
(o
f det
ectio
ns)
Mea
nSt
anda
rd
devi
atio
n
Dis
solv
ed o
rgan
ic c
arbo
nm
g/L
30/3
11.
311.
511.
902.
412.
793.
956.
512.
561.
13A
rsen
icµg
/L32
/32
0.3
0.4
0.4
0.50
0.6
0.7
0.76
0.52
0.12
Bar
ium
µg/L
32/3
21.
31.
411.
932.
512.
933.
334.
762.
510.
82C
hrom
ium
µg/L
17/3
20.
080.
080.
080.
120
0.13
00.
190.
240.
119
0.04
8C
obal
tµg
/L25
/29
0.09
0.09
0.12
0.14
0.25
1.2
1.2
0.32
0.37
Cop
per
µg/L
32/3
20.
310.
423
0.6
0.7
0.93
1.29
1.6
0.80
0.33
Lead
µg/L
22/3
20.
024
0.04
0.03
90.
060
0.08
30.
10.
298
0.07
10.
053
Man
gane
seµg
/L29
/29
8.4
12.3
2031
.640
.267
.884
.834
.820
.7M
olyb
denu
mµg
/L28
/29
0.08
0.10
0.13
0.18
0.20
0.3
0.3
0.18
0.06
2N
icke
lµg
/L30
/32
0.16
0.20
0.24
00.
380.
480.
61.
00.
390.
20Va
nadi
umµg
/L32
/32
0.39
0.45
0.5
0.58
0.62
0.8
1.0
0.59
0.15
Tabl
e 3.
Su
mm
ary
stat
istic
s of
con
cent
ratio
ns o
f dis
solv
ed o
rgan
ic c
arbo
n an
d m
etal
s de
tect
ed in
at l
east
one
-hal
f of f
ilter
ed-w
ater
sam
ples
, Duw
amis
h Ri
ver,
Was
hing
ton,
20
13–1
7.
[Uni
t: μ
g/L,
mic
rogr
am p
er li
ter;
mg/
L, m
illig
ram
per
lite
r]
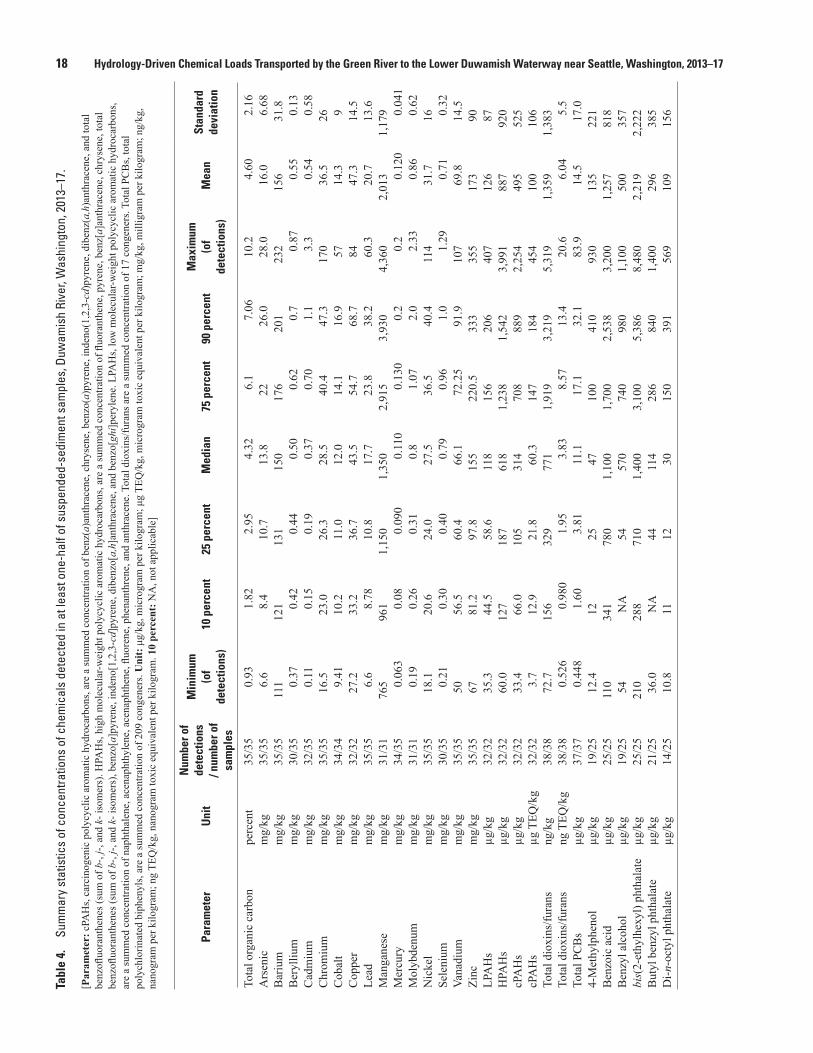
18 Hydrology-Driven Chemical Loads Transported by the Green River to the Lower Duwamish Waterway near Seattle, Washington, 2013–17
Para
met
er
Uni
t
Num
ber o
f de
tect
ions
/ n
umbe
r of
sam
ples
Min
imum
(o
f de
tect
ions
)10
per
cent
25 p
erce
ntM
edia
n75
per
cent
90 p
erce
ntM
axim
um
(of
dete
ctio
ns)
Mea
nSt
anda
rd
devi
atio
n
Tota
l org
anic
car
bon
perc
ent
35/3
50.
931.
822.
954.
326.
17.
0610
.24.
602.
16A
rsen
icm
g/kg
35/3
56.
68.
410
.713
.822
26.0
28.0
16.0
6.68
Bar
ium
mg/
kg35
/35
111
121
131
150
176
201
232
156
31.8
Ber
ylliu
mm
g/kg
30/3
50.
370.
420.
440.
500.
620.
70.
870.
550.
13C
adm
ium
mg/
kg32
/35
0.11
0.15
0.19
0.37
0.70
1.1
3.3
0.54
0.58
Chr
omiu
mm
g/kg
35/3
516
.523
.026
.328
.540
.447
.317
036
.526
Cob
alt
mg/
kg34
/34
9.41
10.2
11.0
12.0
14.1
16.9
5714
.39
Cop
per
mg/
kg32
/32
27.2
33.2
36.7
43.5
54.7
68.7
8447
.314
.5Le
adm
g/kg
35/3
56.
68.
7810
.817
.723
.838
.260
.320
.713
.6M
anga
nese
mg/
kg31
/31
765
961
1,15
01,
350
2,91
53,
930
4,36
02,
013
1,17
9M
ercu
rym
g/kg
34/3
50.
063
0.08
0.09
00.
110
0.13
00.
20.
20.
120
0.04
1M
olyb
denu
mm
g/kg
31/3
10.
190.
260.
310.
81.
072.
02.
330.
860.
62N
icke
lm
g/kg
35/3
518
.120
.624
.027
.536
.540
.411
431
.716
Sele
nium
mg/
kg30
/35
0.21
0.30
0.40
0.79
0.96
1.0
1.29
0.71
0.32
Vana
dium
mg/
kg35
/35
5056
.560
.466
.172
.25
91.9
107
69.8
14.5
Zinc
mg/
kg35
/35
6781
.297
.815
522
0.5
333
355
173
90LP
AH
sµg
/kg
32/3
235
.344
.558
.611
815
620
640
712
687
HPA
Hs
µg/k
g32
/32
60.0
127
187
618
1,23
81,
542
3,99
188
792
0cP
AH
sµg
/kg
32/3
233
.466
.010
531
470
888
92,
254
495
525
cPA
Hs
µg T
EQ/k
g32
/32
3.7
12.9
21.8
60.3
147
184
454
100
106
Tota
l dio
xins
/fura
nsng
/kg
38/3
872
.715
632
977
11,
919
3,21
95,
319
1,35
91,
383
Tota
l dio
xins
/fura
nsng
TEQ
/kg
38/3
80.
526
0.98
01.
953.
838.
5713
.420
.66.
045.
5To
tal P
CB
sµg
/kg
37/3
70.
448
1.60
3.81
11.1
17.1
32.1
83.9
14.5
17.0
4-M
ethy
lphe
nol
µg/k
g19
/25
12.4
1225
4710
041
093
013
522
1B
enzo
ic a
cid
µg/k
g25
/25
110
341
780
1,10
01,
700
2,53
83,
200
1,25
781
8B
enzy
l alc
ohol
µg/k
g19
/25
54N
A54
570
740
980
1,10
050
035
7bi
s(2-
ethy
lhex
yl) p
htha
late
µg/k
g25
/25
210
288
710
1,40
03,
100
5,38
68,
480
2,21
92,
222
But
yl b
enzy
l pht
hala
teµg
/kg
21/2
536
.0N
A44
114
286
840
1,40
029
638
5D
i-n-o
ctyl
pht
hala
teµg
/kg
14/2
510
.811
1230
150
391
569
109
156
Tabl
e 4.
Su
mm
ary
stat
istic
s of
con
cent
ratio
ns o
f che
mic
als
dete
cted
in a
t lea
st o
ne-h
alf o
f sus
pend
ed-s
edim
ent s
ampl
es, D
uwam
ish
Rive
r, W
ashi
ngto
n, 2
013–
17.
[Par
amet
er: c
PAH
s, ca
rcin
ogen
ic p
olyc
yclic
aro
mat
ic h
ydro
carb
ons,
are
a su
mm
ed c
once
ntra
tion
of b
enz(
a)an
thra
cene
, chr
ysen
e, b
enzo
(a)p
yren
e, in
deno
(1,2
,3-c
d)py
rene
, dib
enz(
a,h)
anth
race
ne, a
nd to
tal
benz
ofluo
rant
hene
s (su
m o
f b-,
j-, a
nd k
- iso
mer
s). H
PAH
s, hi
gh m
olec
ular
-wei
ght p
olyc
yclic
aro
mat
ic h
ydro
carb
ons,
are
a su
mm
ed c
once
ntra
tion
of fl
uora
nthe
ne, p
yren
e, b
enz[
a]an
thra
cene
, chr
ysen
e, to
tal
benz
ofluo
rant
hene
s (su
m o
f b-,
j-, a
nd k
- iso
mer
s), b
enzo
[a]p
yren
e, in
deno
[1,2
,3-c
d]py
rene
, dib
enzo
[a,h
]ant
hrac
ene,
and
ben
zo[g
hi]p
eryl
ene.
LPA
Hs,
low
mol
ecul
ar-w
eigh
t pol
ycyc
lic a
rom
atic
hyd
roca
rbon
s, ar
e a
sum
med
con
cent
ratio
n of
nap
htha
lene
, ace
naph
thyl
ene,
ace
naph
then
e, fl
uore
ne, p
hena
nthr
ene,
and
ant
hrac
ene.
Tot
al d
ioxi
ns/fu
rans
are
a su
mm
ed c
once
ntra
tion
of 1
7 co
ngen
ers.
Tota
l PC
Bs,
tota
l po
lych
lorin
ated
bip
heny
ls, a
re a
sum
med
con
cent
ratio
n of
209
con
gene
rs. U
nit:
μg/
kg, m
icro
gram
per
kilo
gram
; μg
TEQ
/kg,
mic
rogr
am to
xic
equi
vale
nt p
er k
ilogr
am; m
g/kg
, mill
igra
m p
er k
ilogr
am; n
g/kg
, na
nogr
am p
er k
ilogr
am; n
g TE
Q/k
g, n
anog
ram
toxi
c eq
uiva
lent
per
kilo
gram
. 10
perc
ent:
NA
, not
app
licab
le]
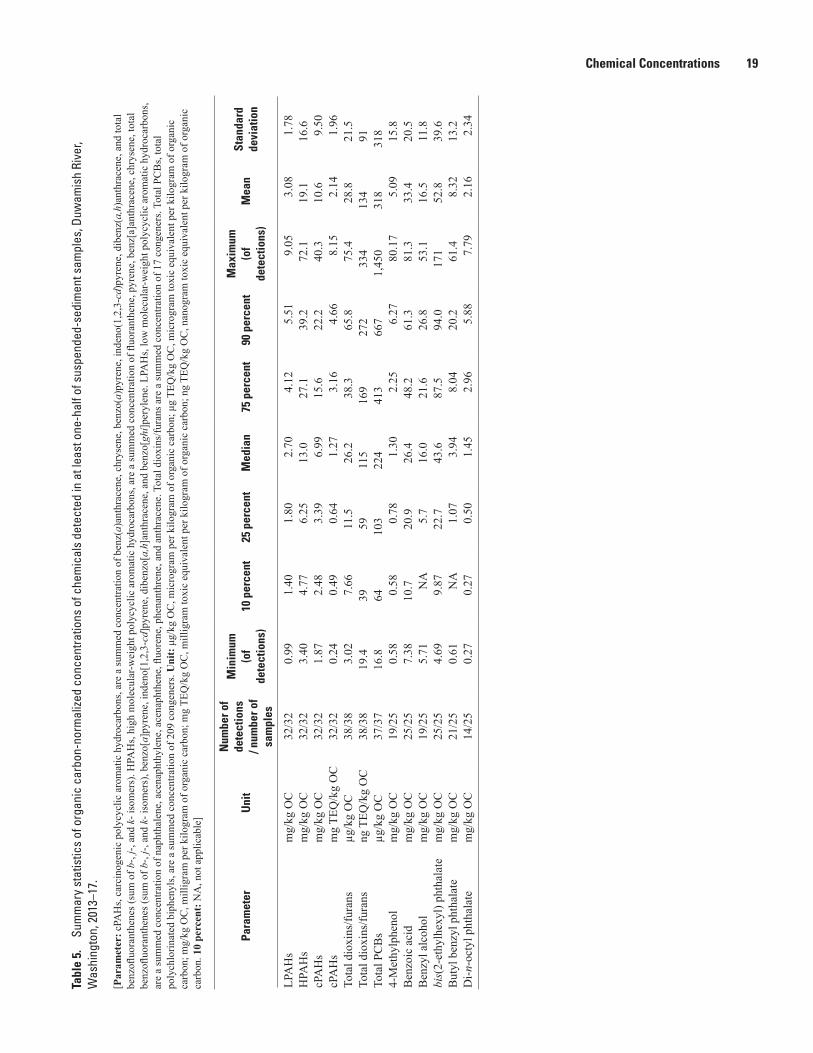
Chemical Concentrations 19
Para
met
er
Uni
t
Num
ber o
f de
tect
ions
/ n
umbe
r of
sam
ples
Min
imum
(o
f de
tect
ions
)10
per
cent
25 p
erce
ntM
edia
n75
per
cent
90 p
erce
ntM
axim
um
(of
dete
ctio
ns)
Mea
nSt
anda
rd
devi
atio
n
LPA
Hs
mg/
kg O
C32
/32
0.99
1.40
1.80
2.70
4.12
5.51
9.05
3.08
1.78
HPA
Hs
mg/
kg O
C32
/32
3.40
4.77
6.25
13.0
27.1
39.2
72.1
19.1
16.6
cPA
Hs
mg/
kg O
C32
/32
1.87
2.48
3.39
6.99
15.6
22.2
40.3
10.6
9.50
cPA
Hs
mg
TEQ
/kg
OC
32/3
20.
240.
490.
641.
273.
164.
668.
152.
141.
96To
tal d
ioxi
ns/fu
rans
µg/k
g O
C38
/38
3.02
7.66
11.5
26.2
38.3
65.8
75.4
28.8
21.5
Tota
l dio
xins
/fura
nsng
TEQ
/kg
OC
38/3
819
.439
5911
516
927
233
413
491
Tota
l PC
Bs
µg/k
g O
C37
/37
16.8
6410
322
441
366
71,
450
318
318
4-M
ethy
lphe
nol
mg/
kg O
C19
/25
0.58
0.58
0.78
1.30
2.25
6.27
80.1
75.
0915
.8B
enzo
ic a
cid
mg/
kg O
C25
/25
7.38
10.7
20.9
26.4
48.2
61.3
81.3
33.4
20.5
Ben
zyl a
lcoh
olm
g/kg
OC
19/2
55.
71N
A5.
716
.021
.626
.853
.116
.511
.8bi
s(2-
ethy
lhex
yl) p
htha
late
mg/
kg O
C25
/25
4.69
9.87
22.7
43.6
87.5
94.0
171
52.8
39.6
But
yl b
enzy
l pht
hala
tem
g/kg
OC
21/2
50.
61N
A1.
073.
948.
0420
.261
.48.
3213
.2D
i-n-o
ctyl
pht
hala
tem
g/kg
OC
14/2
50.
270.
270.
501.
452.
965.
887.
792.
162.
34
Tabl
e 5.
Su
mm
ary
stat
istic
s of
org
anic
car
bon-
norm
alize
d co
ncen
tratio
ns o
f che
mic
als
dete
cted
in a
t lea
st o
ne-h
alf o
f sus
pend
ed-s
edim
ent s
ampl
es, D
uwam
ish
Rive
r, W
ashi
ngto
n, 2
013–
17.
[Par
amet
er: c
PAH
s, ca
rcin
ogen
ic p
olyc
yclic
aro
mat
ic h
ydro
carb
ons,
are
a su
mm
ed c
once
ntra
tion
of b
enz(
a)an
thra
cene
, chr
ysen
e, b
enzo
(a)p
yren
e, in
deno
(1,2
,3-c
d)py
rene
, dib
enz(
a,h)
anth
race
ne, a
nd to
tal
benz
ofluo
rant
hene
s (su
m o
f b-,
j-, a
nd k
- iso
mer
s). H
PAH
s, hi
gh m
olec
ular
-wei
ght p
olyc
yclic
aro
mat
ic h
ydro
carb
ons,
are
a su
mm
ed c
once
ntra
tion
of fl
uora
nthe
ne, p
yren
e, b
enz[
a]an
thra
cene
, chr
ysen
e, to
tal
benz
ofluo
rant
hene
s (su
m o
f b-,
j-, a
nd k
- iso
mer
s), b
enzo
[a]p
yren
e, in
deno
[1,2
,3-c
d]py
rene
, dib
enzo
[a,h
]ant
hrac
ene,
and
ben
zo[g
hi]p
eryl
ene.
LPA
Hs,
low
mol
ecul
ar-w
eigh
t pol
ycyc
lic a
rom
atic
hyd
roca
rbon
s, ar
e a
sum
med
con
cent
ratio
n of
nap
htha
lene
, ace
naph
thyl
ene,
ace
naph
then
e, fl
uore
ne, p
hena
nthr
ene,
and
ant
hrac
ene.
Tot
al d
ioxi
ns/fu
rans
are
a su
mm
ed c
once
ntra
tion
of 1
7 co
ngen
ers.
Tota
l PC
Bs,
tota
l po
lych
lorin
ated
bip
heny
ls, a
re a
sum
med
con
cent
ratio
n of
209
con
gene
rs. U
nit:
μg/
kg O
C, m
icro
gram
per
kilo
gram
of o
rgan
ic c
arbo
n; μ
g TE
Q/k
g O
C, m
icro
gram
toxi
c eq
uiva
lent
per
kilo
gram
of o
rgan
ic
carb
on; m
g/kg
OC
, mill
igra
m p
er k
ilogr
am o
f org
anic
car
bon;
mg
TEQ
/kg
OC
, mill
igra
m to
xic
equi
vale
nt p
er k
ilogr
am o
f org
anic
car
bon;
ng
TEQ
/kg
OC
, nan
ogra
m to
xic
equi
vale
nt p
er k
ilogr
am o
f org
anic
ca
rbon
. 10
perc
ent:
NA
, not
app
licab
le]

20 Hydrology-Driven Chemical Loads Transported by the Green River to the Lower Duwamish Waterway near Seattle, Washington, 2013–17
Duwamish River suspended sediment has a higher percentage of fine sediment, higher organic carbon content, and higher chemical concentrations than nearby bed-sediment samples (Conn and others, 2016). Transport, fate, and deposition of river suspended sediment within the LDW will depend on watershed and river conditions (flows, sediment sources, SSC and PSD, tidal stage), and the determination of the sources and dominant processes was outside the scope of this project.
The suspended sediment-bound chemical concentrations compare well (table 6) with other studies of suspended sediment-bound chemical concentrations in the Green/ Duwamish River (Gries and Sloan, 2009; King County, 2016). As expected, the current study generally reported a wider range of measured concentrations as compared to the other studies, given the greater number of samples (about 40 compared to less than 10) over a wide range of river conditions (including dam releases and rising limbs of storm hydrographs). However, the mean concentrations reported by the current study and Gries and Sloan (2009) are nearly identical: 16.0 compared to 16.6 mg/kg arsenic, 100 compared to 144 µg TEQ/kg cPAHs, 6.04 compared to 6.36 ng TEQ/ kg dioxins/furans, and 14.5 compared to 14.5 µg/kg PCBs. The measured suspended sediment-bound concentrations in this study and the other studies (Gries and Sloan, 2009; King County, 2016) generally have a wider range than concentrations in the range of BCM values used to estimate inputs from the watershed to the LDW (AECOM, 2012). For example, the measured range of suspended sediment-bound arsenic concentrations was 6.6–28.0 mg/kg in the current study, and the range of BCM input values was 7.0–10.0 mg/kg (table 6).
Measured concentrations of individual chemical parameters on suspended sediment could vary over orders of magnitude between sampling periods, likely owing to complex interactions between watershed variables such as season, antecedent dry period, precipitation amount, duration, intensity, location in the watershed, and operation of the Howard A Hanson Dam. Assuming a single sediment-bound concentration (for example, an average value) for chemical loads will not fully represent this range of measured concentrations. For example, median suspended sediment-bound concentrations were 2.5–3 times higher during storm events than during baseline conditions, and 10–27 times higher during storm events than during dam releases for anthropogenic, stormwater-transported chemicals including cPAHs, dioxins/furans, and PCBs (table 7). Median concentrations during storm-plus-dam events were slightly higher than median concentrations during dam releases,
which may be explained using a simple mixing model of 6–10 percent storm water contribution and 90–94 percent dam release water contribution to the total volume. In contrast, median suspended sediment-bound arsenic concentrations were highest during baseline conditions (26.2 mg/kg) as compared to storm conditions (14.3 mg/kg), storm-plus-dam release conditions (9.30 mg/kg) and dam release conditions (8.95 mg/kg). Arsenic occurs naturally in watershed soils and river sediments. Median suspended-bound concentrations of anthropogenic metals such as cadmium, lead, and zinc were highest in storm events and lowest during large dam releases. Other metals such as barium, cobalt, and nickel did not vary greatly between different sampling conditions.
During periods of high SSC, the suspended sediment-bound concentrations of metals contributed most of the chemical concentration in the water column, whereas the dissolved concentration was relatively low and consistent between sampling events regardless of SSC. For example, arsenic concentrations in dissolved water samples ranged from 0.3 to 0.76 µg/L, whereas particulate-bound concentrations ranged from 0.09 to 4.55 µg/L (fig. 7A). The dissolved fraction contributed most (65–82 percent) of the total arsenic concentration in the water column during low-sediment conditions (SSC <20 mg/L) and the least concentration (8–26 percent) during high-sediment conditions (SSC >100 mg/L). The dissolved fraction contributed less of the total water concentration (usually less than 10 percent) for other metals such as lead and copper (fig. 7B and 7C) as compared to arsenic. The sum of the dissolved and particulate-bound concentrations were similar to the concentration measured in unfiltered water samples during low-sediment events. As the SSC increased, the concentration measured in unfiltered water samples was generally less than the sum of the dissolved and particulate-bound concentrations. This is particularly true for organic carbon (fig. 7D). This may be because the analytical methods used for unfiltered water samples underrepresent the chemical fraction bound to particulate material. A subsample of a small water sample volume, typically 100–1,000 mL, often is used for chemical analysis and, therefore, may not representatively sample the particulate material within the sample. The results from this study suggest that the sum of the chemical concentrations measured on two separate fractions—the particulate fraction and the dissolved fraction—may more fully represent the total chemical concentration in an unfiltered water sample as compared to analysis of an unfiltered water sample, especially in samples with high suspended-sediment concentrations.

Chemical Concentrations 21
StudyStatistic or
valueArsenic (mg/kg)
cPAHs (µg TEQ/kg)
Total dioxins/furans (ng/kg)
Total dioxins/furans (ng TEQ/kg)
Total PCBs (µg/kg)
Current study (RKM 16.7) Minimum 6.6 3.7 72.7 0.526 0.44810 percent 8.4 12.9 156 0.980 1.60Median 13.8 60.3 771 3.83 11.190 percent 26.0 184 3,220 13.4 32.1Maximum 28.0 454 5,320 20.6 83.9Mean 16.0 100 1,360 6.04 14.5
Gries and Sloan, 2009 (RKM 11) Minimum 9.2 13 – 0.83 <1.290 percent 23.9 372 – 15.3 34.3Maximum 24.3 588 – 16.2 62.1Mean 16.6 144 – 6.36 14.5
King County, 2016, sediment traps (RKM 16.7)
Minimum 4.95 – 81.5 – 0.70Maximum 17.5 – 910 – 12.0Mean 8.86 – 373 – 5.27
King County, 2016, filtered solids (RKM 16.7)
Baseflow 39.9 – 794 – 7.75Storm minimum 8.7 – 284 – 2.20Storm maximum 24.5 – 4,610 – 99.9Storm mean 14.2 – 1,550 – 29.9
BCM input value Low 7.0 40 – 2.00 5.0Mid 9.0 70 – 4.00 35.0High 10.0 270 – 8.00 80.0
Table 6. Comparison of Bed Composition Model input values with measured suspended sediment-bound chemical concentrations from three studies, Duwamish River, Washington.
[Study: BCM, Bed Composition Model; RKM, river kilometer. cPAHs: Carcinogenic polycyclic aromatic hydrocarbons. Total PCBs: Total polychlorinated biphenyls. Abbreviations and symbols: µg/kg, microgram per kilogram; µg TEQ/kg, microgram toxic equivalent per kilogram; mg/kg, milligram per kilogram; ng/kg, nanogram per kilogram; ng TEQ/kg, nanogram toxic equivalent per kilogram; <, less than; –, not calculated]
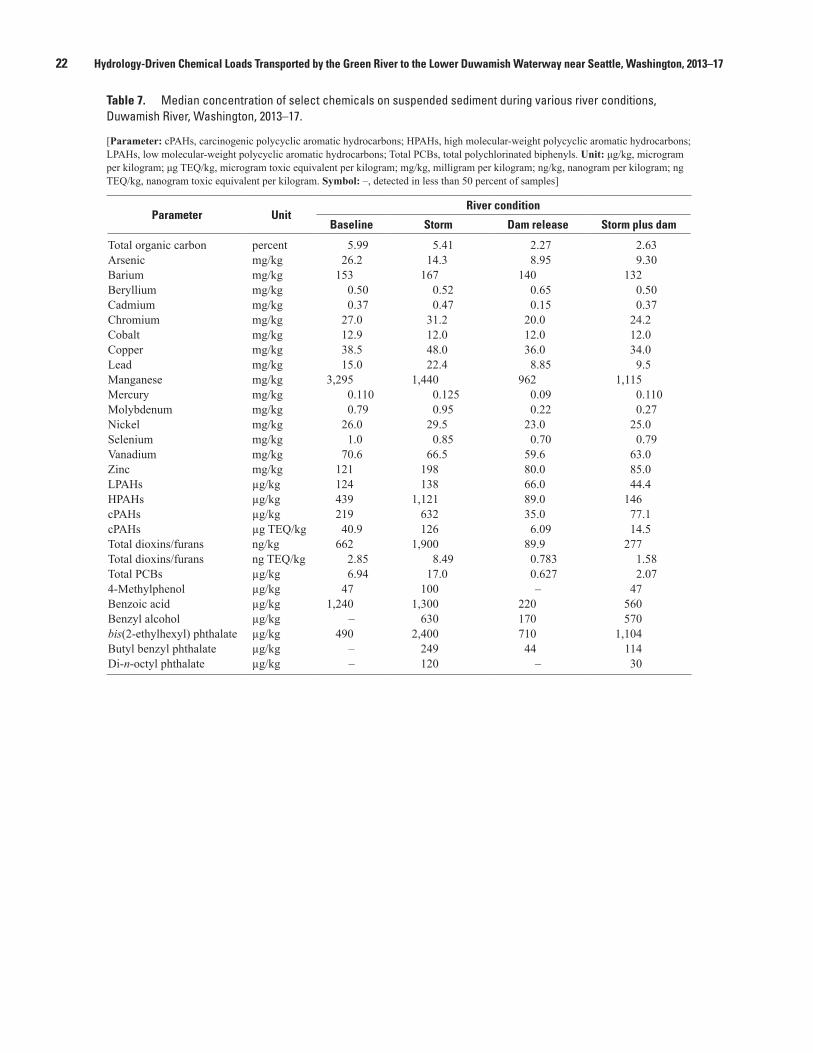
22 Hydrology-Driven Chemical Loads Transported by the Green River to the Lower Duwamish Waterway near Seattle, Washington, 2013–17
Parameter UnitRiver condition
Baseline Storm Dam release Storm plus dam
Total organic carbon percent 5.99 5.41 2.27 2.63Arsenic mg/kg 26.2 14.3 8.95 9.30Barium mg/kg 153 167 140 132Beryllium mg/kg 0.50 0.52 0.65 0.50Cadmium mg/kg 0.37 0.47 0.15 0.37Chromium mg/kg 27.0 31.2 20.0 24.2Cobalt mg/kg 12.9 12.0 12.0 12.0Copper mg/kg 38.5 48.0 36.0 34.0Lead mg/kg 15.0 22.4 8.85 9.5Manganese mg/kg 3,295 1,440 962 1,115Mercury mg/kg 0.110 0.125 0.09 0.110Molybdenum mg/kg 0.79 0.95 0.22 0.27Nickel mg/kg 26.0 29.5 23.0 25.0Selenium mg/kg 1.0 0.85 0.70 0.79Vanadium mg/kg 70.6 66.5 59.6 63.0Zinc mg/kg 121 198 80.0 85.0LPAHs µg/kg 124 138 66.0 44.4HPAHs µg/kg 439 1,121 89.0 146cPAHs µg/kg 219 632 35.0 77.1cPAHs µg TEQ/kg 40.9 126 6.09 14.5Total dioxins/furans ng/kg 662 1,900 89.9 277Total dioxins/furans ng TEQ/kg 2.85 8.49 0.783 1.58Total PCBs µg/kg 6.94 17.0 0.627 2.074-Methylphenol µg/kg 47 100 – 47Benzoic acid µg/kg 1,240 1,300 220 560Benzyl alcohol µg/kg – 630 170 570bis(2-ethylhexyl) phthalate µg/kg 490 2,400 710 1,104Butyl benzyl phthalate µg/kg – 249 44 114Di-n-octyl phthalate µg/kg – 120 – 30
Table 7. Median concentration of select chemicals on suspended sediment during various river conditions, Duwamish River, Washington, 2013–17.
[Parameter: cPAHs, carcinogenic polycyclic aromatic hydrocarbons; HPAHs, high molecular-weight polycyclic aromatic hydrocarbons; LPAHs, low molecular-weight polycyclic aromatic hydrocarbons; Total PCBs, total polychlorinated biphenyls. Unit: μg/kg, microgram per kilogram; μg TEQ/kg, microgram toxic equivalent per kilogram; mg/kg, milligram per kilogram; ng/kg, nanogram per kilogram; ng TEQ/kg, nanogram toxic equivalent per kilogram. Symbol: –, detected in less than 50 percent of samples]

Chemical Load Estimates 23
Figure 7. Comparison of the sum of particulate-bound and dissolved concentrations to concentrations measured in unfiltered water samples for arsenic (A), lead (B), copper (C), and organic carbon (D), Duwamish River, Washington, 2013–17.
tac18-1245_fig 07
Sampling event Sampling event
0
1
2
3
4
5
Ars
enic
con
cent
ratio
n, in
mic
rogr
ams p
er lit
er
0
1
2
3
4
5
Lead
con
cent
ratio
n, in
mic
rogr
ams p
er li
ter
0
5
10
15
20
25
Copp
er c
once
ntra
tion,
in m
icro
gram
s per
lite
r
0
5
10
15
20
25
Orga
nic
catb
on c
once
ntra
tion,
in
mic
rogr
ams p
er li
ter
Low suspended-sediment concentration
High suspended-sediment concentration
Low suspended-sediment concentration
High suspended-sediment concentration
Particulate (measured on suspended sediment)Dissolved (measured in filtered water)Total (measured in unfiltered water)
EXPLANATIONA
C D
B
Chemical Load Estimates
Approach 1—Summary Statistics
Average annual suspended sediment-bound arsenic loads to the LDW ranged from 654 to 2,760 kg (table 8), as estimated using three summary statistics—the 10th percentile, the median, and the 90th percentile—of suspended sediment-bound chemical concentrations (see table 4) and two sediment load estimates—SSL and SSLFINES. Average annual suspended sediment-bound loads of the other chemicals with LDW criteria are estimated to range from 1,010 to 19,500 g TEQ of cPAHs, from 77 to 1,430 mg TEQ of dioxins/furans, and from 125 to 3,420 g PCBs. The range of estimated arsenic
loads is fairly small (maximum value is about four times larger than the minimum value), whereas the range of estimated loads for cPAHs, dioxins/furans and PCBs is wide (maximum value is 19–27 times larger than the minimum value), owing to large variations in suspended sediment-bound chemical concentrations measured during different sampling periods.
Daily loads were calculated by multiplying the median chemical concentration by the daily SSL for each day in 2014–16. Daily chemical load estimates varied by orders of magnitude (table 9). For example, cPAHs daily loads ranged from -0.054 g TEQ during the 2015 summer drought to 988 g TEQ during a winter storm when large volumes of water also was being released from the Howard A Hanson Dam.
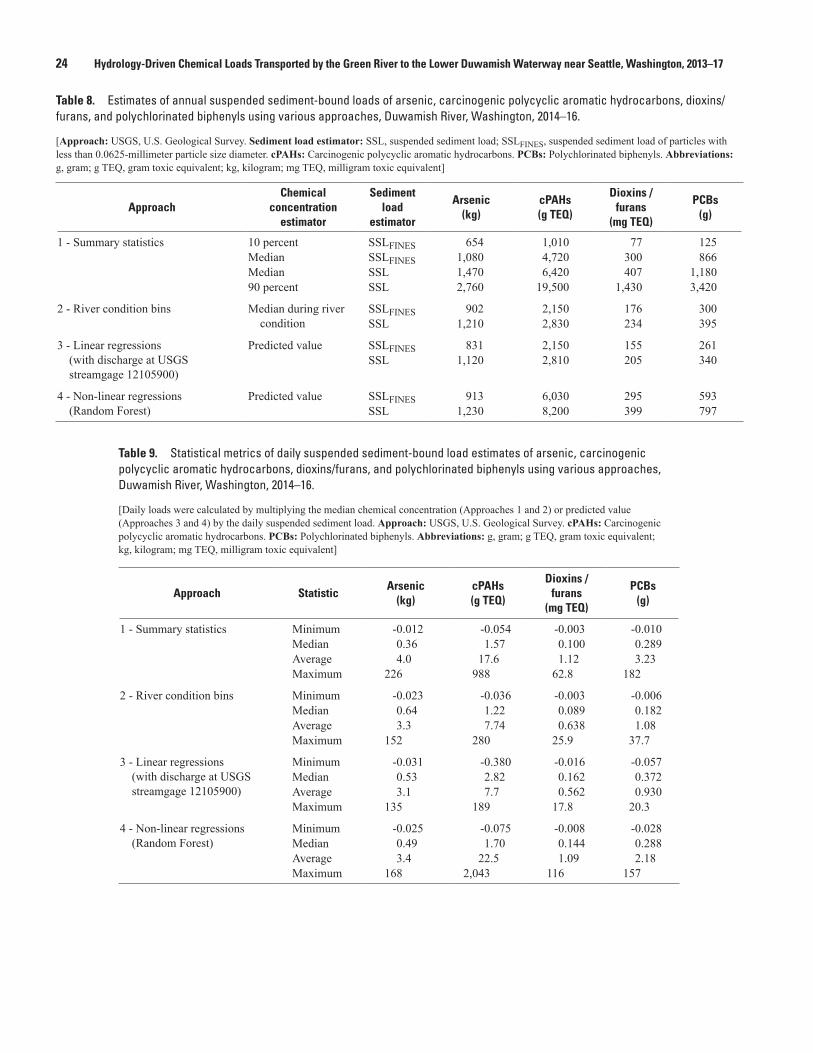
24 Hydrology-Driven Chemical Loads Transported by the Green River to the Lower Duwamish Waterway near Seattle, Washington, 2013–17
ApproachChemical
concentration estimator
Sediment load
estimator
Arsenic (kg)
cPAHs (g TEQ)
Dioxins / furans
(mg TEQ)
PCBs (g)
1 - Summary statistics 10 percent SSLFINES 654 1,010 77 125Median SSLFINES 1,080 4,720 300 866Median SSL 1,470 6,420 407 1,18090 percent SSL 2,760 19,500 1,430 3,420
2 - River condition bins Median during river condition
SSLFINES 902 2,150 176 300SSL 1,210 2,830 234 395
3 - Linear regressions (with discharge at USGS streamgage 12105900)
Predicted value SSLFINES 831 2,150 155 261SSL 1,120 2,810 205 340
4 - Non-linear regressions (Random Forest)
Predicted value SSLFINES 913 6,030 295 593SSL 1,230 8,200 399 797
Table 8. Estimates of annual suspended sediment-bound loads of arsenic, carcinogenic polycyclic aromatic hydrocarbons, dioxins/furans, and polychlorinated biphenyls using various approaches, Duwamish River, Washington, 2014–16.
[Approach: USGS, U.S. Geological Survey. Sediment load estimator: SSL, suspended sediment load; SSLFINES, suspended sediment load of particles with less than 0.0625-millimeter particle size diameter. cPAHs: Carcinogenic polycyclic aromatic hydrocarbons. PCBs: Polychlorinated biphenyls. Abbreviations: g, gram; g TEQ, gram toxic equivalent; kg, kilogram; mg TEQ, milligram toxic equivalent]
Approach StatisticArsenic
(kg)cPAHs (g TEQ)
Dioxins / furans
(mg TEQ)
PCBs (g)
1 - Summary statistics Minimum -0.012 -0.054 -0.003 -0.010Median 0.36 1.57 0.100 0.289Average 4.0 17.6 1.12 3.23Maximum 226 988 62.8 182
2 - River condition bins Minimum -0.023 -0.036 -0.003 -0.006Median 0.64 1.22 0.089 0.182Average 3.3 7.74 0.638 1.08Maximum 152 280 25.9 37.7
3 - Linear regressions (with discharge at USGS streamgage 12105900)
Minimum -0.031 -0.380 -0.016 -0.057Median 0.53 2.82 0.162 0.372Average 3.1 7.7 0.562 0.930Maximum 135 189 17.8 20.3
4 - Non-linear regressions (Random Forest)
Minimum -0.025 -0.075 -0.008 -0.028Median 0.49 1.70 0.144 0.288Average 3.4 22.5 1.09 2.18Maximum 168 2,043 116 157
Table 9. Statistical metrics of daily suspended sediment-bound load estimates of arsenic, carcinogenic polycyclic aromatic hydrocarbons, dioxins/furans, and polychlorinated biphenyls using various approaches, Duwamish River, Washington, 2014–16.
[Daily loads were calculated by multiplying the median chemical concentration (Approaches 1 and 2) or predicted value (Approaches 3 and 4) by the daily suspended sediment load. Approach: USGS, U.S. Geological Survey. cPAHs: Carcinogenic polycyclic aromatic hydrocarbons. PCBs: Polychlorinated biphenyls. Abbreviations: g, gram; g TEQ, gram toxic equivalent; kg, kilogram; mg TEQ, milligram toxic equivalent]

Chemical Load Estimates 25
tac18-1245_fig 08
Baseline71%
Storm17%
Storm+Dam4%
Dam7%
Time
cPAH Load
Baseline10%
Storm11%
Storm+Dam43%
Dam36%
Sediment Load
Baseline22%
Storm14%
Storm+Dam35%
Dam29%
Arsenic Load
Baseline15%
Storm54%
Storm+Dam23%
Dam8% Baseline
12%
Storm44%
Storm+Dam31%
Dam13%
Dioxin/Furan Load
Baseline18%
Storm52%
Storm+Dam24%
Dam6%
PCB Load
Figure 8. Percentage of the 2014–16 calendar years in which each Duwamish River condition contributed to time, sediment load, and select chemical loads for arsenic, carcinogenic polycyclic aromatic hydrocarbons (cPAHs), dioxins/furans, and polychlorinated biphenyls (PCBs) using the river condition bins approach.
Approach 2—River Condition Bins
During the 2014–16 calendar years, the daily river condition was “baseline” most of the time (71 percent), with short cumulative time of storm conditions (17 percent), dam releases (7 percent), and mixed storm-plus-dam releases (4 percent) (fig. 8). Using the river condition approach, average annual suspended sediment-bound chemical load estimates are 1,210 kg arsenic; 2,830 g TEQ cPAHs; 234 mg TEQ dioxins/furans; and 395 g PCBs (table 8). Chemical load estimates using Approach 2 were lower than median estimates using Approach 1 for arsenic, cPAHs, dioxins/furans, and PCBs.
As expected, storm events contributed a disproportionately large amount of the load of anthropogenic organic compounds such as cPAHs (54 percent), dioxins/furans (44 percent), and PCBs (52 percent) as compared to time (17 percent) (fig. 8). Chemical loads of cPAHs during storm events, with or without a coincident dam release, averaged 27.6 g TEQ/d, with a maximum of 280 g TEQ/d. In contrast to storm events, cPAH loads averaged three times lower (9.24 g TEQ/d) during dry-weather dam releases, and 17 times lower (1.6 g TEQ/d) during baseline conditions.
Chemical loads of dioxins/furans during storm events, with or without a coincident dam release, averaged 2.21 mg TEQ/d, with a maximum of 25.9 mg TEQ/d. In contrast to storm events, dioxin/furan loads averaged two times lower (1.19 mg TEQ/d) during dry-weather dam releases, and 20 times lower (0.112 mg TEQ/d) during baseline conditions. Chemical loads of PCBs during storm events, with or without a coincident dam release, averaged 3.79 g/d, with a maximum of 37.7 g/d. In contrast to storm events, PCB loads averaged four times lower (0.952 g/d) during dry-weather dam releases, and 14 times lower (0.272 g/d) during baseline conditions. Arsenic loads were distributed more evenly between the four conditions. This is partially because the highest arsenic concentrations were during baseline conditions (compared to storms for the organic chemicals) and also likely owing to source differences—arsenic occurs naturally in watershed soils and river sediments, whereas cPAHs, dioxins/furans, and PCBs have anthropogenic land and atmospheric sources. Average and maximum daily loads estimated using Approach 2 were less than those using Approach 1, except for similar average arsenic load estimates (table 9).
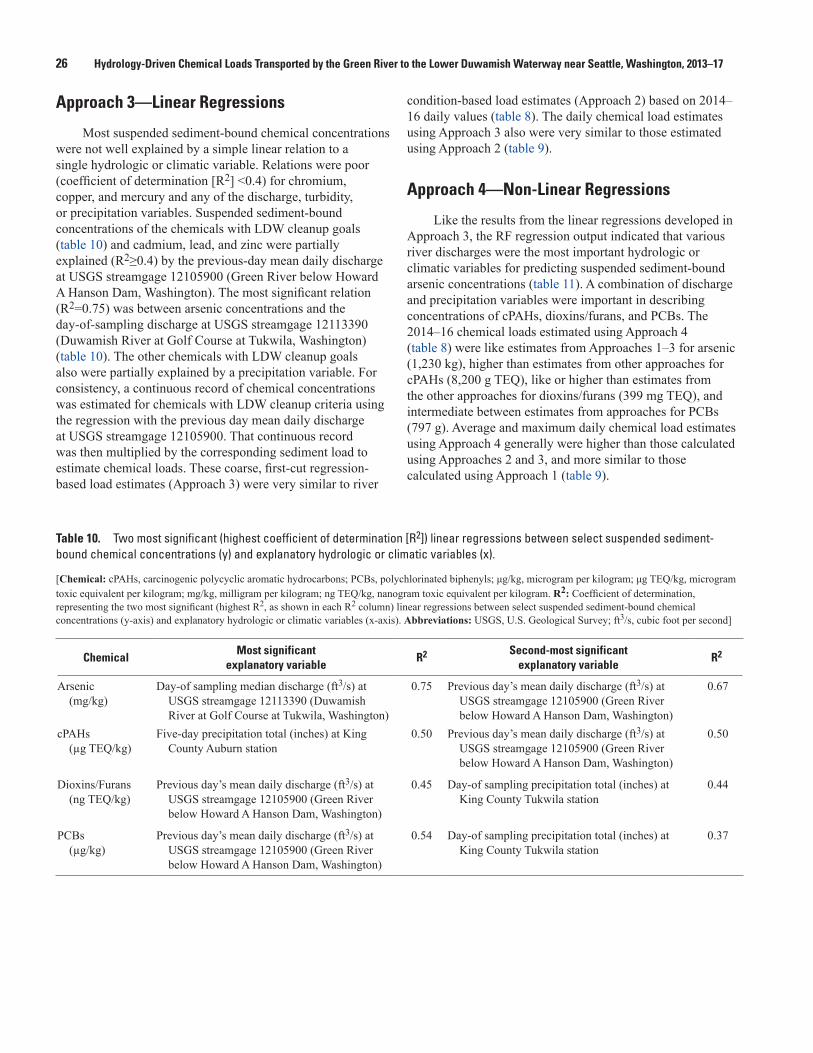
26 Hydrology-Driven Chemical Loads Transported by the Green River to the Lower Duwamish Waterway near Seattle, Washington, 2013–17
ChemicalMost significant
explanatory variableR2 Second-most significant
explanatory variableR2
Arsenic (mg/kg)
Day-of sampling median discharge (ft3/s) at USGS streamgage 12113390 (Duwamish River at Golf Course at Tukwila, Washington)
0.75 Previous day’s mean daily discharge (ft3/s) at USGS streamgage 12105900 (Green River below Howard A Hanson Dam, Washington)
0.67
cPAHs (µg TEQ/kg)
Five-day precipitation total (inches) at King County Auburn station
0.50 Previous day’s mean daily discharge (ft3/s) at USGS streamgage 12105900 (Green River below Howard A Hanson Dam, Washington)
0.50
Dioxins/Furans (ng TEQ/kg)
Previous day’s mean daily discharge (ft3/s) at USGS streamgage 12105900 (Green River below Howard A Hanson Dam, Washington)
0.45 Day-of sampling precipitation total (inches) at King County Tukwila station
0.44
PCBs (µg/kg)
Previous day’s mean daily discharge (ft3/s) at USGS streamgage 12105900 (Green River below Howard A Hanson Dam, Washington)
0.54 Day-of sampling precipitation total (inches) at King County Tukwila station
0.37
Table 10. Two most significant (highest coefficient of determination [R2]) linear regressions between select suspended sediment-bound chemical concentrations (y) and explanatory hydrologic or climatic variables (x).
[Chemical: cPAHs, carcinogenic polycyclic aromatic hydrocarbons; PCBs, polychlorinated biphenyls; μg/kg, microgram per kilogram; μg TEQ/kg, microgram toxic equivalent per kilogram; mg/kg, milligram per kilogram; ng TEQ/kg, nanogram toxic equivalent per kilogram. R2: Coefficient of determination, representing the two most significant (highest R2, as shown in each R2 column) linear regressions between select suspended sediment-bound chemical concentrations (y-axis) and explanatory hydrologic or climatic variables (x-axis). Abbreviations: USGS, U.S. Geological Survey; ft3/s, cubic foot per second]
Approach 3—Linear Regressions
Most suspended sediment-bound chemical concentrations were not well explained by a simple linear relation to a single hydrologic or climatic variable. Relations were poor (coefficient of determination [R2] <0.4) for chromium, copper, and mercury and any of the discharge, turbidity, or precipitation variables. Suspended sediment-bound concentrations of the chemicals with LDW cleanup goals (table 10) and cadmium, lead, and zinc were partially explained (R2≥0.4) by the previous-day mean daily discharge at USGS streamgage 12105900 (Green River below Howard A Hanson Dam, Washington). The most significant relation (R2=0.75) was between arsenic concentrations and the day-of-sampling discharge at USGS streamgage 12113390 (Duwamish River at Golf Course at Tukwila, Washington) (table 10). The other chemicals with LDW cleanup goals also were partially explained by a precipitation variable. For consistency, a continuous record of chemical concentrations was estimated for chemicals with LDW cleanup criteria using the regression with the previous day mean daily discharge at USGS streamgage 12105900. That continuous record was then multiplied by the corresponding sediment load to estimate chemical loads. These coarse, first-cut regression-based load estimates (Approach 3) were very similar to river
condition-based load estimates (Approach 2) based on 2014–16 daily values (table 8). The daily chemical load estimates using Approach 3 also were very similar to those estimated using Approach 2 (table 9).
Approach 4—Non-Linear Regressions
Like the results from the linear regressions developed in Approach 3, the RF regression output indicated that various river discharges were the most important hydrologic or climatic variables for predicting suspended sediment-bound arsenic concentrations (table 11). A combination of discharge and precipitation variables were important in describing concentrations of cPAHs, dioxins/furans, and PCBs. The 2014–16 chemical loads estimated using Approach 4 (table 8) were like estimates from Approaches 1–3 for arsenic (1,230 kg), higher than estimates from other approaches for cPAHs (8,200 g TEQ), like or higher than estimates from the other approaches for dioxins/furans (399 mg TEQ), and intermediate between estimates from approaches for PCBs (797 g). Average and maximum daily chemical load estimates using Approach 4 generally were higher than those calculated using Approaches 2 and 3, and more similar to those calculated using Approach 1 (table 9).

Site-Specific Polychlorinated Biphenyl Partition Coefficient 27
ChemicalPseudo
R2Explanatory variable
Most important Second-most important Third-most important
Arsenic (mg/kg)
0.73 Previous 5-day total of the mean daily discharge at USGS streamgage 12113000 (Green River near Auburn, Washington)
Previous 5-day total of the mean daily discharge at USGS streamgage 12112600 (Big Soos Creek above Hatchery near Auburn, Washington)
–
cPAHs (µg TEQ/kg)
0.58 Day-of sampling mean daily discharge (ft3/s) at USGS streamgage 12105900 (Green River below Howard A Hanson Dam, Washington)
Day-of sampling precipitation total (inches) at King County Tukwila station
Day-of sampling mean daily discharge (ft3/s) at USGS streamgage 12113349 (Mill Creek near mouth at Orillia, Washington)
Dioxins/Furans (ng TEQ/kg)
0.71 Day-of sampling precipitation total (inches) at King County Des Moines station
Day-of sampling mean daily discharge (ft3/s) at USGS streamgage 12105900 (Green River below Howard A Hanson Dam, Washington)
Day-of sampling mean daily discharge (ft3/s) at USGS streamgage 12113349 (Mill Creek near mouth at Orillia, Washington)
PCBs (µg/kg)
0.52 Day-of sampling precipitation total (inches) at King County Des Moines station
Day-of sampling precipitation total (inches) at King County Tukwila station
Previous 3-day total of the mean daily discharge at USGS streamgage 12113000 (Green River near Auburn, Washington)
Table 11. Regression output from the most significant (highest pseudo coefficient of determination [R2]) Random Forest regressions between select suspended sediment-bound chemical concentrations (y) and explanatory hydrologic or climatic variables (x).
[Chemical: cPAHs, carcinogenic polycyclic aromatic hydrocarbons; PCBs, polychlorinated biphenyls; μg/kg, microgram per kilogram; μg TEQ/kg, microgram toxic equivalent per kilogram; mg/kg, milligram per kilogram; ng TEQ/kg, nanogram toxic equivalent per kilogram. Pseudo R2: Percent variance explained for each model, representing the most significant (highest R2) Random Forest regressions between select suspended sediment-bound chemical concentrations (y-axis) and explanatory hydrologic or climatic variables (x-axis). Abbreviations and Symbol: USGS, U.S. Geological Survey; ft3/s, cubic foot per second; –, not a significant explanatory variable]
Site-Specific Polychlorinated Biphenyl Partition Coefficient
Total PCB concentrations, calculated as the sum of PCBs on suspended sediment (captured by centrifuge), on colloidal material (measured on the post-centrifuge glass-fiber filters), and in the dissolved fraction (sorbed to post-filter XAD-2 resin), ranged from 195 to 4,350 pg/L during the 12 2016–17 discrete sampling periods. The paired unfiltered-water sample theoretically should include these three phases (suspended sediment, colloidal material, and in the dissolved fraction), and concentrations should be comparable. The summed concentration was higher than the concentration in the paired unfiltered-water sample for all but one sample with similar concentrations (fig. 9). These results are similar to those for arsenic, in which the summed concentration of the filtered sample and the particulate sample was greater than the concentration from the unfiltered water sample. Again, this
may be due partly to analytical limitations of unfiltered water samples, especially at very low PCB concentrations near the reporting level. The unfiltered water concentrations were very low for eight of the sampling events—near the reporting level and similar to concentrations in the equipment blank sample (Conn and others, 2018). For example, losses of hydrophobic compounds in emulsions may lower extraction efficiency in unfiltered water samples. The difference in concentration also may be due partly to differences in field sample collection techniques. The unfiltered water sample was a depth- and width-integrated sample collected during a short period (typically 60 min or less), whereas the centrifuge sample was a time-integrated sample (typically 4–50 hours) from a point location in the thalweg near the riverbed. More studies are needed, but results from this study suggest that the summed concentration of particulate-bound chemicals captured using centrifugation in combination with dissolved analysis better represents total concentrations in water than would an unfiltered water sample.
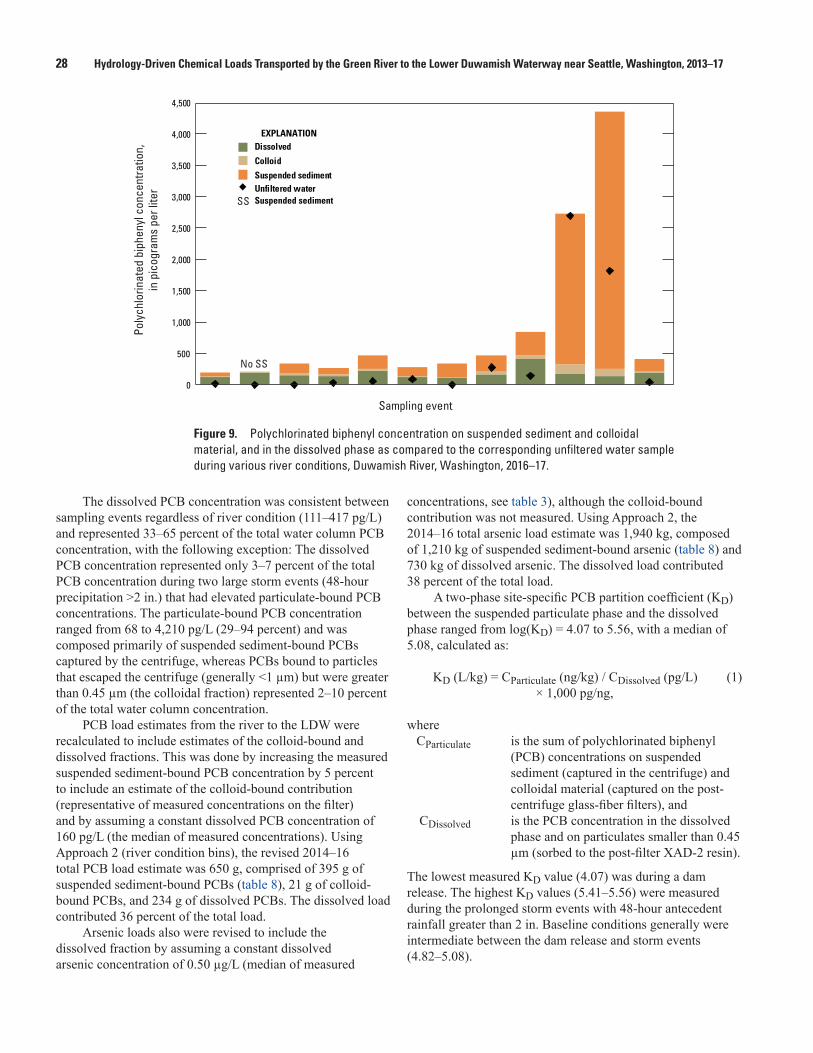
28 Hydrology-Driven Chemical Loads Transported by the Green River to the Lower Duwamish Waterway near Seattle, Washington, 2013–17
The dissolved PCB concentration was consistent between sampling events regardless of river condition (111–417 pg/L) and represented 33–65 percent of the total water column PCB concentration, with the following exception: The dissolved PCB concentration represented only 3–7 percent of the total PCB concentration during two large storm events (48-hour precipitation >2 in.) that had elevated particulate-bound PCB concentrations. The particulate-bound PCB concentration ranged from 68 to 4,210 pg/L (29–94 percent) and was composed primarily of suspended sediment-bound PCBs captured by the centrifuge, whereas PCBs bound to particles that escaped the centrifuge (generally <1 µm) but were greater than 0.45 µm (the colloidal fraction) represented 2–10 percent of the total water column concentration.
PCB load estimates from the river to the LDW were recalculated to include estimates of the colloid-bound and dissolved fractions. This was done by increasing the measured suspended sediment-bound PCB concentration by 5 percent to include an estimate of the colloid-bound contribution (representative of measured concentrations on the filter) and by assuming a constant dissolved PCB concentration of 160 pg/L (the median of measured concentrations). Using Approach 2 (river condition bins), the revised 2014–16 total PCB load estimate was 650 g, comprised of 395 g of suspended sediment-bound PCBs (table 8), 21 g of colloid-bound PCBs, and 234 g of dissolved PCBs. The dissolved load contributed 36 percent of the total load.
Arsenic loads also were revised to include the dissolved fraction by assuming a constant dissolved arsenic concentration of 0.50 µg/L (median of measured
concentrations, see table 3), although the colloid-bound contribution was not measured. Using Approach 2, the 2014–16 total arsenic load estimate was 1,940 kg, composed of 1,210 kg of suspended sediment-bound arsenic (table 8) and 730 kg of dissolved arsenic. The dissolved load contributed 38 percent of the total load.
A two-phase site-specific PCB partition coefficient (KD) between the suspended particulate phase and the dissolved phase ranged from log(KD) = 4.07 to 5.56, with a median of 5.08, calculated as:
KD (L/kg) = CParticulate (ng/kg) / CDissolved (pg/L) (1) × 1,000 pg/ng,
where CParticulate is the sum of polychlorinated biphenyl
(PCB) concentrations on suspended sediment (captured in the centrifuge) and colloidal material (captured on the post-centrifuge glass-fiber filters), and
CDissolved is the PCB concentration in the dissolved phase and on particulates smaller than 0.45 µm (sorbed to the post-filter XAD-2 resin).
The lowest measured KD value (4.07) was during a dam release. The highest KD values (5.41–5.56) were measured during the prolonged storm events with 48-hour antecedent rainfall greater than 2 in. Baseline conditions generally were intermediate between the dam release and storm events (4.82–5.08).
Figure 9. Polychlorinated biphenyl concentration on suspended sediment and colloidal material, and in the dissolved phase as compared to the corresponding unfiltered water sample during various river conditions, Duwamish River, Washington, 2016–17.
tac18-1245_fig 09
No SS
DissolvedEXPLANATION
Colloid
Suspended sedimentUnfiltered waterSuspended sediment
0
500
1,000
1,500
2,000
2,500
3,000
3,500
4,000
4,500
Poly
chlo
rinat
ed b
iphe
nyl c
once
ntra
tion,
in p
icog
ram
s pe
r lite
r
Sampling event
SS

Estuary Characteristics 29
Estuary CharacteristicsThe transport, fate, and deposition of river sediment and
associated chemicals in the Duwamish River once it enters the LDW is complicated, owing primarily to the dynamic estuary system, and is beyond the scope of this project. Continuous data from the downstream streamgage (USGS streamgage 12113415 at RKM 10.9) and the three single-day tidal studies completed within the Duwamish estuary from RKMs 8.9 to 15.0 provided information on the extent, shape, and mixing dynamics of saltwater intrusion in the Duwamish estuary under low-flow or mid-flow conditions. The presence of the salt wedge, defined as salinity greater than 1 part per thousand, was measured at RKM 10.9 on more than one-half of the days of the year—every day during summer, with less-frequent occurrence during high-flow winter events. River discharge of about 800–1,000 ft3/s was sufficiently high to restrict the salt wedge downstream of RKM 10.9 under any tidal condition, which confirms previous USGS studies (Stoner, 1967). Even during peak flows, the salt wedge is always present in the LDW at least upstream to RKM 3.0 (Stoner, 1967; Santos and Stoner, 1972). The maximum upstream extent of the salt wedge was always downstream of the upstream streamgage and chemistry sampling location (USGS streamgage 12113390 at RKM 16.7) from RKMs 12.7 to 15.0 during the summer high-tide/low-flow tidal study on August 2, 2016 (fig. 10). During the winter high tide study on January 17, 2017, the salt wedge appeared to terminate near RKM 12.7 (fig. 11).
A highly stratified salt wedge was observed during each of the tidal studies, with the denser Puget Sound saltwater intruding beneath a surface layer of less-dense fresh river water (figs. 10–12), resulting in large spatial and temporal variability in salinity and water temperatures. During winter, the river water is colder than Puget Sound water, so when the salt wedge is present, the surface temperatures are lower than the bottom temperatures. For example, during the January 2017 tidal study, the bottom seawater was about 7–8 °C and the surface freshwater was about 3–4 °C (fig 11). This pattern is reversed in the summer; river water is warmer than Puget Sound water, so that the intruding salt wedge results in surface temperatures that are higher than bottom temperatures. During the June 2017 tidal study, bottom water temperatures decreased from about 14–17 °C to as low as 11–12 °C as surface freshwater was replaced by the more dense, tidal seawater (fig. 12). These vertical gradients in water
temperature and salinity (and therefore, density), and velocity (unpub. data, Ann Vanderpool-Kimura, U.S. Geological Survey, September 8, 2017) further complicate the ability to predict when river-transported sediment and chemicals drop out of suspension and settle in various parts of the LDW in contrast to being transported through the LDW to Elliott Bay in Puget Sound. This is a subject matter area requiring additional study.
During November 2013–January 2017, water temperature at USGS streamgage 12113390 ranged from a minimum of 0.2 °C (December 8, 2013) to a maximum of 25.0 °C during the 2015 drought (July 3, 2015). During July 2015–January 2017, water temperature at USGS streamgage 12113415 ranged from a minimum 0.8 °C (January 5–6, 2017) to a maximum of 23.4 °C (July 19 and August 1, 2015). Daily water temperatures at the two Duwamish streamgages averaged within 0.5 °C of each other, except during periods of tidal influence at the lower streamgage, indicating that the tidal cycles introduce the largest variability in the river outside of high-flow events.
The river cross section at RKM 8.9, just upstream of the LDW, has distinct channels that become activated at different parts of the tidal cycle. The inundated width of the channel increased from 70 to 83 m wide over the June 22, 2017 sampling window (fig. 12). During lower stages, flow was moving through only the left part of the cross section (looking downstream), and the other parts were exposed riverbed (0.2 m) on June 22, 2017. In contrast, water column depths at this location were 6.7 m during higher high (3.7 m) on January 17, 2017. Values of pH were neutral (6.5–7.5) in both saltwater and freshwater, with no obvious saltwater-controlled differentials (U.S. Geological Survey, 2018). Dissolved oxygen concentrations were about 1–2 mg/L lower in bottom saltwater than in surface freshwater; for example, they ranged from 7 to 9 mg/L in bottom saltwater compared to 9 to 11 mg/L in surface freshwater, respectively, during the January 2017 tidal study. The lowest dissolved oxygen concentrations (6.7 mg/L) were measured in bottom saltwater during the August tidal study. Turbidity values were similar to or higher in bottom water as compared to surface water. The largest vertical differentials generally occurred between bottom saltwater and surface freshwater (as compared to a completely fresh or completely saline vertical). All turbidity values during the three tidal studies were low (<10 FNU), and varied by 3 FNU or less from surface to bottom.

30 Hydrology-Driven Chemical Loads Transported by the Green River to the Lower Duwamish Waterway near Seattle, Washington, 2013–17
tac1
8-12
45_f
ig10
Sam
plin
gtim
e pe
riod
Gage height atUSGS streamgage 12113415,
in feet above North AmericanVertical Datum of 1988
8.9
10.9
12.7
15.0
0246
8.9
10.9
12.7
15.0
1300
1400
1500
1600
1700
1800
1900
1300
1400
1500
1600
1700
1800
1900
1300
1400
1500
1600
1700
1800
1900
1300
1400
1500
1600
1700
1800
19000246
Sam
ple
time
Height above riverbed, in meters
-20246810
07-31 1200
08-01 0000
08-01 1200
08-02 0000
08-02 1200
08-03 0000
08-03 1200
08-04 0000
08-04 1200
2016
A. S
alin
ity
B. W
ater
tem
pera
ture
C
5101520
Salin
ity,
on th
e Pr
actic
al
Salin
ity S
cale
1516171819
Wat
er te
mpe
ratu
re,
in d
egre
es C
elsi
us
EXPL
AN
ATIO
N
-0.6
4 fe
etat
131
5
9.15
feet
at 1
830
Figu
re 1
0.
Verti
cal p
rofil
es o
f sal
inity
(A) a
nd w
ater
tem
pera
ture
(B),
and
sam
plin
g tim
e pe
riod
(gra
y sh
aded
are
a) (C
) dur
ing
flood
tide
at f
our m
easu
rem
ent s
ites
in th
e Du
wam
ish
estu
ary,
Was
hing
ton,
Aug
ust 2
, 201
6. R
iver
kilo
met
er o
f site
loca
tion
is s
how
n in
the
top
gray
box
. Max
imum
gag
e he
ight
at U
.S. G
eolo
gica
l Sur
vey
(USG
S)
stre
amga
ge 1
2113
415
(rive
r kilo
met
er 1
0.9)
was
9.1
5 fe
et (2
.8 m
eter
s) a
t 183
0 ho
urs
durin
g lo
w-fl
ow s
umm
er c
ondi
tions
(dis
char
ge a
t USG
S st
ream
gage
121
1300
0 w
as a
bout
35
0 cu
bic
feet
per
sec
ond)
.

Estuary Characteristics 31
tac1
8-12
45_f
ig11
10.7
1 ft
at 0
900
3.34
ft a
t 153
0
Sam
plin
gtim
e pe
riod
Gage height atUSGS streamgage 12113415,
in feet above North AmericanVertical Datum of 1988
-202468101214
01-15 1200
01-16 0000
01-16 1200
01-17 0000
01-17 1200
01-18 0000
01-18 1200
01-19 0000
01-19 1200
8.9
10.9
12.7
15.0
0246
8.9
10.9
12.7
15.0
0800
0900
1000
1100
1200
13000800
0900
1000
1100
1200
13000800
0900
1000
1100
1200
13000800
0900
1000
1100
1200
1300
0246
Sam
ple
time
Height above riverbed, in metersA
. Sal
inity
B. W
ater
tem
pera
ture
C
1020
Salin
ity,
on th
e Pr
actic
al
Salin
ity S
cale
45678
Wat
er te
mpe
ratu
re,
in d
egre
es C
elsi
us
EXPL
AN
ATIO
N
Figu
re 1
1.
Verti
cal p
rofil
es o
f sal
inity
(A) a
nd w
ater
tem
pera
ture
(B),
and
sam
plin
g tim
e pe
riod
(gra
y sh
aded
are
a) (C
) dur
ing
ebb
tide
at th
ree
mea
sure
men
t site
s in
the
Duw
amis
h es
tuar
y, W
ashi
ngto
n, J
anua
ry 1
7, 2
017.
Riv
er k
ilom
eter
of s
ite lo
catio
n is
sho
wn
in th
e to
p gr
ay b
ox. M
axim
um g
age
heig
ht a
t U.S
. Geo
logi
cal S
urve
y (U
SGS)
st
ream
gage
121
1341
5 (ri
ver k
ilom
eter
10.
9) w
as 1
0.71
feet
(3.3
met
ers)
at 0
900
hour
s du
ring
low
-flow
win
ter c
ondi
tions
(dis
char
ge a
t USG
S st
ream
gage
121
1300
0 w
as a
bout
60
0 cu
bic
feet
per
sec
ond)
.

32 Hydrology-Driven Chemical Loads Transported by the Green River to the Lower Duwamish Waterway near Seattle, Washington, 2013–17
tac1
8-12
45_f
ig12
ab
0930
1030
1130
1230
1330
1430
1530
1630
1730
1830
0246
Height above thalweg, in meters
0930
1030
1130
1230
1330
1430
1530
1630
1730
1830
lftcn
trrt
lftcn
trrt
lftcn
trrt
lftcn
trrt
lftcn
trrt
lftcn
trrt
lftcn
trrt
lftcn
trrt
lftcn
trrt
lftcn
trrt
lft cntr rt
0246
A. S
alin
ity
B. W
ater
tem
pera
ture
5101520
Salin
ity,
in th
e Pr
actic
al
Salin
ity S
cale
Left
Cent
erRi
ght
121314151617
Wat
er te
mpe
ratu
re,
in d
egre
es C
elsi
us
EXPL
AN
ATIO
N
Figu
re 1
2.
Verti
cal p
rofil
es o
f sal
inity
(A) a
nd w
ater
tem
pera
ture
(B),
and
sam
plin
g tim
e pe
riod
(gra
y sh
aded
are
a) (C
), at
thre
e eq
ual-w
idth
incr
emen
t sta
tions
(lef
t, ce
nter
, rig
ht) a
t U.S
. Geo
logi
cal S
urve
y (U
SGS)
mea
sure
men
t site
121
1342
5 (D
uwam
ish
Rive
r at 1
02nd
Stre
et B
ridge
at D
uwam
ish,
Was
hing
ton,
at r
iver
kilo
met
er 8
.9),
June
22,
201
7.
Sam
ple
times
are
sho
wn
in th
e to
p gr
ay b
oxes
in (A
) and
(B).
Min
imum
gag
e he
ight
at U
SGS
stre
amga
ge 1
2113
415
(rive
r kilo
met
er 1
0.9)
was
0.5
feet
(0.1
5 m
eter
s) a
t 121
5 ho
urs
durin
g m
id-fl
ow s
prin
g co
nditi
ons
(dis
char
ge a
t USG
S st
ream
gage
121
1300
0 w
as a
bout
1,1
00 c
ubic
feet
per
sec
ond)
.
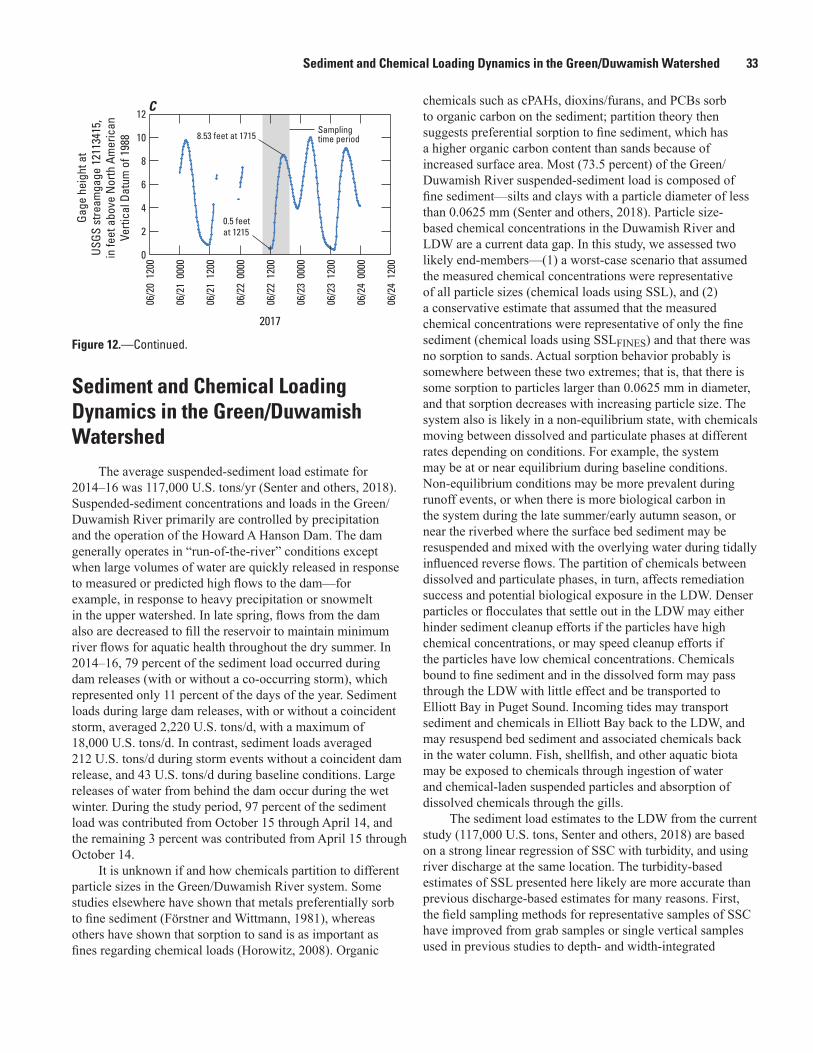
Sediment and Chemical Loading Dynamics in the Green/Duwamish Watershed 33
Sediment and Chemical Loading Dynamics in the Green/Duwamish Watershed
The average suspended-sediment load estimate for 2014–16 was 117,000 U.S. tons/yr (Senter and others, 2018). Suspended-sediment concentrations and loads in the Green/Duwamish River primarily are controlled by precipitation and the operation of the Howard A Hanson Dam. The dam generally operates in “run-of-the-river” conditions except when large volumes of water are quickly released in response to measured or predicted high flows to the dam—for example, in response to heavy precipitation or snowmelt in the upper watershed. In late spring, flows from the dam also are decreased to fill the reservoir to maintain minimum river flows for aquatic health throughout the dry summer. In 2014–16, 79 percent of the sediment load occurred during dam releases (with or without a co-occurring storm), which represented only 11 percent of the days of the year. Sediment loads during large dam releases, with or without a coincident storm, averaged 2,220 U.S. tons/d, with a maximum of 18,000 U.S. tons/d. In contrast, sediment loads averaged 212 U.S. tons/d during storm events without a coincident dam release, and 43 U.S. tons/d during baseline conditions. Large releases of water from behind the dam occur during the wet winter. During the study period, 97 percent of the sediment load was contributed from October 15 through April 14, and the remaining 3 percent was contributed from April 15 through October 14.
It is unknown if and how chemicals partition to different particle sizes in the Green/Duwamish River system. Some studies elsewhere have shown that metals preferentially sorb to fine sediment (Förstner and Wittmann, 1981), whereas others have shown that sorption to sand is as important as fines regarding chemical loads (Horowitz, 2008). Organic
chemicals such as cPAHs, dioxins/furans, and PCBs sorb to organic carbon on the sediment; partition theory then suggests preferential sorption to fine sediment, which has a higher organic carbon content than sands because of increased surface area. Most (73.5 percent) of the Green/Duwamish River suspended-sediment load is composed of fine sediment—silts and clays with a particle diameter of less than 0.0625 mm (Senter and others, 2018). Particle size-based chemical concentrations in the Duwamish River and LDW are a current data gap. In this study, we assessed two likely end-members—(1) a worst-case scenario that assumed the measured chemical concentrations were representative of all particle sizes (chemical loads using SSL), and (2) a conservative estimate that assumed that the measured chemical concentrations were representative of only the fine sediment (chemical loads using SSLFINES) and that there was no sorption to sands. Actual sorption behavior probably is somewhere between these two extremes; that is, that there is some sorption to particles larger than 0.0625 mm in diameter, and that sorption decreases with increasing particle size. The system also is likely in a non-equilibrium state, with chemicals moving between dissolved and particulate phases at different rates depending on conditions. For example, the system may be at or near equilibrium during baseline conditions. Non-equilibrium conditions may be more prevalent during runoff events, or when there is more biological carbon in the system during the late summer/early autumn season, or near the riverbed where the surface bed sediment may be resuspended and mixed with the overlying water during tidally influenced reverse flows. The partition of chemicals between dissolved and particulate phases, in turn, affects remediation success and potential biological exposure in the LDW. Denser particles or flocculates that settle out in the LDW may either hinder sediment cleanup efforts if the particles have high chemical concentrations, or may speed cleanup efforts if the particles have low chemical concentrations. Chemicals bound to fine sediment and in the dissolved form may pass through the LDW with little effect and be transported to Elliott Bay in Puget Sound. Incoming tides may transport sediment and chemicals in Elliott Bay back to the LDW, and may resuspend bed sediment and associated chemicals back in the water column. Fish, shellfish, and other aquatic biota may be exposed to chemicals through ingestion of water and chemical-laden suspended particles and absorption of dissolved chemicals through the gills.
The sediment load estimates to the LDW from the current study (117,000 U.S. tons, Senter and others, 2018) are based on a strong linear regression of SSC with turbidity, and using river discharge at the same location. The turbidity-based estimates of SSL presented here likely are more accurate than previous discharge-based estimates for many reasons. First, the field sampling methods for representative samples of SSC have improved from grab samples or single vertical samples used in previous studies to depth- and width-integrated
tac18-1245_fig 12c
Samplingtime period
Gage
hei
ght a
tUS
GS s
tream
gage
121
1341
5,in
feet
abo
ve N
orth
Am
eric
anVe
rtica
l Dat
um o
f 198
8
0
2
4
6
8
10
12
06/2
0 1
200
06/2
1 0
000
06/2
1 1
200
06/2
2 0
000
06/2
2 1
200
06/2
3 0
000
06/2
3 1
200
06/2
4 0
000
06/2
4 1
200
2017
C
8.53 feet at 1715
0.5 feet at 1215
Figure 12.—Continued.
34 Hydrology-Driven Chemical Loads Transported by the Green River to the Lower Duwamish Waterway near Seattle, Washington, 2013–17
replicate samples used in the current study. Second, turbidity is a better sediment surrogate than discharge in this system, owing to differences in sources of water and sediment in the watershed under different storm events and dam operations. This is evidenced by the wide confidence intervals in the regression between SSC and discharge (Senter and others, 2018). Third, previous sediment load estimates used discharge from USGS streamgage 12113000 (Green River near Auburn, Washington), more than 40 RKM upstream of the LDW and upstream of the tidal influence in the river. During the current study, tidally filtered discharge at the measurement site at RKM 16.7 (USGS streamgage 12113390, Duwamish River at Golf Course at Tukwila, Washington) typically was 10–15 percent higher than discharge at the Auburn streamgage because it accounted for tributary inputs between the two streamgages. Discharge at USGS streamgage 12113390 also represented the frequency and extent of upstream flow that is not accounted for at the Auburn streamgage. The sediment load estimates from this study are suspended sediment load estimates, and do not include bedload.
Metals including arsenic and organic chemicals including cPAHs, dioxins/furans, PCBs, and phthalates were detected on Green River suspended sediment across all sampled conditions (storms, dam releases, and baseline conditions), although the concentration of those contaminants varied greatly throughout time. Suspended sediment-bound chemical concentrations were relatively low much of the time. However, high concentrations were measured during short periods; for example, during summer and early autumn storms and during large (greater than 2 in.) precipitation events. The summer and early autumn storms may wash out chemicals that have been accumulating on the land surface and in the storm drain system for multiple dry summer months. Winter storms of similar magnitude generally had lower chemical concentrations, likely because of the shorter antecedent dry period.
The highest suspended sediment-bound chemical concentrations for anthropogenic chemicals (such as cPAHs, dioxins/furans, and PCBs) generally were measured during storm events. In contrast, suspended sediment-bound arsenic concentrations were highest during baseline periods, likely owing to the natural source of arsenic in weathered rock and its limited dilution during low-flow baseline periods. Similarly, storm events contributed a disproportionately large amount of the load of anthropogenic organic compounds such as cPAHs (54 percent), dioxins/furans (44 percent), and PCBs (52 percent) as compared to time (17 percent) from 2014 to 2016, whereas arsenic loads were more evenly distributed over all river conditions. For example, the average arsenic loads during dam releases was 13,600 g/d as compared to 1,030 g/d during baseline conditions. However, there were 76 cumulative dam releases days as compared to 783 cumulative baseline days, resulting in similar arsenic loads during the study period (28 percent of the total arsenic load contributed during dam releases and 22 percent contributed during baseline conditions).
The four approaches used in this study provide relatively well-constrained estimates of annual chemical loads from the Green/Duwamish River to the LDW. For a given suspended-sediment load estimator and using the median chemical concentration estimator for the summary statistics approach, the four estimates of annual arsenic loads were within 30 percent of each other, ranging from 1,120 to 1,470 kg. The estimate ranges were wider for the organic chemicals than for arsenic—as much as three times wider using the median predictors for each approach (2,810–8,200 g TEQ cPAHs, 205–407 mg TEQ dioxins/furans, and 340–1,180 g PCBs). The first (summary statistics) and third (linear regressions) approaches were coarse, exploratory efforts. The second approach (river condition bins) was developed to describe observed differences in the river condition regarding flow, sediment, and chemicals during the study period. The fourth approach (non-linear regressions) provides the most quantitative and robust estimates, although it is constrained by the availability of continuous data—for example, at a daily time step, of watershed explanatory variables.
Although the annual chemical load estimates were well constrained, these averaged values may be of limited utility in a dynamic river system such as the Green/Duwamish River. It may be more important to ecological and human health to characterize the timing and contribution of daily or short-term (several-hour-long) spikes in concentration, typically associated with lowland storm events and overland runoff, because they may have an outsized (acute) effect on ecological health. Those spikes are averaged out in the multi-day composite samples primarily used here, and so likely underestimate the highest concentrations that may occur over short time periods. Increasing the temporal resolution of SSC chemistry would improve our ability to characterize these short-term spikes and would provide information regarding how long it takes for this dynamic system to return to baseline conditions.
SummaryThe U.S. Geological Survey collected new data from
2013 to 2017, including three complete calendar years (2014–2016) to estimate sediment and chemical loads transported by the Green River to the Lower Duwamish Waterway Superfund site in Seattle, Washington. Chemical loads were calculated as the product of river suspended-sediment loads and suspended sediment-bound chemical concentrations measured at U.S. Geological Survey streamgage 12113390 (Duwamish River at Golf Course at Tukwila, Washington, located at river kilometer 16.7). The site was close to the upstream boundary of the Superfund site and incorporated most watershed inputs. However, it was upstream of the maximum extent of the tidal saltwater reach, which was measured as far upstream as river kilometer 12.7 during summer high tide/low flow conditions. Therefore, the load estimates primarily represent

Acknowledgments 35
watershed-derived sources of sediment-bound chemicals and are minimally affected by Superfund-derived sediment and chemicals that may be resuspended and transported upstream during high tides.
We identified four general river conditions during the current study: (1) low-flow baseline conditions (71 percent of the time), (2) storm events (17 percent of the time), (3) periods of high streamflow and sediment concentrations owing to large releases from the Howard A Hanson Dam in the upper watershed (7 percent of the time), and (4) periods when both storm events and large dam releases were occurring (4 percent of the time). The average suspended-sediment load estimate for 2014–16 was 117,000 U.S. tons/yr. Most of the suspended-sediment load (73.5 percent) was fine sediment with a particle size diameter of less than 0.0625 millimeter. Large dam releases, either with or without a coincident storm event, occurred infrequently—on 30–50 days per year during the study period, or an average of 11 percent of the time—but accounted for a disproportionately large amount of the annual sediment load (79 percent).
A suite of chemicals with site-specific cleanup goals (including arsenic, carcinogenic polycyclic aromatic hydrocarbons [cPAHs], dioxins/furans, and polychlorinated biphenyls [PCBs]) were detected on river suspended sediment at river kilometer 16.7 during all river conditions. Suspended sediment-bound chemical concentrations generally were low, but high concentrations did occur, especially during short intense summer storms, “first flush” autumn runoff events, and prolonged precipitation events (greater than 2 inches of rainfall within 48 hours). Concentrations ranged from 6.6 to 28 milligrams per kilogram (mg/kg; mean = 16 mg/kg) for arsenic, from 3.7 to 454 micrograms toxic equivalent (µg TEQ)/kg (mean = 100 µg TEQ/kg) for cPAHs, from 0.526 to 20.6 nanograms (ng) TEQ/kg (mean = 6.04 ng TEQ/kg) for dioxins/furans, and from 0.448 to 83.9 µg/kg (mean = 14.5 µg/ kg) for PCBs.
Median suspended sediment-bound concentrations were 2.5–3 times higher during storm events than baseline conditions, and 10–27 times higher during storm events than during dam releases for anthropogenic chemicals including cPAHs, dioxins/furans, and PCBs. One plausible explanation is that dam releases mobilize relatively clean sediment impounded behind the dam from the upper forested watershed and scour and resuspend riverbed sediment, whereas storm events move sediment and associated contaminants from the more urban and industrial lower watershed into the river through the stormwater conveyance system. In contrast, median suspended sediment-bound arsenic concentrations were 2–3 times higher during baseline conditions as compared to storm events, dam releases, and storm-plus-dam releases, which may be owing to a lack of dilution of naturally occurring arsenic concentrations during low-flow baseline conditions.
Using the 2014–16 dataset and four different approaches, annual suspended sediment-bound chemical load estimates transported by the river to the Lower Duwamish Waterway
were in the range of 1,120–1,470 kg arsenic; 2,810–8,200 g TEQ cPAHs; 205–407 mg TEQ dioxins/furans; and 340–1,180 g PCBs. As expected, storm events contributed a disproportionately large amount of the load of anthropogenic organic compounds such as cPAHs (54 percent), dioxins/ furans (44 percent), and PCBs (52 percent) as compared to overall time (17 percent). Maximum estimated daily loads during storm events were 280 g TEQ cPAHs, 25.9 mg TEQ dioxins/furans, and 37.7 g PCBs. The highest daily arsenic loads (152 kg) occurred during mixed storm-plus-dam release conditions, likely because arsenic occurs naturally in watershed soils and river sediments.
Chemical concentrations and load estimates often were underestimated using results from unfiltered water analysis only, especially for hydrophobic organic chemicals such as polycyclic aromatic hydrocarbons, which prefer to sorb to particulates and are at low concentrations near or below the analytical limits of water methods. The sum of the chemical concentrations measured on two separate fractions—the particulate fraction and the dissolved fraction—may more fully represent the total chemical concentration in an unfiltered water sample as compared to analysis of an unfiltered water sample, especially in samples with high suspended-sediment concentrations. The dissolved fraction was estimated to contribute an additional 36 and 38 percent of the chemical load in the river system above the suspended sediment-bound load for arsenic and PCBs, respectively, even given the hydrophobic nature of the chemicals.
Most of the suspended sediment load (97 percent) and sediment-bound chemical load (92–94 percent) occurred during the wet winter half of the year from October 15 to April 15. However, the highest sediment-bound chemical concentrations often occurred during short intense storms or “first flush” autumn runoff events during the dry summer half of the year from April 15 to October 14. Because of the highly variable and dynamic river system characteristics (including precipitation, discharge, sediment concentration, and tidal fluctuations), it is critical to characterize the occurrence, frequency, concentrations, and loads during extreme conditions (for example, when the river is affected by storm-derived runoff), rather than time-averaged conditions. These short extreme events have higher potential for acute effects on ecological and human health, and may have greater influence on the effectiveness of the sediment remediation activities that are underway in the Lower Duwamish Waterway.
Acknowledgments We are grateful to Curt Chandler and staff at the Foster
Golf Course in Tukwila, Washington, for access and use of the bridge and facilities throughout the project. We are thankful to the U.S. Geological Survey peer-reviewers for their insightful comments, which greatly improved the quality of the report.

36 Hydrology-Driven Chemical Loads Transported by the Green River to the Lower Duwamish Waterway near Seattle, Washington, 2013–17
References Cited
AECOM, 2012, Final feasibility study—Lower Duwamish Waterway, Seattle, Washington: Seattle, AECOM, accessed March 6, 2018, at http://www.ldwg.org/rifs_docs9.htm#final2012.
California Environmental Protection Agency, 2005, Air toxics hot spots program risk assessment guidelines, Part II—Technical support document for describing available cancer potency factors: Sacramento, California Environmental Protection Agency, Office of Environmental Health Hazard Assessment, 587 p.
Conn, K.E., and Black, R.W., 2014, Data compilation for assessing sediment and toxic chemical loads from the Green River to the lower Duwamish Waterway, Washington: U.S. Geological Survey Data Series 880, 46 p., accessed September 26, 2017, at https://dx.doi.org/10.3133/ds880.
Conn, K.E., Black, R.W., Peterson, N.T., Senter, C.A., and Chapman, E.A., 2018, Chemical concentrations in water and suspended sediment, Green River to Lower Duwamish Waterway near Seattle, Washington, 2016–17: U.S. Geological Survey Data Series 1073, 17 p., https://doi.org/10.3133/ds1073, accessed January 9, 2018, at https://pubs.er.usgs.gov/publication/ds1073.
Conn, K.E., Black, R.W., Vanderpool-Kimura, A.M., Foreman, J.R., Peterson, N.T., Senter, C.A., and Sissel, S.K., 2015, Chemical concentrations and instantaneous loads, Green River to the Lower Duwamish Waterway near Seattle, Washington, 2013–15: U.S. Geological Survey Data Series 973, 46 p., accessed September, 26, 2017, at http://dx.doi.org/10.3133/ds973.
Conn, K.E., Dinicola, R.S., Black, R.W., Cox, S.E., Sheibley, R.W., Foreman, J.R., Senter, C.A., and Peterson, N.T., 2016, Continuous-flow centrifugation to collect suspended sediment for chemical analysis: U.S. Geological Survey Techniques and Methods, book 1, chap. D6, 31 p. plus appendixes, accessed September 26, 2017, at https://doi.org/10.3133/tm1D6.
Cutler, D.R., Edwards, T.C., Jr., Beard, K.H., Cutler, A., Hess, K.T., Gibson, J., and Lawler, J.J., 2007, Random forests for classification in ecology: Ecology, v. 88, no. 11, p. 2783–2792, https://doi.org/10.1890/07-0539.1.
Embrey, S.S., and Frans, L.M., 2003, Surface-water quality of the Skokomish, Nooksack, and Green-Duwamish Rivers and Thornton Creek, Puget Sound Basin, Washington, 1996–98: U.S. Geological Survey Water-Resources Investigations Report 02-4190, 199 p, accessed September 25, 2017, at https://pubs.er.usgs.gov/publication/wri024190.
Förstner, U., and Wittmann, G., 1981, Metal pollution in the aquatic environment (2d revised ed.): New York, Springer-Verlag, 486 p., https://doi.org/10.1007/978-3-642-69385-4.
Gries, T., and Sloan, J., 2009, Contaminant loading to the Lower Duwamish Waterway from suspended sediment in the Green River: Washington State Department of Ecology Publication No. 09-03-028, 118 p.
Guy, H.P., 1969, Laboratory theory and methods for sediment analysis: U.S. Geological Survey Techniques of Water-Resources Investigations, book 5, chap. C1, accessed August 30, 2018, at https://pubs.usgs.gov/twri/twri5c1/.
Helsel, D.R., and Hirsch, R.M., 2002, Statistical methods in water resources: U.S. Geological Survey Techniques of Water-Resources Investigations, book 4, chap. A3, 522 p., accessed March 6, 2018, at https://pubs.usgs.gov/twri/twri4a3/.
Homer, C.G., Dewitz, J.A., Yang, L., Jin, S., Danielson, P., Xian, G., Coulston, J., Herold, N.D., Wickham, J.D., and Megown, K., 2015, Completion of the 2011 National Land Cover Database for the conterminous United States—Representing a decade of land cover change information: Photogrammetric Engineering and Remote Sensing, v. 81, no. 5, p. 345–354.
Horowitz, A.J., 2008, Determining annual suspended sediment and sediment-associated trace element and nutrient fluxes: Science of the Total Environment, v. 400, nos. 1–3, p. 315–343, https://doi.org/10.1016/j.scitotenv.2008.04.022.
Hydrology and Hydraulics Committee, 1969, River mile index—Deschutes River, Nisqually River, Puyallup River, Green River, Lake Washington, Snohomish Rivers, Washington: Vancouver, Washington, Pacific Northwest River Basins Commission, Hydrology and Hydraulics Committee, 53 p.
King County, 2016, Lower Duwamish Waterway source control—Green River watershed suspended solids data report: Prepared by Carly Greyell and Debra Williston, King County Water and Land Resources Division, Seattle, Washington, 120 p.
Levesque, V.A., and Oberg, K.A., 2012, Computing discharge using the index velocity method: U.S. Geological Survey Techniques and Methods, book 3, chap. A23, 148 p., accessed September 26, 2017, at https://pubs.usgs.gov/tm/3a23/.
Liaw, A., and Wiener, M., 2002, Classification and regression by random forest: R News, v. 2/3, p. 18–22.

References Cited 37
Lower Duwamish Waterway Group, 2008, Lower Duwamish Waterway sediment transport modeling report: Montvale, New Jersey, Quantitative Environmental Analysis, LLC, prepared for U.S. Environmental Protection Agency and Washington State Department of Ecology, accessed September 26, 2017, at http://www.ldwg.org/rifs_docs4.htm#stm.
Prasad, A.M., Iverson, L.R., and Liaw, A., 2006, Newer classification and regression tree techniques—Bagging and random forests for ecological prediction: Ecosystems, v. 9, p. 181–199.
Puget Sound Estuary Program, 1986, Recommended protocols for measuring conventional sediment variables in Puget Sound: Bellevue, Washington, Tetra Tech, Inc., prepared for U.S. Environmental Protection Agency and Puget Sound Water Quality Authority, 44 p.
R Development Core Team, 2006, R—A language and environment for statistical computing: Vienna, Austria, R Foundation for Statistical Computing, ISBN 3-900051-07-0, accessed August 30, 2018, at http://www.R-project.org.
Santos, J.F., and Stoner, J.D., 1972, Physical, chemical, and biological aspects of the Duwamish River Estuary, King County, Washington, 1963–67: U.S. Geological Survey Water-Supply Paper 1873-C, 74 p.
Senter, C.A., Conn, K.E., Black, R.W., Peterson, N., Vanderpool-Kimura, A., and Foreman, J.R., 2018, Suspended-sediment transport from the Green-Duwamish River to the Lower Duwamish Waterway, Seattle, Washington, 2013–17: U.S. Geological Survey Open-File Report 2018–1029, 23 p., accessed August 29, 2018, at https://doi.org/10.3133/ofr20181029.
Stoner, J.D., 1967, Prediction of salt-water intrusion in the Duwamish River estuary, King County, Washington, in Geological Survey research—1967: U.S. Geological Survey Professional Paper 575-D, p. D253–D255.
U.S. Environmental Protection Agency, 2014, Record of decision—Lower Duwamish Waterway Superfund site: U.S. Environmental Protection Agency, accessed August 30, 2018, at https://semspub.epa.gov/work/10/715975.pdf.
U.S. Environmental Protection Agency, 2017, Wastes—Hazardous waste—Test methods—The SW-846 compendium: U.S. Environmental Protection Agency web page, accessed September 26, 2017, at https://www.epa.gov/hw-sw846/sw-846-compendium.
U.S. Geological Survey, 2018, National Water Information System: U.S. Geological Survey web page, accessed March 12, 2018, at https://doi.org/10.5066/F7P55KJN.
Van den Berg and others, 2006, The 2005 World Health Organization re-evaluation of human and mammalian toxic equivalency factors for dioxins and dioxin-like compounds: Toxicological Sciences, v. 93, no. 2, p. 223–241.
Washington State Department of Ecology, 2013, Sediment management standards, Chapter 173-204 WAC: Washington State Department of Ecology Publication No. 13-09-055, 151 p.


Publishing support provided by the U.S. Geological SurveyScience Publishing Network, Tacoma Publishing Service Center
For more information concerning the research in this report, contact the Director, Washington Water Science Center U.S. Geological Survey 934 Broadway, Suite 300 Tacoma, Washington 98402 https://wa.water.usgs.gov

2 Report TitleConn and others—
Chemical Loads Transported to Low
er Duw
amish W
aterway near Seattle, W
ashington, 2013–17—Scientific Investigations Report 2018–5133
ISSN 2328-0328 (online)https://doi.org/10.3133/sir20185133