hydrological impacts of converting tropical montane cloud
TRANSCRIPT
Final Technical Report DFID-FRP Project no. R7991 Hydrological impacts of converting tropical montane cloud forest to pasture,
with initial reference to northern Costa Rica.
Compiled by: L.A. Bruijnzeel (project leader)
Based on the work of: Reto Burkard, Alexander Carvajal, Arnoud Frumau, Lars Köhler, Mark Mulligan, Jaap Schellekens, Simone Schmid,
and Conrado Tobón
With the assistance of: Sophia Burke, Julio Calvo, Jorge Fallas, Gemma Duno-Denti, Robert Figueras, Lieselotte Tolk, and Michiel Zijp
31 January 2006

R7991_Final Technical Project_31 January 2006 Page 2 of 51
Executive summary Declining dry season flows in Central America constitute a problem for rural and urban water supplies and may in due course hamper agricultural production and hydropower generation. This project aimed to quantify the impact of cloud forest conversion to pasture on streamflow in northern Costa Rica using hydrological process research and modelling. A measuring protocol has been developed as well as a simplified, yet physically-based and spatially distributed model (FIESTA_CQflow) to predict the impact of (cloud) forest conversion on streamflow at the operational scale (<1,000 km2). A similar but more data-lean model designed to better understand the impacts of land-cover or climatic change on water budgets at the national and international scale (FIESTA_fog_delivery) has also been developed and applied to Costa Rica and to all of Central America and Mexico. The models are needed for developing realistic payment for environmental services schemes. Sustainable livelihood aspects in the study area are addressed by a specifically designed twin project (R 8174). Two micro-catchments under undisturbed cloud forest and mature pasture were instrumented heavily to quantify the fate of rainfall and fog water inputs for the two land covers. Mathematical descriptions of the relevant hydrological processes (notably rainfall and fog interception, evaporation and drainage) under forested and cleared conditions were derived from the measurements for use in the hydrological models. The changes in water budget resulting from the conversion of (cloud) forest were predicted at the operational and (inter)national scale using the above-mentioned models. Chief policy-relevant research results: conventionally measured rainfall inputs are seriously underestimated under the prevailing climatic and topographic conditions. By combining information on the angle of incidence of the precipitation with topographic aspect and inclination much more realistic estimates were obtained of catchment-wide precipitation inputs. Water inputs via fog were modest in most cases except at spatially limited ‘hot spots’. Conversion of cloud forest to pasture leads to roughly doubled stormflows at the local scale due to soil compaction by cattle but at the operational scale no significant increase was observed. Any local effects of increased runoff response to rainfall in some parts of the catchment are ‘diluted’ by flow contributions from other, less affected or rainless parts. The predicted effect of cloud forest conversion to pasture on annual water yields at the operational and national scale was very limited. Neither were effects on dry season flows pronounced although progressive soil degradation over time might change this. These near-neutral results are due to the fact that reductions in the amounts of fog and horizontal precipitation trapped by the vegetation after forest conversion are compensated by similar or larger reductions in vegetation water use. Forest conversion in the lowlands leads to larger increases in total water yield. Simulations of the hydrological consequences of the most likely projected climate change for Costa Rica suggest climatic drying and warming to have a greater impact on the water balance than (even large-scale) changes in land cover. Thus, conserving forests has rather small impacts on water budgets in the mountains but reduces total water yield in the lowlands. The value of forests must be expressed in terms of their benefits for water quality, (long-term) regulation of flows, suppression of erosion and (shallow) landsliding, conservation of biological and genetic diversity, carbon sequestration potential, and aesthetic and eco-touristic values rather than water yields. Implications for policy and socio-economic development: the FIESTA_CQflow and nation-wide ‘fog delivery’ models proved to be important new tools allowing better estimates of total precipitation inputs to remote headwater areas, identification of hydrological ‘hot’ and ‘cold’ spots in the landscape, and the evaluation of hydrological impacts of (cloud) forest conversion to pasture or climate change at operational and policy-making scales. The models enable the application of economic models by environmental economists to predict the socio-economic consequences of specific land-cover interventions.
R7991_Final Technical Project_31 January 2006 Page 3 of 51
Background1 Although it is well-established that the clearing of tropical rain forest for the establishment of pasture or annual cropping leads to increases in annual water yield, it remains to be seen whether this also applies to the conversion of montane cloud forests subject to intense fog. For example, the partial removal of (coniferous) forest in a fog-ridden area in the Pacific North-West of the USA produced a (slight) decline in water yield during the summer months instead of the expected (large) increase. The effect disappeared again after 5-6 years. These changes in streamflow amounts were attributed to the temporary loss upon timber harvesting of fog water ‘stripped’ from the passing clouds by the original tall vegetation, and to a gradual recovery of the process during the subsequent regeneration phase, respectively. No hard evidence is available in this respect for tropical conditions but the example does illustrate the possibility of reduced flows after cloud forest conversion. As for seasonal streamflow patterns, in many places the conversion of tropical forest has led to more or less serious disruption of the streamflow regime, thereby affecting water availability to, especially, the rural poor. The widely observed deterioration in the capacity of the soil to accommodate intense rainfall after prolonged cropping without proper soil conservation or after forest conversion to heavily grazed pasture, causes more rainfall to run off directly along the surface, thereby increasing peak flows and stream sediment loads. In more serious cases of land degradation, the associated decrease in soil- and groundwater replenishment during the rainy season shows up as diminished streamflow during the subsequent dry season. Fears have been expressed that, in addition to the above scenario of gradually deteriorating soil infiltration capacity, conversion of montane cloud forests will also lead to the loss of the additional cloud water captured by the original (tall) vegetation. Generally speaking, the risk of reductions in dry season flows after forest conversion may well be greatest in the case of tropical montane cloud forests, whereas even a reduction in annual water yield cannot be excluded. Sound experimental evidence is lacking, however. There is circumstantial evidence from Guatemala, Honduras and Costa Rica that dry season flows may be diminishing in areas where cloud forest has been converted to agricultural uses, although the underlying reasons are by no means clear. Briefly, the flow data for forested and cleared catchments in Guatemala and Honduras pertain to areas that differed in size and elevation, and thus in the volume of their groundwater storage and exposure to fog and rain. Similarly, flow data presented for a river basin in north-western Costa Rica seem to primarily reflect a larger-scale climatic trend, with year-to-year fluctuations being governed by anomalies in sea surface temperatures in the adjacent Pacific Ocean. For the Andes of Venezuela, there have been claims of higher water consumption by pastures planted with Kikuyu grass compared to the original cloud forest. However, the extrapolated annual water use of the grass far exceeded the amount of net radiant energy that is likely to be available at such elevations, rendering the estimate at least suspect. Finally, there is (more convincing) evidence that cumulus cloud formation above the largely deforested Atlantic coastal plain in north-eastern Costa Rica is less pronounced than that above more forested areas in nearby eastern Nicaragua. Furthermore, application of a meso-scale meteorological circulation model suggested that cloud formation above the adjacent uplands would also become less dense and less persistent in the case of a complete conversion of the coastal lowland forest to grassland. Interestingly, this would go some way towards explaining the observed (and much publicised) gradual disappearance of anoline lizard and toad populations in (leeward) cloud forest in the area. It should be noted, however, that in the absence of actual measurements of site energy budgets, the above predictions of reduced cloud intensity over the mountains of northern Costa Rica had to be based on standard parameterisations for lowland forest and pasture in the model. In addition, estimated and arguably less than plausible values for the contrast in average dry season soil water contents below forest and pasture were used. Summarising, although there is as yet no hard published evidence to suggest that dry season flows in Central America are indeed declining as a result of (cloud) forest conversion, it would be wise to heed the writings on the wall. 1 References to scientific literature have been omitted from the text to increase readability; key references are listed at the end of this report.

R7991_Final Technical Project_31 January 2006 Page 4 of 51
Indeed, in view of the large economic interests at stake – such as potential reductions in rural and urban water supplies and ensuing problems for irrigation and hydropower generation – there is an urgent need for research that addresses this problem. Oral and written discussions with some of Costa Rica’s leading hydrologists prior to the formulation of the project confirmed this need, also with regard to the fact that Costa Rica’s pioneering Payments for Environmental Services scheme is based, inter alia, on the assumption that dry season flows are more stable for streams draining areas with (cloud) forest. Such schemes are widely considered to be a promising tool for the promotion of forest conservation, although they are as yet rarely based on sound hydrological information. A multi-national and multi-disciplinary research team led by the Vrije Universiteit Amsterdam and hosted by the Instituto Tecnologico de Costa Rica was formed in late 2001 to unravel the hydrological complexities of the perhumid, windswept and fog-ridden volcanic steeplands comprising the partly deforested Sierra de Tilarán in northern Costa Rica. Field measurements were carried out between June-July 2002 and July-August 2004. This report provides a summary of the project’s activities, its main findings and approaches followed in disseminating these results to policy makers. Project purpose The project’s direct purpose was the quantification of the much debated changes in streamflow totals and regime that are to be expected after converting montane cloud forest to pasture, initially under the climatic conditions prevailing in northern Costa Rica and at the micro- to meso-catchment scale (< 100 km2). By adopting a process-based (physical) approach, the chief factors governing pre- and post-clearing vegetation water use and streamflow could be evaluated in a spatially explicit manner. This allowed for the separation of climatic (e.g. variability in rainfall or cloud cover) and land cover influences on streamflow whereas, in addition, judicious up-scaling of plot-scale measurements becomes possible to the scale at which operational hydrology is normally executed in the area. The process-based model developed by the project may be used elsewhere (both within and outside Central America) to help predict the hydrological impacts of tropical (cloud) forest conversion. Again, such predictions should provide a more realistic base for the design of new payment schemes for environmental services in which downstream beneficiaries compensate upland farmers / forest managers for sustainable land and forest stewardship, thereby contributing to improved forest conservation and management. The current lack of insight into the precise causes of the allegedly declining streamflows in some parts of Central America hampers appropriate action to be taken (e.g. the decision whether and where to reforest or not), thereby increasing the possibility that the problem becomes exacerbated with time. Once the hydrological effects of forest conversion in the region are properly known, the corresponding economic implications (e.g. through increased/decreased hydro-power or irrigation-based agricultural production) can be evaluated. The latter is one of the main objectives of the project’s twin project on sustainable livelihoods (DFID-FRP project R 8174). A second objective of the project was to help increase the general awareness of the hydrological (as well as biodiversity) values of montane cloud forests through the production and distribution of a lavishly illustrated booklet (‘Decision Time for Cloud Forests’, in Spanish) for non-specialists, plus a documentary on DVD (‘Mountains in the Mist’). Last, but not least, the project aimed to train key personnel from the counterpart organizations in Costa Rica, and other interested parties from Costa Rica and elsewhere in Latin America, in the use of the field measurement and modeling approaches adopted by the project. Research activities Background methodological considerations: the classic approach to the evaluation of the effect of land cover change on amounts of streamflow is the so-called ‘paired catchment technique’ (PCT), in which the flow from a forested ‘control’ catchment is compared with the flow from a ‘treated’ catchment after initial calibration of the two catchments under undisturbed conditions. The rationale for this is that a ‘direct’ comparison of streamflow totals from forested and cleared catchments may give biased results because of potential differences in subterranean (and therefore ungauged) water

R7991_Final Technical Project_31 January 2006 Page 5 of 51
transfers into or out of the catchments (leakage). However, it is next to impossible nowadays to obtain permission for the catchment-wide experimental felling of old-growth tropical forest, and even more so in a country like Costa Rica where forest conservation is high on the agenda. In addition, the PCT is time consuming as it requires a sufficiently long initial calibration period (typically >3 years to account for inter-annual climate variability) and a treatment period long enough for the new vegetation to become established and mature (2-50 years, depending on vegetation type). Last but not least, the PCT is essentially a black-box approach which needs to be supplemented with detailed process studies if the relative importance of the different factors responsible for the observed changes in streamflow total or regime is to be assessed. Without such process knowledge, results cannot easily be applied outside of the test catchments, where climatic or land conditions may be somewhat different. A process-based, bottom-up approach was adopted in which the successive hydrological processes that together determine amounts of streamflow (rainfall, fog water interception, wet canopy evaporation, infiltration, soil water uptake, vertical and lateral drainage) were quantified separately. By describing the various hydrological processes mathematically and defining the respective feedback mechanisms in a quantitative manner (e.g. reductions in soil water uptake as atmospheric or soil water deficits increase) it becomes possible to predict the behaviour of the vegetation under different climatic conditions. By also selecting catchment areas with year-round flow and streams that have incised into solid bedrock, and measuring groundwater levels and subsoil hydraulic conductivities, one should be able to minimize the risk of obtaining biased streamflow results, also because independent estimates of vegetation water use can be made (e.g. using micro-meteorological or plant physiological techniques). In other words, once all measurable components of the catchment water budget (i.e. all gains and losses) are quantified, the deep leakage term L can be evaluated by solving the water budget equation for L. Thus, after correcting for contrasts in deep leakage losses between catchments, the flows from forested and cleared catchments can be compared more reliably than would be possible through a ‘direct’ comparison. Also, accurate quantification of inputs and outputs becomes more difficult as the scale of the study increases since many of these are highly spatially variable and not readily interpolated from a few point measurements. Another important complication rendering the application of the catchment water budget approach less than straightforward under the climatic conditions prevailing in the study area, should be mentioned here. The combination of strong winds and low rainfall intensities during, especially, the autumn months tends to produce substantial amounts of ‘horizontal precipitation’ in the form of wind-driven rain that, like fog, largely bypasses traditional rain gauges (hence the sometimes used alternative term ‘occult’ precipitation). Indeed, the very high runoff to rainfall ratios obtained for various catchments in the study area in the past may well reflect such unmeasured wind-driven rainfall inputs instead of high fog water inputs, as is commonly assumed. In addition, such wind-affected precipitation inputs can be expected to vary enormously in space due to variations in site exposure to the prevailing winds, the presence or absence of intercepting obstacles (e.g. tall trees vs. short grass) and slope steepness. Thus, the success or failure of the adopted water budget approach hinges on the proper quantification of spatial patterns of rainfall and fog water inputs, and much attention has to be paid to develop methods to measure and predict these adequately. Measurement sites: an intensive field measurement campaign was conducted between August-September 2002 and August 2004 to obtain quantitative insight into the hydrological functioning of plots or small catchment areas under the chief vegetation types of the study area, viz.: (i) old-growth, tall windward cloud forest, (ii) 30-year-old pasture with scattered remnant trees, (iii) isolated 15-20 year-old secondary woodland blocks surrounded by pasture, and (iv) stunted, wind-swept ridge-top elfin cloud forest. All sites were located within the headwaters of the Caño Negro and Río Chiquito catchments that drain towards the Atlantic side of Costa Rica (see Figure 1 for locations). In addition,
R7991_Final Technical Project_31 January 2006 Page 6 of 51
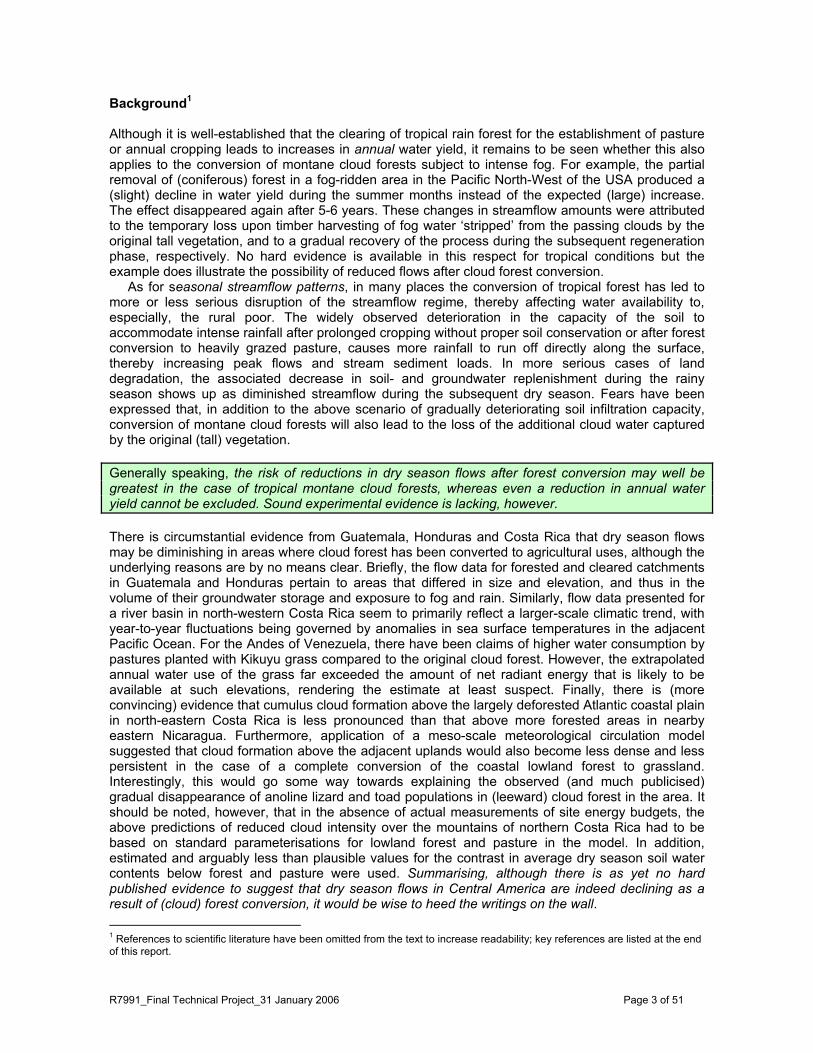
the climate and streamflow for the entire 91.4 km2 Río Chiquito catchment, which had 63% of its original forest cover converted to pasture by 1992 but has maintained its headwater area largely under cloud forest, were monitored as well for model validation purposes at the operational scale (see below).
Cerro Amigos
Forest
Pasture
Chiquito 1
Rio Chiquito
Secondary Forest
Chiquito 2
Chiquito 3
Santa Elena. .
..
..
Lake Arenal
Figure 1. Site locations in and around the Río Chiquito catchment in northern Costa Rica. Groups of activities: the overall work can be divided into a series of distinct, yet closely linked successional groups of activities (Figure 2): (i) the collection of detailed topographic climatic, vegetation, soil and hydrological data at the plot- (100-500 m2), small catchment- (<100 ha), and operational catchment scales (100 km2), respectively; (ii) the formulation of process-based, spatially distributed hydrological models for use at local, operational, and national scales, respectively; and (iii) the validation of the operational-scale catchment model using both existing and newly collected data as a preliminary to (iv) applying the model to assess the hydrological impacts of various land-cover change scenarios. In a parallel exercise conducted at the (inter)national scale (v), the impacts of similar scenarios for land-cover change, plus those of prescribed changes in climate, were assessed as well. A detailed description of the project’s activities and their sequence in time can be found in sections 19 and 20, respectively, of the Project Memorandum Form (Annex 1). Briefly, the climatic, vegetation (including epiphytes and rooting patterns), soil and hydrological data collected were used to quantify the various hydrological processes operating in the dominant type of cloud forest of the study area and in a mature pasture setting. Continuously recorded data were used to derive optimum parameter values in the models describing the chief hydrological processes and fluxes. The simple, yet highly flexible PCRaster modeling environment was used to develop spatial models, with special attention being paid to the characterization of spatial patterns of fog interception and wind-driven rain. Given the possibility that small forest remnants or isolated secondary woodlands capture more fog water

R7991_Final Technical Project_31 January 2006 Page 7 of 51
and wind-driven rain than the original closed forest canopy due to their greater lateral exposure, crown drip and soil water measurements were also made along transects in secondary forest to allow the corresponding model parameter value adjustments to be made. Extra information on climatic conditions, spatial variability in rainfall, and streamflow for the Río Chiquito catchment was collected to improve the existing data-set for this catchment, and therefore the level of realism of subsequent streamflow modeling efforts (validation and land-cover scenario runs). Finally, a relatively simple ‘delivery’ model, capable of predicting spatio-temporal patterns of fog interception, wind-driven rain, and evaporation losses at the national scale (or indeed across Central America and adjacent countries), was developed by the project as a water resources policy-support tool. In this way, hydrological ‘hot spots’ (receiving significantly larger inputs of occult precipitation not recorded by a conventional rain gauge) can be identified that should ideally remain (or be brought back) under cloud forest to ensure optimum soil water recharge and dry season flows.
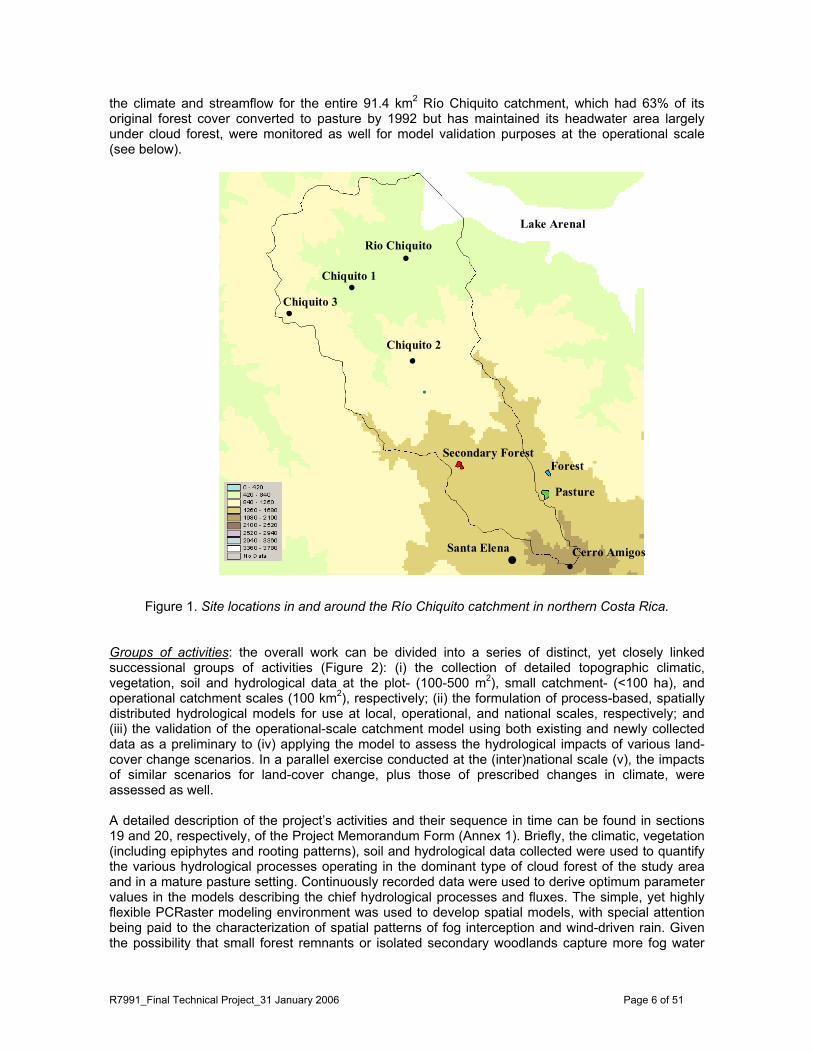
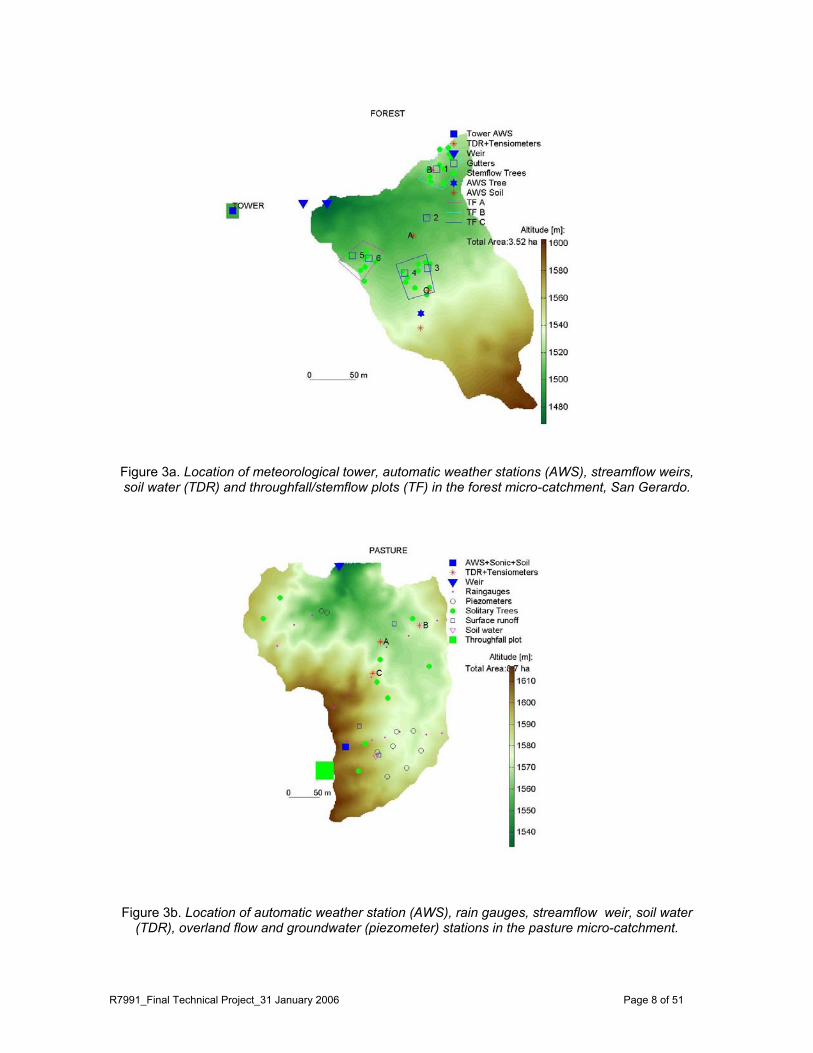
Figure 2. Linkages between data sources, scales and models used by the project. Summary of field measurement approaches: detailed technical descriptions and discussions of the respective hydro-meteorological measurement techniques and equipment used are given in the FIESTA Project Hydrological Measurement Protocol (Annex 2). A summary is given below. The two micro-catchments under old-growth windward cloud forest (3.5 ha, 1450-1600 m above sea level) and pasture (8.7 ha, 1520-1620 m) in the San Gerardo area (upper Caño Negro catchment) were heavily instrumented for the quantification of their water budget, hydrological processes, and response to rainfall. Figures 3a and 3b depict the locations of the respective instruments and plots used for intensive process measurements (e.g. rainfall and fog interception) within the respective catchments.
R7991_Final Technical Project_31 January 2006 Page 8 of 51
Figure 3a. Location of meteorological tower, automatic weather stations (AWS), streamflow weirs, soil water (TDR) and throughfall/stemflow plots (TF) in the forest micro-catchment, San Gerardo.
Figure 3b. Location of automatic weather station (AWS), rain gauges, streamflow weir, soil water (TDR), overland flow and groundwater (piezometer) stations in the pasture micro-catchment.

R7991_Final Technical Project_31 January 2006 Page 9 of 51
Measurements of climatic conditions in the forest were made from a 25 m scaffolding tower on a north-easterly slope just outside the catchment (Figures 3a and 4a). Measurements were made both above and at several heights within the canopy to determine atmospheric exchange processes for the respective vegetation layers (Figures 4 and 6). Additional above-canopy measurements were made in a tree-top station located higher up in the catchment (Figure 3a).
Figure 4. Precipitation equipment at the forest tower site. (a) View of tower from valley. (b) Eddy covariance set-up for direct measurement of fog deposition. (c) Standard manual and recording rain gauges. (d) Comparison of standard, spherical and Juvik gauges. (e) Wire harp and improved Juvik gauge (anemometer in background). (f) Wire harp and wind meter within the canopy.

R7991_Final Technical Project_31 January 2006 Page 10 of 51
In the pasture area no tall tower structure was necessary and all climatic measurements were made at standard heights (see Figure 6f below). Rainfall measurements were corrected for wind loss due to aerodynamic effects around the gauge using information on wind speed and rainfall intensity (based on comparisons with ground-level gauges). As wind speeds increase or intensities - and therefore raindrop sizes - decrease, a larger portion of the rain is blown over the gauge which catches a correspondingly smaller amount of rain. In addition, some of the rainfall comes in at an angle that tends to vary with wind speed and raindrop size. In extreme cases, such rain can travel almost horizontally, thereby completely bypassing a conventional rain gauge and thus remaining unrecorded. During the last few months of the field measurement campaign a so-called spherical rain gauge, which presents the same surface area regardless of the direction of the incoming rain, was tested at the forest tower site (Figure 4d). Further testing is required during the more extreme weather conditions prevailing during other parts of the year (notably October-December). The approach that was finally adopted by the project to quantify inclined rainfall is summarized in the next paragraph. Fog inputs and horizontal precipitation are notoriously difficult to quantify, even more so when rainfall and fog occur together. A range of techniques was used by the project, each having their specific limitations. The widely used wire harp (Figure 4e) proved unsuitable in that drops caught by the device were blown off again above wind speeds of 3-4 m s-1. In addition, the efficiency of the gauge to catch wind-blown rain drops (as opposed to the much smaller fog droplets) remained unknown whereas the rectangular shape of the harp presented a different trapping area to different wind directions. The so-called Juvik fog gauge, a cylindrical gauge made of louvered aluminium screen (Figure 4e), performed much better. Although the Juvik gauge does not distinguish between contributions by fog and wind-driven rainfall either, it has nearly 100 per cent catch efficiency for wind-driven rain and a well-defined relationship between fog catch efficiency and fog density. To determine the angle at which rain was falling, the standard Juvik gauge was adapted by placing an extra funnel on top of the cylindrical screen. This allowed the separate measurement of amounts of rainfall (and fog) caught by a horizontal plane (i.e. the orifice of the top funnel) and by a vertical plane (i.e. the cylindrical screen drained by the bottom funnel; Figure 4e). These two amounts can be seen as the vertical and horizontal components, respectively, of the inclined rainfall. A simple trigonometric calculation then yields the angle at which the rain falls (Figure 4e) and therefore the ‘potential’ amount of precipitation that would be caught by a plane perpendicular to that rainfall. It should be noted that, although the horizontal component of the precipitation measured in this way does include some fog water, contributions by the latter during times of rainfall were invariably small. The angles of the rain were related to the prevailing wind speed and rain drop size and conformed to theoretically expected relationships. Thus, for each hourly record of vertical and horizontal rainfall catches by the Juvik gauge the angle of incidence of the rain could be computed. Because fog water and near-horizontal wind-driven rain could not be separated their sum is henceforth referred to as horizontal precipitation, HP. Once the angle of incidence of the rain is known, it becomes possible to determine the ‘potential’ amount of rain falling onto an area. The actual amount arriving at a specific slope depends on the gradient and aspect of that slope compared to those of the rain. By combining a digital elevation model of the terrain with information on rainfall angles, a much more realistic estimate of spatial and temporal rainfall inputs can be obtained than by using traditional means (i.e. simple spatial averaging of rainfall catch or geostatistical interpolations between point measurements). Actual amounts of fog water (defined as having drop sizes <50 µm) deposition in the cloud forest were determined using the most advanced technology currently available, i.e. a coupled eddy covariance and fog particle spectrometer system operated by a team from the University of Bern, Switzerland, during the dry season in spring 2003 (Figure 4b). The eddy covariance system was also used to evaluate the fog-capturing efficiency of the wire harp and Juvik gauges and for comparisons with fog inputs derived with the wet canopy water budget technique. In the latter approach, fog deposition is the only unknown term among the various gains and losses of water to and from the

R7991_Final Technical Project_31 January 2006 Page 11 of 51
wetted vegetation (such as rain, drip, evaporation, etc.). By measuring or computing the remaining terms, the mass balance equation can be solved for fog deposition (read: horizontal precipitation). Although the method gives plausible results, the associated standard errors can be very large, mainly because of uncertainties in the estimation of amounts of incident rainfall and of crown drip which are notoriously variable in tropical forests. Hydrologically speaking, it is important to ‘translate’ incoming amounts of rainfall and fog that hit the vegetation, into amounts actually arriving at the soil surface (so-called ‘net precipitation’) and contributing to soil water reserves. In areas with pasture (i.e. short grass), the two are usually similar but in tall forests they may differ considerably because of the modifying effect of a complex tree canopy. Generally speaking, evaporative losses from a wetted forest canopy are markedly higher than those from short grass. This is because the forest surface has a greater aerodynamic roughness which makes for a more efficient transfer of the evaporating water into the overlying atmosphere. As a result, amounts of water dripping from a forest canopy during rain are normally smaller than the incoming rainfall, the difference commonly being referred to as rainfall interception. The standard procedure to evaluate amounts of intercepted rainfall is to measure incident rainfall above, and crown drip below the vegetation. However, the climatic situation in the study area, with its strong winds and contributions by wind-driven rain and fog that go unrecorded by conventional rain gauges, precluded the use of such a simple and direct approach. To obtain a quantitative idea of the spatial and temporal variability in net precipitation in the cloud forest, three plots differing in exposure to the prevailing winds and rain (called A, B and C in Figure 3a) were established for intensive measurements of crown drip (‘throughfall’) and ‘stemflow’ (Figures 5abc below). The measurements covered different precipitation conditions, i.e. events with rainfall only, fog only, or combined rain and fog, and for a range of wind speeds and rainfall intensities. In addition, drip patterns underneath four large emergent (and therefore exposed) canopy trees were studied in some detail, whereas the biomass and fog-absorbing and fog-releasing characteristics of mosses in the canopy (very different from those of leaves) were determined experimentally as well (Figures 5def). Whilst the drops of inclined rainfall can be expected to hit a slope at more or less the same position regardless whether it is covered with forest or pasture, wind-driven fog and near-horizontal precipitation tend to rather follow a smoothly changing surface topography (at canopy or ground level). Under such conditions, any water that is not ‘stripped’ from the air by the vegetation is blown over and likely to be deposited as soon as wind speeds drop, usually on the next leeward slope. Depending on the level of scale under consideration, this next slope may already belong to an adjacent catchment and the corresponding precipitation input will have to be assigned accordingly. Therefore, particular attention was paid to the quantification of amounts of crown drip (in cloud forest) and increases in topsoil moisture (in pasture) during times of near-horizontal precipitation or fog. Similarly, it was considered likely that small parcels of remnant forest or isolated secondary woodlands would capture more fog and horizontal precipitation than the original (closed) forest canopy due to their greater lateral exposure to the prevailing winds. To examine this, measurements of crown drip and soil water content were also made along transects laid out perpendicularly to the forest edge, both in the top of the San Gerardo pasture catchment (Figure 3b) and near Monte Olivos in the upper Río Chiquito catchment (cf. Figures 8a and 8f). Finally, similar measurements were made by associated researchers from the Swedish University of Agricultural Sciences (Umeå, Sweden) below 8-10 isolated trees of different size, vigour and exposure in pasture land. Since there are more than 10,000 isolated trees in the Río Chiquito catchment, such inputs might be significant2.
2 The results of this work are expected to become available in the second half of 2006.

R7991_Final Technical Project_31 January 2006 Page 12 of 51
Figure 5. Approaches to net precipitation and bryophyte fog interception behaviour: (a) Throughfall trough overview. (b) Detail of throughfall trough tipping bucket system. (c) Stemflow set-up. Note manual throughfall gauge in foreground in left-hand panel. (d) Access to the canopy for moss biomass determinations through single-rope climbing techniques. (e) Epiphyte and moss specialist Dr Lars Koehler sampling mosses high up in the canopy. (f) Field assistant Eder Morales during a within-canopy moss drying experiment at the forest tower site.

R7991_Final Technical Project_31 January 2006 Page 13 of 51
Evaporation from cloud forest and pasture was evaluated using various approaches. Overall amounts of energy available for heating the air (sensible heat flux H) and for the evaporation of moisture (latent heat flux LE) were determined from measurements of incoming and outgoing short-wave and long-wave radiation (Figure 6a), as well as the soil heat flux, heat storage in vegetation biomass and the air below the height of measurement. The latent heat flux LE was determined from the ratio between sensible and latent heat fluxes H/LE as determined from rapid fluctuations in dry- and wet-bulb temperatures (using thermo-couples and correcting for frequency losses using factors obtained from comparisons with high-frequency eddy covariance equipment, Figures 6bc) in combination with the energy balance. For periods with known values of LE the surface resistance rs to evaporation during dry canopy conditions was evaluated by inverse application of the Penman-Monteith evaporation equation. Next, these values of rs were regressed against various climatic parameters for the corresponding periods and the Penman-Monteith equation was applied to the entire climatic data set using the regression. The surface resistance was set to zero when the canopy was wet as indicated by leaf wetness sensors (Figure 6e) and rainfall data. Although the Penman-Monteith equation thus allows the separate computation of evaporation from a wet canopy, the resulting value is strongly dependent on atmospheric humidity deficit. Under foggy (i.e. near-saturated) conditions it is impossible to obtain reliable humidity measurements (Figure 6d). During times of fog and horizontal rainfall a value of 100% humidity was used; in all other cases measured humidity values were used.
Figure 6a-e. Micrometeorological equipment at the forest tower site: (a) Long- and short-wave radiation. (b) Eddy covariance set-up and thermocouple for rapid measurements of temperature fluctuations. (c) Thermocouple for measuring wet- and dry-bulb temperature fluctuations. (d) Relative humidity sensor. (e) Canopy leaf wetness sensor.
R7991_Final Technical Project_31 January 2006 Page 14 of 51
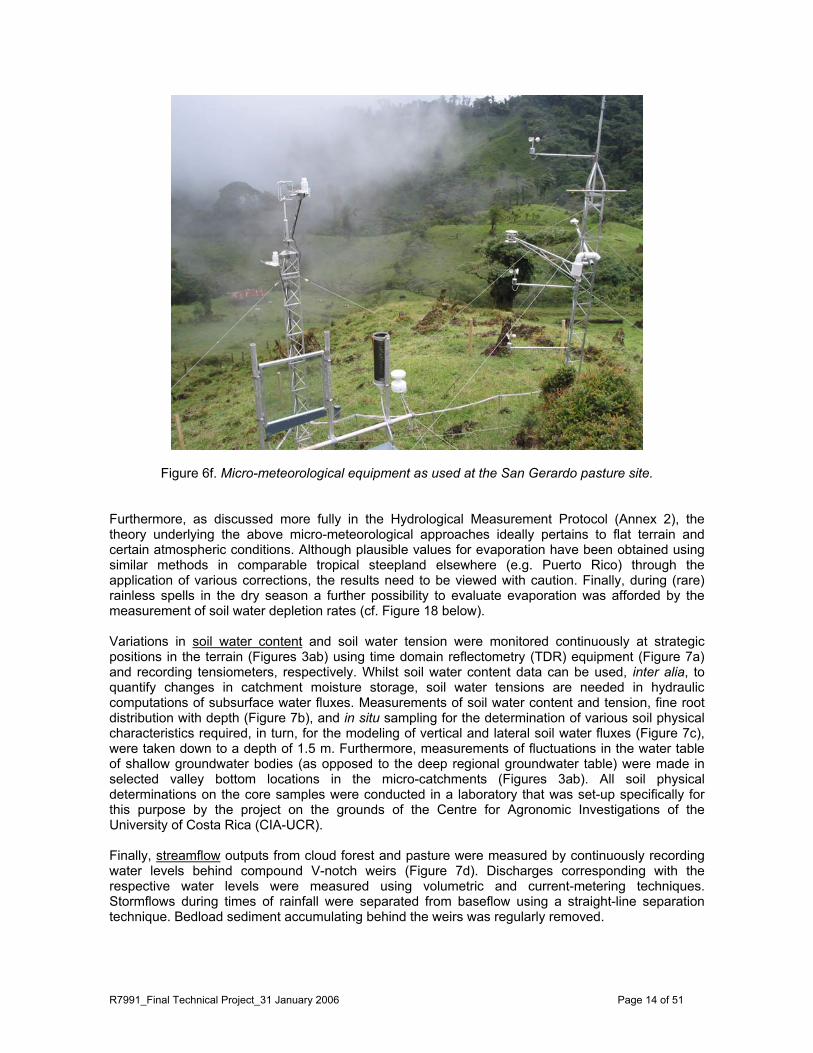
Figure 6f. Micro-meteorological equipment as used at the San Gerardo pasture site. Furthermore, as discussed more fully in the Hydrological Measurement Protocol (Annex 2), the theory underlying the above micro-meteorological approaches ideally pertains to flat terrain and certain atmospheric conditions. Although plausible values for evaporation have been obtained using similar methods in comparable tropical steepland elsewhere (e.g. Puerto Rico) through the application of various corrections, the results need to be viewed with caution. Finally, during (rare) rainless spells in the dry season a further possibility to evaluate evaporation was afforded by the measurement of soil water depletion rates (cf. Figure 18 below). Variations in soil water content and soil water tension were monitored continuously at strategic positions in the terrain (Figures 3ab) using time domain reflectometry (TDR) equipment (Figure 7a) and recording tensiometers, respectively. Whilst soil water content data can be used, inter alia, to quantify changes in catchment moisture storage, soil water tensions are needed in hydraulic computations of subsurface water fluxes. Measurements of soil water content and tension, fine root distribution with depth (Figure 7b), and in situ sampling for the determination of various soil physical characteristics required, in turn, for the modeling of vertical and lateral soil water fluxes (Figure 7c), were taken down to a depth of 1.5 m. Furthermore, measurements of fluctuations in the water table of shallow groundwater bodies (as opposed to the deep regional groundwater table) were made in selected valley bottom locations in the micro-catchments (Figures 3ab). All soil physical determinations on the core samples were conducted in a laboratory that was set-up specifically for this purpose by the project on the grounds of the Centre for Agronomic Investigations of the University of Costa Rica (CIA-UCR). Finally, streamflow outputs from cloud forest and pasture were measured by continuously recording water levels behind compound V-notch weirs (Figure 7d). Discharges corresponding with the respective water levels were measured using volumetric and current-metering techniques. Stormflows during times of rainfall were separated from baseflow using a straight-line separation technique. Bedload sediment accumulating behind the weirs was regularly removed.

R7991_Final Technical Project_31 January 2006 Page 15 of 51
Figure 7. (a) Time Domain Reflectometry equipment for the continuous recording of soil water content at different depths, pasture site. (b) Alexander Carvajal and Dr Conrado Tobón extracting soil cores for the determination of root distribution patterns. (c) Project soil physical laboratory at Universidad de Costa Rica, San José. (d) V-notch weir for the monitoring of streamflow. Because existing climatic and streamflow data were insufficient to allow validation of modeled streamflow patterns at the operational scale, four additional automated weather stations were installed and operated at various elevations within the Río Chiquito catchment (Figures 8acf). In addition, water levels in the main channel just downstream of the hamlet of the same name were monitored continuously and a rating curve was derived to relate water levels to discharge (Figure 8e). Vegetation patterns were derived from Landsat and Ikonos satellite imagery (Figure 8b). The head-waters of the Río Chiquito are mostly under Landscape impression of the lower Chiquito area. cloud forest whereas at lower elevations a mosaic of pasture, remnant stands and isolated trees prevails (adjacent photograph; cf. Figures 8bf). Note that the secondary forest plots at Monte Olivos referred to earlier are also located within the Río Chiquito catchment (Figures 8af).
R7991_Final Technical Project_31 January 2006 Page 16 of 51
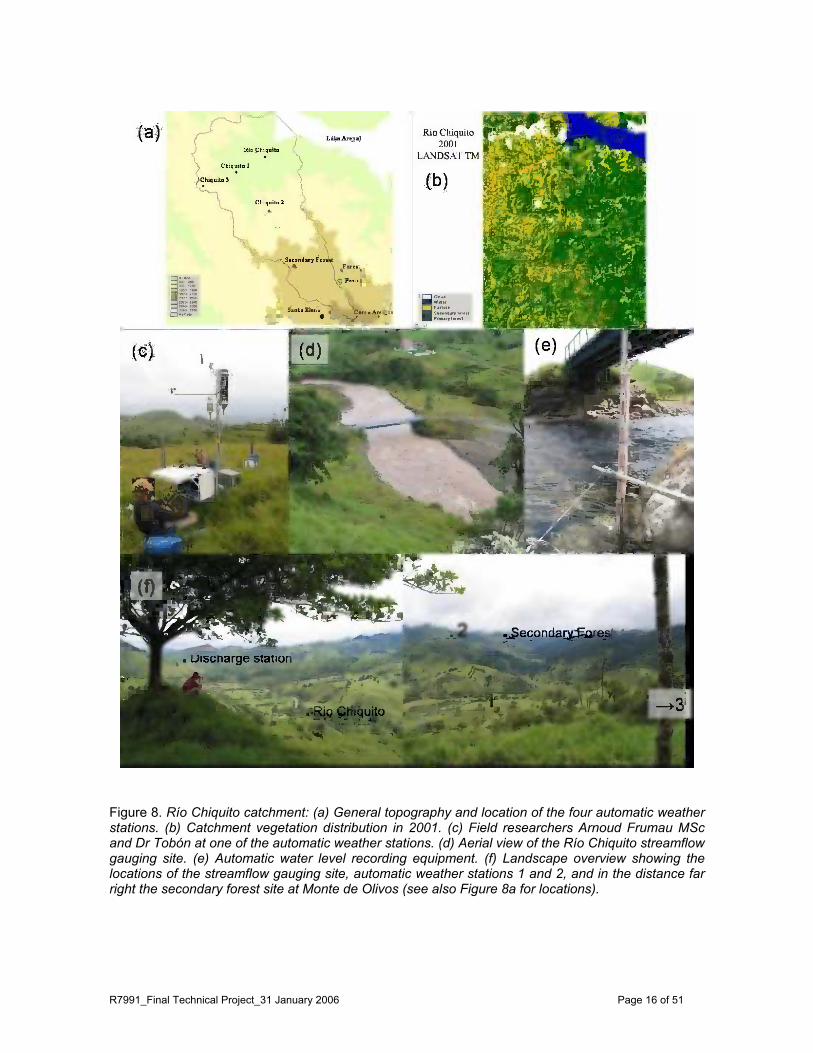
Figure 8. Río Chiquito catchment: (a) General topography and location of the four automatic weather stations. (b) Catchment vegetation distribution in 2001. (c) Field researchers Arnoud Frumau MSc and Dr Tobón at one of the automatic weather stations. (d) Aerial view of the Río Chiquito streamflow gauging site. (e) Automatic water level recording equipment. (f) Landscape overview showing the locations of the streamflow gauging site, automatic weather stations 1 and 2, and in the distance far right the secondary forest site at Monte de Olivos (see also Figure 8a for locations).

R7991_Final Technical Project_31 January 2006 Page 17 of 51
Summary of operational catchment hydrological FIESTA_CQflow model To predict the changes (if any) in streamflow patterns associated with the conversion of (cloud) forest to pasture at the operational scale (say, 100 km2), the FIESTA_CQflow model was developed. A full description of the model’s code, operational requirements and outputs is given in Annex 3 (written by J. Schellekens). Below a brief summary is offered. Although most of the model is designed in a generic (i.e. physically-based and generally applicable) way, parts of the model routine are inherently custom-made for the catchment under consideration. Examples include the functions describing wind-induced rainfall losses around the rain gauges or the amount of water running off as overland flow instead of infiltrating into the soil. Such specific functions should therefore be re-determined or prescribed when applying the model to another area. The model has been written in the PCRaster framework which allows for rapid and easy model coding and modification as well as a spatially explicit representation of landscape state variables and hydrological processes. The user interface (command line) is written in Octave, a freely available clone of the widely used Matlab programme. The following hydrological processes are included in the CQflow model:
• Based on site location, time of day and time of year, the solar inclination is determined. This information is used to re-distribute the point measurements of solar radiation across the digital elevation model (DEM) of the catchment, thereby allowing a better spatial estimation of evaporation. It should be noted that at present this routine is only applicable to the tropical zone (i.e. between 23 degrees N and S).
• Rainfall interception is modeled using a simplified version of the widely used Rutter model
which solves the wet canopy water balance explicitly.
• Evaporation from both wet and dry vegetation surfaces is modeled using the Penman-Monteith model. Vegetation parameterization within the cloud belt is based on measurements made by the project and values are taken from the literature for forest and pasture at lower elevations.
• Soil water dynamics are represented by a simple ‘bucket’-type model comparable to the
TOPOG_SBM model and assumes an exponential decay of soil hydraulic conductivity with depth. Lateral subsurface flows are modeled using the Darcy equation. An exponential leakage function can be included if necessary but was not used for the Rio Chiquito area.
• Overland flow is modeled using a kinematic wave routine.
The model is run using hourly time steps to allow computation of peakflows and stormflows during times of rainfall within the day, yet avoiding excessive computing time requirements. The model requires the following static data (provided in the form of maps or look-up tables): a digital elevation model (150 x 150 m or less), soil type, depth and selected soil physical parameters (notably hydraulic conductivity, water retention), and land cover type. In addition, the following dynamic data (in the form of time series) are required: rainfall (measured vertical and horizontal components, cf. Figure 4e), incoming short-wave radiation, wind speed and direction, dry-bulb temperature and relative humidity. The general data streams in the model are depicted in Figure 9. The model consists of several components:
1) A base-maps preprocessor. This script performs a series of commands to prepare the (raw) base maps (DEM, soil, vegetation, measuring locations) for use in the model. This functionality also calls several PCRaster functions (cf. Figure 10).
R7991_Final Technical Project_31 January 2006 Page 18 of 51
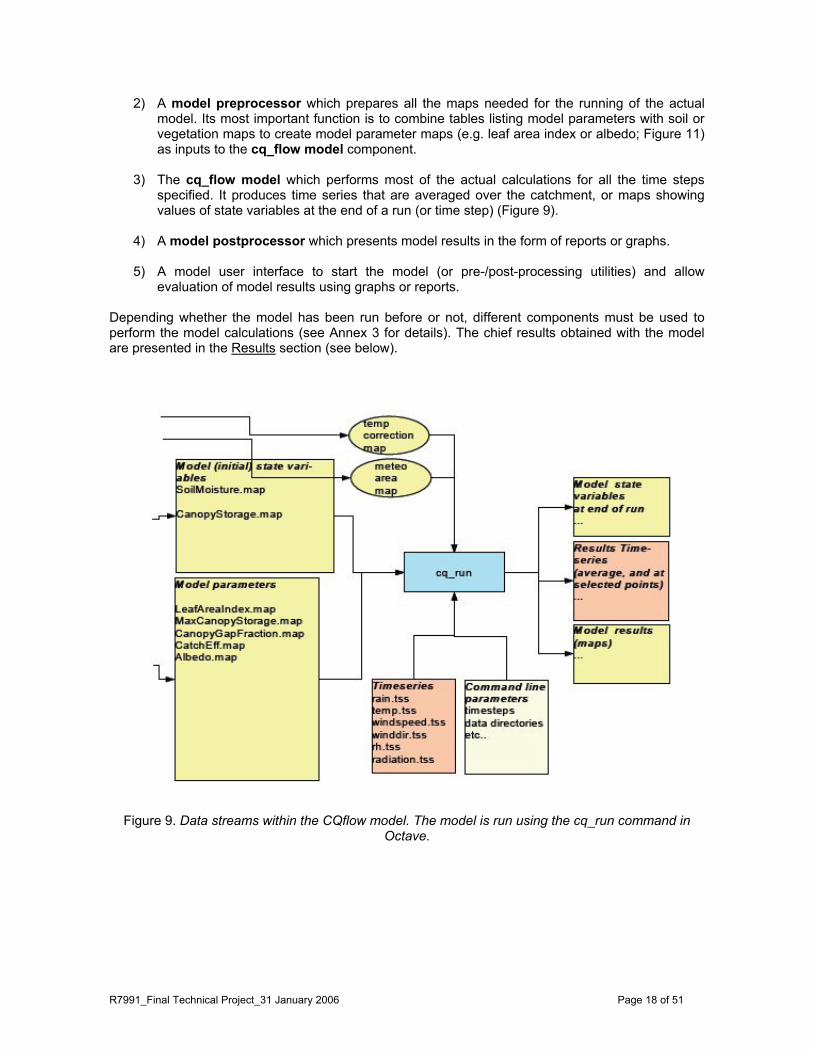
2) A model preprocessor which prepares all the maps needed for the running of the actual model. Its most important function is to combine tables listing model parameters with soil or vegetation maps to create model parameter maps (e.g. leaf area index or albedo; Figure 11) as inputs to the cq_flow model component.
3) The cq_flow model which performs most of the actual calculations for all the time steps
specified. It produces time series that are averaged over the catchment, or maps showing values of state variables at the end of a run (or time step) (Figure 9).
4) A model postprocessor which presents model results in the form of reports or graphs.
5) A model user interface to start the model (or pre-/post-processing utilities) and allow
evaluation of model results using graphs or reports.
Depending whether the model has been run before or not, different components must be used to perform the model calculations (see Annex 3 for details). The chief results obtained with the model are presented in the Results section (see below).
Figure 9. Data streams within the CQflow model. The model is run using the cq_run command in
Octave.

R7991_Final Technical Project_31 January 2006 Page 19 of 51
Figure 10. Data streams within the basemaps pre-processor.
Fig. 11. The cqprepvars script uses look-up tables and the maps from the basemaps pre-processor to construct input maps from the basemaps programme. The arrows on the right represent maps exported to the actual model.

R7991_Final Technical Project_31 January 2006 Page 20 of 51
Summary of nationwide FIESTA_delivery model To predict the spatial and seasonal (monthly) changes in water inputs and evaporative losses associated with (i) the conversion of (cloud) forest to pasture and (ii) the expected warming and drying of the climate at the national Costa Rican (and larger) scale, the FIESTA_delivery model was developed. A full description of the model’s code, operational requirements and outputs is given in Annex 4 (written by M. Mulligan and S. Burke). Below a brief introductory summary is given. Introduction: one of the greatest limitations of hydrological investigations is that they can usually only be applied to small scales and few locations. This is especially true for field research because of the prohibitive technical difficulty and high cost of instrumentation and of data collection at scales greater than the point or plot scale. It is also true for modeling studies because of limitations imposed by the lack of ground-based data at scales greater than the point or plot scale. This limitation is a serious one for policy-relevant hydrology since it means that studies are usually carried out intensively at only a single or a few locations with particular characteristics and the results are then extrapolated rather crudely (by the policy analysts if not the scientists themselves) to larger scales and different locations which may have very different characteristics to the study site(s). The FIESTA_delivery model has two main objectives. First, the model is intended to place the Chiquito catchment results within a national context for Costa Rica (and later in an international context for Central America) so that the results from the CQflow model can be seen within the context of the Chiquito catchment and its similarities/differences with other catchments in Central America (both lowland and montane)). Secondly, the FIESTA_delivery model was intended to summarise the field and modelling knowledge gained from the finer scale research and ‘deliver’ it in the form of a model that can be used by anyone for land-cover and climate-change hydrological impact scenario analysis in their own countries. Thus the model operates in a freely available software environment and uses globally available (remotely sensed) data. The FIESTA_delivery model is a process model which simulates the hydrological balance including inputs of wind-driven precipitation and fog and outputs of evapotranspiration. The resulting balance is cumulated along river flow networks to give an indication of runoff. The model operates at a monthly time step using a long-term monthly mean climatology and thus shows the mean hydrological balance and seasonal variation. Within this monthly time step a diurnal time step also operates in order to properly simulate the dynamics of fog incidence and interception. The model is a grid-based spatially distributed model which can operate at a 1km grain or a 90m grain, depending on the computing resources available. The 1km version is intended for policy application whereas the 90m version is more appropriate for research applications. Policy application: all data are supplied for the whole of Costa Rica. A project is underway to make the data available for the entire tropics. The model comes with a series of policy exercises designed to investigate the impacts of scenaria for forest conservation, land-cover change and climate change. The five scenaria include a baseline (run_baseline) representing land-cover conditions in 2001; a payment for environmental services (PES) scenario (run_pes), representing the situation after 50 years of continued forest protection from PES funds; a no PES scenario (run_nopes), in which forest protection is less possible and land-cover change occurs also within the area under protection in 2001; a cloud forest loss only scenario (run_cloudforestremoved), in which only the area under cloud forest undergoes continued cover change; and a climate change scenario (run_climch), in which the GCM3 derived temperature and precipitation trends for Costa Rica are applied to the 2001 baseline. A series of post-processors (named compare_all) compare the results of the respective scenaria with the baseline and display the impacts of the scenaria on amounts of fog interception and hydrological balances in general.
3 Atmospheric global circulation model.

R7991_Final Technical Project_31 January 2006 Page 21 of 51
Model Summary: For a national-scale model the FIESTA_delivery model is highly sophisticated and accounts for many processes that are not usually simulated even in smaller-scale models including:
Temporal • Unique diurnal cycle within monthly time step to capture daily and seasonal cycles in a
computationally efficient manner.
Spatial • The model is operable from globally available free datasets. The following are amongst those
required: o SRTM4 digital elevation model (90m) or GTOPO30 DEM (1km) and derivatives. o MODIS5 satellite-derived cloud-cover frequency and diurnal/seasonal derivatives. o WORLDCLIM-derived monthly meteorological inputs (precipitation, temperature,
diurnal temperature range). o Monthly relative humidity, mean sea level pressure, wind direction, wind speed and
derivatives developed for this project and available at 1km resolution at http://www.ambiotek.com/fiesta/fiesta.kml
o Fractional tree-, herb- and bare-vegetation covers from MODIS VCF (Vegetation Continuous Fields).
• Capable of application at scales from 1km (for continental extent) to 90m (for national extent).
• Calculation and use of true surface areas (rather than planimetric areas) for all area calculations.
• Representation of land cover as a more precise fractional coverage of trees per cell rather than using a binary forest/non-forest classification.
Simulated Processes • Calculation of spatially distributed direct and diffuse solar radiation receipt accounting for
slope gradient, aspect and topographic shadowing effects. Solar radiation corrected for cloud cover and fog attenuation. Net radiation calculated from solar radiation according to land-cover type (forest or pasture).
• Wind-driven rainfall calculated for each cell on the basis of measured rainfall inputs corrected for local wind speeds and topography.
• Fog incidence calculated as a function of the observed frequency of atmospheric cloud and the propensity for condensing conditions to exist at the land surface.
• Calculation of wind direction on the basis of mean atmospheric pressure fields and modification for local topographic funneling.
• Spatial distribution of wind speeds on the basis of regional wind speeds corrected for topographic exposure to winds from the relevant local wind direction.
• Separation of fog interception into deposition and impaction components on the basis of wind speed and calculated surface areas according to angle of fog impact for forest and pasture. Calculation of forest-pasture edges and emergent-tree exposure to fog and their role in fog interception. Total fog interception is thus the sum of vertical deposition and horizontal impaction to forest and grassland surfaces, forest edges and emergent trees.
• Representation of self-shading for fog interception and for evaporation (for both forest and grassland).
• Evapotranspiration driven by available energy (net radiation) intercepted by the land and vegetated surfaces.
• Water balance calculated as sum of fog inputs plus wind-driven rainfall minus evapotranspiration and then cumulated in a downstream direction.
4 Shuttle radar topography mission. 5 Moderate resolution imaging spectrometer.
R7991_Final Technical Project_31 January 2006 Page 22 of 51
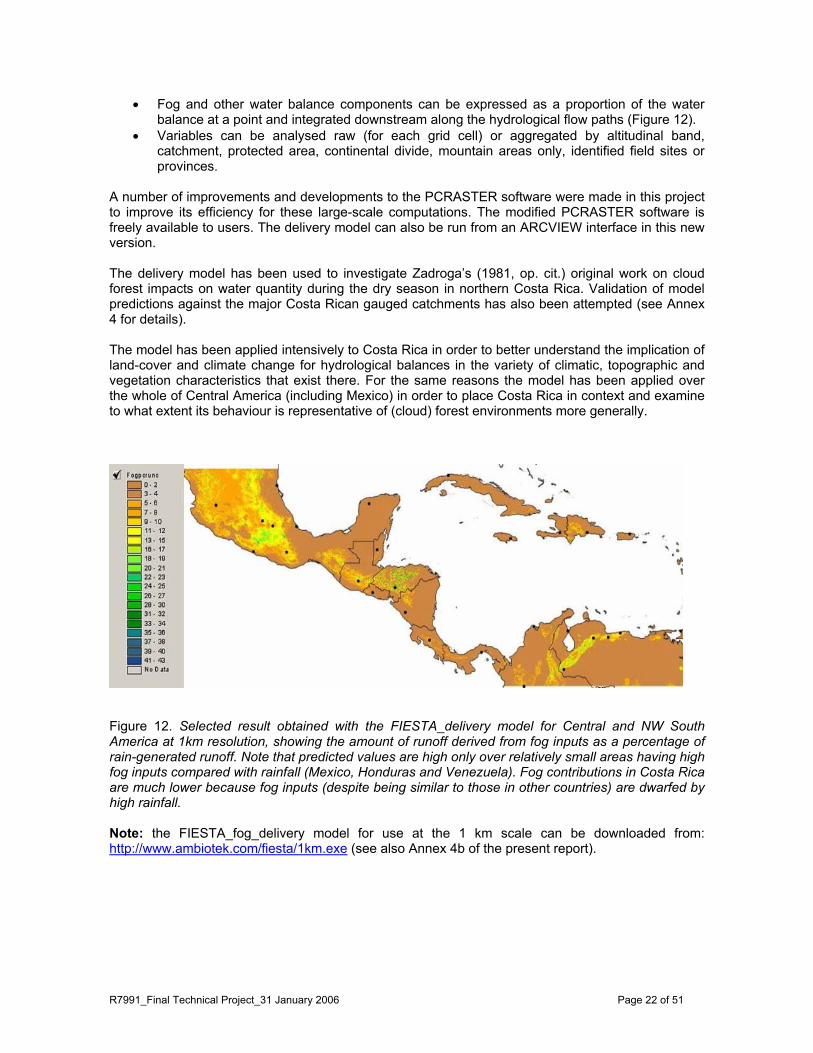
• Fog and other water balance components can be expressed as a proportion of the water balance at a point and integrated downstream along the hydrological flow paths (Figure 12).
• Variables can be analysed raw (for each grid cell) or aggregated by altitudinal band, catchment, protected area, continental divide, mountain areas only, identified field sites or provinces.
A number of improvements and developments to the PCRASTER software were made in this project to improve its efficiency for these large-scale computations. The modified PCRASTER software is freely available to users. The delivery model can also be run from an ARCVIEW interface in this new version. The delivery model has been used to investigate Zadroga’s (1981, op. cit.) original work on cloud forest impacts on water quantity during the dry season in northern Costa Rica. Validation of model predictions against the major Costa Rican gauged catchments has also been attempted (see Annex 4 for details). The model has been applied intensively to Costa Rica in order to better understand the implication of land-cover and climate change for hydrological balances in the variety of climatic, topographic and vegetation characteristics that exist there. For the same reasons the model has been applied over the whole of Central America (including Mexico) in order to place Costa Rica in context and examine to what extent its behaviour is representative of (cloud) forest environments more generally.
Figure 12. Selected result obtained with the FIESTA_delivery model for Central and NW South America at 1km resolution, showing the amount of runoff derived from fog inputs as a percentage of rain-generated runoff. Note that predicted values are high only over relatively small areas having high fog inputs compared with rainfall (Mexico, Honduras and Venezuela). Fog contributions in Costa Rica are much lower because fog inputs (despite being similar to those in other countries) are dwarfed by high rainfall. Note: the FIESTA_fog_delivery model for use at the 1 km scale can be downloaded from: http://www.ambiotek.com/fiesta/1km.exe (see also Annex 4b of the present report).

R7991_Final Technical Project_31 January 2006 Page 23 of 51
Outputs Chief research results6
Hydrometeorology – point measurements (1) Rainfall as measured with conventional rain gauges is often severely underestimated under the windy conditions prevailing in the Monteverde / Arenal area. The actual degree of underestimation due to wind losses around the gauge and the inclined nature of the rainfall differ per site and depend on local topography and exposure of the gauge to the prevailing wind field, as well as wind speed and rain drop size. The latter depends, in turn, on rainfall type. Intensive convectional summer storms produce larger drops that are less susceptible to wind effects whereas the finer drops associated with the more drizzly types of rainfall during the windy autumn months are easily deflected. As such, wind losses vary seasonally. Derived average annual wind loss fractions within the cloud belt ranged from ca. 6% at the lowermost station (Río Chiquito #1) to 19.5% at the Río Chiquito # 3 station. Expressed in absolute terms, these losses corresponded to 190 mm yr-1 at Río Chiquito #1 and 555 mm yr-1 at Río Chiquito #3. The highest absolute wind loss correction was derived for station Río Chiquito #2, however (845 mm). Even under the high rainfall conditions prevailing in the study area this represents a significant extra input of water that has hitherto remained unrecorded. It is pertinent to note here that existing gauge correction models could not be expected to be applicable because of the use of a different type of rain gauge (i.e. the modified Juvik gauge) and the prevailing complex topographic conditions. An alternative method was developed by the project that took the angle of the rainfall (and therefore the actual topographic and turbulence conditions) into account. Between 9 March and 3 May 2005 two recently developed types of spherical rain gauges – specifically designed to measure rainfall under conditions of inclined rainfall – were in operation at the top of the San Gerardo forest tower (cf. Figure 4d). Comparison of the catches of the spherical gauges with those of the Juvik-type cylindrical gauge (cf. Figure 4e) suggested the spherical gauge to be less efficient (Figure 13), especially during foggy and drizzly conditions. Nevertheless, the respective amounts were highly correlated (coefficient of determination R2 = 0.96). The spherical gauge roughly caught twice as much as a standard gauge after correction for aerodynamic losses. Further work is needed during the more extreme weather conditions prevailing during the fall months. For the time being the adjusted Juvik gauge is to remain the preferred instrument for measuring precipitation in the area (see also below).
Figure 13. Cumulative rainfall measured by a conventional rain gauge, a spherical rain gauge, and a
modified Juvik gauge at the forest tower site between 9 March and 3 May 2005.
6 Full details on the project’s research results will be laid down in a series of scientific papers (listed in Annex 8); see also Annex 3 (operational-scale scenario modeling) and Annex 4 (national- and international scale scenario modeling).
R7991_Final Technical Project_31 January 2006 Page 24 of 51
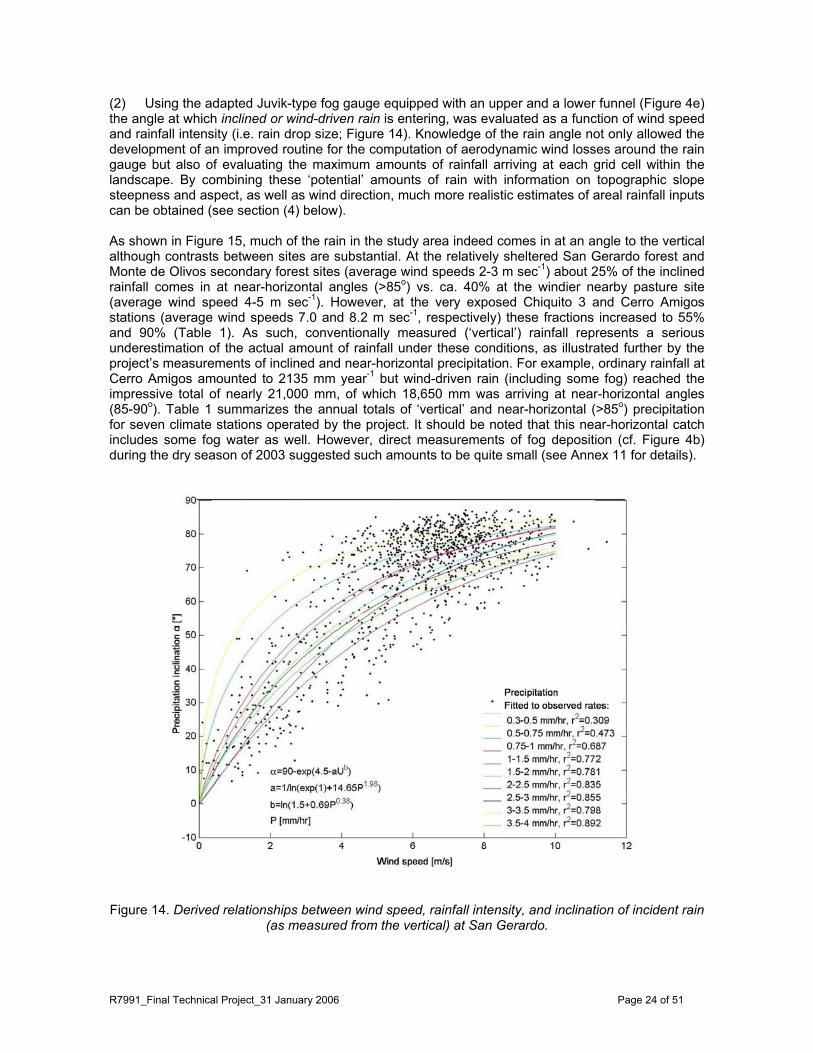
(2) Using the adapted Juvik-type fog gauge equipped with an upper and a lower funnel (Figure 4e) the angle at which inclined or wind-driven rain is entering, was evaluated as a function of wind speed and rainfall intensity (i.e. rain drop size; Figure 14). Knowledge of the rain angle not only allowed the development of an improved routine for the computation of aerodynamic wind losses around the rain gauge but also of evaluating the maximum amounts of rainfall arriving at each grid cell within the landscape. By combining these ‘potential’ amounts of rain with information on topographic slope steepness and aspect, as well as wind direction, much more realistic estimates of areal rainfall inputs can be obtained (see section (4) below). As shown in Figure 15, much of the rain in the study area indeed comes in at an angle to the vertical although contrasts between sites are substantial. At the relatively sheltered San Gerardo forest and Monte de Olivos secondary forest sites (average wind speeds 2-3 m sec-1) about 25% of the inclined rainfall comes in at near-horizontal angles (>85o) vs. ca. 40% at the windier nearby pasture site (average wind speed 4-5 m sec-1). However, at the very exposed Chiquito 3 and Cerro Amigos stations (average wind speeds 7.0 and 8.2 m sec-1, respectively) these fractions increased to 55% and 90% (Table 1). As such, conventionally measured (‘vertical’) rainfall represents a serious underestimation of the actual amount of rainfall under these conditions, as illustrated further by the project’s measurements of inclined and near-horizontal precipitation. For example, ordinary rainfall at Cerro Amigos amounted to 2135 mm year-1 but wind-driven rain (including some fog) reached the impressive total of nearly 21,000 mm, of which 18,650 mm was arriving at near-horizontal angles (85-90o). Table 1 summarizes the annual totals of ‘vertical’ and near-horizontal (>85o) precipitation for seven climate stations operated by the project. It should be noted that this near-horizontal catch includes some fog water as well. However, direct measurements of fog deposition (cf. Figure 4b) during the dry season of 2003 suggested such amounts to be quite small (see Annex 11 for details).
Figure 14. Derived relationships between wind speed, rainfall intensity, and inclination of incident rain
(as measured from the vertical) at San Gerardo.

R7991_Final Technical Project_31 January 2006 Page 25 of 51
Figure 15. Cumulative amounts of inclined rainfall (HP) vs. angle of incidence of the precipitation at various locations in the study area between 1 July 2003 and 1 July 2004. Corrected values (solid
lines) include changes in gauge efficiency with wind speed and fog density. Table 1. Annual totals (mm) of vertical and inclined precipitation as well as near-horizontal (>85o) wind-driven rain (WDR) plus fog at seven climate stations in the Arenal area between 1 July 2003 and 1 July 2004. Amounts and percentages of wind-driven rain plus fog arriving at angles >85o listed separately (values rounded off to nearest 5 mm).
San Gerardo
Forest San Gerardo Pasture
Secondary Forest
Chiquitono.1
Chiquito no.2
Chiquito no.3
Cerro Amigos
Rain# 6000 4385 5605 3460 6360 3400 2140 WDR, fog 11330 13130 10265 3190 10720 16950 20965 WDR>85o Idem (%)
2740 24
5085 39
2320 23
520 16
1120 11
9510 56
18720 89
#corrected for wind losses around the gauge. Of the wind-driven rain and fog coming in at near-horizontal angles, typically 25% was captured and transmitted to the ground by the cloud forest canopy as drip vs. about 15% in the case of rough pasture (determined as increase in topsoil moisture). The rest of the water is blown over and does not make a net contribution to the water budget of the slope (or watershed) under consideration. Depending on wind conditions this water may be deposited on the next leeward slope, carried on to the next watershed, or ultimately evaporate without touching the ground (see fuller discussion in Annex 4). As such, a blanket conversion of cloud forest to rough pasture would typically involve a net loss in wind-driven precipitation catch of ca. 10% (i.e. 25-10%). Given the very substantial amounts of precipitation arriving at near-horizontal angles at many of the stations listed in Table 1 it follows that such losses may vary between ca. 50 mm year-1 (Chiquito station no. 1) to as much as 1870 mm year-1 at Cerro Amigos (representing the most extreme weather conditions in the area). It should be noted though that the ultimate effect on streamflow amounts will be determined not only by the (spatially averaged) change in precipitation inputs but also by that in evaporative losses (see section on forest conversion below).

R7991_Final Technical Project_31 January 2006 Page 26 of 51
(3) The measurements of evaporation at the San Gerardo forest and pasture sites revealed remarkably (and somewhat unexpectedly) similar annual totals for the two contrasting vegetation types, even after normalizing for differences in site elevation and thus exposure to radiation and wind. The annual evaporation totals (normalized for the climatic conditions at the forest site) are listed in Table 2. A distinction is made between evaporation from a dry canopy (transpiration) and from a wetted canopy (interception evaporation). It is important to note that actual values are site dependent and therefore would be different (higher) for the actual San Gerardo pasture site which was both windier and sunnier due to its proximity to the top of the local cloud base (cf. Table 3 below). This is reflected in the higher value of the Penman open-water reference evaporation estimate Eo for the pasture site compared to that of the forest site (Table 2). The actually determined evaporation ET for a specific vegetation type and site can be normalized by expressing ET as a ratio to the corresponding Eo for that site. In this way values for different sites and vegetation types can be compared more easily. The similarity in ET values for the two vegetation types can be attributed to the low radiation loads and very high atmospheric humidity prevailing in the study area. Both factors tend to suppress evaporation, thereby minimizing any differences between vegetation types. Table 2. Annual evaporation components (mm) for cloud forest and pasture in the San Gerardo area between 1 July 2003 and 1 July 2004 (values rounded off to nearest 5 mm).
Evaporation component // Vegetation type Cloud Forest PastureEvapotranspiration, ET 785 730 Transpiration, Et 365 385 Interception, Ei 415 345 Penman open water reference evaporation, Eo (forest site & pasture site) 905 1080 ET/Eo (taking Eo for the forest site) 0.867 0.810
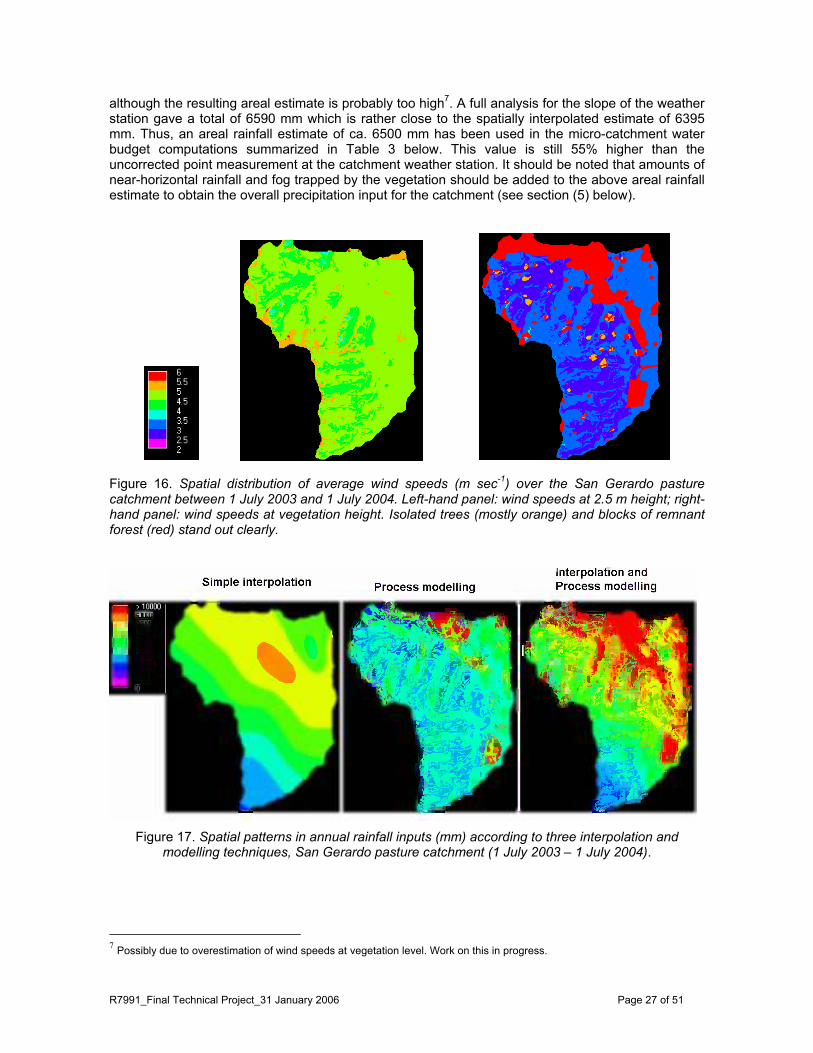
Small catchment hydrology and effects of cloud forest conversion to pasture (4) Moving up one level in scale from the point measurement to the small catchment scale (say, 10-100 ha) in the complex topography of the Arenal area, one immediately encounters formidable problems when trying to accurately determine areal precipitation inputs. The rugged topography leads to substantial spatial variation in wind speeds and directions and therefore in rainfall inputs. Examples include local wind-funneling effects, windward/leeward effects, speeding up of wind strength near ridge tops, etc. but also the added complexity afforded by remnant isolated trees and small blocks of woodland altering the flow of the air (Figure 16). In addition, there is the complex interplay between rainfall angle of incidence and azimuth on the one hand and slope gradients and aspects on the other. Needless to say, the precise representation of catchment-wide water inputs is of paramount importance when establishing local water budgets and, arguably, such high spatial variability can only be captured adequately through the inclusion of spatially distributed climate modeling approaches. Mulligan and Burke provide a worked out example for the 9.1 ha San Gerardo pasture catchment in section 2.1.1 of Annex 4 to this report (cf. Figure 17). The magnitude of the contrast between an uncorrected point measurement (normally taken to represent a predefined area around the gauge) and a fully spatially interpolated estimate coupled with terrain-based modeling of the relevant processes is illustrated in Figure 17. Rainfall measured at ground level at the automatic weather station in the pasture catchment amounted to ca. 4200 mm between 1 July 2003 and 1 July 2004. The areal rainfall totals derived for the catchment ranged from 4895 mm (full process modeling; Figure 17b), through 6395 mm (spatial interpolations between different gauges but including wind-field driven losses; Figure 17a), to 7695 mm (combined spatial interpolations, wind-field driven losses and full process modeling; Figure 17c). Of these estimates, the latter is considered to give the most accurate representation of the spatial variation in rainfall
R7991_Final Technical Project_31 January 2006 Page 27 of 51
although the resulting areal estimate is probably too high7. A full analysis for the slope of the weather station gave a total of 6590 mm which is rather close to the spatially interpolated estimate of 6395 mm. Thus, an areal rainfall estimate of ca. 6500 mm has been used in the micro-catchment water budget computations summarized in Table 3 below. This value is still 55% higher than the uncorrected point measurement at the catchment weather station. It should be noted that amounts of near-horizontal rainfall and fog trapped by the vegetation should be added to the above areal rainfall estimate to obtain the overall precipitation input for the catchment (see section (5) below).
Figure 16. Spatial distribution of average wind speeds (m sec-1) over the San Gerardo pasture catchment between 1 July 2003 and 1 July 2004. Left-hand panel: wind speeds at 2.5 m height; right-hand panel: wind speeds at vegetation height. Isolated trees (mostly orange) and blocks of remnant forest (red) stand out clearly.
Figure 17. Spatial patterns in annual rainfall inputs (mm) according to three interpolation and
modelling techniques, San Gerardo pasture catchment (1 July 2003 – 1 July 2004).
7 Possibly due to overestimation of wind speeds at vegetation level. Work on this in progress.

R7991_Final Technical Project_31 January 2006 Page 28 of 51
(5) Tentative water budgets were derived for the two micro-catchments at San Gerardo and are summarized in Table 3 below. The annual water balance equation for a catchment in the cloud belt reads:
P + HP = ET + Q + ∆S + L where: P = rainfall (areal) HP = (near-)horizontal rainfall including fog stripped by the vegetation ET = evapotranspiration Q = streamflow ∆S = change in soil water storage L = apparent underground catchment leakage (or gain). All values are expressed in mm year-1. Furthermore: ET = Et + Ei + Es where Et = evaporation from a dry vegetation surface (transpiration or soil water uptake); Ei = evaporation from a wetted vegetation surface (interception evaporation); and Es = evaporation from the bare soil (negligible in dense vegetations). Finally: Q = Qb + Qs where Qb = baseflow (groundwater outflow between rain storms) and Qs = stormflow (the increased discharge during and shortly after rain storms, often also called ‘quickflow’). In view of the uncertainty in the estimation of catchment-wide inputs of precipitation (vertical, inclined and horizontal) commented upon earlier, the inferred amounts of subterranean catchment leakage from the two catchments (by solving the water budget equation for L) in Table 3 are at least as uncertain. Yet the derived values, although very high at ca. 9 mm day-1, are plausible enough in view of the tectonically broken nature of the volcanic terrain and close to saturated hydraulic conductivity values determined for the subsoil. Further support may be derived from the good agreement (within 2%) between the respective estimates for the two catchments. At the same time such high leakage values point to the danger of ‘direct’ comparisons of streamflow volumes from catchments with contrasting vegetation types in this kind of terrain. Because of the similarity in vegetation water use, precipitation inputs and deep leakage are more important determinants of streamflow than vegetation type per se under these headwater conditions. Table 3. Catchment water budget for cloud forest and pasture at San Gerardo, 1 July 2003 – 1 July 2004. Values rounded off to the nearest 5 mm. See text for explanation. Vegetation / Water budget component P HP ET Q ∆S L Cloud forest 6275* 685 785 2735 +50 3390 Pasture 6500 815 855# 2950 +50 3460 * Derived from average net precipitation plus interception evaporation minus HP. # Actual value measured at pasture site and therefore different from normalized value used for pasture in Table 2. (6) The rate of baseflow recession during the dry season (January-April) was roughly twice as fast for the San Gerardo pasture catchment compared to that for the nearby cloud forest catchment (Figure 18), despite the fact that the pasture catchment was roughly three times as large and therefore should possess a larger groundwater reservoir. The rate of recession closely followed soil water depletion rates, adding further substance to the observed contrast. It would be premature,

R7991_Final Technical Project_31 January 2006 Page 29 of 51
however, to attribute the slower recession to the presence of cloud forest. Not only were precipitation inputs slightly larger for the forest area but the radiation load experienced by the grassland was higher as well and roughly matched the difference in flow (Figure 18). The higher radiation, in turn, reflects the greater elevation of the pasture catchment which is situated closer to the top of the regional cloud bank. Such findings once again illustrate the danger of ‘direct’ comparisons of hydrological behaviour and attributing the difference to contrasts in vegetation type only.
Figure 18. Baseflow recession during the 2003/04 dry season in the San Gerardo catchments.
Amounts of ordinary rainfall, radiation and inclined rainfall added for comparative purposes. (7) Stormflow (or quickflow) volumes from the two micro-catchments were determined by connecting the point on the discharge vs. time graph (hydrograph) where the discharge begins to rise, with the inflection point (also called point of discontinuity) on the falling limb of the hydrograph (see adjacent diagram). All flow above the straight separation line is called stormflow / quickflow, whereas the flow below the line is assigned to baseflow. Discharges during times of rainfall increase because of: (i) rain falling directly onto the channel (usually a minor contribution); (ii) lateral subsurface flow down the slopes (throughflow); and (iii) overland flow running downslope along the surface. Runoff separation, definition of terms.
R7991_Final Technical Project_31 January 2006 Page 30 of 51
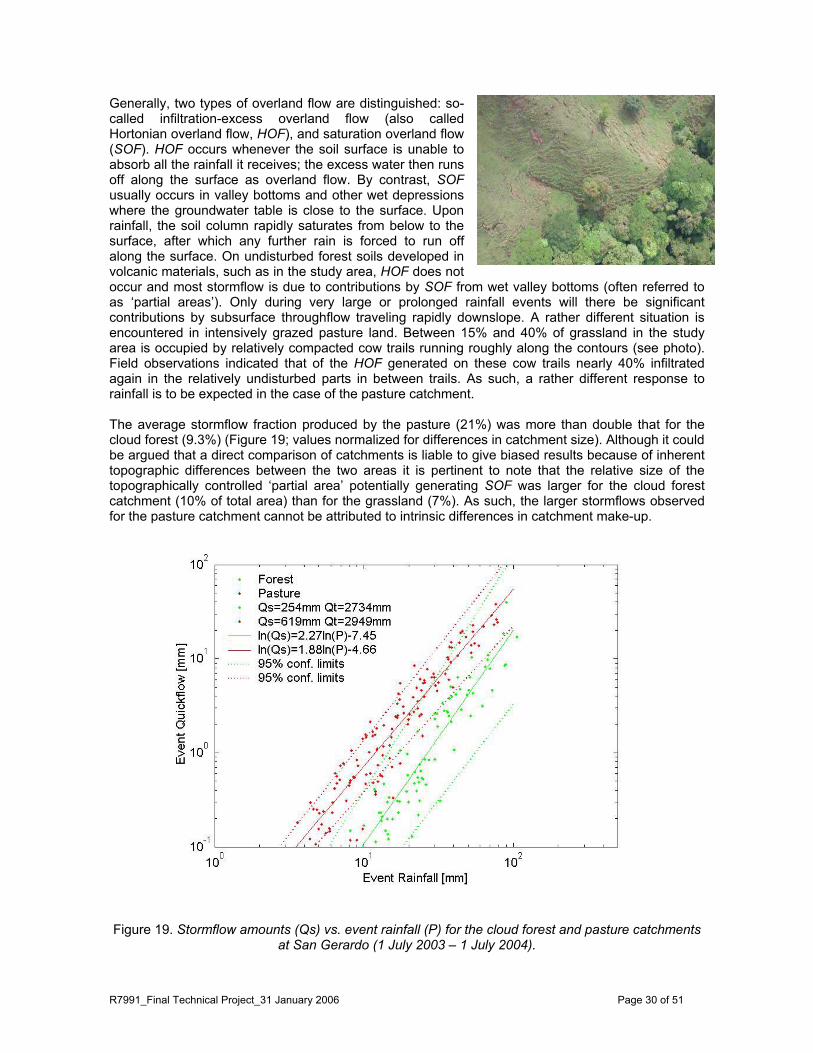
Generally, two types of overland flow are distinguished: so-called infiltration-excess overland flow (also called Hortonian overland flow, HOF), and saturation overland flow (SOF). HOF occurs whenever the soil surface is unable to absorb all the rainfall it receives; the excess water then runs off along the surface as overland flow. By contrast, SOF usually occurs in valley bottoms and other wet depressions where the groundwater table is close to the surface. Upon rainfall, the soil column rapidly saturates from below to the surface, after which any further rain is forced to run off along the surface. On undisturbed forest soils developed in volcanic materials, such as in the study area, HOF does not occur and most stormflow is due to contributions by SOF from wet valley bottoms (often referred to as ‘partial areas’). Only during very large or prolonged rainfall events will there be significant contributions by subsurface throughflow traveling rapidly downslope. A rather different situation is encountered in intensively grazed pasture land. Between 15% and 40% of grassland in the study area is occupied by relatively compacted cow trails running roughly along the contours (see photo). Field observations indicated that of the HOF generated on these cow trails nearly 40% infiltrated again in the relatively undisturbed parts in between trails. As such, a rather different response to rainfall is to be expected in the case of the pasture catchment. The average stormflow fraction produced by the pasture (21%) was more than double that for the cloud forest (9.3%) (Figure 19; values normalized for differences in catchment size). Although it could be argued that a direct comparison of catchments is liable to give biased results because of inherent topographic differences between the two areas it is pertinent to note that the relative size of the topographically controlled ‘partial area’ potentially generating SOF was larger for the cloud forest catchment (10% of total area) than for the grassland (7%). As such, the larger stormflows observed for the pasture catchment cannot be attributed to intrinsic differences in catchment make-up.
Figure 19. Stormflow amounts (Qs) vs. event rainfall (P) for the cloud forest and pasture catchments at San Gerardo (1 July 2003 – 1 July 2004).
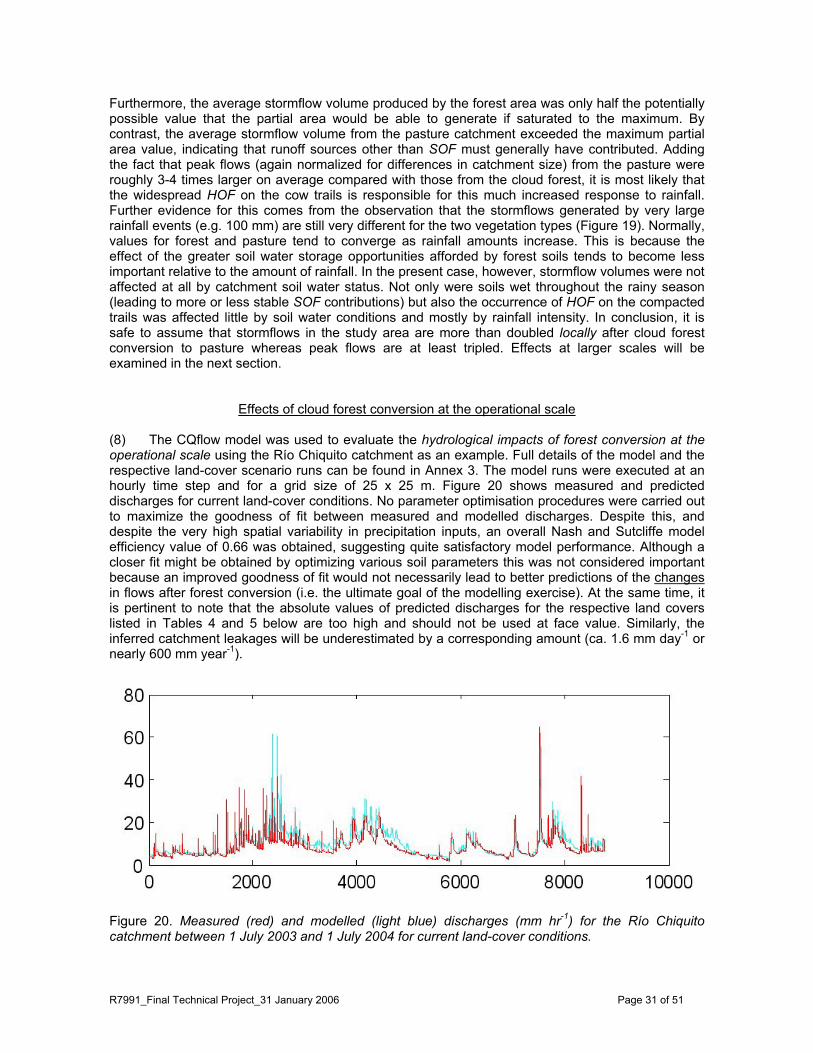
R7991_Final Technical Project_31 January 2006 Page 31 of 51
Furthermore, the average stormflow volume produced by the forest area was only half the potentially possible value that the partial area would be able to generate if saturated to the maximum. By contrast, the average stormflow volume from the pasture catchment exceeded the maximum partial area value, indicating that runoff sources other than SOF must generally have contributed. Adding the fact that peak flows (again normalized for differences in catchment size) from the pasture were roughly 3-4 times larger on average compared with those from the cloud forest, it is most likely that the widespread HOF on the cow trails is responsible for this much increased response to rainfall. Further evidence for this comes from the observation that the stormflows generated by very large rainfall events (e.g. 100 mm) are still very different for the two vegetation types (Figure 19). Normally, values for forest and pasture tend to converge as rainfall amounts increase. This is because the effect of the greater soil water storage opportunities afforded by forest soils tends to become less important relative to the amount of rainfall. In the present case, however, stormflow volumes were not affected at all by catchment soil water status. Not only were soils wet throughout the rainy season (leading to more or less stable SOF contributions) but also the occurrence of HOF on the compacted trails was affected little by soil water conditions and mostly by rainfall intensity. In conclusion, it is safe to assume that stormflows in the study area are more than doubled locally after cloud forest conversion to pasture whereas peak flows are at least tripled. Effects at larger scales will be examined in the next section.
Effects of cloud forest conversion at the operational scale (8) The CQflow model was used to evaluate the hydrological impacts of forest conversion at the operational scale using the Río Chiquito catchment as an example. Full details of the model and the respective land-cover scenario runs can be found in Annex 3. The model runs were executed at an hourly time step and for a grid size of 25 x 25 m. Figure 20 shows measured and predicted discharges for current land-cover conditions. No parameter optimisation procedures were carried out to maximize the goodness of fit between measured and modelled discharges. Despite this, and despite the very high spatial variability in precipitation inputs, an overall Nash and Sutcliffe model efficiency value of 0.66 was obtained, suggesting quite satisfactory model performance. Although a closer fit might be obtained by optimizing various soil parameters this was not considered important because an improved goodness of fit would not necessarily lead to better predictions of the changes in flows after forest conversion (i.e. the ultimate goal of the modelling exercise). At the same time, it is pertinent to note that the absolute values of predicted discharges for the respective land covers listed in Tables 4 and 5 below are too high and should not be used at face value. Similarly, the inferred catchment leakages will be underestimated by a corresponding amount (ca. 1.6 mm day-1 or nearly 600 mm year-1).
Figure 20. Measured (red) and modelled (light blue) discharges (mm hr-1) for the Río Chiquito catchment between 1 July 2003 and 1 July 2004 for current land-cover conditions.

R7991_Final Technical Project_31 January 2006 Page 32 of 51
In the first land-cover change scenario, all cloud forest (i.e. all forest above 1400 m elevation) was removed whereas vegetation in the remainder of the catchment was kept as it was in 2001 (Figures 21 and 8b). The effect on overall streamflow was negligible at +15 mm year-1 (cf. Table 4 below). The reason for this lack of hydrological change relates to the fact that some of the highest horizontal precipitation inputs were recorded for parts of the catchment situated (just) below 1400 m. At the same time, the model predicted an overall increase in hillslope infiltration-excess overland flow of ca. 100 mm (see Figure 17 in Annex 3). Whilst only a fraction of this water will actually reach the main stream (due to re-infiltration as the water travels downslope) this finding illustrates the increase in hillslope erosion hazard after forest conversion to grazed pasture.
Figure 21. Land-cover scenario (1) for the Río Chiquito catchment: all (cloud) forest above 1400 m elevation converted to pasture, remaining land cover as present. Yellow: pasture, grey: secondary forest, light blue: rain forest. To assess the hydrological impact of a more complete conversion of forest (i.e. both cloud forest and other forests below the main cloud belt) to pasture, the model was run for the 1975 situation (80% forested, 20% pastures in lowlands) and compared with the results for a (hypothetical) situation with pasture only. The overall change in water yield was an increase of 150 mm year-1 (+4.3%). Although inputs of horizontal precipitation were reduced (by 27%) by the removal of the (headwater) forest, so was vegetation water use (evaporation) but to a larger extent (-37%), leading to a minor net increase in annual flow (Table 4). Table 4. Summary of modelled water balance impacts of various land-cover changes in the Río Chiquito catchment. Values for input and output terms rounded off to the nearest 5 mm. Scenario / Component P HP Et Ei Q Leakage Storage mm mm % mm % mm % mm % Mm % mm Current land cover 4680 590 100 465 100 490 100 3500 100 663 100 151 1975 cover (80% forest) 4680 635 107 490 105 540 111 3475 99 658 99 149
Pasture 4680 430 73 375 80 275 56 3625 104 683 103 157 No cloud forest (above 1400 m) 4680 545 92 455 97 440 91 3515 100 664 100 151
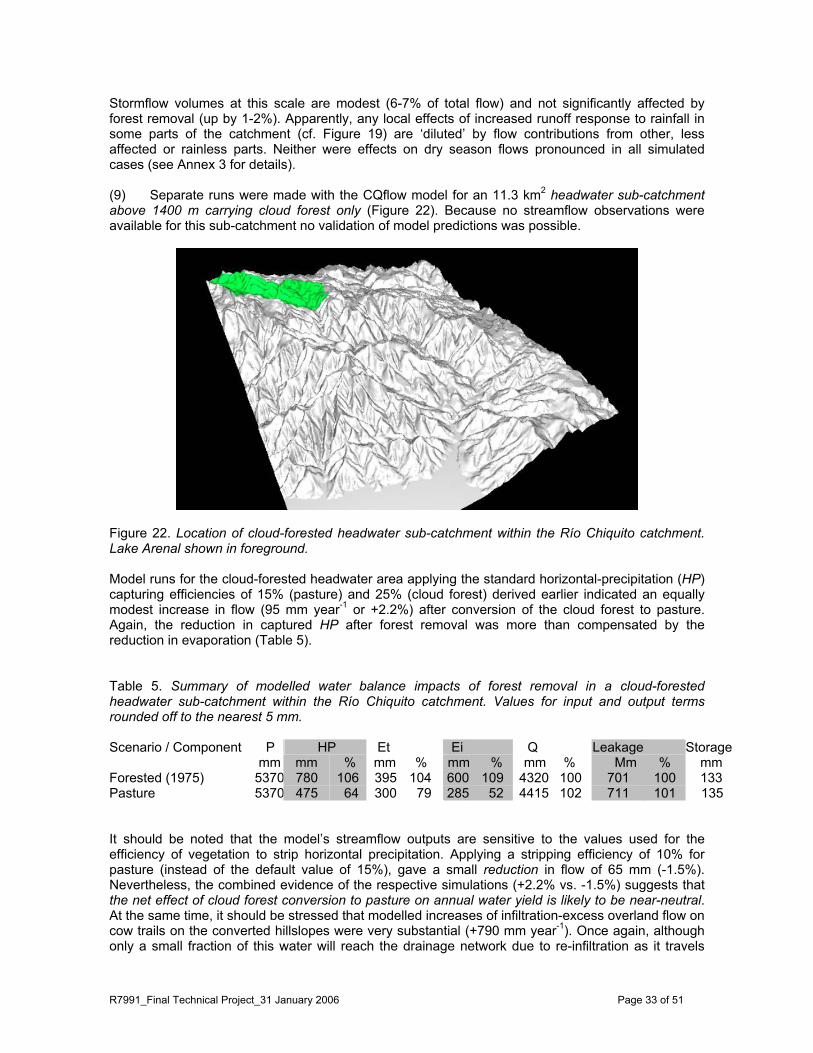
R7991_Final Technical Project_31 January 2006 Page 33 of 51
Stormflow volumes at this scale are modest (6-7% of total flow) and not significantly affected by forest removal (up by 1-2%). Apparently, any local effects of increased runoff response to rainfall in some parts of the catchment (cf. Figure 19) are ‘diluted’ by flow contributions from other, less affected or rainless parts. Neither were effects on dry season flows pronounced in all simulated cases (see Annex 3 for details). (9) Separate runs were made with the CQflow model for an 11.3 km2 headwater sub-catchment above 1400 m carrying cloud forest only (Figure 22). Because no streamflow observations were available for this sub-catchment no validation of model predictions was possible.
Figure 22. Location of cloud-forested headwater sub-catchment within the Río Chiquito catchment. Lake Arenal shown in foreground. Model runs for the cloud-forested headwater area applying the standard horizontal-precipitation (HP) capturing efficiencies of 15% (pasture) and 25% (cloud forest) derived earlier indicated an equally modest increase in flow (95 mm year-1 or +2.2%) after conversion of the cloud forest to pasture. Again, the reduction in captured HP after forest removal was more than compensated by the reduction in evaporation (Table 5). Table 5. Summary of modelled water balance impacts of forest removal in a cloud-forested headwater sub-catchment within the Río Chiquito catchment. Values for input and output terms rounded off to the nearest 5 mm. Scenario / Component P HP Et Ei Q Leakage Storage mm mm % mm % mm % mm % Mm % mm Forested (1975) 5370 780 106 395 104 600 109 4320 100 701 100 133 Pasture 5370 475 64 300 79 285 52 4415 102 711 101 135 It should be noted that the model’s streamflow outputs are sensitive to the values used for the efficiency of vegetation to strip horizontal precipitation. Applying a stripping efficiency of 10% for pasture (instead of the default value of 15%), gave a small reduction in flow of 65 mm (-1.5%). Nevertheless, the combined evidence of the respective simulations (+2.2% vs. -1.5%) suggests that the net effect of cloud forest conversion to pasture on annual water yield is likely to be near-neutral. At the same time, it should be stressed that modelled increases of infiltration-excess overland flow on cow trails on the converted hillslopes were very substantial (+790 mm year-1). Once again, although only a small fraction of this water will reach the drainage network due to re-infiltration as it travels

R7991_Final Technical Project_31 January 2006 Page 34 of 51
down the slopes, such numbers point to a much increased erosion hazard after clearing (see Annex 3 for details). The instantaneous and cumulative changes in flows shown in Figures 23 and 24 illustrate the minor changes in (dry season) baseflows, and the slight increases in stormflows that can be expected to occur after cloud forest conversion at this scale.
Figure 23. Predicted changes in discharge (mm hr-1) after the conversion of a headwater cloud forest sub-catchment to pasture.
Figure 24. Modelled cumulative changes in discharge (mm) after the conversion of a headwater cloud forest sub-catchment to pasture (using default values for the vegetation’s stripping efficiency).
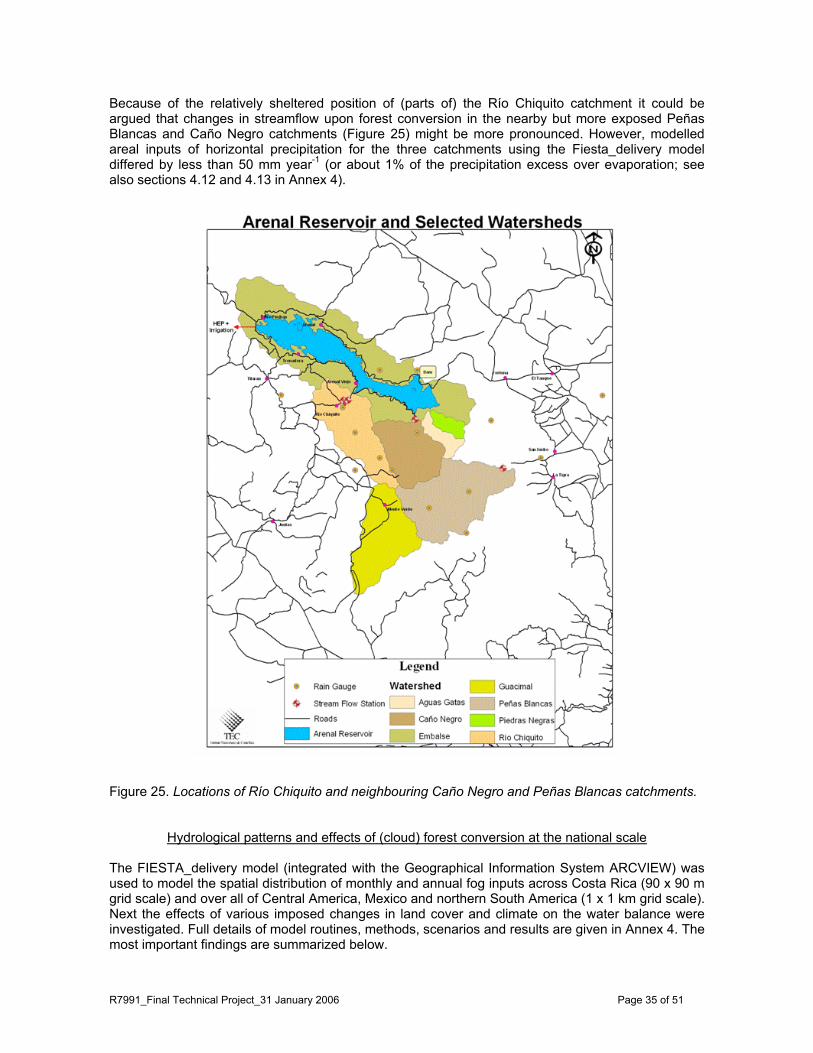
R7991_Final Technical Project_31 January 2006 Page 35 of 51
Because of the relatively sheltered position of (parts of) the Río Chiquito catchment it could be argued that changes in streamflow upon forest conversion in the nearby but more exposed Peñas Blancas and Caño Negro catchments (Figure 25) might be more pronounced. However, modelled areal inputs of horizontal precipitation for the three catchments using the Fiesta_delivery model differed by less than 50 mm year-1 (or about 1% of the precipitation excess over evaporation; see also sections 4.12 and 4.13 in Annex 4).
Figure 25. Locations of Río Chiquito and neighbouring Caño Negro and Peñas Blancas catchments.
Hydrological patterns and effects of (cloud) forest conversion at the national scale The FIESTA_delivery model (integrated with the Geographical Information System ARCVIEW) was used to model the spatial distribution of monthly and annual fog inputs across Costa Rica (90 x 90 m grid scale) and over all of Central America, Mexico and northern South America (1 x 1 km grid scale). Next the effects of various imposed changes in land cover and climate on the water balance were investigated. Full details of model routines, methods, scenarios and results are given in Annex 4. The most important findings are summarized below.
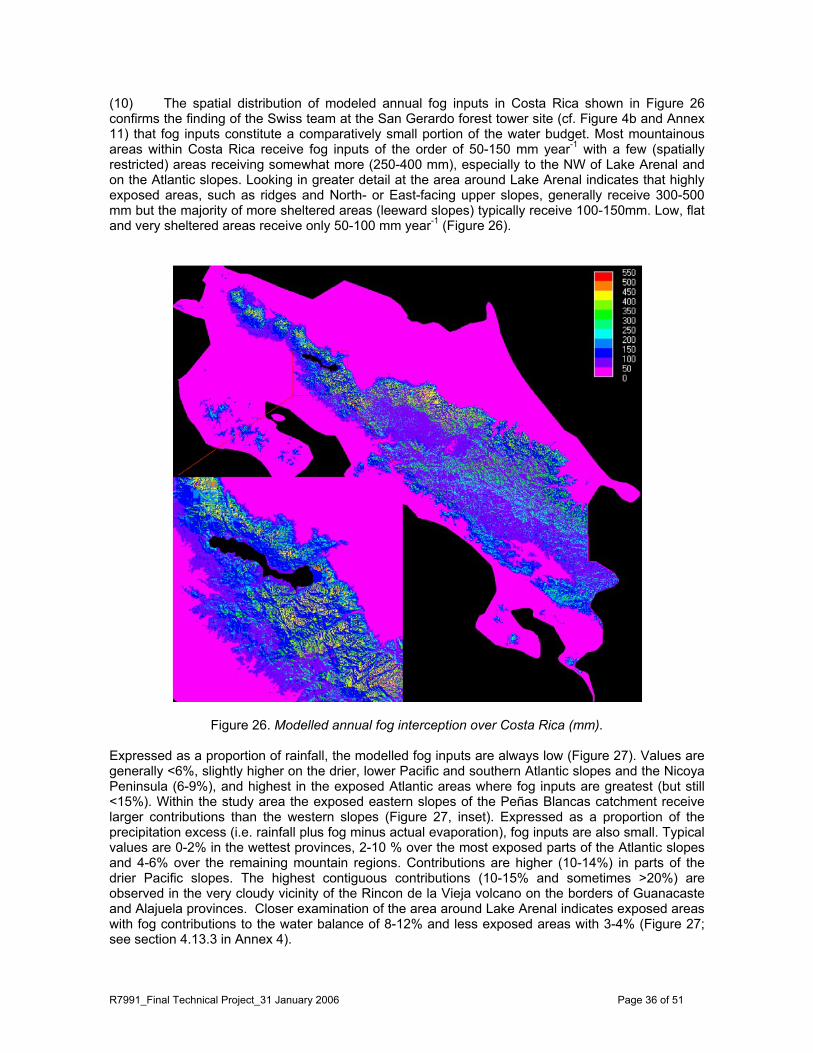
R7991_Final Technical Project_31 January 2006 Page 36 of 51
(10) The spatial distribution of modeled annual fog inputs in Costa Rica shown in Figure 26 confirms the finding of the Swiss team at the San Gerardo forest tower site (cf. Figure 4b and Annex 11) that fog inputs constitute a comparatively small portion of the water budget. Most mountainous areas within Costa Rica receive fog inputs of the order of 50-150 mm year-1 with a few (spatially restricted) areas receiving somewhat more (250-400 mm), especially to the NW of Lake Arenal and on the Atlantic slopes. Looking in greater detail at the area around Lake Arenal indicates that highly exposed areas, such as ridges and North- or East-facing upper slopes, generally receive 300-500 mm but the majority of more sheltered areas (leeward slopes) typically receive 100-150mm. Low, flat and very sheltered areas receive only 50-100 mm year-1 (Figure 26).
Figure 26. Modelled annual fog interception over Costa Rica (mm). Expressed as a proportion of rainfall, the modelled fog inputs are always low (Figure 27). Values are generally <6%, slightly higher on the drier, lower Pacific and southern Atlantic slopes and the Nicoya Peninsula (6-9%), and highest in the exposed Atlantic areas where fog inputs are greatest (but still <15%). Within the study area the exposed eastern slopes of the Peñas Blancas catchment receive larger contributions than the western slopes (Figure 27, inset). Expressed as a proportion of the precipitation excess (i.e. rainfall plus fog minus actual evaporation), fog inputs are also small. Typical values are 0-2% in the wettest provinces, 2-10 % over the most exposed parts of the Atlantic slopes and 4-6% over the remaining mountain regions. Contributions are higher (10-14%) in parts of the drier Pacific slopes. The highest contiguous contributions (10-15% and sometimes >20%) are observed in the very cloudy vicinity of the Rincon de la Vieja volcano on the borders of Guanacaste and Alajuela provinces. Closer examination of the area around Lake Arenal indicates exposed areas with fog contributions to the water balance of 8-12% and less exposed areas with 3-4% (Figure 27; see section 4.13.3 in Annex 4).

R7991_Final Technical Project_31 January 2006 Page 37 of 51
Figure 27. Annual fog interception as a percentage of precipitation excess. Aggregating water fluxes by catchment area (for all major catchments draining to the sea or inland water bodies) provides a better indication of the area-average fluxes (Figure 28). Fog inputs are clearly greatest for small catchments in the mountains and catchment average values of up to 240 mm year-1 can be observed for the catchments draining into Lake Arenal. These actually represent the highest values in the entire country, largely because they are small mountain-only catchments (Figure 28, top-left panel). Predominantly lowland catchments on the Atlantic or Pacific slopes have areal fog inputs close to zero. Mixed-elevation catchments have values between 40 and 120 mm that are similar for Pacific and Atlantic slopes. Wind-driven rainfall inputs are invariably highest for the Atlantic catchments, including the Chiquito and Caño Negro catchments in the Arenal area (Figure 28, top-right panel). Catchment evapotranspiration is lowest for those Atlantic catchments with significant montane contributions and highest for solely lowland and Pacific catchments (Figure 28, bottom-left panel). Evapotranspiration is also low for the small mountainous catchments draining into Lake Arenal by nature of their size and location largely within a cloudy, foggy region. Entirely lowland Atlantic catchments have higher evapotranspiration. This means that, by catchment, excess amounts of water (i.e. potential runoff) are lowest (<1000 mm) over the majority of Guanacaste in the NW of the country, vs. less than 2500 mm for most other Pacific catchments, and between 2000 and 4000 mm for most Atlantic catchments (Figure 28, bottom-right panel). An analysis of fog as a percentage of the water balance by catchment indicates that fog is always <7% and is greatest (4-7%) in the small catchments draining into Lake Arenal (and in several central Pacific catchments receiving very low rainfall). Larger Atlantic catchments have fog contributions of 1-3.5% and larger Pacific catchments 1.5-4% (see section 4.13.7 in Annex 4 for details).

R7991_Final Technical Project_31 January 2006 Page 38 of 51
Figure 28. Total fog inputs (top left), wind-driven rainfall (top right), water balance (i.e. precipitation minus evapotranspiration, bottom left), and evapotranspiration (bottom right) by catchment, all values in mm year-1.
(11) Though annual total figures do not indicate large contributions by fog interception to (catchment) water balances in Costa Rica, the climate is highly seasonal and it is thus important to analyze the seasonality of fog contributions to the water balance (i.e. to potential runoff). Figure 29 shows ‘fog runoff’ as a percentage of ‘rainfall runoff’ by month. Fog runoff is defined here as fog inputs minus evapotranspiration of fog water, cumulated downstream. It is important to note that both fog runoff and ordinary (i.e. rain-originated) runoff represent runoff produced from current rainfall and do not include runoff which results from the release of groundwater stores from previous rainfall (i.e. baseflow). The inclusion of baseflows would tend to reduce the fog runoff percentages suggested here, especially in the dry season (though some of that baseflow might also be derived from previous fog). Nevertheless, one obtains a good picture of the spatial patterns of fog contributions to runoff production, if not of total runoff, through time.
In January there are peaks of fog contribution in the north and in the central Pacific areas and over the Nicoya Peninsula. Some of the rivers draining to the Pacific in the very north and south of the country reach fog contributions of 25-35% of the rainfall contribution whereas streams within the cloud forests themselves can reach >50% fog contribution (Figure 29). This continues through February and declines in intensity in March. From May until October the fog contribution to all rivers

R7991_Final Technical Project_31 January 2006 Page 39 of 51
outside the mountain areas is ca. 1% vs. up to 15% locally in the cloud forests. By November local contributions increase again in extent (but are still <15% in magnitude) and are concentrated once more in the central Pacific catchments, the most northerly mountains and the Nicoya Peninsula but with little in the way of contribution to the lowland rivers which emanate from these uplands. By December a similar situation occurs as in January, with >50% in the central Pacific peaks and the Nicoya Peninsula, and 10-25% elsewhere in the Pacific region.
Figure 29. Annual progression of monthly fog contribution to runoff. Top left: January, bottom right: December. Note: where there is no fog runoff or no rainfall runoff, a value of zero is given (pink areas) because percentages would be unrepresentative.
(12) To assess the spatial effects of changes in land cover or climate on the water budget various scenarios were imposed and run with the FIESTA_delivery model. In the first scenario land-cover change was allowed to continue at current rates outside of protected areas but some form of a Payment for Environmental Services scheme maintained a situation in which no land-use change was allowed within the current protected areas system. Application of this ‘PES scenario’ indicated rather modest changes in fog inputs and evapotranspiration outside of protected areas (i.e. where land use changed). Average fog inputs were reduced by ca. 20 mm year-1 although reductions of up to 200 mm year-1 were predicted for individual pixels. Reductions in evapotranspiration consequent with the replacement of forest cover with pasture were greatest in the lowlands and lower in the mountains where contrasts in vegetation take on less significance because the high cloud cover limits radiation (and thus evaporation). The overall change in water balance (potential runoff) resulting from the changes in fog incidence and evaporation is shown in Figure 30 and indicates no change in the protected areas (as prescribed), modest increases (40-50 mm year-1) in non-protected mountainous areas, and somewhat stronger increases (60-70 mm year-1) in unprotected lowlands. On a few spatially restricted montane slopes, changes in forest fragmentation led to stronger declines in fog interception as a result of forest loss than the decrease in evaporation and in these - highly exposed - areas an overall reduction in water balance was observed, but these are rather rare.

R7991_Final Technical Project_31 January 2006 Page 40 of 51
Figure 30. Difference in water balance (potential runoff) between baseline situation (current land cover) and a scenario in which non-protected forest is gradually converted to pasture (mm year-1). In the next scenario, no PES payments were provided for conservation of the current protected areas system and thus deforestation was allowed to continue at recent rates both outside and inside of the protected area system. Basically the same patterns emerged in this scenario (not shown) as for the previous scenario, except that the effects of deforestation occurred also in protected areas and so the effects at the national scale were greater. Evapotranspiration declined both in the lowlands but also, to a lesser extent, throughout the montane region. This resulted in a general increase in the water balance of around 40-60 mm in the mountains vs. 80-100mm in the lowlands, but also in a decrease in potential runoff (by 40-100 mm) in a few isolated, exposed cloud forest areas (where the modeled decline in fog inputs was greatest).
Changes in fog water inputs and evapotranspiration associated with a third scenario, in which land-cover change occurred at recent rates but only in unprotected forests above 1400 m elevation (i.e. cloud forests) were again modest (Figure 31; see Section 4.15.3 in Annex 4 for further details). These predicted increases in flows are very similar to that obtained with the FIESTA_CQflow model after clearing the cloud forest headwater area of the Río Chiquito catchment (Figure 23 and Table 5).
Finally, according to the current generation of climate models Costa Rica is subjected to a decrease in rainfall and an increase in temperature. The higher temperatures will raise the lifting condensation level of the air and therefore affect fog inputs along a narrow altitudinal band. In addition, evaporation losses will be increased. Predicted reductions in fog input are mainly around 10 mm year-1 and occasionally larger (see Section 4.14.4 in Annex 4). Typical increases in evapotranspiration are in the order of 10-20 mm year-1 across much of the country, with smaller changes around cloudy mountain peaks (<10 mm year-1) and 20-25 mm year-1 in areas where the cloud base will be raised (not shown). However, the overall effect of climate change on the water budget is dominated by the projected decrease in rainfall and amounts to typical reductions in potential runoff of 100-150 mm

R7991_Final Technical Project_31 January 2006 Page 41 of 51
year-1 with greater changes (around 300 mm) on rainfall-exposed slopes and lesser changes (<100 mm/yr) on sheltered slopes (Figure 32).
Figure 31. Differences in fog inputs (left) and overall water balance (right) between the baseline and ‘unprotected cloud forest removed’ scenarios (values in mm year-1).
Figure 32. Difference in water balance (potential runoff) between the baseline and climate change scenarios (mm year--1).

R7991_Final Technical Project_31 January 2006 Page 42 of 51
Chief policy-relevant outcomes8 The main policy-relevant outcomes of the present work can be summarized as follows: Fog inputs and cloud forest hydrology
• Fog inputs tend to be relatively low (mostly <150 mm year-1) except at a few, highly exposed sites which usually have high rainfall inputs too.
• In much of Central America these inputs are a small (<5%) contribution to the overall water
balance because of high rainfall and low evapotranspiration in the cloud forest belt. Fog inputs are much more significant to water balances in northern Central America (e.g. Honduras) and Mexico, where rainfall inputs are lower.
• Fog contributes significantly to some streamflows within cloud forests but rarely represents
more than 1-2% of the flow of major downstream (lowland) rivers. Fog contributions are seasonally significant even in Costa Rica in areas with pronounced dry seasons during which fog inputs are maintained.
Overall: fog inputs to cloud forests are of minor importance for water balances upstream of high rainfall areas but can be important (especially seasonally) upstream of dry areas. Land use change impacts: methods
• Process modeling provides insight into the magnitude and spatial variability of fog and rainfall contributions to catchments. The FIESTA_CQflow and Fog_delivery models developed here validate well where high quality validation data are available.
• Providing accurate spatial rainfall data is still the greatest challenge to hydrological budgeting
in windward tropical mountains (even at small scales) and as a result such budgets are likely to be rather inaccurate (even if they do close). Catchment water budget closure can also occur if a number of components are inaccurate but in opposing directions. Thus obtaining catchment water budget closure is not necessarily a reliable method of estimating particular hydrological fluxes, especially in highly spatially variable environments or in tectonically active mountain zones (like Central America) where there is no guarantee that the catchments are watertight.
Overall: there is still a good deal of work to do in understanding the hydrological budgets of (especially windward) tropical montane catchments and as will be argued below, this creates difficulties in the implementation of Payments for Environmental Services schemes. Land use change impacts: results
• Forest conversion to pasture increases total flow amounts because of reduced evapotranspiration (much less so for cloud forests). Any negative effects on total flows through reduced fog interception after cloud forest conversion are usually restricted to highly exposed areas and count for little at larger spatial scales.
• The much increased stormflows and peak flows observed after cloud forest conversion at the
local scale disappear at the operational scale due to the ‘diluting’ effect of spatial rainfall variability.
8 Largely based on the executive summary provided by Mulligan & Burke for Annex 4.

R7991_Final Technical Project_31 January 2006 Page 43 of 51
• Catchment water yields are significantly greater throughout the region today as a result of historic human impacts on the original forests, which have led to widespread reductions in evapotranspiration and thus increased flows. Although fog inputs to cloud forest areas are generally reduced upon forest removal (by reducing the available leaf area for fog deposition), inputs have sometimes increased because a fragmented forest captures more fog by lateral impaction than does a continuous forest cover.
• Hydrological impacts of forest conversion in complex terrain vary considerably in magnitude
from catchment to catchment and there are no ready rules of thumb that can be applied to extrapolate from one catchment to another. This is because a catchment’s response to land-cover change depends upon the pattern as well as the overall magnitude of the land-cover change, and on the specific climatic, topographic and other physical characteristics of the catchment as well as the scale of analysis. Therefore, detailed spatial modeling using appropriate data is a better approach than simple extrapolations.
• There are many other impacts of land-cover change than water quantity alone, including
water quality, biodiversity, carbon sequestration, soil erosion, slope stability, and scenic beauty, and these too must be considered for a more holistic view of the benefits (or non-benefits) of land-cover change.
• Expected climate change will have much greater impacts on flows than even severe land-
cover change and these effects will tend to be negative in Costa Rica because of the projected decreases in rainfall and increases in temperature (and therefore evaporation).
Overall: forest replacement by pasture overwhelmingly tends to increase annual streamflow quantities, albeit to a much lesser extent in the case of cloud forest conversion. Cloud forest areas can show reduced flows as a result of forest loss but these tend to be highly localized and are small in most downstream contexts. Non-hydrological impacts of forest conversion – notably deterioration of water quality, increased soil erosion and landslide hazards, and loss of biodiversity – also need to be taken into account for a more holistic assessment of the consequences of (cloud) forest removal. Implications of the present findings for Payments for Environmental Services (PES) schemes
• Charges for forest conservation on the basis of water quantity benefits alone seem less appropriate, though less so for the maintenance of dry season flows emanating from cloud forests in low (or very seasonal) rainfall areas. Charges based on other forest environmental services are probably more appropriate and should ideally be quantified and included.
• Catchments vary considerably in terms of the magnitude of land-use change impacts on
water quantities because of differing catchment characteristics and land-use patterns. Simple rules of thumb are not apparent. Thus, local PES schemes cannot be based on a generic assumption concerning the water resource value of ‘forest’, since each patch of each catchment will have a different value. Also, in some catchments or at some scales in a catchment the effect of forest on water resources may be different in direction as well as magnitude to that assumed. This implies considerable operational difficulties in the assignment of costs to downstream users for benefits that cannot be guaranteed. Ideally, PES schemes should be based on the cumulative benefits integrated across entire river basins or countries (see also the executive summary of Annex 4 for additional arguments).
Sophisticated spatial hydrological models are the best hope for systematically understanding the potential water benefits of forests within the landscape but these require catchment-specific data for each catchment in which a PES scheme is proposed. Ideally, PES schemes should not be local but rather be based on the cumulative benefits integrated across entire river basins or countries.

R7991_Final Technical Project_31 January 2006 Page 44 of 51
Products Apart from the hydrological field measurement protocol (Annex 2) and the distributed hydrological models developed to predict the hydrological impacts of (cloud) forest conversion to pasture at the operational (FIESTA_CQflow model, Annex 3) and national scale (FIESTA_delivery model, Annex 4), project outputs also include the following:
• Training course materials on the theory and methods underlying the quantification and/or prediction of changes in catchment water budgets following (cloud) forest conversion in complex terrain. These materials were presented during three successive workshops held for (a) Costa Rican parties working with forest and water issues (field course, Monteverde, August 2003 (Annex 5a)), (b) invited participants from Central and South America (field/office at Monteverde/Cartago, June 2004 (Annex 5b), and (c) all previously mentioned parties (model background and application, San José, June 2005 (Annexes 3bc and 4bc). By and large the respective training courses/workshops were well received by the participants (see reports in the respective annexes).
• A lavishly illustrated awareness-raising brochure in Spanish
(‘Tiempo decisivo para las selvas de neblina’) highlighting the biodiversity and hydrological values of montane cloud forests as well as the various threats faced by these unique ecosystems (Annex 6). Some 1500 copies were distributed freely among interested parties in Latin America (see also below under Promotion pathways).
• A 40-minute documentary on DVD (‘Mountains in the Mist’)
illustrating the biodiversity and hydrological values of the cloud forests of the Monteverde area; includes footage of the hydrological measurement campaign of the project and its overall socio-economic framework (Annex 7). Since its first screening during the International Symposium on Science for the Conservation and Management of Tropical Montane Cloud Forests in Hawaii in August 2005 the film has been viewed by thousands of people in over 25 countries (see also below under Promotion pathways).
• The most detailed climatic and hydrological database for Costa Rica ever produced, made
available at 90m resolution for hydrological and other research uses in the sophisticated Google Earth interface at http://www.ambiotek.com/fiesta/fiesta.kml
• A series of over 20 scientific papers has been planned by the project team to promote the
results of the project in scientific circles (Annex 8). To date one paper has been submitted to Plant Ecology (Annex 9) and five others are nearing completion and will be included in a state of the art review on cloud forest research which is to be published by the University of Hawaii Press in fall 20069. The remaining manuscripts are planned to be written over the next 18-24 months by the respective team members in various combinations and as time will allow, giving priority to submissions to some of the more highly profiled outlets such as Nature and Science in spring 2006.
• Five masters theses were completed during the project’s duration by students from the Vrije
Universiteit Amsterdam (3x), the University of Bern (1x) and the University of Utrecht (1x) participating in the project, plus one Bachelors thesis (Instituto Tecnologico de Costa Rica). With the exception of the work by Carvajal-Salás on rooting patterns under cloud forest and pasture (Annex 10) and by Schmid on fog inputs and quality (Annex 11) the (partly
9 These papers will be made available to DFID-FRP upon completion of the editorial process in spring 2006.

R7991_Final Technical Project_31 January 2006 Page 45 of 51
preliminary or incomplete) results listed in these theses are likely to be changed during the final data analysis. As such, they are not included here but may be requested from the project leader (see the list of project publications and outputs in Annex 12).
Contribution of outputs to DFID’s development goals Based on DFID’s classification of research as being predominantly ‘focused’ (i.e. emphasis on the rights, interests, and needs of very poor people), ‘inclusive’ (studying broad-based actions for improving opportunities and services generally, and addressing issues of equity and barriers to participation of poor people), or ‘enabling’ (actions which support the policies and context for poverty reduction and elimination), the present research can be classified as ‘enabling’. Although it does not address the needs of the poorest people in a direct manner, the information and tools (improved instrumentation, predictive hydrological models) generated by the project will contribute to optimum upland forest and water management, both in Costa Rica and other humid tropical mountainous areas. The socio-economic twin project conducted in the same area (R8174) can be classified as being both ‘focused’ and ‘inclusive’, thereby providing an ideal complement to the hydrology project. The present project marks the first serious attempt at obtaining sound quantitative information on the hydrological role of tropical montane cloud forest and on the hydrological impacts of cloud forest conversion to grazed pasture at the local to national scale. Such information is a conditio sine qua non for any payment scheme in which downstream beneficiaries compensate upland land owners for sustainable land and forest stewardship safeguarding a stable supply of good-quality water. As such, the project can be seen as contributing to the Millennium Development Goals which, on the one hand, aim to improve the water supply of the rural and urban poor, and on the other help reverse tropical forest loss. The FIESTA_ delivery model in particular has assisted in broadly identifying the ‘hot spots’ in Central America and neighbouring countries where the presence of montane forest can be expected to lead to enhanced water inputs to the soil due to the larger amounts of fog and horizontal (wind-driven) precipitation captured by tall forest vegetation compared to pasture or crops. The model also allows an estimate to be made of the changes in site water budgets associated with forest conversion to pasture (or the reverse) as well as of the effects of longer term climate change (gradually lower rainfall and higher temperatures) across the region. At the operational catchment scale, the FIESTA_CQflow model allows water managers to assess changes in streamflow patterns (seasonally and diurnally) following land-cover change. Finally, Costa Rica’s leading institute for managing the country’s water resources (the Instituto Costarricense de Electricidad, ICE) has indicated its intention to use the project’s improved equipment to measure rainfall under windy conditions (cf. Figure 4d). Together with the project’s hydrological models this will enable ICE to improve their estimates of spatial patterns of rainfall inputs in remote mountain locations and thus of overall amounts of available water. However, whilst there is thus reason to expect that the results obtained by the project will contribute to better water resources management practices in Costa Rica and elsewhere (see also the section on promotion of research results and products below), this is not to say that market-based payments for environmental services (PES) schemes will necessarily lead to improved livelihoods for the rural poor in the study area. The twin project R8174 has identified a number of important legal, economic and political constraints in this respect which need to be overcome first. For further details the reader is referred to the Final Technical Report for project R8174.10 Promotion pathways In the project’s dissemination strategy (Annex 13) a distinction is made between the promotion and dissemination of research results on the one hand and of the awareness-raising cloud forest documentary DVD and brochure on the other. Below, a summary of the promotional activities is
10 Or see R.A. Hope et al. (2005). Can markets for environmental services contribute to povery reduction? A livelihoods analysis from Arenal, Costa Rica. Published by …
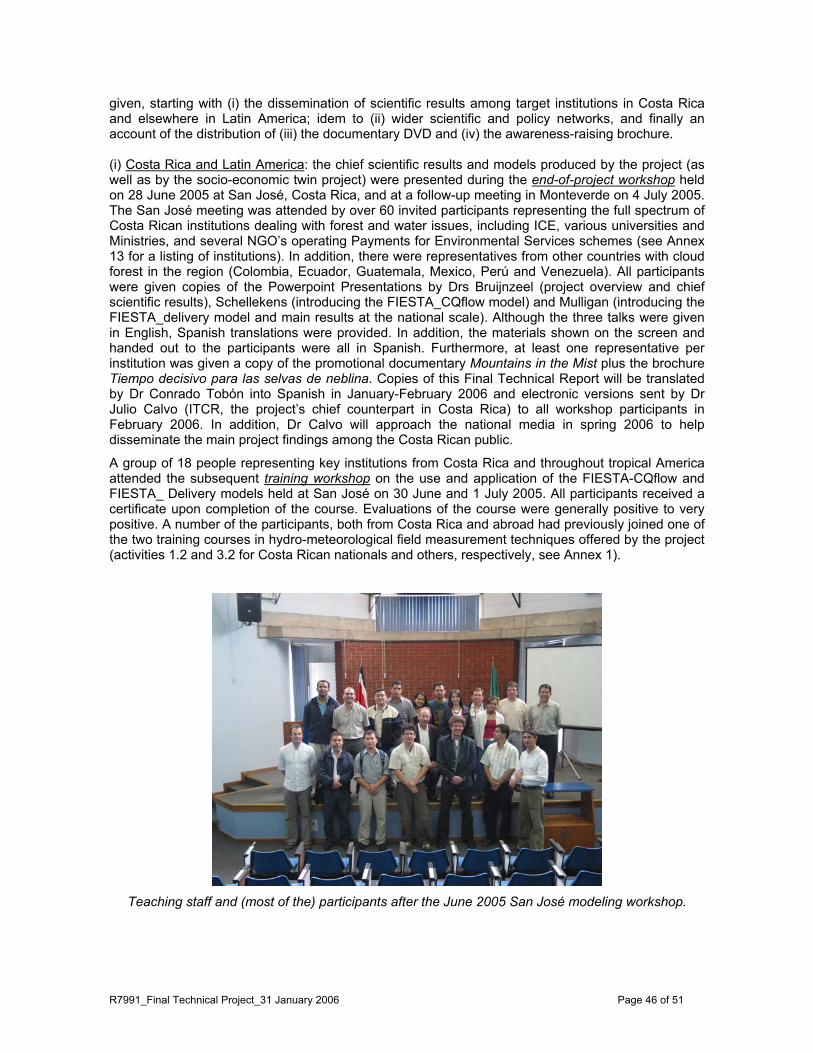
R7991_Final Technical Project_31 January 2006 Page 46 of 51
given, starting with (i) the dissemination of scientific results among target institutions in Costa Rica and elsewhere in Latin America; idem to (ii) wider scientific and policy networks, and finally an account of the distribution of (iii) the documentary DVD and (iv) the awareness-raising brochure. (i) Costa Rica and Latin America: the chief scientific results and models produced by the project (as well as by the socio-economic twin project) were presented during the end-of-project workshop held on 28 June 2005 at San José, Costa Rica, and at a follow-up meeting in Monteverde on 4 July 2005. The San José meeting was attended by over 60 invited participants representing the full spectrum of Costa Rican institutions dealing with forest and water issues, including ICE, various universities and Ministries, and several NGO’s operating Payments for Environmental Services schemes (see Annex 13 for a listing of institutions). In addition, there were representatives from other countries with cloud forest in the region (Colombia, Ecuador, Guatemala, Mexico, Perú and Venezuela). All participants were given copies of the Powerpoint Presentations by Drs Bruijnzeel (project overview and chief scientific results), Schellekens (introducing the FIESTA_CQflow model) and Mulligan (introducing the FIESTA_delivery model and main results at the national scale). Although the three talks were given in English, Spanish translations were provided. In addition, the materials shown on the screen and handed out to the participants were all in Spanish. Furthermore, at least one representative per institution was given a copy of the promotional documentary Mountains in the Mist plus the brochure Tiempo decisivo para las selvas de neblina. Copies of this Final Technical Report will be translated by Dr Conrado Tobón into Spanish in January-February 2006 and electronic versions sent by Dr Julio Calvo (ITCR, the project’s chief counterpart in Costa Rica) to all workshop participants in February 2006. In addition, Dr Calvo will approach the national media in spring 2006 to help disseminate the main project findings among the Costa Rican public.
A group of 18 people representing key institutions from Costa Rica and throughout tropical America attended the subsequent training workshop on the use and application of the FIESTA-CQflow and FIESTA_ Delivery models held at San José on 30 June and 1 July 2005. All participants received a certificate upon completion of the course. Evaluations of the course were generally positive to very positive. A number of the participants, both from Costa Rica and abroad had previously joined one of the two training courses in hydro-meteorological field measurement techniques offered by the project (activities 1.2 and 3.2 for Costa Rican nationals and others, respectively, see Annex 1).
Teaching staff and (most of the) participants after the June 2005 San José modeling workshop.

R7991_Final Technical Project_31 January 2006 Page 47 of 51
The workshop held at Monteverde was more of a local character and focused primarily on socio-economic issues dealt with by the twin project team of R8174. Hydrological aspects were presented by Dr Calvo to representatives of local institutions, including the Monteverde Institute, the Monteverde Conservation League, and the Children’s Rain Forest. Water quality rather than water quantity issues dominated the hydrological discussion, however. Finally, and on a more general note, as several project team members, associates and training participants lecture at universities and other institutes of higher learning throughout Central and South America, it is to be expected that the new knowledge generated by the project will be shared with much larger groups of students. (ii) Wider scientific and policy networks: preliminary research results were presented by various team members at the International Symposium on Science for Conservation and Management of Tropical Montane Cloud Forests, held in Hawaii, 27 July – 1 August 2004. This symposium drew together representatives from various scientific disciplines (mostly ecology and hydrology but also environmental economics and sociology), forest and park managers, and representatives of NGOs dealing with sustainable development and community participation, many from Latin America. The proceedings of the Symposium are expected to constitute a landmark publication on cloud forest hydrology and are to be published in fall 2006. Relevant scientific findings of the project will further be published through a series of manuscripts that will be submitted by the team to peer-reviewed international scientific journals over the next 1-2 years. Depending on the actual importance of the scientific results, publication in such high-impact journals like Nature and Science is considered (see Annex 8 for a list of prospective manuscript titles and outlets). Policy-relevant key points arising from the present work will also be disseminated (by the project leader) via short non-specialist articles in such outlets as the IUCN Bulletin, WWF’s ArborVitae, Fog Quest Newsletter and the European Tropical Rain Forest Ecology Network’s newsletter. Team member Dr Tobón will liaise with UNESCO’s Regional Office for Science and Technology in Latin America (ROSTLA, Montevideo, Dr Carlos Fernandes) and the Regional Centre for the Humid Tropics of Latin America and the Caribbean (CATHALAC, Panamá City, Dr Maria Donoso). Both centres run a number of networks for water resources planners, river basin managers, etc. that will help to disseminate the present findings in Latin American ‘watershed’ circles. A special effort will be made to reach environmental economists through several electronic newsletters (notably the POLEX list service run by D. Kaimowitz, and Flows-on line / News on Payments for Watershed Services by S. Tognetti). Last, but not least, the preliminary project website created in March 2004 (www.geo.vu.nl/~fiesta) will be advertised among all the above-mentioned parties as relevant research results and reports become available, including links to the FIESTA_Cqflow and FIESTA_delivery models. The 1 km version of the latter can also be downloaded directly from the Ambiotek website: http://www.ambiotek.com/fiesta/1km.exe. Finally, project activities and results were highlighted in the BBC Radio4 Documentary ‘Costing the Earth’ which was broadcast at 9 p.m. on 1 December 2005 (see http://www.bbc.co.uk/radio4/science/costingtheearth_20051201.shtml).
(iii) A ca. 40-minute awareness-raising documentary on DVD (‘Mountains in the Mist’) was produced in 2004 in collaboration with the Swiss-based firm Halsundbeinbruch film (www.halsundbeinbruch.ch) to highlight the biodiversity and hydrological values of montane cloud forests as well as illustrate the potential of payments for environmental services schemes as a possible conservation tool (project activity 3.3; Appendix 7). The documentary is available in English, Spanish and German. Co-sponsoring was obtained from the Vrije Universiteit Amsterdam, the Netherlands Committee for IUCN, and the Tropical Science Center (CCT), San José, Costa Rica. A preliminary version of the film was screened in August 2004 with great success at the International Symposium on Science for the Conseration and Management of Tropical Montane Cloud Forests, (Hawaii). The final product has since been

R7991_Final Technical Project_31 January 2006 Page 48 of 51
shown at more than 20 scientific institutions in as many different countries as well as at, inter alia, the World Exhibition 2005 (Aichi, Japan), the World Heritage Forum 2005 (Durban, Republic of South Africa), the Dijon International Adventure Film Festival (France), the International Mountaineering Film Festival (Czech Republic), the Week of the Trees, Veracruz State (Mexico) and, last but not least, a planned screening at the upcoming World Water Forum no. 4 (Mexico City, March 2006). About 500 copies of the film have been distributed to key institutions and persons all over the world. Since February 2005 the documentary has been offered for sale by CCT at the visitor’s centre of the Monteverde Cloud Forest Preserve in Costa Rica which boasts an annual number of visitors of ca. 70,000. The proceeds of the sales will go largely to the upkeep and extension of the Preserve. As such, it is no exaggeration to state that Mountains in the Mist has already reached thousands of people in its first year. Although a lack of time precluded the screening of the film during the end-of-project workshop in June 2005, free copies were handed out to representatives from each participating institution. Annex 13 also provides a more complete report on the film’s promotion. (iv) A Spanish version of a 40-page awareness-raising brochure originally entitled ‘Decision time for cloud forests’ was printed at a circulation of 1500 copies in December 2001 with joint funding from DFID-FRP and the Netherlands Committee for IUCN under the title ‘Tiempo decisivo para las selvas de neblina’ (Annex 6) These were distributed (by NC-IUCN and UNESCO) among: (i) the participants of the IVth International Symposium on Sustainable Development in the Andes, held at Mérida, Venezuela, 25 November – 2 December 2001; (ii) existing cloud forest networks in Latin America addressed by partner organisations of NC-IUCN; and (iii) members organizations of UNESCO’s International Hydrological Programme all over Latin America and the Caribbean. The document can also be accessed shortly via the UN Environmental Program - World Conservation Monitoring Centre’s website: www.unep-wcmc.org/forest/cloudforest/ and via the project’s website: www.geo.vu.nl/~fiesta. Follow-up actions to promote the project’s scientific findings and tools To date, the FIESTA_CQflow model has only been validated/tested in the study area. As a first step towards wider use of the model, special training sessions were held as part of the end-of-project workshop during which key representatives from Costa Rica, Central and South America and Mexico were acquainted with the FIESTA_CQflow and the larger-scale FIESTA_Delivery model (Annexes 3 and 4). Participants from Colombia, Mexico and Guatemala have since expressed an interest in conducting similar research in their respective areas whereas they and others (a.o. ICE) have also indicated their intention to start using the project’s models (see also below). An important and closely related development that will help spread the application of the project’s findings and tools concerns recently started follow-up research in the eastern Sierra Madre, Central Veracruz, Mexico. Funded by the Netherlands Foundation for the Advancement of Tropical Research, the project marks a collaborative effort between the Vrije Universiteit Amsterdam (VUA), Iowa State University, the Institute of Ecology, Xalapa, Mexico, and the National Autonomous University of Mexico (Mexico City) with several of the present team members (Drs Eugster, Mulligan and Tobón) providing key contributions. The climatic conditions in Veracruz are much less rainy and windy than in the Monteverde area, thereby presenting an interesting test case for the robustness of the project’s models. There is currently a tremendous interest in increasing the understanding of the hydrological functions of cloud-affected forests and effects of their removal, as well as in soundly based payments for environmental services schemes. As such, the experience gained in the current project will find almost immediate application in Mexico. Related developments involving project team members and expertise and technology developed by the project include: (i) plans by the Regional Office for IUCN in Quito, Ecuador, to start investigations into the hydrological function of paramó vegetation in Ecuador (Dr Tobón, National University, Medellin, Colombia); (ii) idem by WWF with respect to the hydrological role of cloud forest in the Sierra de las Minas, Guatemala (Dr Bruijnzeel, VUA and former training course participant Oscar Avalos of the National Institute of Forests of Guatemala); (iii) idem by the Smithsonian Institution of
R7991_Final Technical Project_31 January 2006 Page 49 of 51
Panamá with respect to the assessment of the importance of fog inputs to streamflow in western Panamá (Drs Bruijnzeel, VUA and Mulligan, King’s College); (iv) exploratory discussions between IUCN, VUA and the University of Bayreuth (Germany) to study the hydrological impacts of cloud forest removal and burning on Mount Kilimanjaro (Tanzania; prospective post-doc study by core field team member Arnoud Frumau with planned contributions again by Eugster, Mulligan and Tobón) using Dutch funding sources; and (v) collaborative work on the role of cloud forest in maintaining dry season flows in the Eastern Himalyas (Nepal, Bhutan, Assam, South-West China) with the International Center for Integrated Mountain Development (ICIMOD, Kathmandu, Nepal) (advisory role for Dr Bruijnzeel on fog measurement equipment), again with funding from The Netherlands Government. In conclusion, the technical experience and methodology developed by the project are likely to be applied already in the near future in as many as three different continents. Acknowledgements and disclaimer Project field researchers Arnoud Frumau MSc and Dr Conrado Tobón, with their field assistants Gabriel Sanchez, Eder Morales and Vanessa Barquero-Perez, have managed to collect one of the most comprehensive climatic, hydrological and soil data sets available to date for any tropical montane cloud forest environment. The fact that this was achieved under particularly trying conditions is a testimony to their persistence, ingenuity and motivation. Drs Jaap Schellekens and Mark Mulligan proved to be true modeling wizards and their contributions have increased the usefulness and policy relevance of the project immensely. All these people are thanked for their friendship, loyalty, patience in answering endless requests for clarification, and for their superior humour when under duress. Katelijne Rotschild and John Palmer of the Forestry Research Programme of DFID are thanked for their patience and generosity in their dealings with the project. Dr Julio Calvo is thanked for his facilitating efforts with various Costa Rican authorities and dissemination efforts. The hospitality afforded to the project and its team by the University of Costa Rica’s Agronomic Research Centre (soil physical laboratory), Don Francisco Espinoza (San Gerardo pasture catchment), Don Eulogio Jimenez-Porras (San Gerardo forest catchment) and Don Luis Barquero (Monte de Olivos secondary forest site) is gratefully acknowledged. Disclaimer: This publication is an output from a research project funded by the United Kingdom Department for International Development (DFID) for the benefit of developing countries. The views expressed are not necessarily those of DFID (R7991, Forestry Research Programme).

R7991_Final Technical Project_31 January 2006 Page 50 of 51
Suggested reading Aylward, B., Echeverría, J., Fernández, A., Porras, I., Allen, K. & Mejías, R. (1998). Economic
Incentives for Watershed Protection: A Case Study of Lake Arenal, Costa Rica. Final Report on the CREED Project, Vrije Universiteit, Amsterdam, and the International Institute for Environment and Development, London, 323 pp.
Barradas, V.L., Cervantes Perez, J. & Puchet Anyul, C. (2004). Evidencia de un cambio climatico en la region de las grandes montanes del Estado de Veracruz, Mexico. Paper presented at the Congreso Climatico, Spain, fall 2004.
Brown, M.B., et al. (1996). A Valuation analysis of the Role of Cloud Forests in Watershed Protection. Sierra de las Minas Biosphere Reserve, Guatemala and Cusuco N.P., Honduras. RARE Center for Tropical Conservation, Philadelphia, USA.
Bruijnzeel, L.A. (2001). Hydrology of tropical montane cloud forests: a reassessment. Land Use and Water Resources Research 1: 1.1-1.18. (www.luwrr.com)
Bruijnzeel, L.A. (2004). Hydrological functions of tropical forests: not seeing the soil for the trees? Agriculture Ecosystems and Environment 104: 185-228.
Calvo, J. (2000). Case study: payments for watershed services in Costa Rica. In: M.F. Price & N. Butt (Eds.), Forests in Sustainable Mountain Development. A State-of-Knowledge Report for 2000, pp. 428-429, CABI, Wallingford, U.K.
Chang, M.T. & Flannery, L.A. (2001). Spherical gauges for improving the accuracy of rainfall measurements. Hydrological Processes 15: 643-654.
Eugster, W., Burkard, R., Klemm, O. & Wrzesinsky, T. (2001). Fog deposition measurements with the eddy covariance method. In: R.S. Schemenauer & H. Puxbaum (Eds.),2nd Int. Conf. on Fog & Fog Collection. IDRC, Ottawa, pp. 193-196.
Holwerda, F., Burkard, R., Eugster, W., Scatena, F.N., Meesters, A.G.C.A. & Bruijnzeel, L.A. (2006). Estimating fog deposition at a Puerto rican elfin cloud forest site: comparison of the water budget and eddy-covariance methods. Hydrological Processes 20 (in press).
Hope, R.A., Porras, I.T. & Miranda, M. (2005). Can markets for environmental services contribute to povery reduction? A livelihoods analysis from Arenal, Costa Rica. DFID-FRP Project R8174 Report, University of Newcastle & International Institute for Environment and Development, 53 pp.
Ingwersen, J.B. (1985). Fog drip, water yield, and timber harvesting in the Bull Run municipal watershed, Oregon. Water Resources Bulletin 21: 469-473.
IUCN-ORMA (2001). Estado de la Conservación de los Bosques Nubosos en Meso-America. IUCN-ORMA, San José, 75 pp. plus 7 annexes.
Lawton, R.O., Nair, U.S., Pielke Sr., R.A. & Welch, R.M. (2001). Climatic impact of tropical lowland deforestation on nearby montane cloud forests. Science 294: 584-587.
Manson, R. (2004). Los servicios hidrologicos y la conservacion de los bosques de Mexico. Madera y Bosques 10: 3-20.
Mulligan, M. & Burke, S.M. (2005). DFID-FRP Project ZF0216 Global cloud forests and environmental change in a hydrological context. Final Report. December 2005 (http://www.ambiotek.com/cloudforests).
Pagiola, S., Bishop, J. & Landell-Mills, N. (2002). Selling Forest Environmental Services: Market-Based Mechanisms for Conservation. Earthscan, London.
Pounds, J.A., Fogden, M.P.A. & Campbell, J.H. (1999). Biological response to climate change on a tropical mountain. Nature 398: 611-615.
Rodriguez-Zuñiga, J.M. (2003). Paying for forest environmental services: the Costa Rican experience. Unasylva 212 (54): 31-33.
Zadroga, F. (1981). The hydrological importance of a montane cloud forest area of Costa Rica. In: R. Lal & E.W. Russell (Eds.), Tropical Agricultural Hydrology. J. Wiley, New York, pp. 59-73.
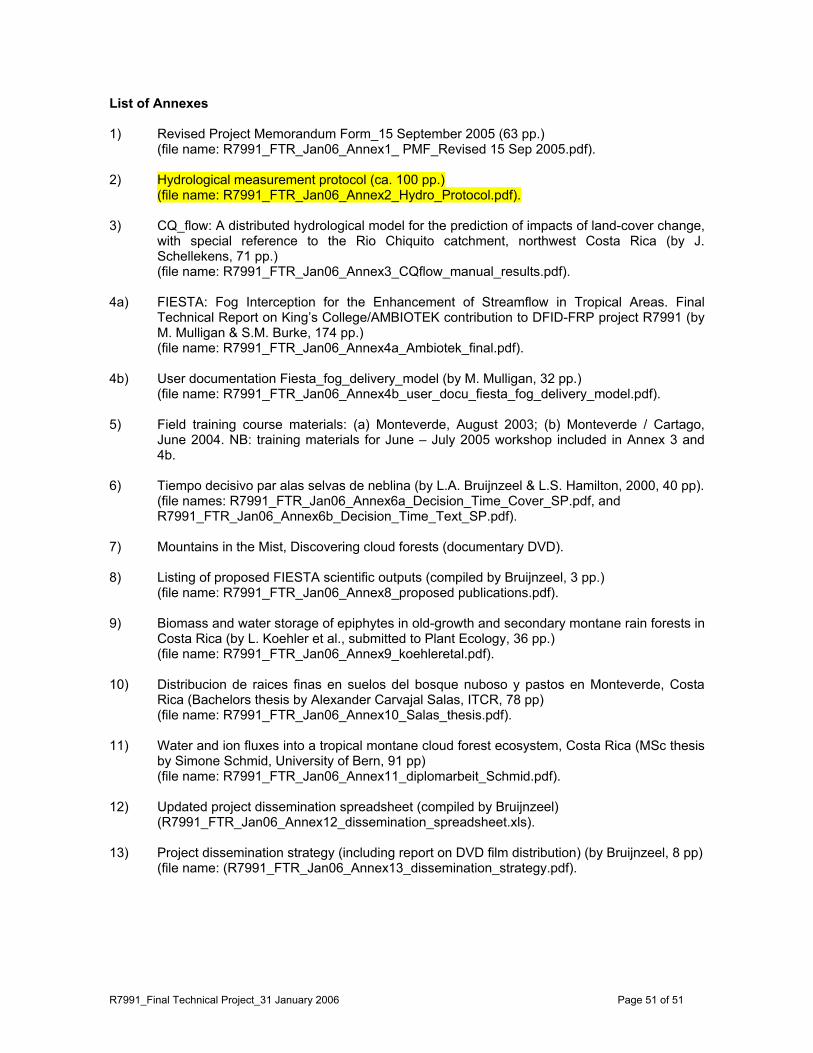
R7991_Final Technical Project_31 January 2006 Page 51 of 51
List of Annexes 1) Revised Project Memorandum Form_15 September 2005 (63 pp.)
(file name: R7991_FTR_Jan06_Annex1_ PMF_Revised 15 Sep 2005.pdf). 2) Hydrological measurement protocol (ca. 100 pp.)
(file name: R7991_FTR_Jan06_Annex2_Hydro_Protocol.pdf). 3) CQ_flow: A distributed hydrological model for the prediction of impacts of land-cover change,
with special reference to the Rio Chiquito catchment, northwest Costa Rica (by J. Schellekens, 71 pp.) (file name: R7991_FTR_Jan06_Annex3_CQflow_manual_results.pdf).
4a) FIESTA: Fog Interception for the Enhancement of Streamflow in Tropical Areas. Final Technical Report on King’s College/AMBIOTEK contribution to DFID-FRP project R7991 (by M. Mulligan & S.M. Burke, 174 pp.)
(file name: R7991_FTR_Jan06_Annex4a_Ambiotek_final.pdf). 4b) User documentation Fiesta_fog_delivery_model (by M. Mulligan, 32 pp.)
(file name: R7991_FTR_Jan06_Annex4b_user_docu_fiesta_fog_delivery_model.pdf). 5) Field training course materials: (a) Monteverde, August 2003; (b) Monteverde / Cartago,
June 2004. NB: training materials for June – July 2005 workshop included in Annex 3 and 4b.
6) Tiempo decisivo par alas selvas de neblina (by L.A. Bruijnzeel & L.S. Hamilton, 2000, 40 pp).
(file names: R7991_FTR_Jan06_Annex6a_Decision_Time_Cover_SP.pdf, and R7991_FTR_Jan06_Annex6b_Decision_Time_Text_SP.pdf).
7) Mountains in the Mist, Discovering cloud forests (documentary DVD). 8) Listing of proposed FIESTA scientific outputs (compiled by Bruijnzeel, 3 pp.) (file name: R7991_FTR_Jan06_Annex8_proposed publications.pdf). 9) Biomass and water storage of epiphytes in old-growth and secondary montane rain forests in
Costa Rica (by L. Koehler et al., submitted to Plant Ecology, 36 pp.) (file name: R7991_FTR_Jan06_Annex9_koehleretal.pdf). 10) Distribucion de raices finas en suelos del bosque nuboso y pastos en Monteverde, Costa
Rica (Bachelors thesis by Alexander Carvajal Salas, ITCR, 78 pp) (file name: R7991_FTR_Jan06_Annex10_Salas_thesis.pdf). 11) Water and ion fluxes into a tropical montane cloud forest ecosystem, Costa Rica (MSc thesis
by Simone Schmid, University of Bern, 91 pp) (file name: R7991_FTR_Jan06_Annex11_diplomarbeit_Schmid.pdf). 12) Updated project dissemination spreadsheet (compiled by Bruijnzeel)
(R7991_FTR_Jan06_Annex12_dissemination_spreadsheet.xls). 13) Project dissemination strategy (including report on DVD film distribution) (by Bruijnzeel, 8 pp)
(file name: (R7991_FTR_Jan06_Annex13_dissemination_strategy.pdf).