hydrolase author manuscript nih public access tool for...
TRANSCRIPT

Tryptophan Fluorescence Quenching by Enzyme Inhibitors As aTool for Enzyme Active Site Structure Investigation: EpoxideHydrolase
Evgenia G. Matveevaa,*, Christophe Morisseaub, Marvin H. Goodrowb, Chris Mullinc, andBruce D. HammockbaCenter for Commercialization of Fluorescence Technologies, Department of Molecular Biologyand Immunology, University of North Texas, Health Science Center, 3500 Camp Bowie Blvd.,Fort Worth, TX 76107, USAbDepartment of Entomology, University of California, Davis, One Shields Ave., Davis, CA 95616,USAcPesticide Research Lab, Department of Entomology, The Pennsylvania State University, PA16802, University Park, USA
AbstractWe present the strong fluorescence effect, a new 392 nm emission peak appearing after binding ofa naphtolurea inhibitor XIIa to the enzyme epoxide hydrolase (EH), along with the quenching ofthe EH tryptophan fluorescence. We have studied the quenching of the 392-nm peak (attributed toXIIa bound inside the active center of the enzyme) of the mixture EH+XIIa by various strongtransparent inhibitors (competing with XIIa for binding to EH), and measured the correspondingvalues of the Stern-Volmer constants, K(mix)SV. Strong EH inhibitors demonstrate differentreplacement behavior which can be used to distinguish them. We further demonstrate a novelfluorescent assay which allows to distinguish highly potent inhibitors and to visualize the strongestamong them. We generated our assay calibration curve based on the quenching data, by plottingquenching strength K(mix)SV versus inhibiting strength, IC50 values. We used moderate inhibitorsfor the assay plot generation. We then applied this curve to determine IC50 values for severalhighly potent inhibitors, with IC50 values at the limit of the IC50 detection sensitivity bycolorimetric enzyme assay. IC50 values determined from our quenching assay show correlationwith IC50 values determined in the literature by more sensitive radioactive-based assay and allowdifferentiating the inhibitors potency in this group. To our knowledge, this is the first inhibitorassay of such kind. Chemical inhibition of EH is an important technology in the treatment ofvarious cardiovascular diseases, therefore, this tool may play a crucial role in discovering newinhibitor structures for therapeutic EH inhibition.
KeywordsSoluble epoxide hydrolase; tryptophan fluorescence quenching; enzyme inhibitors; inhibitordetection
© 2009 Bentham Science Publishers Ltd.*Address correspondence to this author at the Center for Commercialization of Fluorescence Technologies, Department of MolecularBiology and Immunology, University of North Texas, Health Science Center, 3500 Camp Bowie Blvd., Fort Worth, TX 76107, USA;Fax: 817-735-2118; [email protected].
NIH Public AccessAuthor ManuscriptCurr Pharm Biotechnol. Author manuscript; available in PMC 2010 September 1.
Published in final edited form as:Curr Pharm Biotechnol. 2009 September ; 10(6): 589–599.
NIH
-PA Author Manuscript
NIH
-PA Author Manuscript
NIH
-PA Author Manuscript
INTRODUCTIONEpoxide hydrolases (EHs) are enzymes that catalyze the hydrolysis of epoxides or areneoxides to corresponding diols [1,2]. The role of EHs as detoxifying enzymes has beenstudied with great interest [2,3]. An investigation of the inhibition of these xenobiotic-metabolizing enzymes may present an important mechanism in enzyme activity regulation.The EHs are enzymes present in all living organisms; they transform epoxide-containinglipids by adding water. Since many of these lipid substrates carry out important biologicalfunctions (such as the regulation of inflammation and blood pressure), the EHs play animportant role with profound effects on the physiological state of the host organism [4–6].There are two major epoxide hydrolases with broad substrate specificity in mammals: thesoluble epoxide hydrolase (sEH) and the microsomal epoxide hydrolase (mEH). The mEH isthe most active in this regard. A variety of biological data suggests that sEH is involved inthe metabolism of endogenous lipids. Thus, the sEH may be a great tool for the developmentof pharmaceutical agents [5–10], for example, agents that protect against ischemic stroke.The structure of recombinant murine liver EH was reported recently [11,12].
Fluorescence detection is an important tool for pharmaceutical detection applications,especially in high-throughput screening assays [13]. Proteins contain three aromatic aminoacid residues (tryptophan, tyrosine, phenylalanine) which may contribute to their intrinsicfluorescence. Tryptophan has much stronger fluorescence and higher quantum yield than theother two aromatic amino acids, and tryptophan fluorescence dominates at excitation 280nm showing a peak with maximum at 330–360 nm. The intensity, quantum yield, andwavelength of maximum fluorescence emission of tryptophan depend on themicroenvironment of the tryptophan molecule. The fluorescence spectrum shifts to shorterwavelength and the intensity of the fluorescence increases as the polarity of the solventsurrounding the tryptophan residue decreases. Therefore, tryptophan residues which areburied in the hydrophobic core of proteins, particularly those buried in the enzyme activesite, dominate in the fluorescence emission intensity and have spectra shifted by 10 to 20 nmcompared to tryptophans on the protein surface.
Fluorescence quenching of the tryptophan residues of proteins by various quenchers (ions,drugs, acrylamide and others) during protein-ligand interaction has been studied in order toconfirm the binding site and investigate the mechanism of protein-ligand binding and thenature of the micro-environment of the tryptophan residues [14–19]. From the crystalstructure [11,12] it is clear that there are several tryptophans close to the catalytic site of theenzyme, and we have observed changes in fluorescence with the binding of some substrates.Thus, it was hoped that we could develop a rapid assay to evaluate inhibitors of the enzymebinding at the catalytic site by using ligands which altered tryptophan fluorescence.
Substituted ureas and carbamates have been recently reported as potent inhibitors of EH[2,10,20–22]. Some of these selective, competitive tight-binding inhibitors with nanomolarKi values interacted stoichiometrically with the homogenous recombinant murine andhuman soluble EHs. These inhibitors may become valuable tools for testing hypotheses ofinvolvement of diol and epoxide lipids in chemical mediation in vitro or in vivo systems.
In this work we investigated the quenching effect of substituted ureas on the tryptophanfluorescence of the soluble EH. Correlation between quenching effects, inhibition power,and structure of inhibitors was discussed. We developed a novel fluorescent assay whichallows to distinguish highly potent inhibitors and to vizualize the strongest among them.Tryptophan fluorescence quenching studies of the EH-inhibitor binding can help tounderstand the toxicological and pharmacological roles of soluble EH.
Matveeva et al. Page 2
Curr Pharm Biotechnol. Author manuscript; available in PMC 2010 September 1.
NIH
-PA Author Manuscript
NIH
-PA Author Manuscript
NIH
-PA Author Manuscript

MATERIALSEnzyme Preparation
Recombinant mouse sEH was produced in a baculovirus expression system [23,24] andpurified by affinity chromatography [25]. The preparations were at least 97 % pure asjudged by sodium dodecyl sulfate-polyacrylamide gel electrophoresis and scanningdensitometry. No detectable esterase or glutathione transferase activity, which can interferewith this sEH assay, were observed [26]. Protein concentration was quantified using thePierce BCA (bicinchoninic acid) assay (Pierce, Rockford, IL). Bovine serum albumin wasused as the calibrating standard.
IC50 Assay ConditionsIC50s were determined as described using racemic 4-nitrophenyl-trans-2,3-epoxy-3-phenylpropyl carbonate as substrate [26]. The enzyme (0.12 µM sEH) was incubated withthe inhibitor for 5 min in pH 7.4 sodium phosphate buffer at 30 °C prior to substrateintroduction ([substrate] = 40 µM). Activity was assessed by measuring the appearance ofthe 4-nitrophenolate anion at 405 nm at 30 °C during 1 min (Spectramax 200; MolecularDevice, Inc., Sunnyvale, CA). Assays were performed in triplicate. By definition, IC50 is theconcentration of inhibitor, which reduces enzyme activity by 50%. Concentrations of IC50were determined by regression of at least five data points with a minimum of two points inthe linear region of the curve on either side of the IC50. The curve was generated from atleast three separate runs, each in triplicate, to obtain the standard deviation in Table 1.
Synthesis of InhibitorsCompound XXIII was purchased from Aldrich. Synthesis of the compound XIIa is describedbelow. Syntheses of the other compounds are described in the references listed in Table 1.
1-Cyclohexyl-3-(4-Hydroxy-1-Napthyl)Urea (XIIa)To a solution of 0.478 g (2.2 mmole) of 90% 4-hydroxynapthylamine hydrochloride and0.335 g (2.2 mmole) of 1,8-diazabicyclo[5.4.0]undec-7-ene (DBU) in 2 mL ofdimethylformamide was added 0.26 mL (0.25 g, 2.0 mmole) of cyclohexylisocyanate over 5min. After 12 h at ambient temperature, 20 mL of ice-water was added, and the pH loweredfrom 4 to 2 with 6 M HCl to precipitate a purple-colored solid. Recrystallization of the solidfrom methanol/water (5:2, v/v) provided analytical material, mp 193 °C (dec): TLC Rf 0.56[hexane/ethyl acetate (1:1, v/v)], 0.87 (ethyl acetate); IR (KBr) 3332 (s, br, NH, OH), 1635(vs, C=O), 1586 (vs, amide II) cm−1; 13C NMR (DMSO-d6/TMS) δ 155.9 (C=O), 149.6(ArC-1), 128.8, 126.6, 126.0, 125.0, 124.6, 122.7, 129.1, 120.6, 107.8, 48.0 (C-1), 33.4(C-2,6), 25.5 (C-4), 24.7 (C-3,5); MS m/z (relative intensity) 384 (56, M + C6H11NH2 +H+), 285 (100, M + H+), 143 (85, M + 2H)2+, 100 (56, C6H11NH2 + H+).
METHODSMelting points were determined with a Thomas-Hoover apparatus (A. H. Thomas Co.,Philadelphia, PA) and are uncorrected. Infrared spectra were recorded on a Mattson GalaxySeries FTIR 3000 spectrometer (Madison, WI). 13C-NMR spectra were measured on aGeneral Electric QE-300 spectrometer (Bruker NMR, Billerica, MA) operating at 75.5 MHz.The FAB mass spectra were generated on a Kratos MS-50 mass spectrometer (KratosAnalytical, Manchester, UK) using either glycerol or 3-nitrobenzyl alcohol as the matrix. AShimadzu UV-2101 PC UV-VIS scanning spectrophotometer was used for absorbancemeasurements.
Matveeva et al. Page 3
Curr Pharm Biotechnol. Author manuscript; available in PMC 2010 September 1.
NIH
-PA Author Manuscript
NIH
-PA Author Manuscript
NIH
-PA Author Manuscript

Fluorescence measurements in standard 1 cm cuvettes were performed using a Fluoromax IIspectrofluorometer, Jobin Yvon – Spex, U.S.A., at room temperature (22 °C), andexcitation/emission slits at 5 nm each. EH fluorescence spectra were taken at excitation280–290 nm, and emission 334 nm. Quenching of the enzyme (EH) fluorescence in presenceof the inhibitors was measured as follows. Two cuvettes were used for measurements, oneshortly after the other. The sample cuvette contained 2 ml EH solution in 0.1 M sodiumphosphate buffer (pH 7) (immediately after the dilution of the stock EH solution, which wasstored on ice) and 2–50 µl of the inhibitor solution in dimethylformamide (DMF). Thecontrol cuvette contained same amounts of the EH solution and DMF. Thus, the incubationtime (warming of the EH solution in cuvettes) was the same for the sample and control—about 5–30 min. (This consistent incubation time was very important, because after about 60min, we observed an approximately 30% decrease of EH fluorescence in the controlcuvette).
Two-peak Lorentzian fitting for fluorescence spectra was performed using the “MicrocalOrigin” software, version 4.00, Microcal Software, Inc., U.S.A.
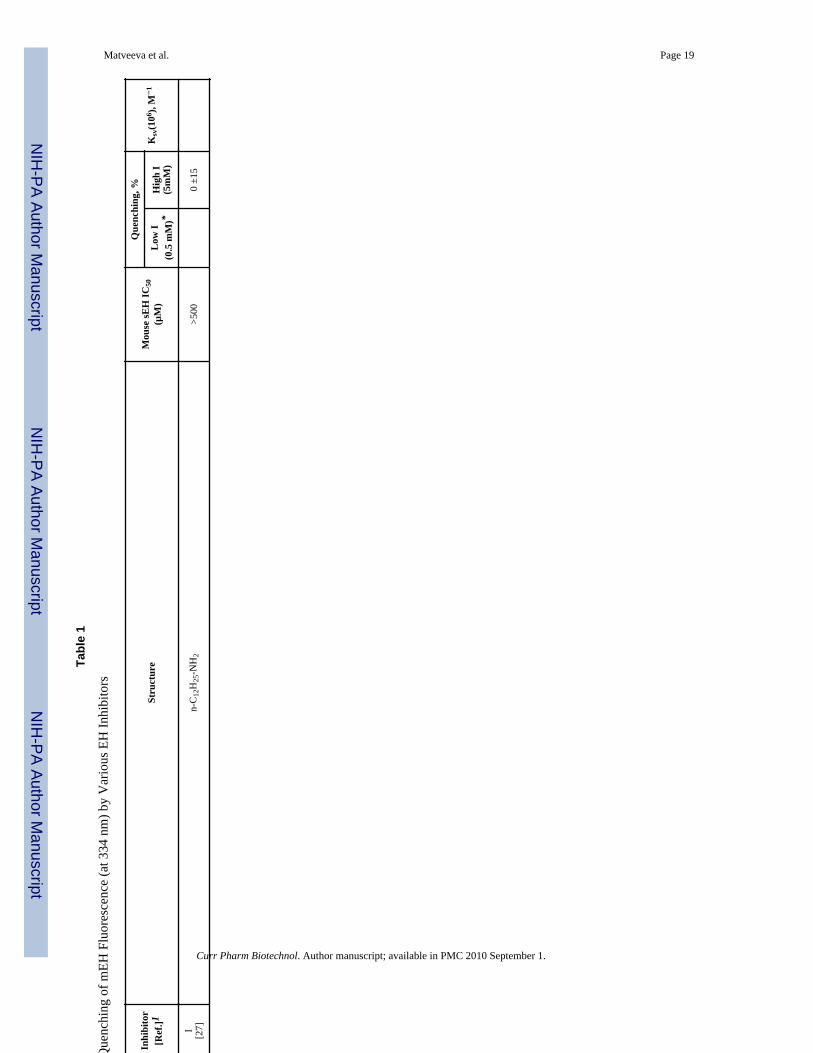
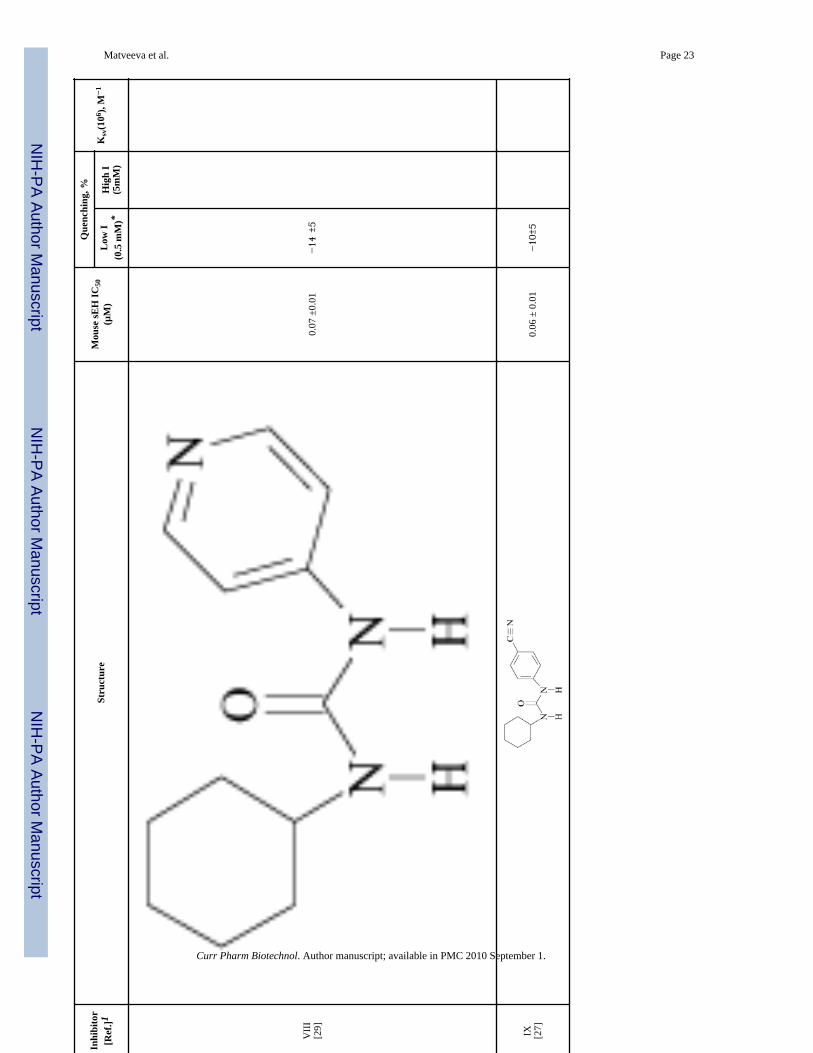
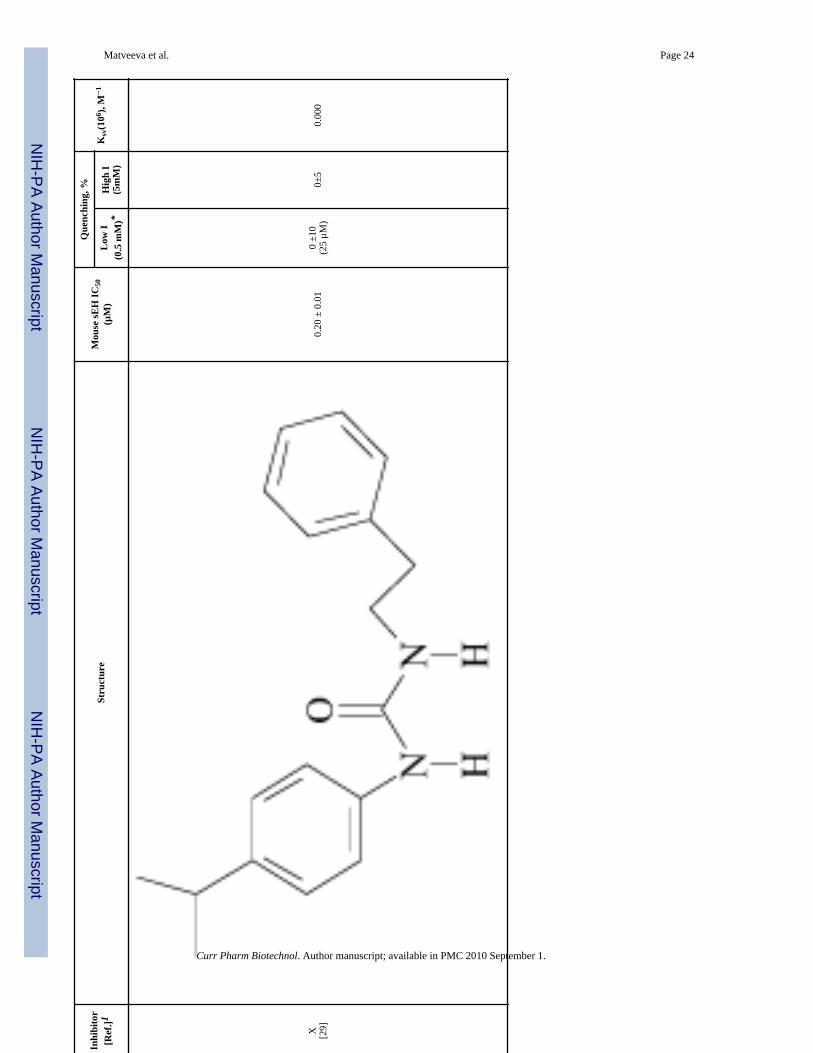
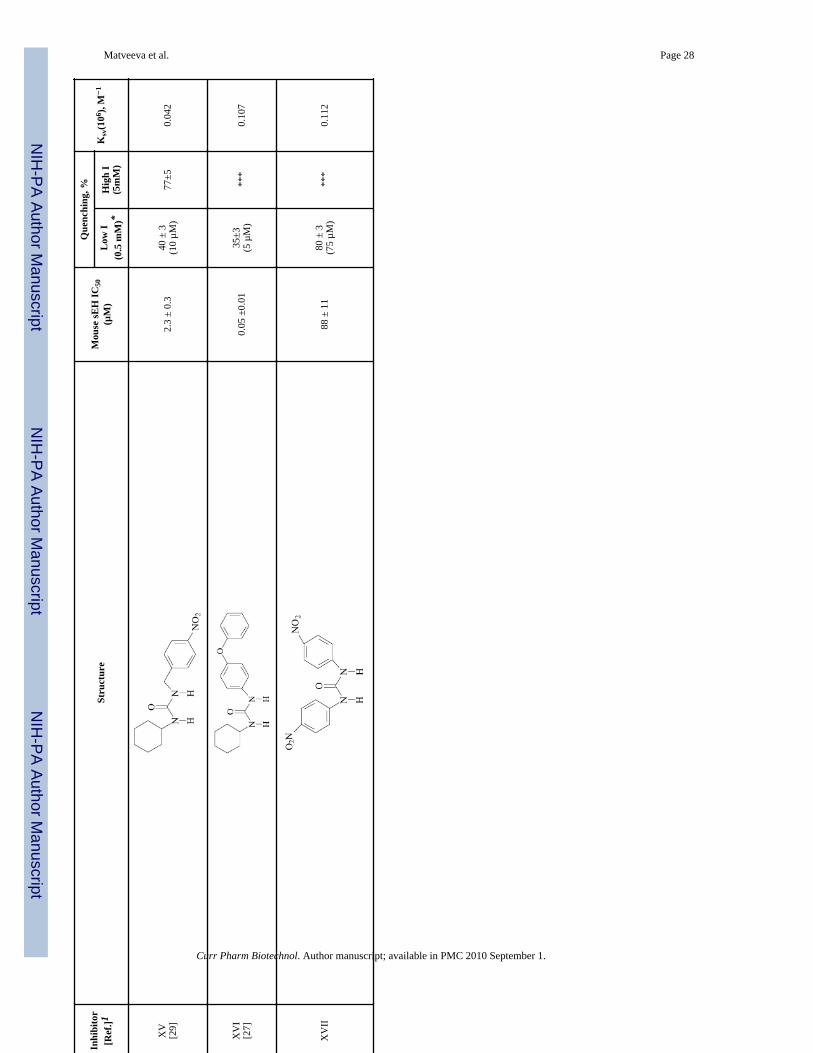
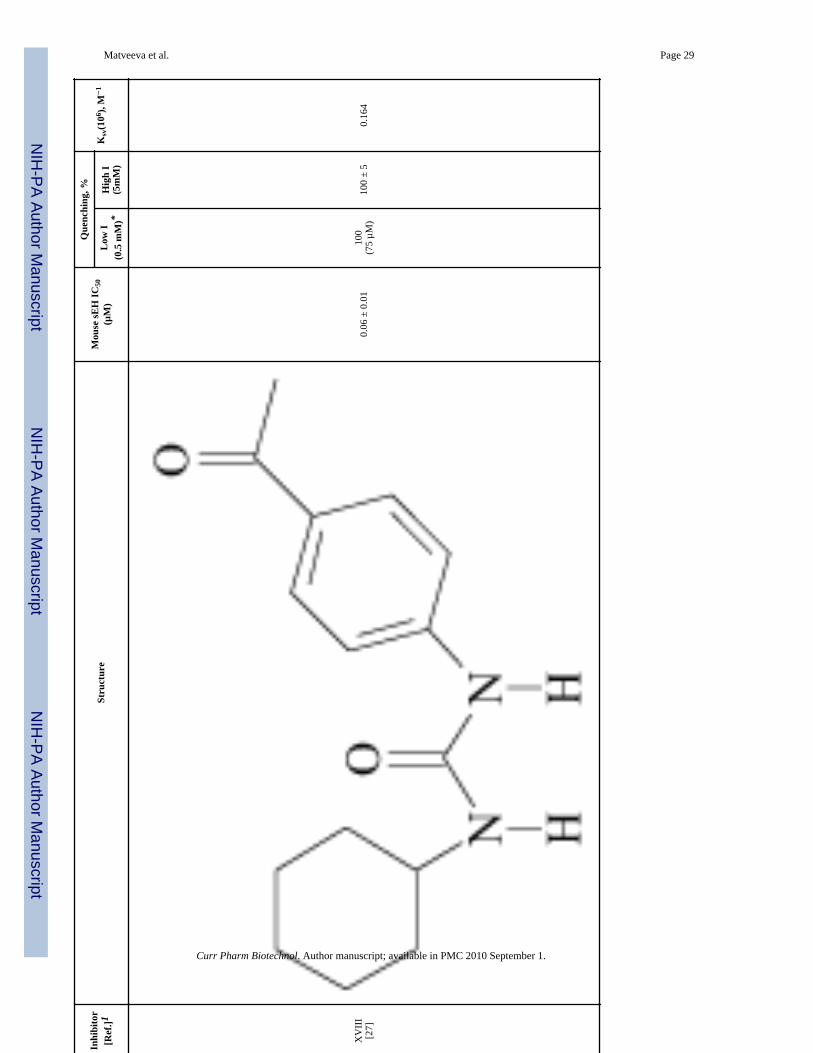
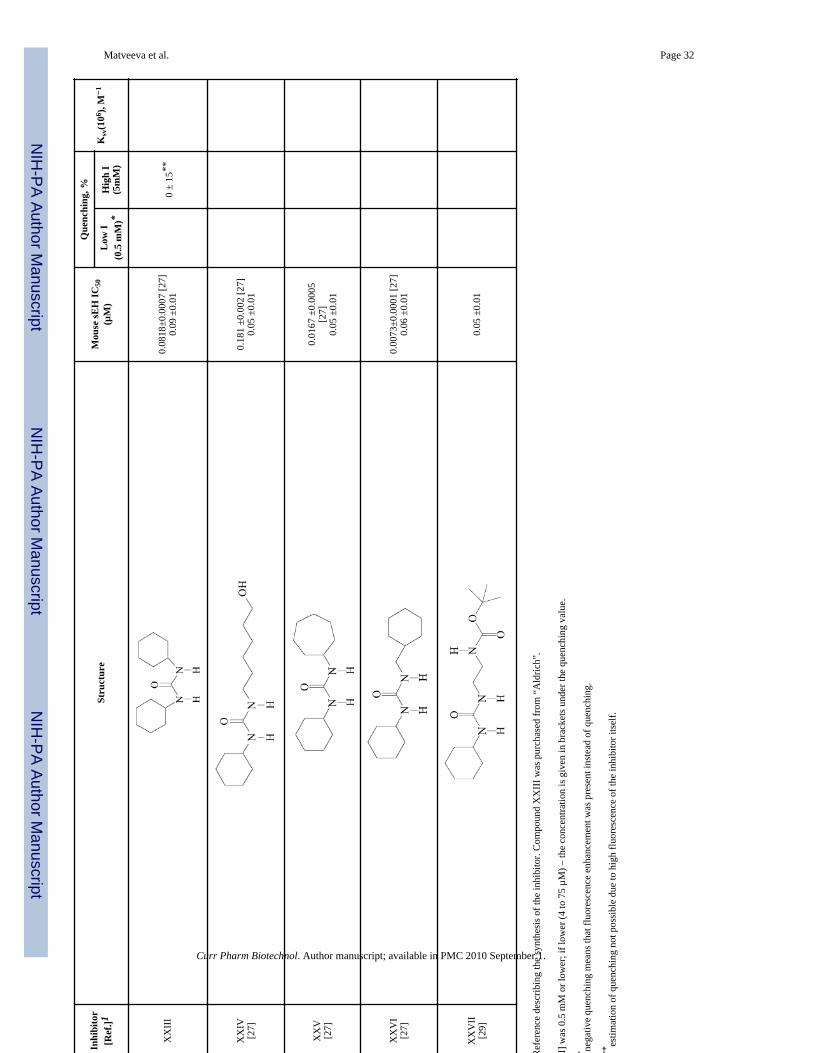
RESULTS AND DISCUSSIONA wide range of different EH inhibitors was tested to determine their effect on tryptophanfluorescence with homogenous recombinant sEH of mice. Tryptophan quenching at low (0.5mM or less) or high (5 mM) concentration of the inhibitor, calculated as the ratio of thetryptophan fluorescence (ex 290 nm, em 340 nm) in presence and in absence of an inhibitor,is presented in Table 1, as well as inhibitor’s structures and IC50 values. The primary aminewhich inhibits the microsomal, but not the soluble, EH had no effect on fluorescence (I,Table 1). All of the sEH inhibitors tested used the urea pharmacophore. In addition, widerange of aliphatic and aromatic substitutents was studied as shown in Table 1. None of thealiphatic urea derivatives studied significantly altered the emission spectrum of the sEHwhen excited at 280–290 nm. This suggests that binding of the aliphatic inhibitor to theenzyme does not alter the fluorescent properties of the tryptophans near the catalytic site.We have studied the quenching effect of a wide variety of aromatic urea derivatives in moredetail, at different inhibitor concentrations (see Table 1). Some of the aromatic ureaderivatives were strong quenchers for EH fluorescence while others were not (Table 1).
Quenching behavior of various aliphatic/aromatic inhibitors varied widely, from no effect(or even slight fluorescence enhancement) to strong quenching up to 100% completequenching; three representative quenching curves are shown on Fig. (1) (slight fluorescenceenhancement, no quenching, intermediate quenching, and strong quenching). In order tobetter quantify the quenching, we calculated the values of the Stern-Volmer constants (KSV)for each inhibitor using Stern-Volmer equation: Fo/F = 1 + KSV [inhibitor], where F and Fois the fluorescence in the presence and absence of quenching inhibitor, respectively. Thevalues are presented in Table 1 (right column). Stern-Volmer plot was linear only for theinitial range of inhibitor concentrations, and showed saturation at higher concentrations,hence, the KSV value was calculated using first 4–6 data points, up to approximately 4–5µM for strong inhibitors and 25–50 µM for weak inhibitors. Thus, we consider bothquenching characteristics (percentage of quenching and KSV values) as semi-quantitative,with percentage related more to higher inhibitor concentrations, and KSV value related moreto lower ones.
After analyzing a wide variety of structures of inhibitors (Table 1), we found that the strongquenchers were urea pharmacophores, whose structure included a cyclohexyl (or phenyl)residue from one side (R), and phenyl residue from the other side (R’). An electron donor inpara-position of the R’ (like N+ in XVII, C+ in XVIII, S in VII) resulted in quenching, while
Matveeva et al. Page 4
Curr Pharm Biotechnol. Author manuscript; available in PMC 2010 September 1.
NIH
-PA Author Manuscript
NIH
-PA Author Manuscript
NIH
-PA Author Manuscript
electron acceptors in the same position of R’ were inferior quenchers (O in VI, XIV, and N−
in IV). Phenyl without a para-substitutor (XIII), pyridine (VIII), or aliphatic radicals (I, III)as an R’, did not express any quenching effect. A CH2 spacer between urea’s NH and R’leads to the decrease of the quenching effect (compare XV, XVII, and XXI, Table 1).
The cyclohexyl naphthyl urea (XI, Table 1) showed a slight tryptophan fluorescenceenhancement at increasing inhibitor concentrations (Fig. 1). Thus, several other naphthylderivatives were tested (XIIa - XIIc, Table 1). It was hoped that the resulting compoundsmight not only alter the tryptophan fluorescence of the sEH itself, but that the fluorescenceproperties of the resulting naphthol ligands might be altered in the hydrophobic pocket ofthe enzyme. The effect of the EH on the fluorescence of the naphthyl derivatives XIIa - XIIc(ex 330 nm) is shown in Fig. (2). Two of the naphthol derivatives (XIIb, XIIc) showed slightquenching in the presence of sEH (Fig. 2B,C), however, with the 1,4-naphthol derivative(XIIa) there was an appearance of a new peak and a clear enhancement of fluorescence (Fig.2A).
Since compound XIIa yielded the strongest effects of those studied, and resulted in theappearance of a new peak rather than just the disappearance of a tryptophan peak, theinteraction of the EH with 1,4-naphthol derivative XIIa was studied in greater detail. Fig. (3)shows the fluorescence spectra of various XIIa concentrations in the absence (3A) or in thepresence (3B) of EH. We can see that fluorescence spectra of the inhibitor XIIa inside theactive site of EH clearly differ from the spectra of the free inhibitor when excited at 330 nm(at inhibitor excitation maximum), even though EH itself shows no fluorescence whenexcited at 330 nm.
Next, we studied the fluorescence properties of the XIIa – EH mixtures at the tryptophanexcitation (290 nm); the results are presented in Fig. (4). We observe here not only thequenching of the EH tryptophan peak at 340 nm, but also the appearance of the new peak atlonger wavelengths (approximately 380–390 nm), as the inhibitor concentration increases.This new peak of XIIa, which occurs at the point of interaction with sEH, can clearly beobserved in the case of two-peak fitting for the spectrum using Lorentzian fitting (Fig. 5);this fitting results in the value of 392 nm at the maximum.
In some cases emission the spectrum may be affected by the changes in the localmicroenvironment of the fluorophore [32]. The peak height then, due to possible maximumshift, is no longer a reliable characteristic of the fluorescence, compared to the area underthe spectrum (“peak area”). We tested the behavior of the peak height versus peak area atvarious concentrations of the inhibitor XIIa and found that both values change uniformly(Fig. 6). Both the height and the area of the new 392-nm peak show the saturation curvewhen plotting the height or area against the XIIa concentration (Fig. 6). From this we canconclude that, at given EH concentration, further increase in the inhibitor concentration aftersaturation of the enzyme active sites does not result in an increased 392-nm peakfluorescence. This is in agreement with the fact that 290 nm excitation can not result influorescence of the free (not bound to EH) inhibitor XIIa (data not shown). Hence, the 392-nm peak can be attributed to the inhibitor bound inside the EH active site; importantly, thispeak can be excited by the tryptophan excitation optimum (280–290 nm).
There are two likely mechanisms for this effect. One possibility is that the fluorescence ofthe 1,4-derivative XIIa becomes blue shifted and strongly enhanced upon binding to theenzyme, because the microenvironment of the fluorophore XIIa is changing fromhydrophilic to more hydrophobic. This hypothesis is partially confirmed by the change inthe fluorescence spectra of XIIa in buffer versus various organic solvents (Fig. 7). We see
Matveeva et al. Page 5
Curr Pharm Biotechnol. Author manuscript; available in PMC 2010 September 1.
NIH
-PA Author Manuscript
NIH
-PA Author Manuscript
NIH
-PA Author Manuscript

the enhancement of the fluorescence in organic solvents; however, there is no big shift in theexcitation maximum due to the solvent effect (Fig. 7).
An alternate hypothesis is that when the 1,4-naphthol binds to the sEH, it comes within closeproximity to one or more excitable tryptophans and, at the tryptophan excitation, there is anenergy transfer resulting in the quenching of the tryptophan fluorescence, as well as the“pumping” of the inhibitor’s fluorescence by tryptophans and the appearance of the 392-nmpeak corresponding to the fluorescence of the XIIa inside the active site. Furtherinvestigations, including time-resolved study, are needed to confirm this hypothesis.
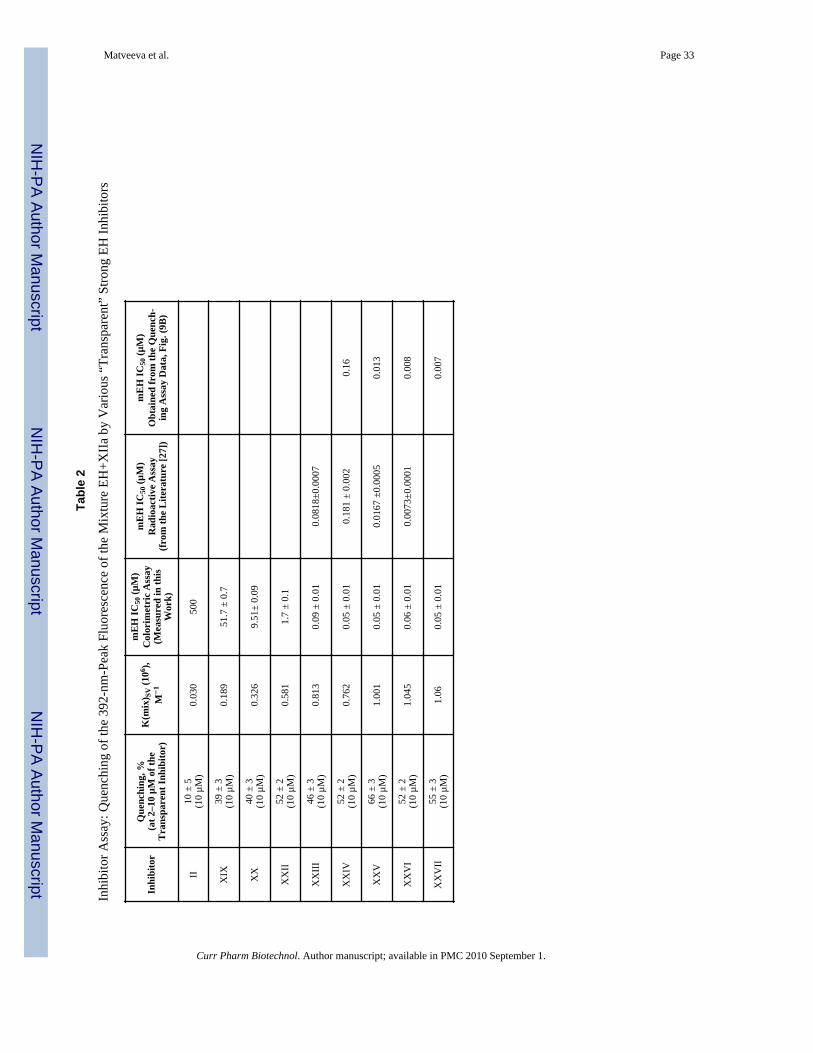
The “bound inhibitor” peak arising in the mixture of XIIa and sEH could serve as a tool forinhibiting the potency of the spectrally invisible, ‘transparent’ EH inhibitors. It is verydifficult, and in some cases not possible, to differentiate the best EH inhibitors from eachother on the basis of their IC50 values [33]. Best inhibitors immediately block active sites ofthe EH and do not allow the EH substrate to react. In our case, using a fluorescing moleculesuch as XIIa, also a very strong EH inhibitor, we can simply monitor the “bound inhibitor”peak while adding some other inhibitors competing with XIIa for the EH active site. Whenwe add ‘transparent’ inhibitors to the mixture of EH+XIIa, and monitor the 392-nm peak,we see the quenching of this peak by a transparent inhibitor, probably due to thereplacement of the XIIa by a ‘transparent’ inhibitor (if the transparent inhibitor in strongerthan XIIa). We have studied the quenching of the 392-nm peak of the mixture EH+XIIa byvarious strong transparent inhibitors (competing with XIIa for binding to EH). The obtainedquenching values (along with inhibitor concentrations) and corresponding values of theStern-Volmer constants, K(mix)SV, are given in Table 2. Several representative quenchingcurves are shown on Fig. (8). Various strong EH inhibitors demonstrate differentreplacement behavior – which can be used to distinguish them. An assay for strong EHinhibitors can be generated based on these quenching data, by plotting quenching strength(for example K(mix)SV values) versus inhibiting strength, such as IC50 values.
Fig. (9A) shows the correlation between IC50 of the inhibitors (x) and K(mix)SV values (y).The IC50 value of 0.05 µM is the lowest one which can be easily determined by colorimetricenzyme immunoassay (as in this work). This type of assay does not permit the segregationof very potent inhibitors due to its low sensitivity, so inhibitors with these assigned valuesmay have the “real” potency equal to the IC50 of lower than 0.05 µM. Hence, we only usedthe inhibitors with IC50 higher than 0.05 µM for our assay calibration curve, namely XIX,XX, XXII, and XXIII, as well as the low-potency inhibitor II with high IC50 value andnegligible quenching effect (grey circles on Fig. 9A and Fig. 9B).
Fig. (9A) shows the calibration plot (grey circles) and a set of strong inhibitors with IC50values 0.05–0.06 µM, at the limit of the IC50 detection sensitivity by colorimetric enzymeassay (black circles). From Fig. (9A) we see that several inhibitors with close IC50 values ofabout 0.05 µM have different quenching potency, which can be an indication of theirinhibiting potency: hence, from this group, inhibitor XXVII is the strongest one, inhibitorXXIV is the weakest one, and inhibitors XXV and XXVI are in-between. If we apply ourcalibration plot to these strong inhibitors and align all the corresponding data points fromFig. (9A) along the calibration, as shown by arrows on Fig. (9A), we will get a set of data asshown on Fig. (9B), white circles, from which we calculated appropriate corrected values ofIC50 presented in Table 2, right column. These values show stronger inhibitor potency andallow us to differentiate the potency in this group. They also correspond quite well to theIC50 values obtained in the literature [27] by more sensitive radioactive-based assay (Table2). Radioactive-based assay allows 10–20-fold improving in sensitivity [27, 34], but thisassay utilizes radioactive substrate and involves extraction steps and hence is time- and cost-consuming.
Matveeva et al. Page 6
Curr Pharm Biotechnol. Author manuscript; available in PMC 2010 September 1.
NIH
-PA Author Manuscript
NIH
-PA Author Manuscript
NIH
-PA Author Manuscript

It is notable that two of the best ‘non-visible’ inhibitors, XXV and XXVI, characterized bythe K(mix)SV value more than 1 (Table 2), have a structure very similar to the structure ofthe inhibitor XXIII (DCU), with much less inhibitor potency Table 1). The only differencein the structures is a cycloheptyl R in XXV or a cyclohexyl with a single CH2 spacer inXXIV, compared to a cyclohexyl R in XXIII (see Table 1).
CONCLUSIONSWe demonstrated the observation of a strong fluorescent peak at 392 nm when exciting thetryptophans in the mixture of the enzyme EH and its fluorescent inhibitor XIIa. This peakcan not be observed in the absence of EH, and is attributed to the inhibitor XIIa bound insidethe active center of the EH. We demonstrated a novel fluorescent assay based on thecompetition of other, otherwise “not visible”, strong EH inhibitors, with the XIIa – EHmixture, in order to distinguish these potent EH inhibitors among themselves. This assaydoes not apply to weak inhibitors but allows to distinguish highly potent inhibitors and tovisualize the strongest among them. We generated our assay calibration curve usingmoderate inhibitors (with IC50 higher than 0.05 µM), as well as a low-potency inhibitor witha high IC50 value and negligible quenching effect, by plotting quenching strength K(mix)SVversus inhibiting strength, IC50 values. Then, we applied this plot to determine IC50 valuesfor several highly potent inhibitors, with IC50 values at the limit of the IC50 detectionsensitivity by colorimetric enzyme assay. IC50 values determined from our quenching assayshow correlation with IC50 values determined in the literature by more sensitive radioactive-based assay and allow differentiating the inhibitors’ potency in this group. To ourknowledge, this is the first inhibitor assay of such kind. This tool may be very important indiscovering new inhibitor structures for the therapeutic inhibition of sEH, applied to thetreatment of various diseases.
AcknowledgmentsThis work was supported by Texas Emerging Technologies Fund, NIEHS R37 ES002710, and NIEHS SuperfundBasic Research Program, P42 ES004699.
ABBREVIATIONS USED
BCA Bicinchoninic acid
DBU 1,8-Diazabicyclo[5.4.0]undec-7-ene
DMF Dimethylformamide
EH Epoxide hydrolase
mEH Microsomal epoxide hydrolase
sEH Soluble epoxide hydrolase
REFERENCES1. Orru RV, Archelas A, Furstoss R, Faber K. Epoxide hydrolases and their synthetic applications.
Adv. Biochem. Eng. Biotechnol 1999;63:145–167. [PubMed: 9933984]2. Morisseau C, Hammock BD. Epoxide hydrolases: mechanisms, inhibitor designs, and biological
roles. Ann. Rev. Pharmacol. Toxicol 2005;45:311–333. [PubMed: 15822179]3. Omiecinski CJ, Hassett C, Hosagrahara V. Epoxide hydrolase--polymorphism and role in
toxicology. Toxicol. Lett 2000;112–113:365–370.4. Newman JW, Morisseau C, Hammock BD. Epoxide hydrolases: their roles and interactions with
lipid metabolism. Prog. Lipid Res 2005;44(1):1–51. [PubMed: 15748653]
Matveeva et al. Page 7
Curr Pharm Biotechnol. Author manuscript; available in PMC 2010 September 1.
NIH
-PA Author Manuscript
NIH
-PA Author Manuscript
NIH
-PA Author Manuscript

5. Fang X, Hu S, Watanabe T, Weintraub NL, Snyder GD, Yao J, Liu Y, Shyy JY-J, Hammock BD,Spector AA. Activation of peroxisome proliferator-activated receptor {alpha} by substituted urea-derived soluble epoxide hydrolase inhibitors. J. Pharmacol. Exp. Ther 2005;314(1):260–270.[PubMed: 15798002]
6. Chiamvimonvat N, Ho Ch-M, Tsai H-J, Hammock BD. The soluble epoxide hydrolase as apharmaceutical target for hypertension. J. Cardiovasc. Pharm 2007;50(3):225–237.
7. Inceoglu B, Schmelzer KR, Morisseau C, Jinks SL, Hammock BD. Soluble epoxide hydrolaseinhibition reveals novel biological functions of epoxyeicosatrienoic acids (EETs). ProstaglandinsOther Lipid Mediat 2007;82(1–4):42–49. [PubMed: 17164131]
8. Seubert JM, Sinal CJ, Graves J, DeGraff LM, Bradbury JA, Lee CR, Goralski K, Carey MA, LuriaA, Newman JW, Hammock BD, Falck JR, Roberts H, Rockman HA, Murphy E, Zeldin DC. Role ofsoluble epoxide hydrolase in postischemic recovery of heart contractile function. Circ. Res2006;99(4):442–450. [PubMed: 16857962]
9. Zhang W, Koerner IP, Noppens R, Grafe M, Tsai HJ, Morisseau C, Luria A, Hammock BD, FalckJR, Alkayed NJ. Soluble epoxide hydrolase: a novel therapeutic target in stroke. J. Cereb. BloodFlow Metab 2007:1–10.
10. Hwang SH, Tsai H-J, Liu JY, Morisseau C, Hammock BD. Orally bioavailable potent solubleepoxide hydrolase inhibitors. J. Med. Chem 2007;50(16):3825–3840. [PubMed: 17616115]
11. Argiriadi MA, Morisseau C, Hammock BD, Christianson DW. Detoxification of environmentalmutagens and car-cinogens: Structure, mechanism, and evolution of liver epoxide hydrolase. Proc.Nat. Acad. Sci. USA 1999;96(19):10637–10642. [PubMed: 10485878]
12. Argiriadi MA, Morisseau C, Goodrow MH, Dowdy DL, Hammock BD, Christianson DW. Bindingof alkylurea inhibitors to epoxide hydrolase implicates active site tyrosines in substrate activation.J. Biol. Chem 2000;275(20):15265–15270. [PubMed: 10747889]
13. Jäger S, Brand L, Eggeling C. New fluorescence techniques for high-throughput drug discovery.Curr. Pharm. Biotechnol 2003;4(6):463–476. [PubMed: 14683438]
14. Eftink MR, Ghiron CA. Indole fluorescence quenching studies on proteins and model systems: useof the inefficient quencher succinimide. Biochemistry 1984;23(17):3891–3899.
15. Sonveaux N, Vigano C, Shapiro AB, Ling V, Ruysschaert JM. Ligand-mediated tertiary structurechanges of reconstituted P-glycoprotein. A tryptophan fluorescence quenching analysis. J. Biol.Chem 1999;274(25):17649–17654. [PubMed: 10364203]
16. Kleinschmidt JH, Tamm LK. Time-resolved distance determination by tryptophan fluorescencequenching: probing intermediates in membrane protein folding. Biochemistry 1999;38(16):4996–5005. [PubMed: 10213602]
17. Chadborn N, Bryant J, Bain AJ, O’Shea P. Ligand-dependent conformational equilibria of serumalbumin revealed by tryptophan fluorescence quenching. Biophys. J 1999;76(4):2198–2207.[PubMed: 10096914]
18. Kelkar DA, Chattopadhyay A, Chakrabarti A, Bhattacharyya M. Effect of ionic strength on theorganization and dynamics of tryptophan residues in erythroid spectrin: a fluorescence approach.Biopolymers 2005;77(6):325–334. [PubMed: 15648086]
19. Sultan NA, Rao RN, Nadimpalli SK, Swamy MJ. Tryptophan environment, secondary structureand thermal unfolding of the galactose-specific seed lectin from Dolichos lablab: fluorescence andcircular dichroism spectroscopic studies. Biochim. Biophys. Acta 2006;1760(7):1001–1008.[PubMed: 16650937]
20. Morisseau C, Goodrow MH, Dowdy D, Zheng J, Greene JF, Sanborn JR, Hammock BD. Potenturea and carbamate inhibitors of soluble epoxide hydrolases. Proc. Nat. Acad. Sci. USA1999;96(16):8849–8854. [PubMed: 10430859]
21. Davis BB, Thompson DA, Howard LL, Morisseau C, Hammock BD, Weiss RH. Inhibitors ofsoluble epoxide hydrolase attenuate vascular smooth muscle cell proliferation. Proc. Natl. Acad.Sci. USA 2002;99(4):2222–2227. [PubMed: 11842228]
22. Kim IH, Morisseau C, Watanabe T, Hammock BD. Design, synthesis, and biological activity of1,3-disubstituted ureas as potent inhibitors of the soluble epoxide hydrolase of increased watersolubility. J. Med. Chem 2004;47(8):2110–2122. [PubMed: 15056008]
Matveeva et al. Page 8
Curr Pharm Biotechnol. Author manuscript; available in PMC 2010 September 1.
NIH
-PA Author Manuscript
NIH
-PA Author Manuscript
NIH
-PA Author Manuscript

23. Grant DE, Storms DH, Hammock BD. Molecular cloning and expression of murine liver solubleepoxide hydrolase. J. Biol. Chem 1993;268(23):17628–17633. [PubMed: 8349642]
24. Beetham JK, Tian T, Hammock BD. cDNA cloning and expression of a soluble epoxide hydrolasefrom human liver. Arch. Biochem. Biophys 1993;305(1):197–201. [PubMed: 8342951]
25. Wixtrom RN, Silva MH, Hammock BD. Affinity purification of cytosolic epoxide hydrolase usingderivatized epoxy-activated Sepharose gels. Anal. Biochem 1988;169(1):71–80. [PubMed:3369689]
26. Dietze EC, Kuwano E, Hammock BD. Spectrophotometric substrates for cytosolic epoxidehydrolase. Anal. Biochem 1994;216(1):176–187. [PubMed: 8135350]
27. Morisseau C, Goodrow MH, Newman JW, Wheelock CE, Dowdy DL, Hammock BD. Structuralrefinement of inhibitors of urea-based soluble epoxide hydrolases. Biochem. Pharmacol2002;63(9):1599–1608. [PubMed: 12007563]
28. Severson TF, Goodrow MH, Morisseau C, Dowdy DL, Hammock BD. Urea and amide-basedinhibitors of the juvenile hormone epoxide hydrolase of the tobacco hornworm (Manduca sexta:Sphingidae). Insect Biochem. Mol. Biol 2002;32(12):1741–1756. [PubMed: 12429126]
29. McElroy NR, Jurs PC, Morisseau C, Hammock BD. QSAR and classification of murine andhuman soluble epoxide hydrolase inhibition by urea-like compounds. J. Med. Chem 2003;46(6):1066–1080. [PubMed: 12620084]
30. Nakagawa Y, Wheelock CE, Morisseau C, Goodrow MH, Hammock BG, Hammock BD. 3-DQSAR analysis of inhibition of murine soluble epoxide hydrolase (MsEH) by benzoylureas,arylureas, and their analogues. Bioorg. Med. Chem 2000;8(11):2663–2673. [PubMed: 11092551]
31. Morisseau C, Newman JW, Dowdy DL, Goodrow MH, Hammock BD. Inhibition of microsomalepoxide hydrolases by ureas, amides, and amines. Chem. Res. Toxicol 2001;14(4):409–415.[PubMed: 11304129]
32. Wang L, Gaigalas A, Abbasi F, Marti G, Vogt R, Schwartz A. Quantitating fluorescence intensityfrom fluorophores: practical use of MESF values. J. Res. Natl. Inst. Stand. Technol 2002;107:339–353.
33. Jones PD, Wolf NM, Morisseau C, Whetstone P, Hock B, Hammock BD. Fluorescent substratesfor soluble epoxide hydrolase and application to inhibition studies. Anal. Biochem 2005;343(1):66–75. [PubMed: 15963942]
34. Borhan B, Mebrahtu T, Nazarian S, Kurth MJ, Hammock BD. Improved radiolabeled substratesfor soluble epoxide hydrolase. Anal. Biochem 1995;231(1):188–200. [PubMed: 8678300]
Matveeva et al. Page 9
Curr Pharm Biotechnol. Author manuscript; available in PMC 2010 September 1.
NIH
-PA Author Manuscript
NIH
-PA Author Manuscript
NIH
-PA Author Manuscript

Fig. 1.EH fluorescence (in 100 mM Na-phosphate buffer, pH 7.0), emission 334 nm, in thepresence of various aromatic inhibitors: no-quencher VI (white circles, [EH] 25 nM, ex 280nm); intermediate quencher XVIII (grey circles, [EH] 25 nM, ex 280 nm); and strongquencher XXI ([EH] 125 nM, ex 290 nm). White squares show the effect of slightfluorescence enhancement by inhibitor XI ([EH] 25 nM, ex 280 nm).
Matveeva et al. Page 10
Curr Pharm Biotechnol. Author manuscript; available in PMC 2010 September 1.
NIH
-PA Author Manuscript
NIH
-PA Author Manuscript
NIH
-PA Author Manuscript
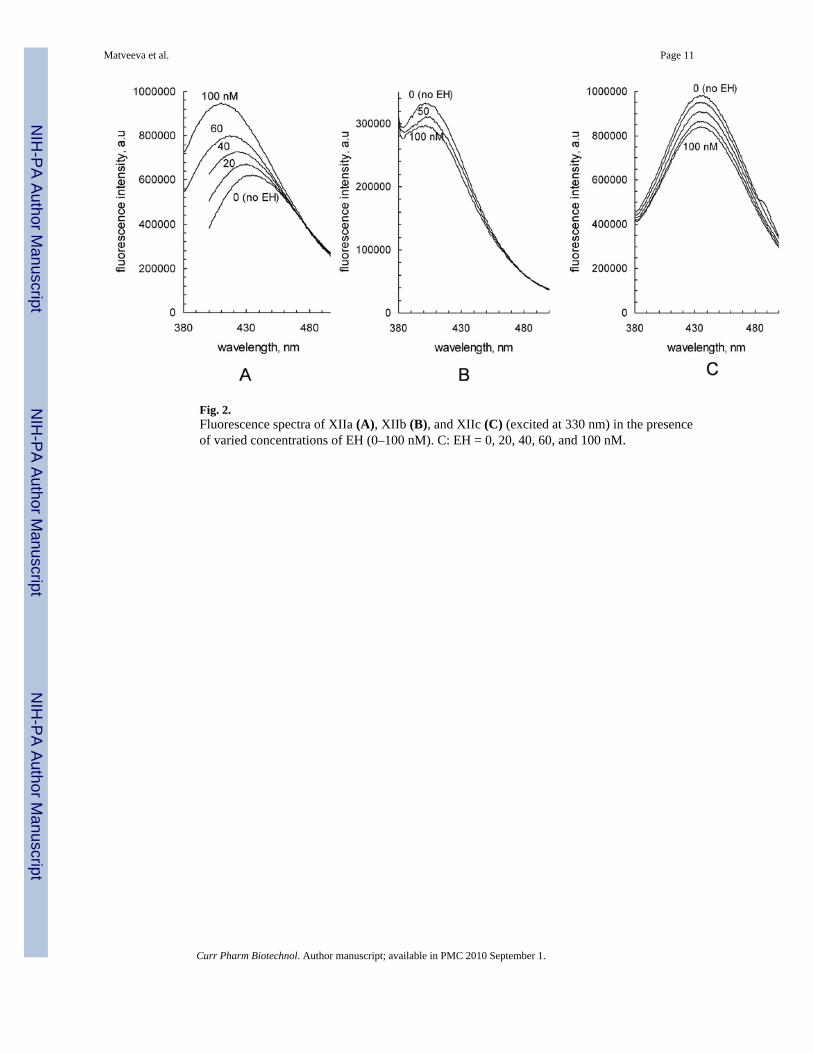
Fig. 2.Fluorescence spectra of XIIa (A), XIIb (B), and XIIc (C) (excited at 330 nm) in the presenceof varied concentrations of EH (0–100 nM). C: EH = 0, 20, 40, 60, and 100 nM.
Matveeva et al. Page 11
Curr Pharm Biotechnol. Author manuscript; available in PMC 2010 September 1.
NIH
-PA Author Manuscript
NIH
-PA Author Manuscript
NIH
-PA Author Manuscript

Fig. 3.Fluorescence spectra of XIIa (at excitation 330 nm) in absence (A) and in the presence (B)of 50 nM EH; [XIIa] varies from 0 to 1 µM.
Matveeva et al. Page 12
Curr Pharm Biotechnol. Author manuscript; available in PMC 2010 September 1.
NIH
-PA Author Manuscript
NIH
-PA Author Manuscript
NIH
-PA Author Manuscript

Fig. 4.EH fluorescence spectra (ex 290 nm) in the presence of XIIa: [XIIa] = 0; 0.125; 0.25; 0.375;0.5; 0.625; 0.75; 0.875; and 1 µM; [EH] = 50 nM.
Matveeva et al. Page 13
Curr Pharm Biotechnol. Author manuscript; available in PMC 2010 September 1.
NIH
-PA Author Manuscript
NIH
-PA Author Manuscript
NIH
-PA Author Manuscript

Fig. 5.Lorentzian fitting of the fluorescence spectra of EH + XIIa (excitation 290 nm, [EH] = 50nM): A) [XIIa] = 0.25 µM; B) [XIIa] = 0.75 µM. Solid black line – experimental; dashedline – fitting, dotted line – fitting, separate peaks.
Matveeva et al. Page 14
Curr Pharm Biotechnol. Author manuscript; available in PMC 2010 September 1.
NIH
-PA Author Manuscript
NIH
-PA Author Manuscript
NIH
-PA Author Manuscript

Fig. 6.Height and area (according to the Lorentzian fitting) of the 392-nm fluorescence peak of themixture EH + XIIa at varied concentrations of XIIa ([EH] = 50 nM).
Matveeva et al. Page 15
Curr Pharm Biotechnol. Author manuscript; available in PMC 2010 September 1.
NIH
-PA Author Manuscript
NIH
-PA Author Manuscript
NIH
-PA Author Manuscript

Fig. 7.Solvent effects on fluorescence spectra of XIIa (excitation 300 nm). Numbers in front of thesolvent show the emission maximum.
Matveeva et al. Page 16
Curr Pharm Biotechnol. Author manuscript; available in PMC 2010 September 1.
NIH
-PA Author Manuscript
NIH
-PA Author Manuscript
NIH
-PA Author Manuscript

Fig. 8.Quenching of the 392-nm peak (mixture EH + XXa) by other EH inhibitors: effect of theconcentration of the other (second) inhibitor on fluorescence intensity of the EH (50 nM)and XXa (2.5 µM) mixture (excited at 290 nm, monitored emission at 400 nm). Secondinhibitors: XXV (strong potency, circles); XX (medium potency, squares); and II (lowpotency, triangles).
Matveeva et al. Page 17
Curr Pharm Biotechnol. Author manuscript; available in PMC 2010 September 1.
NIH
-PA Author Manuscript
NIH
-PA Author Manuscript
NIH
-PA Author Manuscript

Fig. 9.Quenching assay: correlation between IC50 of the ‘transparent’ inhibitors and their effect onthe 392-nm peak from the mixture EH and XXa ([EH] 50 nM, [XXa] 2.5 µM, [transparentinhibitor] 10 µM). Calibration inhibitors: XIX, XX, XXII, XXIII, and II (Table 2) (greycircles). (9A) Black circles: a set of strong inhibitors with IC50 values 0.05–0.06 µM, at thelimit of the IC50 detection sensitivity by colorimetric enzyme assay (Table 1). Arrows showthe application of our calibration plot (grey circles fitting line) to these strong inhibitors andthe aligning of all the black circles in the calibration range. (9B) White circles: the result ofthe application of the calibration plot (shown by arrows on Fig. 9A). IC50 valuescorresponding to the white circles are presented in Table 2, right column.
Matveeva et al. Page 18
Curr Pharm Biotechnol. Author manuscript; available in PMC 2010 September 1.
NIH
-PA Author Manuscript
NIH
-PA Author Manuscript
NIH
-PA Author Manuscript
NIH
-PA Author Manuscript
NIH
-PA Author Manuscript
NIH
-PA Author Manuscript
Matveeva et al. Page 19
Tabl
e 1
Que
nchi
ng o
f mEH
Flu
ores
cenc
e (a
t 334
nm
) by
Var
ious
EH
Inhi
bito
rs
Inhi
bito
r[R
ef.]1
Stru
ctur
eM
ouse
sEH
IC50
(µM
)
Que
nchi
ng, %
Ksv
(106 )
, M−
1L
ow I
(0.5
mM
)*H
igh
I(5
mM
)
I[2
7]n-
C12
H25
-NH
2>5
000
±15
Curr Pharm Biotechnol. Author manuscript; available in PMC 2010 September 1.

NIH
-PA Author Manuscript
NIH
-PA Author Manuscript
NIH
-PA Author Manuscript
Matveeva et al. Page 20
Inhi
bito
r[R
ef.]1
Stru
ctur
eM
ouse
sEH
IC50
(µM
)
Que
nchi
ng, %
Ksv
(106 )
, M−
1L
ow I
(0.5
mM
)*H
igh
I(5
mM
)
II [28]
>500
0 ±1
5
Curr Pharm Biotechnol. Author manuscript; available in PMC 2010 September 1.

NIH
-PA Author Manuscript
NIH
-PA Author Manuscript
NIH
-PA Author Manuscript
Matveeva et al. Page 21
Inhi
bito
r[R
ef.]1
Stru
ctur
eM
ouse
sEH
IC50
(µM
)
Que
nchi
ng, %
Ksv
(106 )
, M−
1L
ow I
(0.5
mM
)*H
igh
I(5
mM
)
III
[27]
0.05
±0.
010.
0098
±0.0
004
[27]
0 ±1
5
IV [27]
0.17
± 0
.02
10±7
(10
µM)
10 ±
50.
004
V [29]
0.05
± 0
.01
5±5
(10
µM)
3±5
0.01
2
Curr Pharm Biotechnol. Author manuscript; available in PMC 2010 September 1.

NIH
-PA Author Manuscript
NIH
-PA Author Manuscript
NIH
-PA Author Manuscript
Matveeva et al. Page 22
Inhi
bito
r[R
ef.]1
Stru
ctur
eM
ouse
sEH
IC50
(µM
)
Que
nchi
ng, %
Ksv
(106 )
, M−
1L
ow I
(0.5
mM
)*H
igh
I(5
mM
)
VI
[27]
0.05
±0.
010.
016±
0.00
02 [2
7]0±
10(1
0 µM
)−5
±10*
*−0.
001
VII
[27]
44±1
−4
±3
Curr Pharm Biotechnol. Author manuscript; available in PMC 2010 September 1.
NIH
-PA Author Manuscript
NIH
-PA Author Manuscript
NIH
-PA Author Manuscript
Matveeva et al. Page 23
Inhi
bito
r[R
ef.]1
Stru
ctur
eM
ouse
sEH
IC50
(µM
)
Que
nchi
ng, %
Ksv
(106 )
, M−
1L
ow I
(0.5
mM
)*H
igh
I(5
mM
)
VII
I[2
9]0.
07 ±
0.01
−14
±5
IX [27]
0.06
± 0
.01
−10
±5
Curr Pharm Biotechnol. Author manuscript; available in PMC 2010 September 1.
NIH
-PA Author Manuscript
NIH
-PA Author Manuscript
NIH
-PA Author Manuscript
Matveeva et al. Page 24
Inhi
bito
r[R
ef.]1
Stru
ctur
eM
ouse
sEH
IC50
(µM
)
Que
nchi
ng, %
Ksv
(106 )
, M−
1L
ow I
(0.5
mM
)*H
igh
I(5
mM
)
X [29]
0.20
± 0
.01
0 ±1
0(2
5 µM
)0±
50.
000
Curr Pharm Biotechnol. Author manuscript; available in PMC 2010 September 1.

NIH
-PA Author Manuscript
NIH
-PA Author Manuscript
NIH
-PA Author Manuscript
Matveeva et al. Page 25
Inhi
bito
r[R
ef.]1
Stru
ctur
eM
ouse
sEH
IC50
(µM
)
Que
nchi
ng, %
Ksv
(106 )
, M−
1L
ow I
(0.5
mM
)*H
igh
I(5
mM
)
XI
[29]
0.85
±0.
02−10
±5
(5µM
)−5
±20*
*−0.
044
Curr Pharm Biotechnol. Author manuscript; available in PMC 2010 September 1.

NIH
-PA Author Manuscript
NIH
-PA Author Manuscript
NIH
-PA Author Manuscript
Matveeva et al. Page 26
Inhi
bito
r[R
ef.]1
Stru
ctur
eM
ouse
sEH
IC50
(µM
)
Que
nchi
ng, %
Ksv
(106 )
, M−
1L
ow I
(0.5
mM
)*H
igh
I(5
mM
)
XII
a[2
9]0.
65 ±
0.01
XII
b[2
9]0.
05 ±
0.01
XII
c[2
9]0.
05 ±
0.01
Curr Pharm Biotechnol. Author manuscript; available in PMC 2010 September 1.

NIH
-PA Author Manuscript
NIH
-PA Author Manuscript
NIH
-PA Author Manuscript
Matveeva et al. Page 27
Inhi
bito
r[R
ef.]1
Stru
ctur
eM
ouse
sEH
IC50
(µM
)
Que
nchi
ng, %
Ksv
(106 )
, M−
1L
ow I
(0.5
mM
)*H
igh
I(5
mM
)
XII
I[3
0]0.
284±
0.00
2 [2
7]0.
76 ±
0.02
0 ±
5−3
± 7*
*−0.
002
XIV
[27]
0.8
±0.0
3 [2
7]0.
79 ±
0.08
6±4
Curr Pharm Biotechnol. Author manuscript; available in PMC 2010 September 1.
NIH
-PA Author Manuscript
NIH
-PA Author Manuscript
NIH
-PA Author Manuscript
Matveeva et al. Page 28
Inhi
bito
r[R
ef.]1
Stru
ctur
eM
ouse
sEH
IC50
(µM
)
Que
nchi
ng, %
Ksv
(106 )
, M−
1L
ow I
(0.5
mM
)*H
igh
I(5
mM
)
XV
[29]
2.3
± 0.
340
± 3
(10
µM)
77±5
0.04
2
XV
I[2
7]0.
05 ±
0.01
35±3
(5 µ
M)
***
0.10
7
XV
II88
± 1
180
± 3
(75
µM)
***
0.11
2
Curr Pharm Biotechnol. Author manuscript; available in PMC 2010 September 1.
NIH
-PA Author Manuscript
NIH
-PA Author Manuscript
NIH
-PA Author Manuscript
Matveeva et al. Page 29
Inhi
bito
r[R
ef.]1
Stru
ctur
eM
ouse
sEH
IC50
(µM
)
Que
nchi
ng, %
Ksv
(106 )
, M−
1L
ow I
(0.5
mM
)*H
igh
I(5
mM
)
XV
III
[27]
0.06
± 0
.01
100
(75
µM)
100
± 5
0.16
4
Curr Pharm Biotechnol. Author manuscript; available in PMC 2010 September 1.

NIH
-PA Author Manuscript
NIH
-PA Author Manuscript
NIH
-PA Author Manuscript
Matveeva et al. Page 30
Inhi
bito
r[R
ef.]1
Stru
ctur
eM
ouse
sEH
IC50
(µM
)
Que
nchi
ng, %
Ksv
(106 )
, M−
1L
ow I
(0.5
mM
)*H
igh
I(5
mM
)
XIX
[30]
51.7
±0.7
Curr Pharm Biotechnol. Author manuscript; available in PMC 2010 September 1.

NIH
-PA Author Manuscript
NIH
-PA Author Manuscript
NIH
-PA Author Manuscript
Matveeva et al. Page 31
Inhi
bito
r[R
ef.]1
Stru
ctur
eM
ouse
sEH
IC50
(µM
)
Que
nchi
ng, %
Ksv
(106 )
, M−
1L
ow I
(0.5
mM
)*H
igh
I(5
mM
)
XX
[31]
9.51
± 0
.09
XX
I[2
7]0.
17 ±
0.0
165
± 2
(4 µ
M)
***
0.47
1
XX
II[2
9]1.
7 ±
0.1
Curr Pharm Biotechnol. Author manuscript; available in PMC 2010 September 1.
NIH
-PA Author Manuscript
NIH
-PA Author Manuscript
NIH
-PA Author Manuscript
Matveeva et al. Page 32
Inhi
bito
r[R
ef.]1
Stru
ctur
eM
ouse
sEH
IC50
(µM
)
Que
nchi
ng, %
Ksv
(106 )
, M−
1L
ow I
(0.5
mM
)*H
igh
I(5
mM
)
XX
III
0.08
18±0
.000
7 [2
7]0.
09 ±
0.01
0 ±
15**
XX
IV[2
7]0.
181
±0.0
02 [2
7]0.
05 ±
0.01
XX
V[2
7]0.
0167
±0.
0005
[27]
0.05
±0.
01
XX
VI
[27]
0.00
73±0
.000
1 [2
7]0.
06 ±
0.01
XX
VII
[29]
0.05
±0.
01
1 Ref
eren
ce d
escr
ibin
g th
e sy
nthe
sis o
f the
inhi
bito
r. C
ompo
und
XX
III w
as p
urch
ased
from
“A
ldric
h”.
* [I] w
as 0
.5 m
M o
r low
er; i
f low
er (4
to 7
5 µM
) – th
e co
ncen
tratio
n is
giv
en in
bra
cket
s und
er th
e qu
ench
ing
valu
e.
**ne
gativ
e qu
ench
ing
mea
ns th
at fl
uore
scen
ce e
nhan
cem
ent w
as p
rese
nt in
stea
d of
que
nchi
ng.
*** es
timat
ion
of q
uenc
hing
not
pos
sibl
e du
e to
hig
h flu
ores
cenc
e of
the
inhi
bito
r its
elf.
Curr Pharm Biotechnol. Author manuscript; available in PMC 2010 September 1.
NIH
-PA Author Manuscript
NIH
-PA Author Manuscript
NIH
-PA Author Manuscript
Matveeva et al. Page 33
Tabl
e 2
Inhi
bito
r Ass
ay: Q
uenc
hing
of t
he 3
92-n
m-P
eak
Fluo
resc
ence
of t
he M
ixtu
re E
H+X
IIa
by V
ario
us “
Tran
spar
ent”
Stro
ng E
H In
hibi
tors
Inhi
bito
rQ
uenc
hing
, %(a
t 2–1
0 µM
of t
heT
rans
pare
nt In
hibi
tor)
K(m
ix) S
V (1
06 ),
M−
1
mE
H IC
50 (µ
M)
Col
orim
etri
c A
ssay
(Mea
sure
d in
this
Wor
k)
mE
H IC
50 (µ
M)
Rad
ioac
tive
Ass
ay(fr
om th
e L
itera
ture
[27]
)
mE
H IC
50 (µ
M)
Obt
aine
d fr
om th
e Q
uenc
h-in
g A
ssay
Dat
a, F
ig. (
9B)
II10
± 5
(10
µM)
0.03
050
0
XIX
39 ±
3(1
0 µM
)0.
189
51.7
± 0
.7
XX
40 ±
3(1
0 µM
)0.
326
9.51
± 0.
09
XX
II52
± 2
(10
µM)
0.58
11.
7 ±
0.1
XX
III
46 ±
3(1
0 µM
)0.
813
0.09
± 0
.01
0.08
18±0
.000
7
XX
IV52
± 2
(10
µM)
0.76
20.
05 ±
0.0
10.
181
± 0.
002
0.16
XX
V66
± 3
(10
µM)
1.00
10.
05 ±
0.0
10.
0167
±0.
0005
0.01
3
XX
VI
52 ±
2(1
0 µM
)1.
045
0.06
± 0
.01
0.00
73±0
.000
10.
008
XX
VII
55 ±
3(1
0 µM
)1.
060.
05 ±
0.0
10.
007
Curr Pharm Biotechnol. Author manuscript; available in PMC 2010 September 1.