hydrogeology and preliminary assessment of …
TRANSCRIPT

Water-Resources Investigations Report 87-4000
HYDROGEOLOGY AND PRELIMINARY ASSESSMENT OF REGIONAL FLOW IN THE UPPER CRETACEOUS AND ADJACENT AQUIFERS IN THE NORTHERN
MISSISSIPPI EMBAYMENT
U.S.GEOLOGlCALSURVEY
HYDROGEOLOGY AND PRELIMINARY ASSESSMENT OF REGIONAL FLOW IN THE UPPER CRETACEOUS AND ADJACENT AQUIFERS IN THE NORTHERN MISSISSIPPI EMBAYMENT
by J.V. Brahana and T.O. Mesko
U.S. GEOLOGICAL SURVEY
Water Resources Investigations Report 874000
Nashville, Tennessee 1988

DEPARTMENT OF THE INTERIOR
DONALD PAUL HODEL, Secretary
U.S. GEOLOGICAL SURVEY
Dallas L. Peck, Director
For additional information write to: Copies of this report can be purchased from:
Dism.et Chief U.S. Geological Survey A-413 Federal Building U.S. Courthouse Nashville, Tennessee 37203
U.S. Geological Survty Books and Open-File Reports Section Bar 2S425, Federal Center Bldg. XI0 Denver, Colorado 80225

CONTENTS
Abstract 1 Introduction 1
Objectives 3 Previous investigations 3
Hydrogeology 3 Hydrogeologic framework 6 Regional flow 14
Water levels 14 Water quality 14
Hydraulic characteristics 21 Stresses 27
Modeling the ground-water flow system 27 Conceptualization of the system 27 Model attributes 35 Model requirements 38
Finite-difference grid 38 Boundary conditions and discretized hydrogeology 38 Aquifer hydraulic properties 42 Stresses 47
Preliminary model development 47 Calibration 47 Sensitivity analysis 52
Regional contributions to the hydrologic budget 55 Summary 55 Selected references 61
. . . Ill

ILLUSTRATIONS
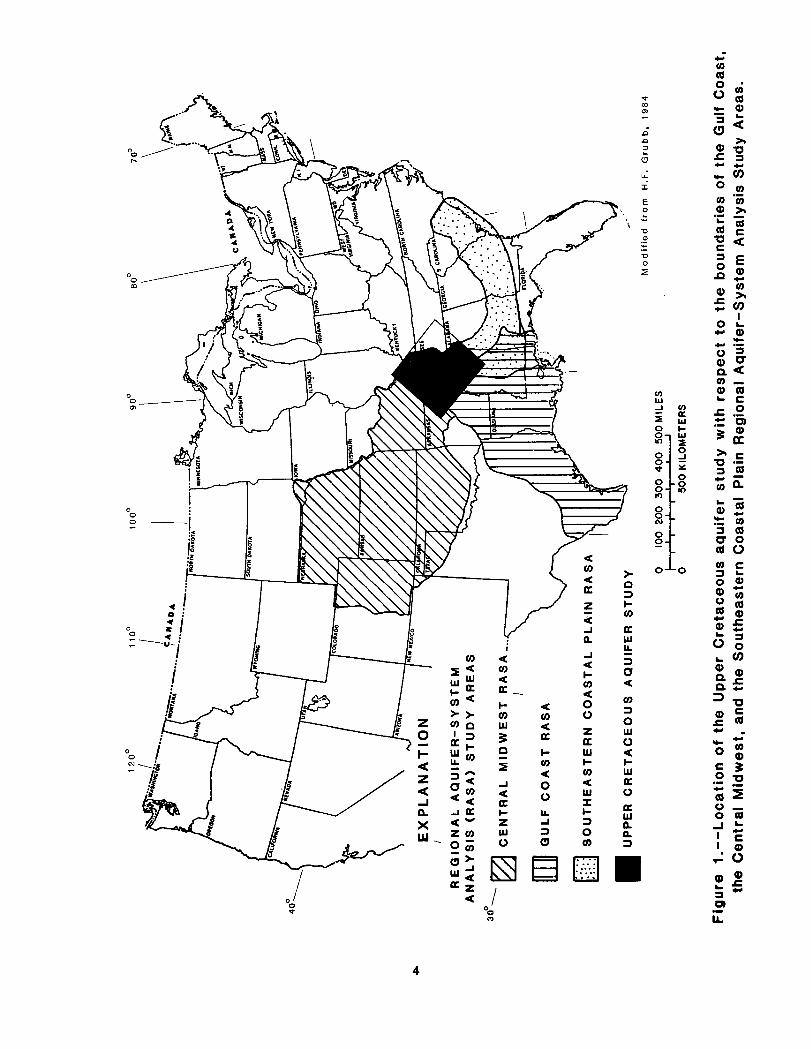
Figures l-3. Maps showing: 1. Location of the Upper Cretaceous aquifer study with respect to the boun-
daries of the Gulf Coast, the Central Midwest, and the Southeastern Coastal Plain Regional Aquifer-System Analysis study areas 4
2. Generalized geology of the study area, including distribution of geophysical logs, location of hydrogeologic sections A-A’ and B-B’, and selected physiographic features S
3. Generalized topography of the study area 7 4. Hydrogeologic section A-A’ from northwest to southeast across the axis
of the Mississippi embayment 8 5. Hydrogeologic section B-B’ from northeast to southwest along the axis
of the Mississippi embayment 9 6-16. Maps showing:
6. Major tectonic features of the northern Mississippi embayment 10 7. Extent and cumulative thickness of sand in the McNairy and Nacatoch
Sands and Ripley Formation 12 8. Extent and thickness of the Midway Group 13 9. Water-level surface of the Ozark-St. Francois aquifer, 1980 15
10. Potentiometric surface of the Upper Cretaceous aquifer, 1980 16 11. Potentiometric surface of the lower Wilcox aquifer, 1980 17 12. Water levels in the alluvial aquifer west of the subcrop with the lower
Wilcox aquifer, spring 1980 18 13. Hydrographs of wells in the Upper Cretaceous, lower Wilcox,
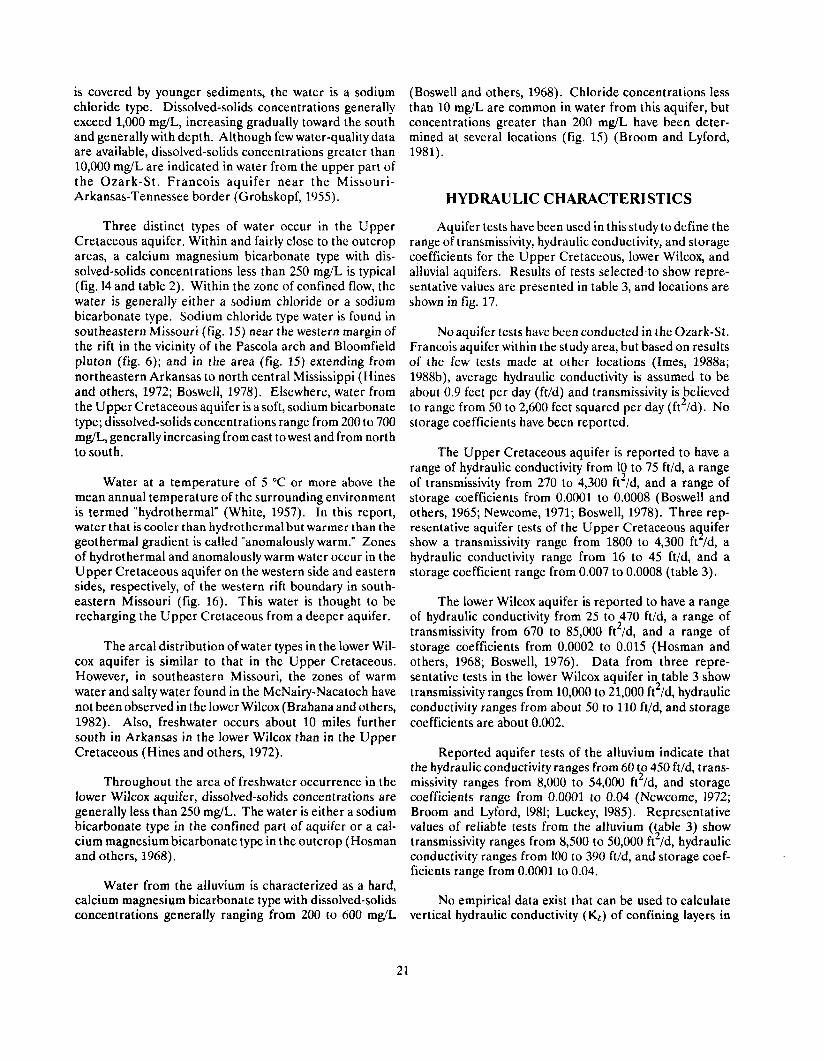
and the alluvial aquifers 19 14. Area1 distribution of dissolved-solids concentrations in water
from the Upper Cretaceous aquifer 22 15. Area1 distribution of dissolved-chloride concentrations in the Upper
Cretaceous aquifer including areas of probable upward leakage into the alluvium 23
16. Location of wells where ground-water temperature data were collected from the Upper Cretaceous aquifer and the relation of water temperature to well depth 24
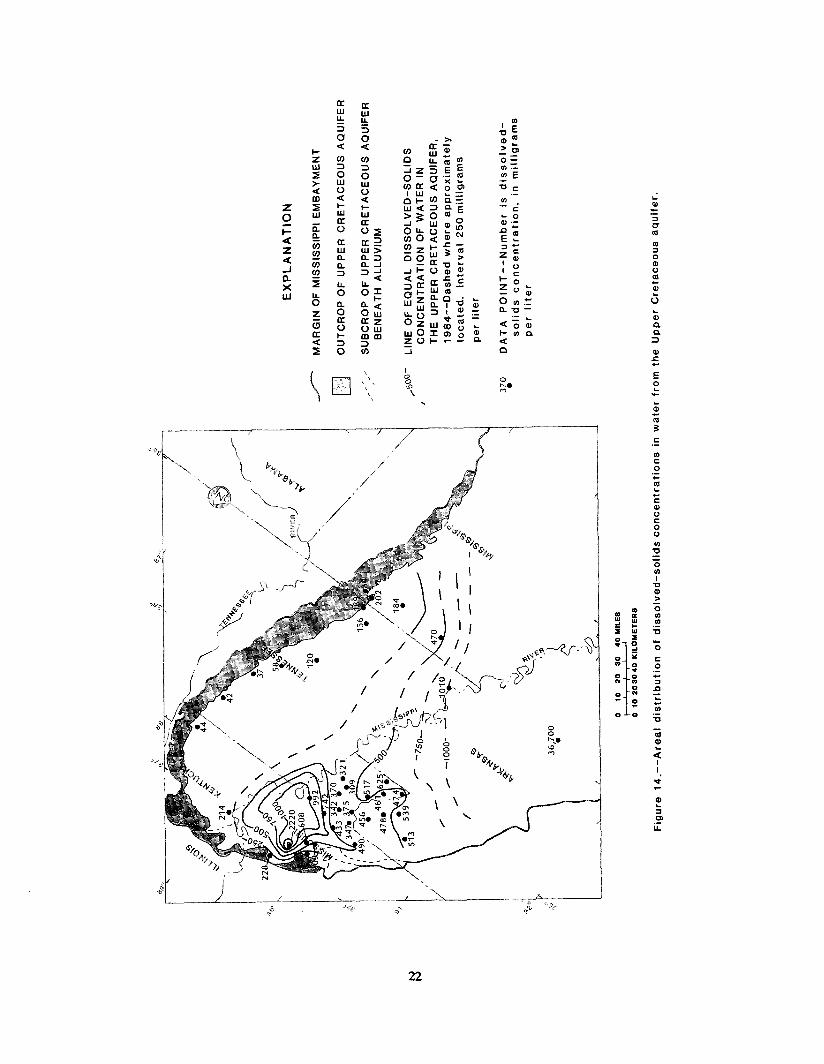
17-24. Maps showing: 17. Location of selected aquifer tests 25 18. Distribution of ground-water withdrawals exceeding 10,000 gallons per day
from GC RASA model grid blocks for the Upper Cretaceous aquifer and the Ozark-St. Francois aquifer in the study area for 1980 28
19. Conceptual model of the major hydrogeologic features of the Ozark- St. Francois aquifer 29
20. Conceptual model of the major hydrogeologic features of the Paleozoic-Cretaceous confining unit 30
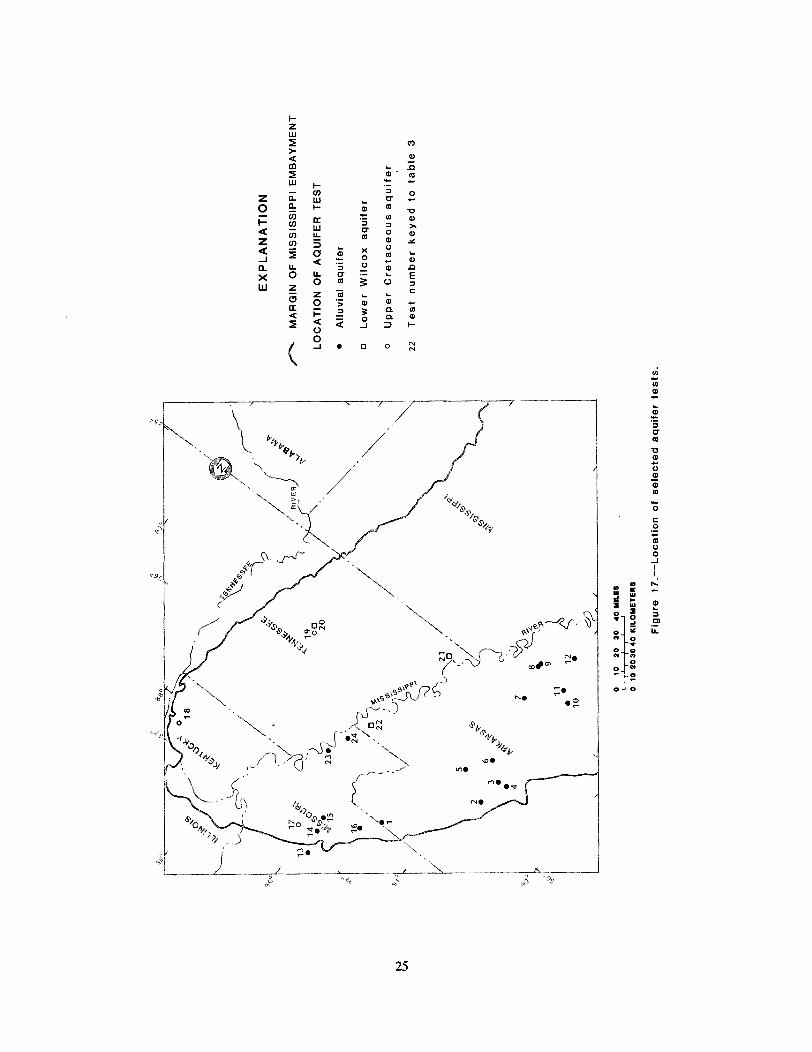
21. Conceptual model of the major hydrogrologic features of the Upper Cretaceous aquifer 32
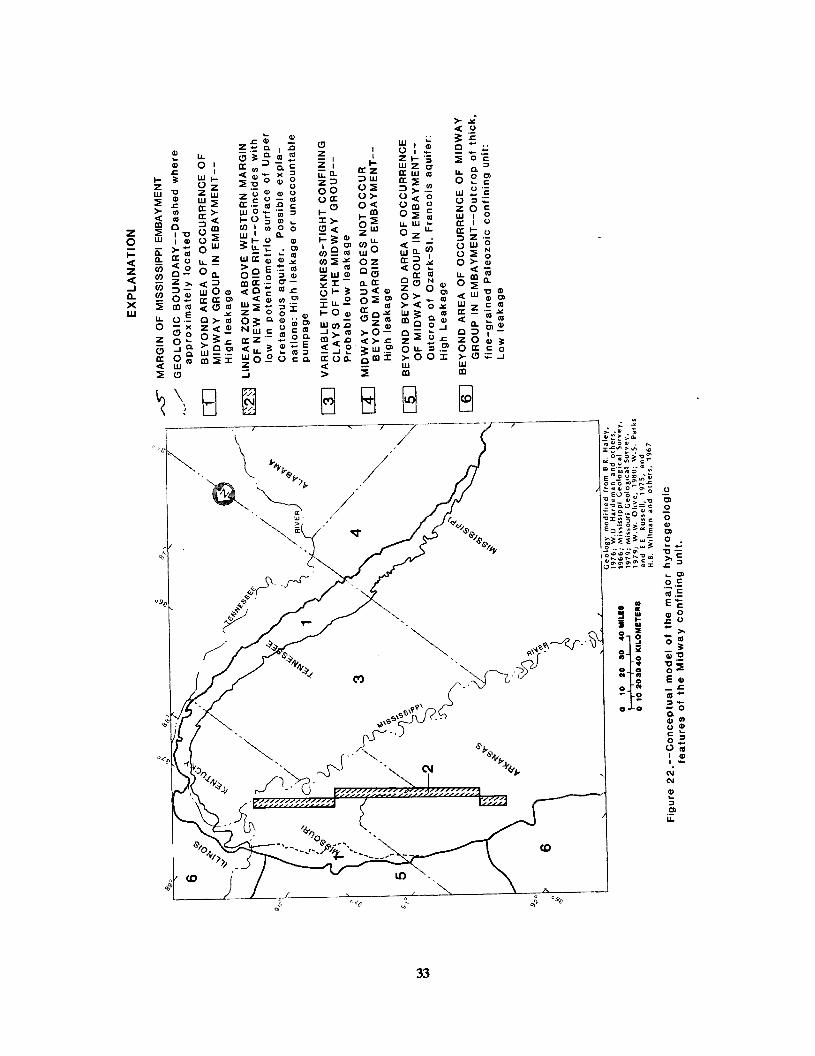
22. Conceptual model of the major hydrogeologic features of the Midway confining unit 33
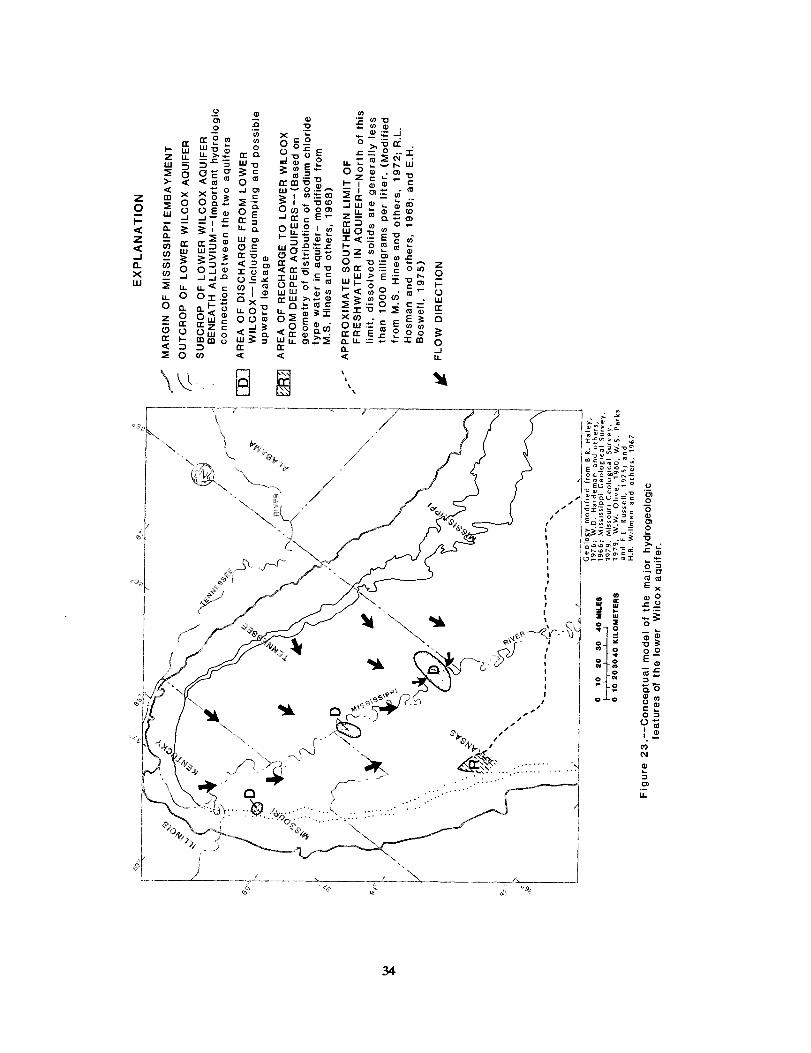
23. Conceptual model of the major hydrogeologic features of the lower Wilcox aquifer 34
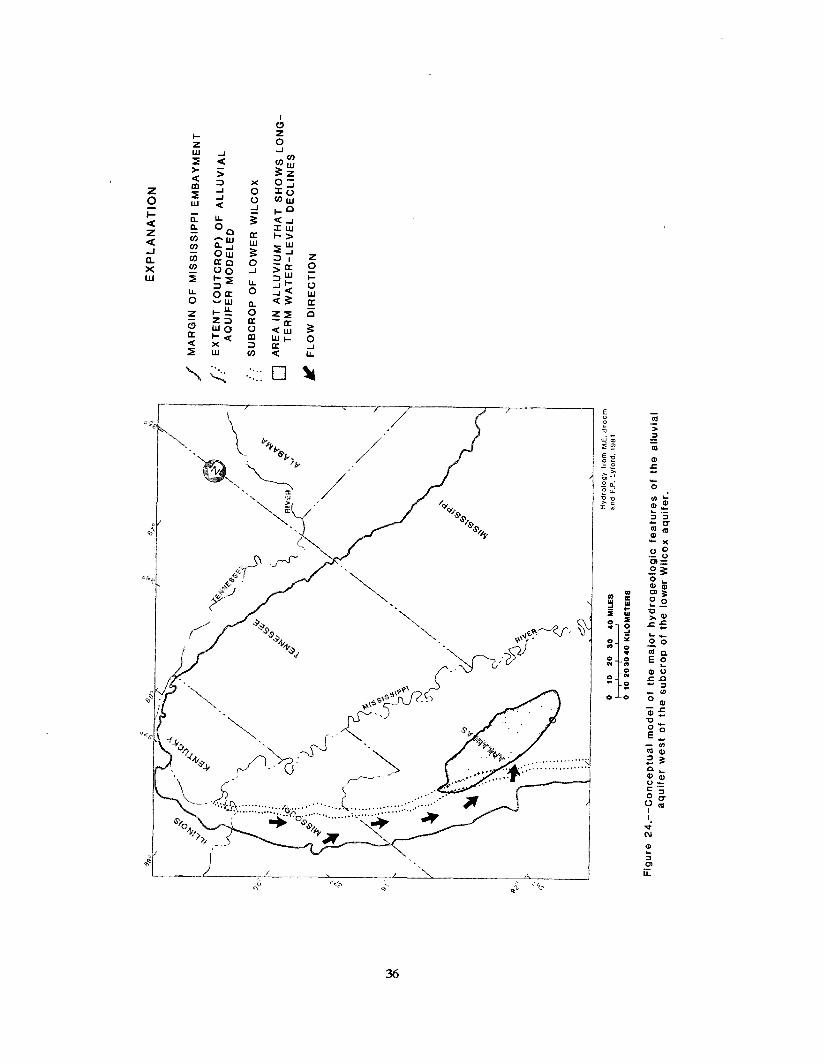
24. Conceptual model of the major hydrogeologic features of the alluvial aquifer west of the subcrop of the lower Wilcox aquifer 36
25. Cross-section showing geologic units of the natural system, hydrogeologic units of the conceptual model, and equivalent model units in the ground-water flow model 37
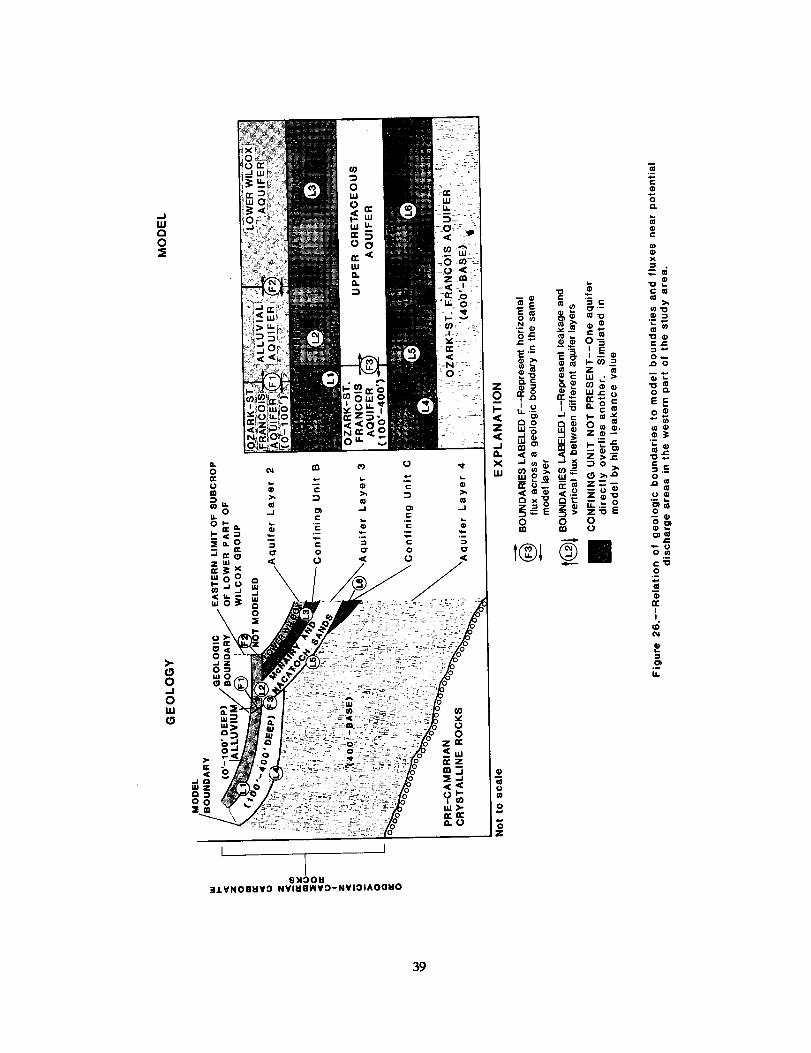
26. Cross section showing relation of geologic boundaries to model boundaries and fluxes near potential discharge areas in the western part of the study area 39
iv

27-31. Maps showing: 27. Digital model representation of aquifer layer 4, Ozark-St. Francois aquifer 40 28. Digital model representation of confining unit C, Cretaceous-Paleozoic
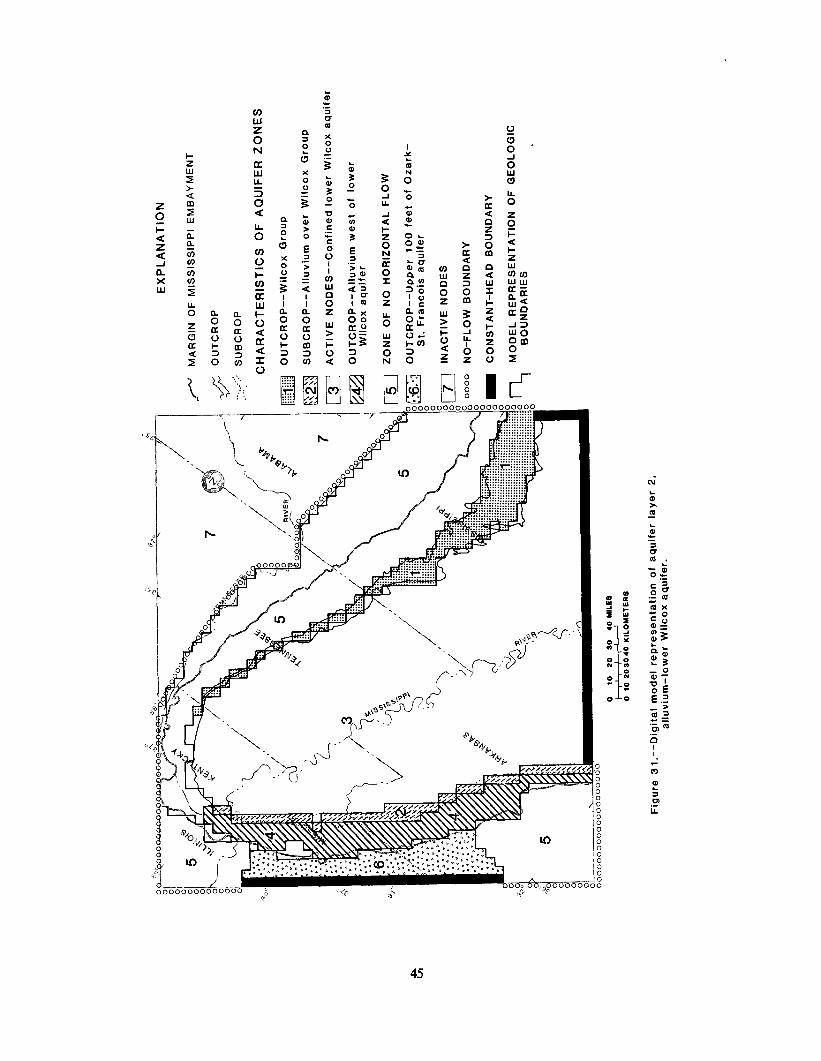
confining unit 41 29. Digital model representation of aquifer layer 3, Upper Cretaceous aquifer 43 30. Digital model representation of confining unit B, Midway confining unit 44 31. Digital model representation of aquifer layer 2, alluvium-lower Wilcox aquifer 45
32. Graph showing range of hydraulic conductivity estimated from aquifer tests and geologic considerations, and the hydraulic conductivity used in the calibrated model for each aquifer 46
33. Map showing comparison of observed and model-calculated heads for the northwestern part of the Ozark-St. Francois aquifer in the study area, calibration to 1980 as steady state 50
34. Map showing comparison of observed and model-calculated heads for the Upper Cretaceous aquifer in the northern Mississippi embayment, calibration to 1980 as steady state 51
35. Graph showing relation between changes in magnitude of input parameters and root mean square error of aquifer layer 4 (Ozark-St. Francois aquifer), calibration to 1980 as steady state 53
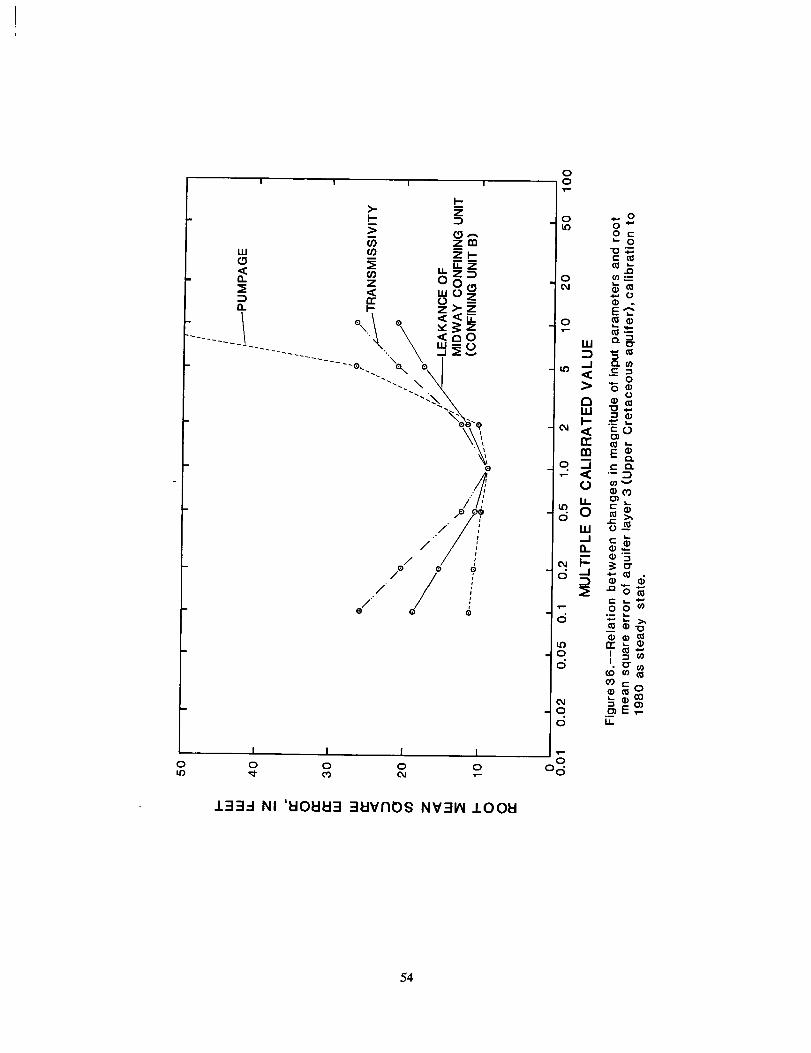
36. Graph showing relation between changes in magnitude of input parameters and root mean square error of aquifer layer 3 (Upper Cretaceous aquifer), calibration to 1980 as steady state 54
37. Idealized cross section showing the main components of the hydrologic budget of the Upper Cretaceous and adjacent aquifers as calculated by the prelim- nary model, calibration to 1980 as steady state 56
38. Map showing areas of recharge and discharge with calculated flux as deter- mined by calibration to 1980 as steady state; confined part of the Ozark-St. Francois aquifer 57
39. Map showing areas of recharge and discharge with calculated flux as deter- mined by calibration to 1980 as steady state; confined part of the Upper Cretaceous aquifer 58
TABLES
Table 1. Summary of the relation of selected regional hydrologic units to the geology of the study area, including a summary of aquifer characteristics 2
2. Comparison of characteristic water types and representative water-quality characteristics for each major aquifer system 20
3. Results of aquifer tests selected to show representative values 26 4. Water use from the Ozark-St. Francois and Upper Cretaceous aquifers for 1980,
by state 27 5. Comparison of input values of RASA models in the northern Mississippi
embayment 48 6. Comparison of simulated results of RASA models in the northern Mississippi
embayment 49
CONVERSION FACTORS
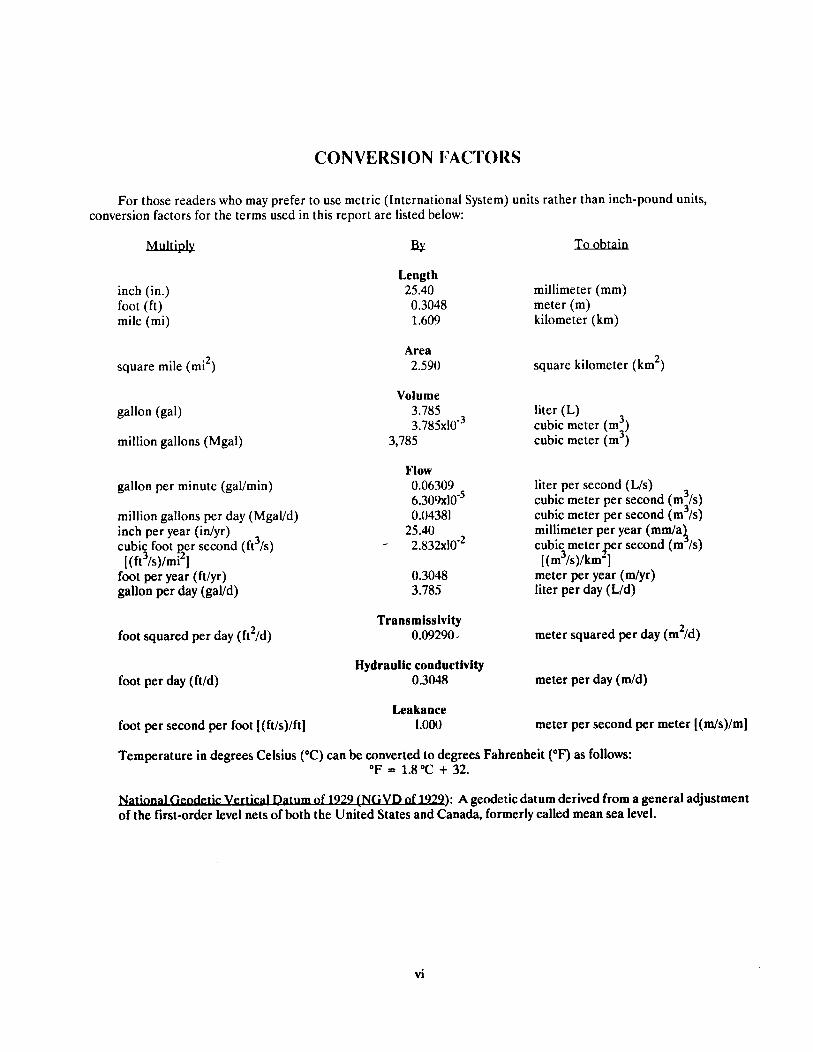
For those readers who may prefer to use metric (International System) units rather than inch-pound units, conversion factors for the terms used in this report are listed below:
MultiDlv
inch (in.) foot (ft) mile (mi)
square mile (mi*)
gallon (gal)
million gallons (Mgal)
gallon per minute (galimin)
million gallons per day (MgaVd) inch per year (in/yr) cubic foot ser second (f?/s) [ (ft3/s)/mi ]
foot per year (ft/yr) gallon per day (gal/d)
foot squared per day (ft*/d)
foot per day (ft/d)
foot per second per foot [(ft/s)/ft]
Length 25.40 0.3048 1.609
Area 2.590
Volume 3.785 3.785~10-~
3,785
Flow 0.06309 6.309x10-* 0.04381
25.40 - 2.832~10.~
0.3048 3.785
Transmissivity 0.09290*
Hydraulic conductivity 0.3048
Leakance 1.000
To
millimeter (mm) meter (m) kilometer (km)
square kilometer (km*)
liter (L) cubic meter (m3) cubic meter (m3)
liter per second (L/s) cubic meter per second (m3/s) cubic meter per second (m3/s) millimeter per year (mm/a cubi%meter per second 3 (m /s) [(m /s)/km’]
meter per year (m/yr) liter per day (L/d)
meter squared per day (m’/d)
meter per day (m/d)
meter per second per meter [(m/s)/m]
Temperature in degrees Celsius (“C) can be converted to degrees Fahrenheit (“F) as follows: “F = 1.8”C + 32.
GVD of u): A geodetic datum derived from a general adjustment of the first-order level nets of both the United States and Canada, formerly called mean sea level.
vi

HYDROGEOLOGY AND PRELIMINARY ASSESSMENT OF REGIONAL FLOW IN THE UPPER CRETACEOUS
AND ADJACENT AQUIFERS IN THE NORTHERN MISSISSIPPI EMBAYMENT
by J.V. Brahana and T.O. Mesko
ABSTRACT On a regional scale, the ground-water system of the
northern Mississippi embayment is composed of a series of nonindurated elastic sediments that overlie a thick sequence of Paleozoic carbonates, sandstones, and shales. Precambrian crystalline rocks form both the structural and the hydrogeologic basement throughout the northern embayment. The units that comprise the hydrogeologic framework of this study are the alluvium-lower Wilcox aquifer, the Midway confining unit, the Upper Cretaceous aquifer, the Cretaceous-Paleozoic confining unit, and the Ozark-St. Francois aquifer. The Upper Cretaceous aquifer of Late Cretaceous age is the primary focus of this investigation; the study is part of the Gulf Coast Regional Aquifer-System Analysis.
A ground-water flow model was developed as the main tool to refine the concepts of deep regional flow in the northern Mississippi embayment. This four layer finite- difference model enabled testing of alternative boundary concepts and provided a refined definition of the hydrologic budget of the deep aquifers.
The alluvium-lower Wilcox aquifer, the Upper Cretaceous aquifer, and the Ozark-St.Francois aquifer form layers 2 through 4, respectively. Layer 1 is an inactive layer of constant heads representing shallow water levels, which are a major control on recharge to and discharge from the regional system. A matrix of leakance values simulates each confining unit, allowing vertical inter- change of water between different aquifers. The model was calibrated to 1980 conditions by using the assumption that 1980 was near steady-state conditions; it was calibrated to simulate observed heads within acceptable limits. For this preliminary model, calculated heads were found to be most sensitive to pumping, and least sensitive to the leakance.
By using all available water-quality and water-level data, alternative boundary conditions were tested by com- paring model simulated heads to observed heads. Simula-
tion indicated that the major discharge zone for the Upper Cretaceous aquifer occurred along a narrow area coinci- dent with the boundary of a buried rift.
The results of the early modeling effort also con- tribute to a better understanding of the regional hydrologic budget, indicating that upward leakage from the Ozark- St. Francois aquifer to the Upper Cretaceous aquifer is about 43 cubic feet per second, with about 30 cubic feet per second occuring west of the western margin of the embay- ment. Calculations suggest upward recharge of about 68 cubic feet per second occurs to the lower Wilcox-alluvium aquifer from the Upper Cretaceous aquifer. Simulation results also indicate that the Midway is an effective regional confining unit.
INTRODUCTION The Upper Cretaceous aquifer of Cretaceous age is a
regionally extensive but relatively little-used aquifer in the northern Mississippi embayment. Throughout much of its area of occurrence, this aquifer is the deepest freshwater source available. Because it is commonly overlain by high- yielding, shallower aquifers that supply most of the water needs of the region, the Upper Cretaceous aquifer has been the focus of few studies. Data are relatively sparse, and details about the hydrogeology and regional flow in this aquifer are poorly defined.
The Upper Cretaceous aquifer, as discussed in this report, includes the McNairy Sand in Missouri, Tennessee, and Kentucky; the Nacatoch Sand in Arkansas; and the Ripley Formation (including the McNairy Sand Member) in Tennessee and Mississippi. Hydrologic units adjacent to the Upper Cretaceous aquifer that are described in this report include the Ozark-St. Francois, the lower Wilcox and the alluvial aquifers, and the undifferentiated Cretaceous-Paleozoic, the Midway, and the undifferen- tiated Claiborne-upper Wilcox confining units (table 1).
1

2
The Upper Cretaceous aquifer study area is irregular- ly shaped and slightly larger than the physical boundaries of the northern Mississippi embayment. The 52,000 square mile area, with maximum dimensions of 240 miles by 260 miles, includes parts of eastern Arkansas, southeastern Missouri, southern Illinois, western Kentucky, western Tennessee, and northern Mississippi (fig. 1). Boundaries of the area are aligned at approximately 50” east of north and 40” west of north.
The Upper Cretaceous aquifer study is a subproject of the larger, regional Gulf Coast Regional Aquifer-Sys- tems Analysis (GC RASA) study. The GC RASA study, one of several RASA studies being conducted by the U.S. Geological Survey on major regional aquifers, is designed to define the hydrogeology of Tertiary and younger age units in the Mississippi embayment and Gulf Coastal area, and of Upper Cretaceous sedimentary rocks where these are used for ground-water supplies in the northern Missis- sippi embayment.
OBJECTIVES
The objectives of this report are (1) to describe the hydrogeology of the Upper Cretaceous and adjacent aquifers; (2) to document the development and calibration of a preliminary multilayer model used to simulate flow within this system of aquifers; and (3) to evaluate quantita- tively the contributions of the various aquifer-system com- ponents to the regional hydrologic budget.
The three-dimensional finite-difference flow model (McDonald and Harbaugh, 1984) is one of several tools that will be used in later studies to develop a more complete understanding of ground-water flow in the northern Mis- sissippi embayment. Final results of the Gulf Coastal Plain RASA study and its subprojects will be documented in chapters of a report in the U.S. Geological Survey Profes- sional Paper series.
PREVIOUS INVESTIGATIONS
Although the hydrogeology of the northern Missis- sippi embayment has been documented in a variety of reports, details of the deep aquifers (Paleozoic and Upper Cretaceous rocks) are not well understood. These forma- tions are not used as widely. as shallower formations for sources of water, and consequently few data exist.
Geologic studies describing lithologic, stratigraphic, and structural aspects of the area include papers by Caplan (1954), Groshkopf (1955), Stearns and Armstrong (195.5), Pryor (1960), Marcher and Stearns (1962), Cushing and
others (1964), Schwalb (1969, 1982), McCracken (1971), Howe and others (1972), and Crone and Russ (1979). Ervin and McGinnis (1975) described the regional tectonics of the northern embayment, and McKeown and Pakiser (1982) edited a collection of papers that examined both the regional tectonics and geophysical studies of the New Madrid, Missouri, earthquake region in detail. Other sig- nificant studies include Stauder and others (1976), Mitchell and others (1977), Hildenbrand and others (1977), Zoback and others (1980), Crone and Brockman (1982), Hil- denbrand and others (1982), Swanberg and others (1982), and Crone and others (1985).
The hydrogeology of the area, including the area1 ex- tent of the geologic units, has been compiled from a variety of sources. The generalized geology (fig. 2) is based on geologic maps published by Arkansas (Haley, 1976), Mis- souri (Anderson and others, 1979), Illinois (Willman and others, 1967), Kentucky (Olive, 1980), Tennessee (Har- deman and others, 1966; Parks and Russell, 1975), and Mis- sissippi (Mississippi Geological Survey, 1979). The basis for current understanding of the hydrogeology of the Cretaceous and younger sediments is a series of interpre- tive reports by Boswell and others (1965), Boswell and others (1968), Hosman and others (1968), Cushing and others (1970), and Davis and others (1973).
Modeling studies that have been conducted in the area on aquifers related to this study include work on the Cretaceous aquifers in northern Missisissippi by Kernodle (1981), on the regional aquifer system of Cretaceous age in Mississippi by Mallory (M.J. Mallory, U.S. Geological Sur- vey, written commun., 1985) and on the Ozark Plateaus aquifer system of Cambrian and Ordovician age in southeastern Missouri and northeastern Arkansas by Imes (1988a, 1988b, 1988~).
In addition to interpretive reports, reports by Boswell (1963, 1978) Hines and others (1972), Davis and others (1973), Newcome (1974), Luckey and Fuller (1980), Was- son (1980), Edds (1982), and Luckey (1985) contain valu- able water-level and water-quality data.
HYDROGEOLOGY Occurrence and movement of ground water in the
study area are controlled by (1) the distribution of recharge to and discharge from the aquifers, (2) the hydraulic gradients established between recharge and discharge loca- tions, (3) the hydraulic characteristics, stratigraphic position, and thickness of aquifers and confining units, and (4) the tectonic setting and structural discontinuites that may serve as hydrogeologic boundaries.
3
4

5
Recharge to the aquifers is provided mostly by precipitation. Mean annual precipitation in the study area ranges from less than 46 inches in southern Illinois to more than 56 inches in northeastern Mississippi (Cushing and others, 1964; U.S. Geological Survey, 1970). Except in areas of intense pumping, more water is available for recharge than the deeper, confined flow systems can ac- cept. Consequently, almost all the water that enters the shallow parts of the aquifer in the outcrop area is dis- charged locally to streams.
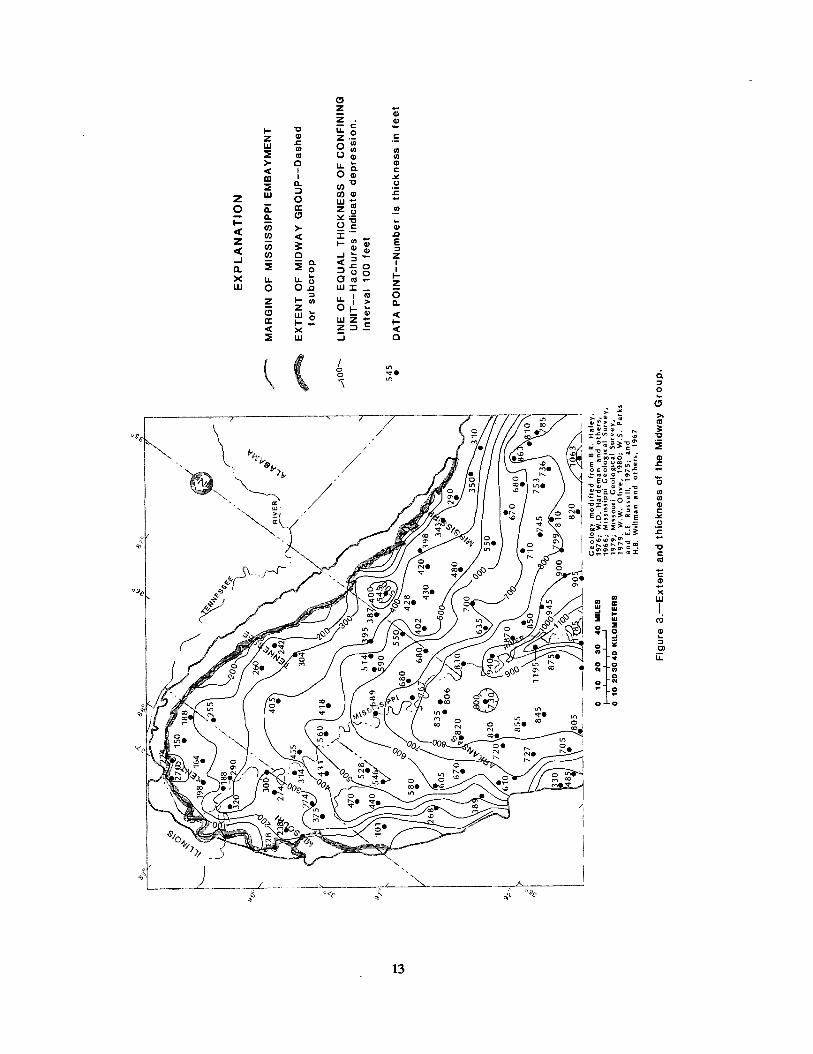
Physiography and altitude of the land surface (fig. 3) influence ground-water levels significantly. In this study, land-surface altitude has been used to estimate the altitude of the water table, based on a multiple linear regression of depth-to-water as a function of land-surface altitude and well depth. Setting well depth equal to the depth-to-water and solving the regression equation for water-table altitude yielded the equation:
.Water-table altitude, in feet = (land-surface altitude, in feet x 0.9585)-3 feet
(A.K. Williamson, U.S. Geological Survey, written com- mun., 1985). This equation was used to generate a water- table map with a calculated average water level for each 5-mile square block. The blocks are defined by the GC RASA model grid (A.K. Williamson, U.S. Geological Sur- vey, written commun., 1985).
HYDROGEOLOGIC FRAMEWORK
The sediments of Cretaceous and Tertiary age that comprise the aquifers and confining units within the area are exposed at land surface in narrow bands that roughly parallel the eastern and northern margins of the embay- ment (fig. 2). Alluvium occurs at the surface throughout most of the western half of the embayment. Carbonate rocks of Cambrian and Early Ordovician age crop out in the western part of the study area as part of the Salem Plateau.
Maps of thickness, sand percentage, and structure of hydrogeologic units described in this report were based primarily on geophysical well logs and secondarily on pre- vious studies. Geophysical logs, which are part of a com- mon data base of all GC RASA regional and subproject studies, were selected to give the most regionally repre- sentative three-dimensional definition of the system (R.L. Hosman, written commun., 1985).
Hydrogeologic sections A-A’ (fig. 4) and B-B’ (fig. 5) illustrate the vertical framework of the system with reference to the Upper Cretaceous aquifer, and table 1 lists
generalized hydraulic characteristics of this framework. Section A-A’ is transverse to and section B-B’ is parallel to the axis of the embayment (fig. 2). These sections illustrate the southward plunging synclinal structure of the embay- ment, show the relatively flat relief of the land surface, and indicate the relative thickness of the units.
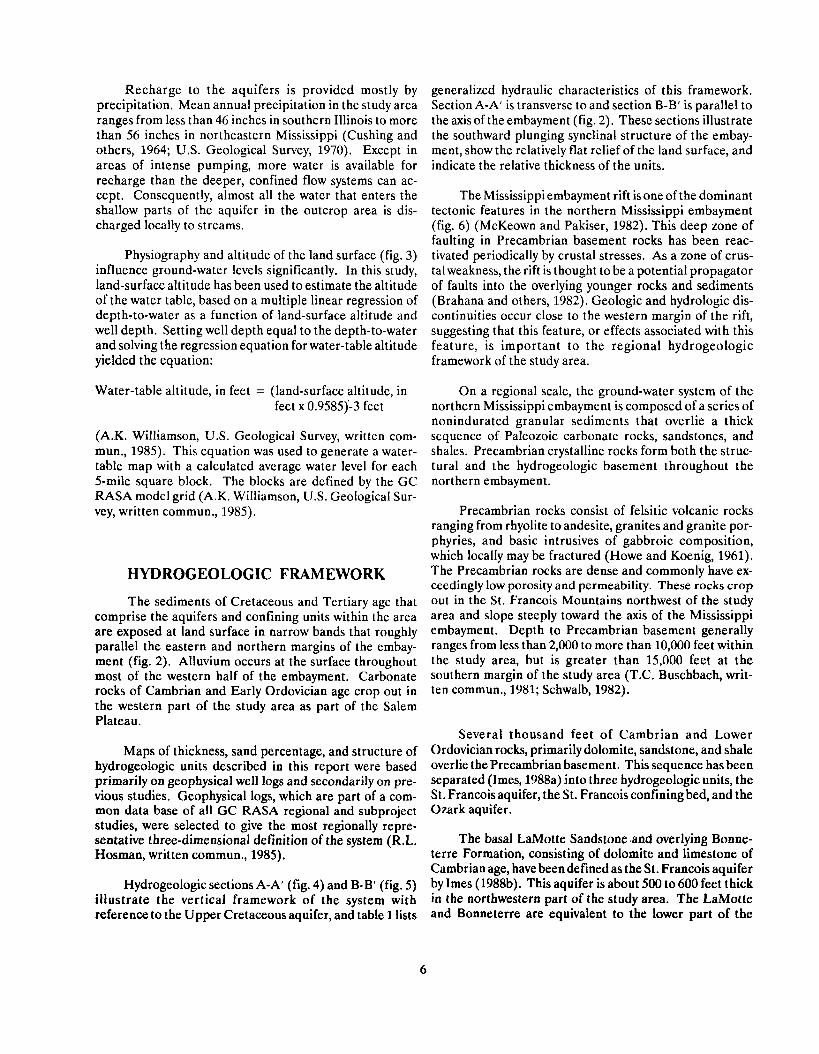
The Mississippi embayment rift is one of the dominant tectonic features in the northern Mississippi embayment (fig. 6) (McKeown and Pakiser, 1982). This deep zone of faulting in Precambrian basement rocks has been reac- tivated periodically by crustal stresses. As a zone of crus- tal weakness, the rift is thought to be a potential propagator of faults into the overlying younger rocks and sediments (Brahana and others, 1982). Geologic and hydrologic dis- continuities occur close to the western margin of the rift, suggesting that this feature, or effects associated with this feature, is important to the regional hydrogeologic framework of the study area.
On a regional scale, the ground-water system of the northern Mississippi embayment is composed of a series of nonindurated granular sediments that overlie a thick sequence of Paleozoic carbonate rocks, sandstones, and shales. Precambrian crystalline rocks form both the struc- tural and the hydrogeologic basement throughout the northern embayment.
Precambrian rocks consist of felsitic volcanic rocks ranging from rhyolite to andesite, granites and granite por- phyries, and basic intrusives of gabbroic composition, which locally may be fractured (Howe and Koenig, 1961). The Precambrian rocks are dense and commonly have ex- ceedingly low porosity and permeability. These rocks crop out in the St. Francois Mountains northwest of the study area and slope steeply toward the axis of the Mississippi embayment. Depth to Precambrian basement generally ranges from less than 2,000 to more than 10,000 feet within the study area, but is greater than 15,000 feet at the southern margin of the study area (T.C. Buschbach, writ- ten commun., 1981; Schwalb, 1982).
Several thousand feet of Cambrian and Lower Ordovician rocks, primarily dolomite, sandstone, and shale overlie the Precambrian basement. This sequence has been separated (lmes, 1988a) into three hydrogeologic units, the St. Francois aquifer, the St. Francois confining bed, and the Ozark aquifer.
The basal LaMotte Sandstone ,and overlying Bonne- terre Formation, consisting of dolomite and limestone of Cambrian age, have been defined as the St. Francois aquifer by Imes (1988b). This aquifer is about 500 to 600 feet thick in the northwestern part of the study area. The LaMotte and Bonneterre are equivalent to the lower part of the
6

0 l- <
k W

IddlSSlSSlR ---- 33SS3NN31
----- _--- ---- - \- --r- -- --__
8
__--- _----
*_-- ,’
,’ ,
, I
,
I’ s
1’
1’ I
, I I I I
Q
s 0
8

lddlSSlsS,W -__-
33FSBNN31 --_- S”SNV*YV
----I
33SS3NN31LV-V N3113FS -
/’ --’
I,- _*’ c’
*_r- _____-__ - -____- ICL __--
- -Y 1’----- --- _________
I’ I /
!’ Y,L - - - -y. , I
,
9
W
3
m

Copper Ridge Dolomite, which is part of the Knox Group in the eastern part of the study area (Schwalb, 1982).
The St. Francois aquifer is confined by the overlying St. Francois confining bed (Imes, 1988c), which consists of shale, siltstone, fine-grained sandstone, dolomite, and limestone conglomerate. These units total about 500 feet in thickness and include the Davis, Derby and Doe Run Formations of Late Cambrian age (Howe and Koenig, 1961). In the eastern part of the study area, these forma- tions are equivalent to the middle part of the Copper Ridge Dolomite (Schwalb, 1982).
The Ozark aquifer consists of eight formations that overlie the St. Francois confining bed (Imes, 1988d). These formations, in ascending order, are the Potosi Formation and Eminence Dolomite of Cambrian age, and the Gas- conade Dolomite, Roubidoux Formation, Jefferson City and Cotter Dolomites, Smithville Formation, and Powell Dolomite of Early Ordovician age, (Howe and Koenig, 1961). They are primarily siliceous dolomites, with some beds of sandstone and minor shale. The dolomites have well-developed zones of secondary porosity and per- meability throughout the area of this study, including the area beneath the embayment.
A highly diverse sequence of rocks ranging in age from Middle Ordovician to Late Cretaceous may overlie the Ozark-St. Francois aquifer, depending on its location (Howe and Koenig, 1961; Boswell and others, 1965; Davis and others, 1973; Schwalb, 1982). In this report, these rocks are named the undifferentiated Cretaceous- Paleozoic confining unit. Data describing the hydrology of these rocks where they occur more than several hundred feet deep are scarce. Based on geologic data from the few deep oil-exploration wells in the embayment, the undif- ferentiated Paleozoic and Cretaceous rocks are believed to form a regional confining layer in the subsurface. Some formations of Cretaceous age within this sequence are known to function as aquifers at shallow depths around the margins of the embayment and as regional aquifers in the southeastern part of the study area (Boswell and others, 1965; Davis and others, 1973; M.J. Mallory, written commun., 1986). In the southern part of the study area, Middle Ordovician to Upper Cretaceous rocks have an ag- gregate thickness of more than 11,000 feet (fig. 5). Thick- ness decreases to the north, and this sequence of rocks is absent in the central part of the study area (fig. 5).
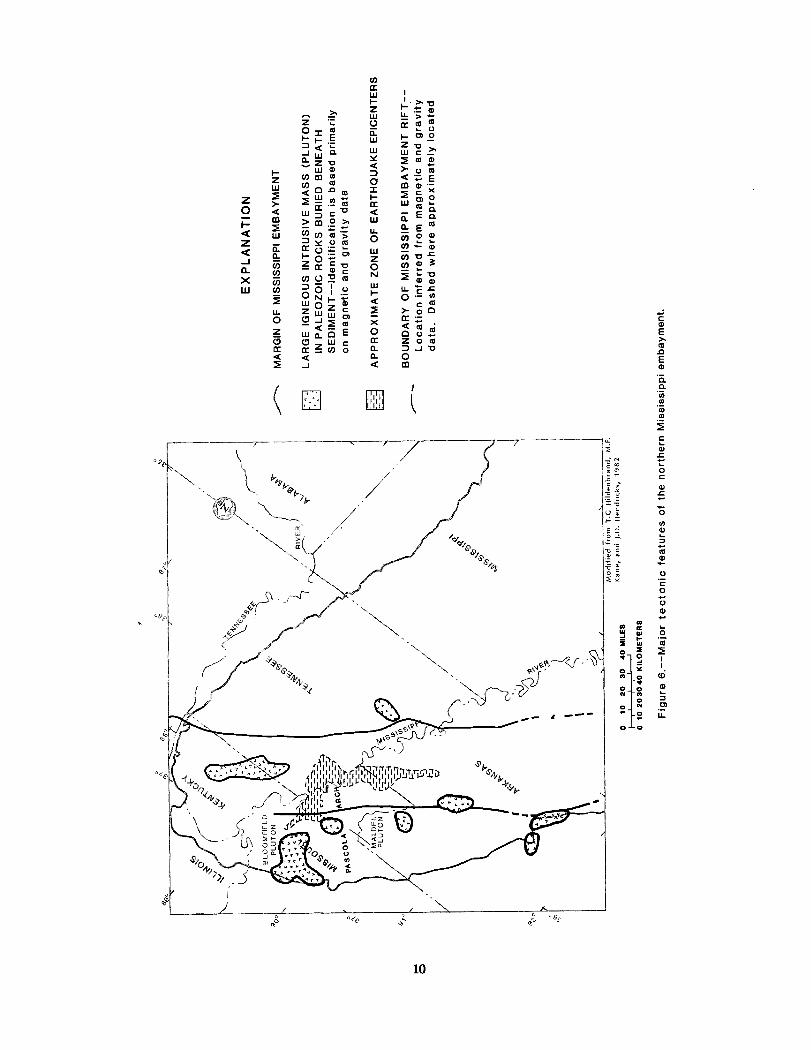
The Upper Cretaceous aquifer, consisting of the Mc- Nairy and Nacatoch Sands and the Ripley Formation (in- cluding the McNairy Sand Member), is composed of glauconitic, clayey sand interbedded with clay and chalk. Coarse sediments are common in the north, and clay and chalk predominate in the south (Boswell and others, 1965). The aquifer underlies most of the study area and crops out
at the north end of Crowleys Ridge in Missouri and along the eastern edge of the embayment in Kentucky, Tennessee, and northern Mississippi.
Total thickness of the Upper Cretaceous aquifer ranges from 0 to about 500 feet, with the thickest zones oc- curring in the north central part of the study area in western Tennessee and southeastern Missouri. Cumulative sand thickness in the Upper Cretaceous aquifer (fig. 7), ranges from 0 to about 440 feet.
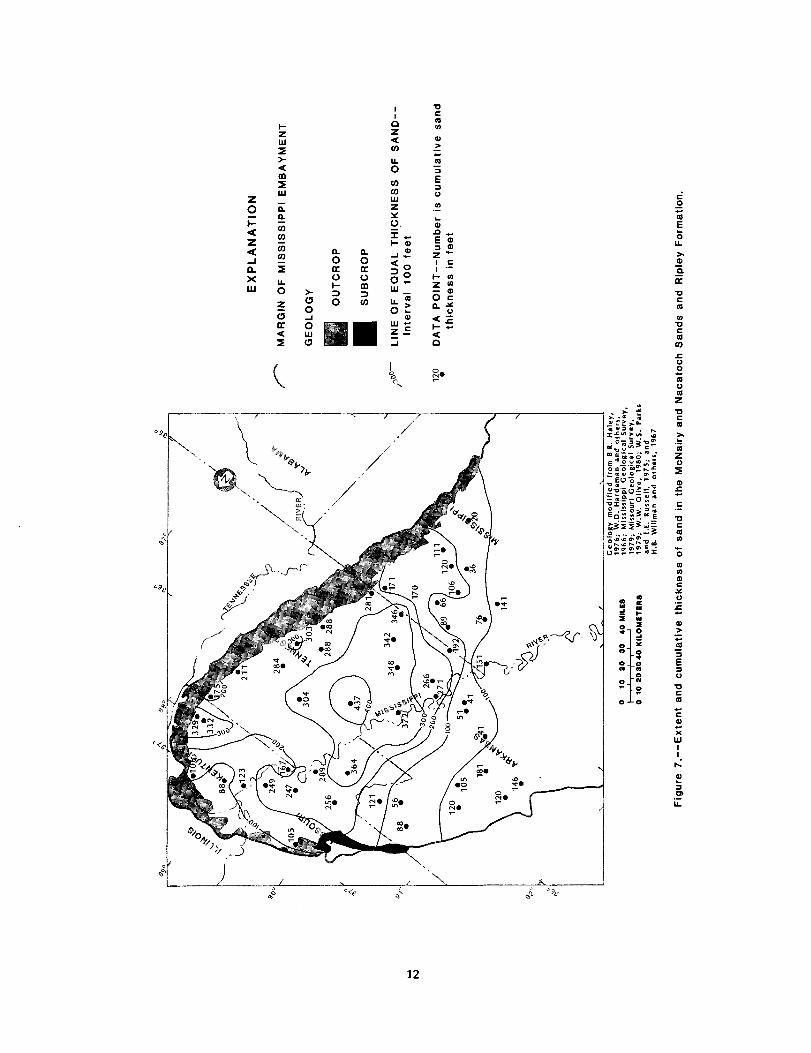
The Midway confining unit (Midway Group consist- ing of the Clayton Formation and Porters Creek Clay) con- sists primarily of fine-grained sediments and overlies the Upper Cretaceous aquifer throughout most of its area of occurrence in the northern embayment. The confining unit ranges in thickness from a few feet along its subcrop to about 1,200 feet in the south central part of the study area (fig. 8).
The lower Wilcoxaquifer (composed of sands and clay of the lower part of the Wilcox Group) overlies the Midway confining unit. The Wilcox Group is undifferentiated in Arkansas and Kentucky, but has been subdivided and cor- related in Missouri and Tennessee (Hosman and others, 1968). Throughout much of the area, sands of the lower Wilcox aquifer are separated from sands in the upper part of the Wilcox Group by clays in the middle and upper part of the Wilcox Group (Hosman and others, 1968). In the northern part of the study area where it subcrops, the Wil- cox may be in direct contact with the alluvium (fig. 4). Sand thickness of the lower Wilcox Group may exceed 600 feet near the center of the embayment in northwestern Mississippi.
Upper sands in the Wilcox and younger Eocene for- mations, are referred to in this report as the undifferen- tiated Claiborne-upper Wilcox confining unit. These upper Wilcox and younger Eocene aquifers are described in a separate GC RASA study of the Mississippi embay- ment aquifer system (Arthur and Taylor, 1988).
The Mississippi River Valley alluvial aquifer (al- luvium) consists of sand, gravel, silt, and clay, and is the sur- ficial aquifer throughout the western part of the embayment. The extent and thickness (a few to 250 feet) of this alluvial aquifer have been mapped by Fisk (1944), Krinitzsky and Wire (1964), Boswell and others (1968), and Luckey (1985). The alluvial aquifer directly overlies parts of the lower Wilcox, Upper Cretaceous, and Ozark-St. Francois aquifers in a subcrop relation (fig. 4).
11
12
REGIONAL FLOW
Estimates of the regional flow in the Upper Cretaceous aquifer were based primarily on water levels. Because this aquifer is relatively deep and ground-water supplies are readily available from shallower aquifers; extensive areas exist where no water wells tap the Upper Cretaceous or deeper aquifers. For those areas, informa- tion from oil test wells was used to estimate regional ground-water flow.
Water Levels
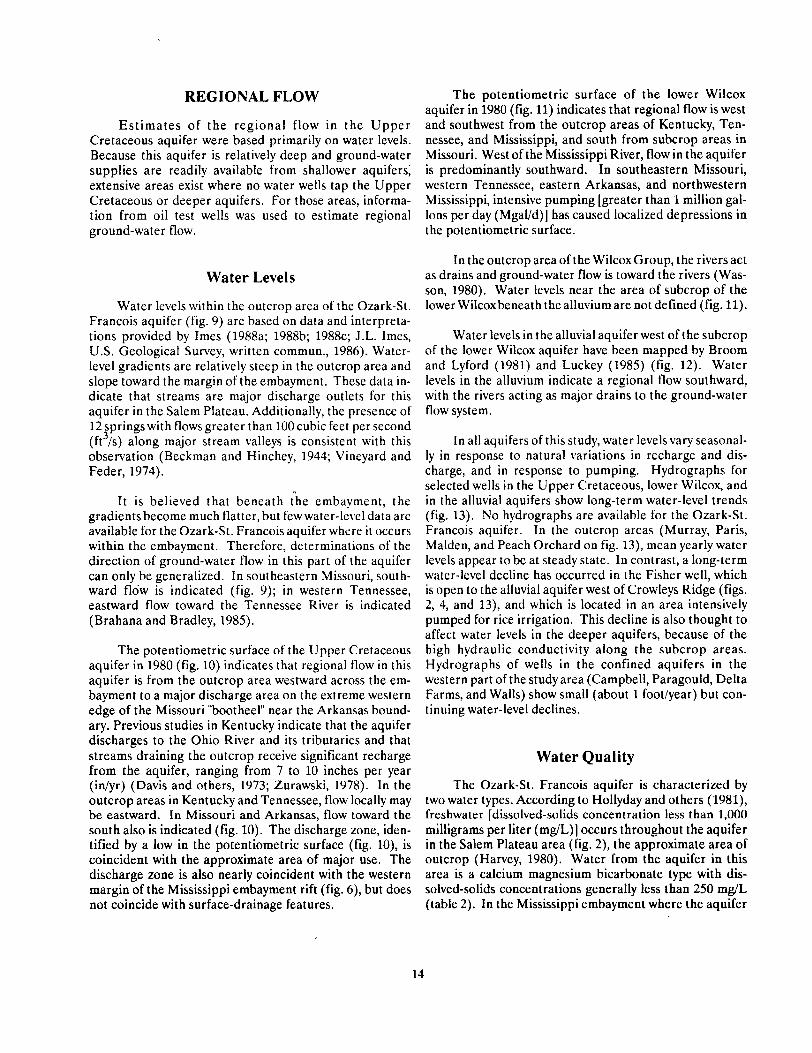
Water levels within the outcrop area of the Ozark-St. Francois aquifer (fig. 9) are based on data and interpreta- tions provided by Imes (1988a; 1988b; 1988~; J.L. Imes, U.S. Geological Survey, written commun., 1986). Water- level gradients are relatively steep in the outcrop area and slope toward the margin of the embayment. These data in- dicate that streams are major discharge outlets for this aquifer in the Salem Plateau. Additionally, the presence of 12 springs with flows greater than 100 cubic feet per second (ft3/s) along major stream valleys is consistent with this observation (Beckman and Hinchey, 1944; Vineyard and Feder, 1974).
It is believed that beneath t-he embayment, the gradients become much flatter, but few water-level data are available for the Ozark-St. Francois aquifer where it occurs within the embayment. Therefore, determinations of the direction of ground-water flow in this part of the aquifer can only be generalized. In southeastern Missouri, south- ward flow is indicated (fig. 9); in western Tennessee, eastward flow toward the Tennessee River is indicated (Brahana and Bradley, 1985).
The potentiometric surface of the Upper Cretaceous aquifer in 1980 (fig. 10) indicates that regional flow in this aquifer is from the outcrop area westward across the em- bayment to a major discharge area on the extreme western edge of the Missouri “bootheel” near the Arkansas bound- ary. Previous studies in Kentucky indicate that the aquifer discharges to the Ohio River and its tributaries and that streams draining the outcrop receive significant recharge from the aquifer, ranging from 7 to 10 inches per year (in/yr) (Davis and others, 1973; Zurawski, 1978). In the outcrop areas in Kentucky and Tennessee, flow locally may be eastward. In Missouri and Arkansas, flow toward the south also is indicated (fig. 10). The discharge zone, iden- tified by a low in the potentiometric surface (fig. lo), is coincident with the approximate area of major use. The discharge zone is also nearly coincident with the western margin of the Mississippi embayment rift (fig. 6), but does not coincide with surface-drainage features.
The potentiometric surface of the lower Wilcox aquifer in 1980 (fig. 11) indicates that regional flow is west and southwest from the outcrop areas of Kentucky, Ten- nessee, and Mississippi, and south from subcrop areas in Missouri. West of the Mississippi River, flow in the aquifer is predominantly southward. In southeastern Missouri, western Tennessee, eastern Arkansas, and northwestern Mississippi, intensive pumping [greater than 1 million gal- lons per day (Mgahd)] has caused localized depressions in the potentiometric surface.
In the outcrop area of the Wilcox Group, the rivers act as drains and ground-water flow is toward the rivers (Was- son, 1980). Water levels near the area of subcrop of the lower Wilcoxbeneath the alluvium are not defined (fig. 11).
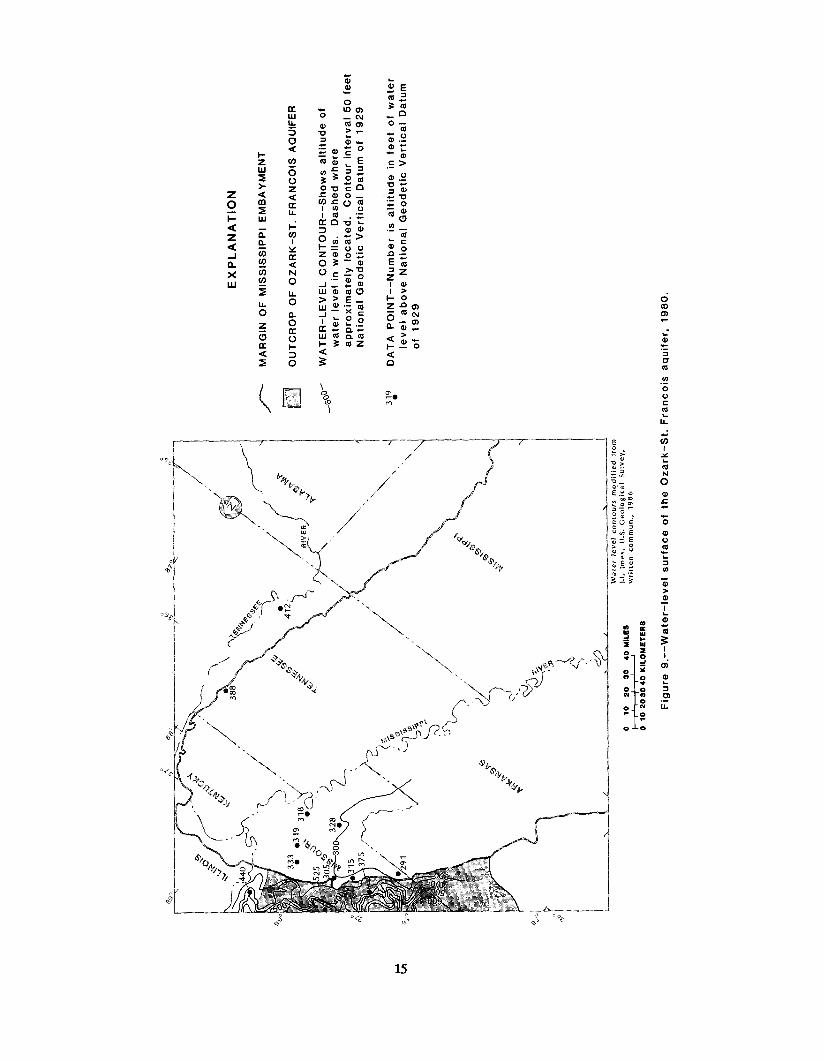
Water levels in the alluvial aquifer west of the subcrop of the lower Wilcox aquifer have been mapped by Broom and Lyford (1981) and Luckey (1985) (fig. 12). Water levels in the alluvium indicate a regional flow southward, with the rivers acting as major drains to the ground-water flow system.
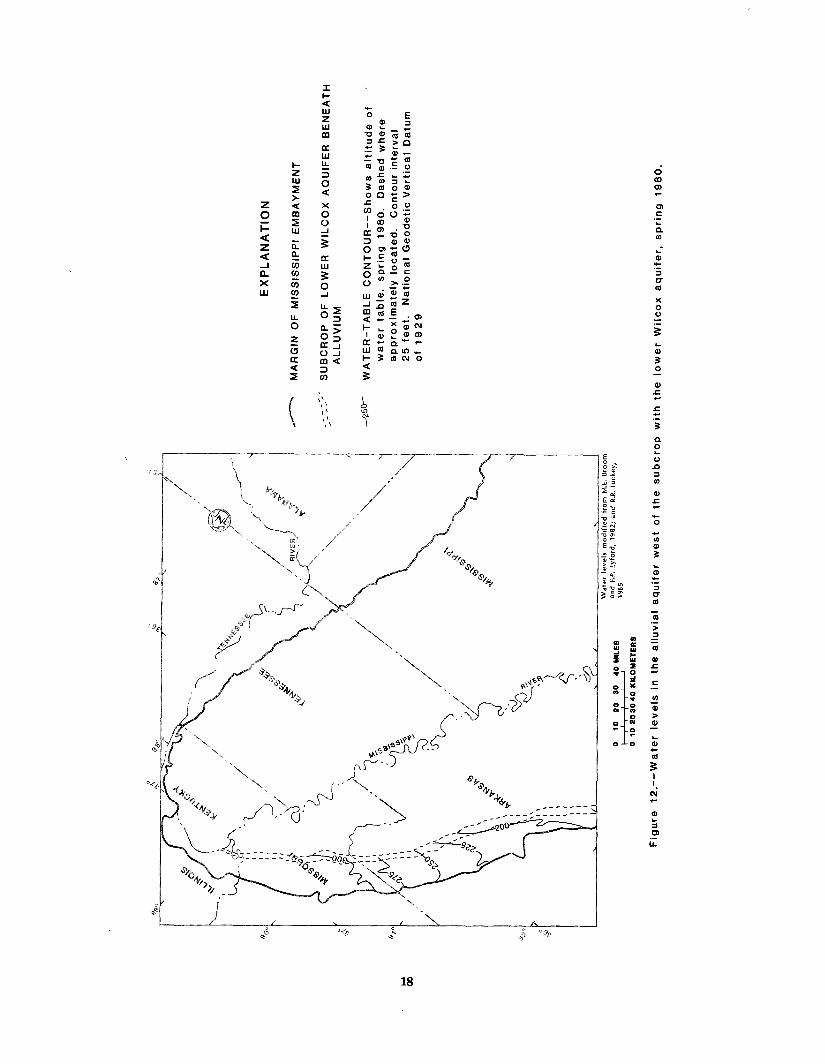
In all aquifers of this study, water levels vary seasonal- ly in response to natural variations in recharge and dis- charge, and in response to pumping. Hydrographs for selected wells in the Upper Cretaceous, lower Wilcox, and in the alluvial aquifers show long-term water-level trends (fig. 13). No hydrographs are available for the Ozark-St. Francois aquifer. In the outcrop areas (Murray, Paris, Malden, and Peach Orchard on fig. 13), mean yearly water levels appear to be at steady state. In contrast, a long-term water-level decline has occurred in the Fisher well, which is open to the alluvial aquifer west of Crowleys Ridge (figs. 2, 4, and 13), and which is located in an area intensively pumped for rice irrigation. This decline is also thought to affect water levels in the deeper aquifers, because of the high hydraulic conductivity along the subcrop areas. Hydrographs of wells in the confined aquifers in the western part of the study area (Campbell, Paragould, Delta Farms, and Walls) show small (about 1 foot/year) but con- tinuing water-level declines.
Water Quality
The Ozark-St. Francois aquifer is characterized by two water types. According to Hollyday and others (1981), freshwater [dissolved-solids concentration less than 1,000 milligrams per liter (mg/L)] occurs throughout the aquifer in the Salem Plateau area (fig. 2), the approximate area of outcrop (Harvey, 1980). Water from the aquifer in this area is a calcium magnesium bicarbonate type with dis- solved-solids concentrations generally less than 250 mg/L (table 2). In the Mississippi embayment where the aquifer
14

c
0 P
16

17
18
i I : : 1 i
a f! 5 P
33VdklllS ClNVl MO139 HO 3A08V 1334 NI ‘13h3-l tl3lVM
c .-

Y
is covered by younger sediments, the water is a sodium chloride type. Dissolved-solids concentrations generally exceed 1,000 mg/L, increasing gradually toward the south and generally with depth. Although few water-quality data are available, dissolved-solids concentrations greater than 10,000 mg/L are indicated in water from the upper part of the Ozark-St. Francois aquifer near the Missouri- Arkansas-Tennessee border (Grohskopf, 1955).
Three distinct types of water occur in the Upper Cretaceous aquifer. Within and fairly close to the outcrop areas, a calcium magnesium bicarbonate type with dis- solved-solids concentrations less than 250 mg/L is typical (fig. 14 and table 2). Within the zone of confined flow, the water is generally either a sodium chloride or a sodium bicarbonate type. Sodium chloride type water is found in southeastern Missouri (fig. 15) near the western margin of the rift in the vicinity of the Pascola arch and Bloomfield pluton (fig. 6); and in the area (fig. 15) extending from northeastern Arkansas to north central Mississippi (Hines and others, 1972; Boswell, 1978). Elsewhere, water from the Upper Cretaceous aquifer is a soft, sodium bicarbonate type; dissolved-solids concentrations range from 200 to 700 mg./L, generally increasing from east to west and from north to south.
Water at a temperature of 5 “C or more above the mean annual temperature of the surrounding environment is termed “hydrothermal” (White, 1957). In this report, water that is cooler than hydrothermal but warmer than the geothermal gradient is called “anomalously warm.” Zones of hydrothermal and anomalously warm water occur in the Upper Cretaceous aquifer on the western side and eastern sides, respectively, of the western rift boundary in south- eastern Missouri (fig. 16). This water is thought to be recharging the Upper Cretaceous from a deeper aquifer.
The area1 distribution of water types in the lower Wil- cox aquifer is similar to that in the Upper Cretaceous. However, in southeastern Missouri, the zones of warm water and salty water found in the McNairy-Nacatoch have not been observed in the lower Wilcox (Brahana and others, 1982). Also, freshwater occurs about 10 miles further south in Arkansas in the lower Wilcox than in the Upper Cretaceous (Hines and others, 1972).
Throughout the area of freshwater occurrence in the lower Wilcox aquifer, dissolved-solids concentrations are generally less than 250 mg/L. The water is either a sodium bicarbonate type in the confined part of aquifer or a cal- cium magnesium bicarbonate type in the outcrop (Hosman and others, 1968).
Water from the alluvium is characterized as a hard, calcium magnesium bicarbonate type with dissolved-solids concentrations generally ranging from 200 to 600 mg/L
(Boswell and others, 1968). Chloride concentrations less than 10 mg/L are common in water from this aquifer, but concentrations greater than 200 mg/L have been deter- mined at several locations (fig. 15) (Broom and Lyford, 1981).
HYDRAULIC CHARACTERISTICS
Aquifer tests have been used in this study to define the range of transmissivity, hydraulic conductivity, and storage coefficients for the Upper Cretaceous, lower Wilcox, and alluvial aquifers. Results of tests selectedto show repre- sentative values are presented in table 3, and locations are shown in fig. 17.
Noaquifer tests have been conducted in the Ozark-St. Francois aquifer within the study area, but based on results of the few tests made at other locations (Imes, 1988a; 1988b), average hydraulic conductivity is assumed to be about 0.9 feet per day (ft/d) and transmissivity is believed to range from 50 to 2,600 feet squared per day (ft2/d). No storage coefficients have been reported.
The Upper Cretaceous aquifer is reported to have a range of hydraulic conductivity from 19 to 75 ft/d, a range of transmissivity from 270 to 4,300 ft’/d, and a range of storage coefficients from 0.0001 to 0.0008 (Boswell and others, 1965; Newcome, 1971; Boswell, 1978). Three rep- resentative aquifer tests of the Upper Cretaceous a
9 uifer
show a transmissivity range from 1800 to 4,300 ft Id, a hydraulic conductivity range from 16 to 45 ft/d, and a storage coefficient range from 0.007 to 0.0008 (table 3).
The lower Wilcox aquifer is reported to have a range of hydraulic conductivity from 25 to 470 ft/d, a range of transmissivity from 670 to 85,000 ft2/d, and a range of storage coefficients from 0.0002 to 0.015 (Hosman and others, 1968; Boswell, 1976). Data from three repre- sentative tests in the lower Wilcox aquifer in table 3 show transmissivity ranges from 10,000 to 21,000 ft2/d, hydraulic conductivity ranges from about 50 to 110 ft/d, and storage coefficients are about 0.002.
Reported aquifer tests of the alluvium indicate that the hydraulic conductivity ranges from 60 to 450 ft/d, trans- missivity ranges from 8,000 to 54,000 ft”ld, and storage coefficients range from 0.0001 to 0.04 (Newcome, 1972; Broom and Lyford, 1981; Luckey, 1985). Representative values of reliable tests from the alluvium (table 3) show transmissivity ranges from 8,500 to 50,000 ft2/d, hydraulic conductivity ranges from 100 to 390 ft/d, and storage coef- ficients range from 0.0001 to 0.04.
No empirical data exist that can be used to calculate vertical hydraulic conductivity ( KL) of confining layers in
21
:, 8 \
\

-_. --- 7
r-----
/”

r
24


the study area. Typical hydraulic conductivity value2 for clays reported in the literature range from 10‘ to 10 ft/d (Freeze and Cherry, 1979). The hydraulic conductivity for the Midway confining layer was assumed to be 10” fttd, based on drilling records of the Midway that indicate it is a tight, low permeable unit throughout the northern embay- ment. Typical hydraulic conductivity values for lime- stone and dolomite range from IO’ to IO- ft/d, and for shale range from 10e3 to 10.’ ftid. The hydraulic conductivity for the Cretaceous-Paleozoic confining bed was assumed to be 10’ ft/d where the dominant lithology was limestone or dolomite, and 10” ft/d where the dominant lithology was shale.
STRESSES
Pumpage from each aquifer has been defined for the entire Gulf Coast RASA Regional Project area (D.J. Ackerman, personal commun., 1986). Individual wells that pump more than 10,000 gal/d for municipal, public supply, or industrial users have been identified. Pumpage from these wells represents about 75 percent of the total for the area (table 4). The remaining 25 percent of the pumpage is from rural, domestic, stock, irrigation, and other wells generally not identified in existing water-use studies. Pumpage, where not otherwise available, was estimated from population and per capita use data. Individual pump- ing sites reported by aquifer are shown in figure 18.
about the flow system. Althoughsimplified from the physi- cal system, a model should be consistent with all known hydrogeologic observations.
CONCEPTUALIZATION OF THE SYSTEM
Most of the flow in the Ozark-St. Francois aquifer occurs in the Salem Plateau, the area where the Lower Ordovician rocks that comprise the upper part of this aquifer outcrop (figs. 2 and 19). Precipitation directly recharges the aquifer in this area, and flow is transmitted through well-developed zones of secondary permeability to major springs and streams (Beckman and Hinchey, 1944; Harvey, 1980). Major springs in the outcrop area have components ofboth local and regional flow, suggesting that’ deeper flow paths are an important, dynamic part of the flowsystem (Feder, 1973). Deep flow is also consistent with the observation that in the Salem Plateau the aquifer con- tains freshwater throughout its entire thickness. Flow within or from the Ozark-St. Francois is believed to be more restricted in the embayment because the overlying sediments have low permeability and restrict vertical move- ment of water into or out of the aquifer.
Although most of the water in the Ozark-St. Francois aquifer is discharged to springs and streams in the outcrop area, a small amount is believed to flow southeast beneath the western margin of the embayment to discharge into
Table 4.--Water use from the Ozark-St. Francois and Upper Cretaceous aquijers for 1980, by state
[All units are in thousand gallons per day]
Ozark-St. Francois aquifer Upper Cretaceous aqurfer Total reported
State Public supply Public supply and
Rural domestic and industrial Rural domestic and industrial simulated
Arkansas 300 * 800 l 800 900 2,600 Missouri 500 * 1,600 500 * 4,200 6,800 Illinois
i 0 0 0 0
Kentucky 1,100* 3,400 4.500 Tennessee 0 0” 2,000 * 6,800 8,800 Mississippi 0 0 500 500 1,000
Total 800 2,400 4,700 15,800 23,700
*Estimated. All other values are reported (D.J. Ackerman, U.S. Geological Survey, written commun., 1986)
overlying aquifers (fig. 19). The discharge occurs com- MODELING THE GROUND-WATER monly along faults (Stearns and Zurawski, 1976; Schwalb,
FLOW SYSTEM 1982; Stauder, 1982; Crone and others, 1985), and zones where the Midway confining layer has been removed or
The physical system, described in the previous section thinned by erosion (fig. 20) (Schwalb, 1982). Areas where of ground-water hydrology, is the basis for a ground-water relatively high dissolved-solids concentrations occur in flow model. A model that simulates actual aquifer behavior water from the Upper Cretaceous aquifer and the alluvium provides a powerful tool with which to test understanding are believed to coincide with discharge from the
27

0 .- ;n

/’ /
/ I
I
29

30

underlying, more mineralized Ozark-St. Francois aquifer. With the exception of a zone of flow between the outcrop area and the discharge areas within the western part of the embayment, flow in the Ozark-St. Francois aquifer is believed to be small,
Water-quality and water-level data from wells in the upper few hundred feet of the Ozark-St. Francois aquifer in central Tennessee indicate that flow from the aquifer east of the study area is discharged to the Tennessee River. The Ozark-St. Francois aquifer is within several hundred feet of land surface east of the Tennessee River and receives significant recharge by downward leakage (Brahana and Bradley, 1985). A freshwater zone occurs in the upper part of the aquifer in that area. West of the Tennessee River, dissolved-solids concentrations, ranging from 4,000 to 5,000 mg/L in water from the few wells sampled, indicate little freshwater recharge or circulation. The Tennessee River in western Tennessee is thought to be a regional dis- charge area and thus serves as a constant-head boundary.
Toward the south, the Ozark-St. Francois aquifer deepens rapidly and is overlain by a thickening wedge of undifferentiated Paleozoic and Cretaceous rocks (fig. 5). The southern part of the Ozark-St. Francois aquifer is probably a zone of very restricted ground-water flow. This assumption is based on the depth of the top of the aquifer, the thickness of the overlying confining layer, and the salinity of water in the aquifer. No head data exist from this part of the aquifer.
The undifferentiated Cretaceous-Paleozoic confining unit thins from the margins of the study area toward the center of the northern part of the embayment (fig. 20). Consequently, the potential for leakage through the con- fining unit is less near the southern and northern boun- daries and is higher in the center of the study area. Leakage potential through the confining unit may also be relatively higher near the western margin of the rift and the Pascola arch-Bloomfield pluton (fig. 20).
Deep regional freshwater flow in the Upper Cretaceous aquifer occurs north of a line from the eastern boundary of the embayment near latitude 34” N. to the western boundary of the embayment at latitude 36” N. (fig. 21). Flow is from topographically high recharge areas at the northern and eastern margins of the embayment to topographically low discharge areas where Cretaceous sediments subcrop beneath the alluvium (fig. 2). Water level in the alluvium is thought to control aquifer discharge or recharge at the subcrop.
In addition to recharge at the outcrop, the Upper Cretaceous aquifer is thought to be recharged in two dis- tinct areas in southeastern Missouri by upward leakage from the Ozark-St. Francois aquifer. An area of recharge
overlying the Pascola arch (figs. 6, 20, and 21), has been delineated by differences in water-quality parameters. These differences include variations in water type, and in dissolved-solids, chloride, and trace-constituent con- centrations (Brahana and others, 1985). Based on carbon isotope (14C) data, water in the Upper Cretaceous aquifer in the area of the Pascola arch-Bloomfield pluton is younger than water elsewhere in the confined part of the aquifer (Brahana and others, 1985).
The second area of recharge is slightly east of the western margin of the rift and is defined by the zone of hydrothermal water in the Upper Cretaceous aquifer (fig. 16). Recharge to the Upper Cretaceous aquifer east of the rift area is less mineralized than in the area of the Pascola arch, more hydrothermal, and is relatively older based on 14C isotope age interpretations (Brahana and others, 1985).
Unpublished radium isotope ratio data indicate that much of the Upper Cretaceous aquifer in southeastern Missouri is receiving recharge from the deep Ozark-St. Francois aquifer (Tom Kraemer, written commun., 1986).
Regional flow south of the line delineating freshwater in the Upper Cretaceous aquifer is assumed to be small (fig. 21). This assumption is based on (1) the higher dissolved- solids concentrations of the water toward the south, and (2) the decreasing permeability, caused by increasing amounts of clay, marl, and chalk in the Upper Cretaceous aquifer toward the south (Boswell and others, 1965).
Water levels in the Upper Cretaceous and the lower Wilcox aquifers (separated by the Midway confining unit), indicate an upward gradient from the Upper Cretaceous aquifer to the lower Wilcox aquifer for most of the area (figs. 10 and 11). Head differences of as much as 100 feet have been documented at Memphis (Graham and Parks, 1985).
A linear zone above the western margin of the rift (fig. 22) coincides with a low in the potentiometric surface of the Upper Cretaceous aquifer (fig. 10). This zone is an hypothesized area of higher leakance, possibly related to faulting overlying the rift. The occurrence of a hydrother- mal anomaly in the lower Wilcox aquifer is also consistent with the hypothesis of greater upward leakage near the rift. Dissolved chloride and dissolved-solids concentrations, however, suggest that leakage across the Midway confining unit is minor in the vicinity of the rift.
Regional flow in the lower Wilcox is from the outcrop areas in the east and from the subcrop area in the north (fig. 23). Flow is confined throughout the area shown, ex- cept in the outcrop. Discharge from the aquifer occurs at three major pumping centers, along parts of the subcrop in
31
, / \
32
> J d”
33
. . . . . . .
I)
.?@ /* __,;. “. : ::. ,,, ‘.._ .90 ::
(, ,.,.,,....: .:.:: . _....,_,,_, :... . . .
%, \
34

Missouri and Arkansas, and upward to shallower aquifers beneath the alluvial plain of the Mississippi River. The occurrence of a sodium chloride type water in east central Arkansas at about latitude 36” N. and longitude 91” W. (Hines and others, 1972) suggests vertical upward leakage of salty water from deeper aquifers, including the Upper Cretaceous and the Ozark-St. Francois aquifers. Faults in the Midway confining unit near the western margin of the rift or deep wells drilled through the Midway and later abandoned are two possible explanations of the upward leakage. To the south in Mississippi, the approximate southern limit of freshwater in the aquifer is thought to rep- resent an abrupt change in flow conditions. South and west of this freshwater limit, flow is very sluggish, because of restricted discharge upward through a thick sequence of confining clays. North and east of this boundary, the exist- ence of freshwater documents that a deep regional dynamic flow system is active.
Flow within the alluvial aquifer is generally from north to south and locally from ground-water highs toward streams that drain the area (fig. 24) (Broom and Lyford, 1981; Luckey, 1985). In the southwestern part of the area, flow in the aquifer is toward the southeast. Throughout most of the area, water levels in the alluvium have remained relatively stable. An exception is the area west of Crowleys Ridge (fig. 2), where declines in alluvial water levels have been observed for more than 30 years (figs. 13 and 24) (Broom and Lyford, 1981).
Upward leakage from deeper aquifers is suspected of causing anomalously high chloride concentrations in water from the alluvium (fig. IS), but is thought to represent a small percentage of the total flux in the alluvium. An evaluation of a water budget of the alluvium indicates that surface-water and shallow ground-water contributions are probably several orders of magnitude greater than water contributed by confined aquifers (Luckey, 1985).
MODEL ATTRIBUTES
The ground-water flow model used in this study was developed by McDonald and Harbaugh (1984) and has the following attributes:
0 flow in a sequence of layered aquifers separated by confining units can be simu- lated
. simulation of hydrologic features by several alternative methods is facilitated because of the modular design of the model
l documentation and testing of the model in hydrogeologic settings similiar to the study area has been conducted.
In this model, the differential equations of ground- water flow are simulated by an iterative numerical techni- que known as the strongly implicit procedure using the development and notation of Weinstein and others (1969). The theory and use of the model is documented thoroughly by McDonald and Harbaugh (1984), and no additional description of the general aspects of their work is included here.
A four layer model (three aquifers and one source bed) was constructed to represent the regional flow system in the Upper Cretaceous aquifer and adjacent hydrogeologic units. The relation between geologic units of the natural system, hydrogeologic units of the concep- tual model, and equivalent units in the ground-water flow model is shown in figure 25.
Layer 1, the top layer of the model, represents a hydrologic boundary in the form of a source-sink term that allows movement and evaluation of recharge or discharge across the upper surface of the active model. Layers 2,3, and 4 are simulated with a matrix that represents the hydraulic properties of the geologic units modeled.
Aquifer layers of the model are separated by matrices called confining units in this report. Geologically, the con- fining units are not present at all locations throughout the area of the model; they are absent in the western part of the model area, where the Ozark-St. Francois aquifer out- crops, and where the Ozark-St. Francois and Upper Cretaceous aquifers subcrop beneath the alluvium. Nodes in the model representing areas where the confining units are absent are modeled as high leakance, with aquifer directly overlying aquifer. The quantitative value used for these high leakance nodes is approximated as an average vertical hydraulic conductivity of the aquifers divided by an average distance between the centers of the aquifers.
At locations where the confining units exist, the con- ductance between aquifer layers represents the leakance of the confining units. The leakance matrix for the Midway confining unit (confining unit B) was determined by divid- ing an areally uniform vertical hydraulic conductivity for the layer by the average thickness of the unit within each grid block (a 25 mi* area). The leakance matrices for the upper confining unit (confining unit A) and the Cretaceous-Paleozoic confining unit (confining unit C) were determined by separating the confining units into zones based on hydrogeologic characteristics to be dis- cussed later. Each zone was assigned a specific leakance. Horizontal flow in confining units is not calculated.
Because of the complex relation of geologic boun- daries to model boundaries and because of fluxes near potential discharge areas in the western part of the study
c
X W
a 5 3 i a

\ \ \ \ \ \ \ \ \

area, a more detailed section view is given in figure 26. In addition to showing the horizontal and vertical boundaries across which flux is evaluated, the section view shows the multi-unit geologic makeup of model layers 2 and 3. Layer 2 consists of the top 100 feet of the Cambrian and Or- dovician carbonate rocks in the Salem Plateau, the alluvium west of the subcrop of the lower Wilcox aquifer, and the lower Wilcox aquifer. Layer 3 consists of the Upper Cretaceous aquifer and of Cambrian and Ordovician car- bonate rocks that occur from 100 to 400 feet below land sur- face in the Salem Plateau area.
Aquifer layer 4 represents most of the Cambrian and Ordovician carbonate rock section (table 1; figs. 25 and 26). Aquifer layer 4 includes the St. Francois aquifer, the St. Francois confining layer, and the Ozark aquifer, except for the top 400 feet which is included in layers 3 and 2 (Imes, 1988b, 1988~). The two aquifers and one confining unit have been combined into one model layer, because under the Mississippi embayment these rocks are thought to func- tion as a single aquifer (J.L. Imes, written commun., 1985).
MODEL REQUIREMENTS
The digital model requires that the studied area be divided into discrete subareas (blocks), and that a finite- difference approximation of the continuous differential equation be solved for each block for specified boundary conditions, aquifer hydraulic properties, and pumping stresses. An orthogonal grid defines the discretization and arrangement of blocks in the model.
Finite-Difference Grid
A 48 row by 52 column grid was used to divide the study area (fig. 18). Grid spacing is equidemensional, resulting in blocks 5 miles on a side. The grid is coincident with the regional Gulf Coast RASA grid, and with all Gulf Coast RASA subproject grids. This coincidence facilitates interchange of fluxes and heads at common boundaries be- tween the various models. Because the blocks in the regional RASA grid spacing are 10 miles on each side, each regional grid block corresponds to four model grid blocks in the Upper Cretaceous model (fig. 18).
Alignment of the regional grid, which was oriented to minimize the number of inactive nodes, originally dictated the alignment of the model grid of the Upper Cretaceous aquifer. Transmissivity was not used to determine grid alignment, because on a regional scale there was no evidence of anisotropic transmissivity (Hayes Grubb, U.S. Geological Survey, oral commun., 1986). An evaluation of an aquifer test of the Eocene Memphis Sand of the
Claiborne Group at Memphis using tensor analysis (Ran- dolph and others, 1985) was conducted after the grid was , aligned. This evaluation indicated a slight anisotropy (2.3 to 1) with principal axes oriented within lo” of the grid of the Upper Cretaceous aquifer model (Morris Maslia, U.S. Geological Survey, written commun., 1985).
Boundary Conditions and Discretized Hydrogeology
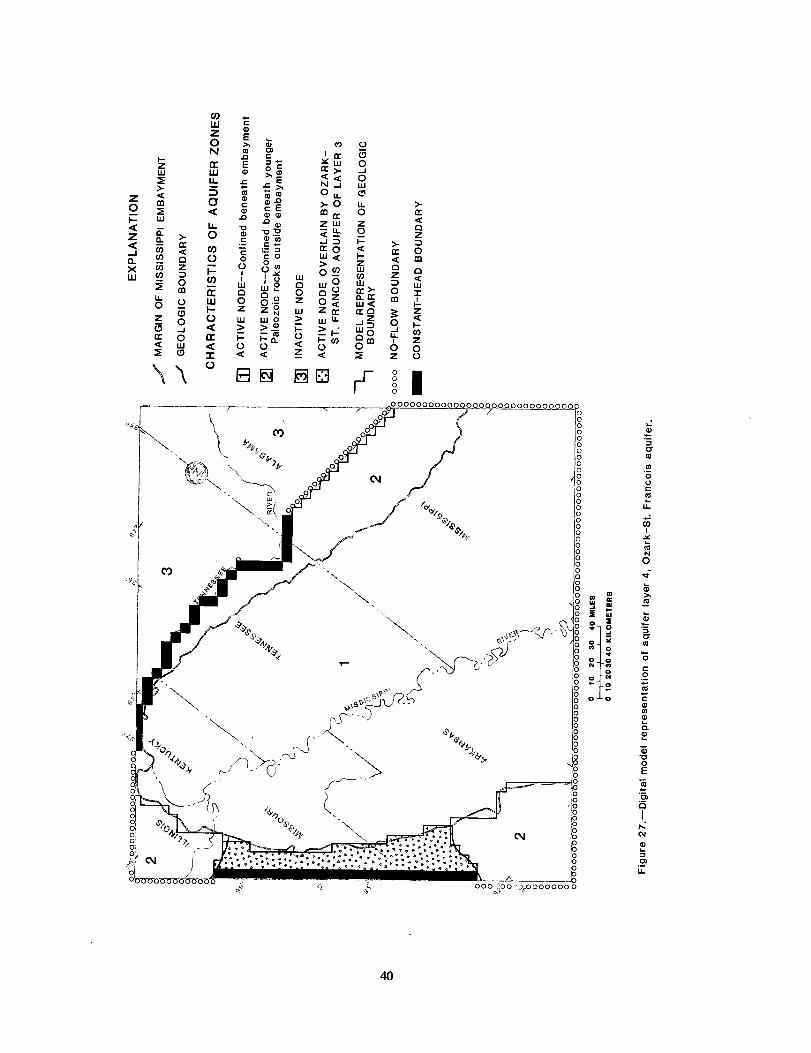
The lowest boundary of the model (base of aquifer layer 4) consists of impermeable Precambrian crystalline rocks (fig. 25) and is simulated as a no-flow boundary throughout the study area. The northwestern boundary of aquifer layer 4 was initially modeled using a constant-head source to simulate recharge from the outcrop areas near the St. Francois Mountains. Water levels in the westernmost blocks where the Paleozoic rocks outcrop were set at constant values to simulate pre-development (prior to any pumping) of the aquifer layer (fig. 27). This boundary representation was later modified to allow input of specified recharge provided by calculations from the Central Midwest RASA model (J.L. Imes, written commun., 1985). Figure 27 shows the no-flow and constant head boundaries.
The eastern boundary of aquifer layer 4 was simulated as a constant-head boundary representing the Tennessee River. An alternative representation of this boundary was tested, using vertical leakage through the confining beds to a constant head boundary in layer 1. Preliminary results were inconclusive because of few data with which to check. The southern one third of the western boundary, the entire southern boundary, the northern boundary, and the southern one-half of the eastern boundary are simulated as no-flow boundaries (fig. 27). Calculated heads within 50 miles of these boundaries are not used in model interpreta- tion.
Confining unit C represents the Cretaceous- Paleozoic confining unit, the upper boundary to aquifer layer 4. Geologically, confining unit C is not present in the western part of the study area. The area where the confin- ing unit is absent is simulated in the model as a zone of high leakance, representing aquifers in direct contact with one another. Model representation of confining unit C (fig. 28) is based primarily on the geologic interpretations of Schwalb (1982). The confining unit was separated into zones of similar geology. A single leakance value was cal- culated for each zone, based on dividing the average verti- cal hydraulic conductivity of the dominant lithology (Freeze and Cherry, 1979) by the average thickness of the confining unit within the zone (Schwalb, 1982). Variations from the geology of Schwalb (1982) occur in zones 8 and 9. These high leakance zones represent fracturing in the con-
38
I
39
E
L

41
fining unit above the western margin of the rift and fractur- ingin the confining unit above the Pascola arch-Bloomfield pluton.
Zone 1 (fig. 28) is modeled as a probable moderate leakance area corresponding to an eroded structural high. In zone 1, the Ozark-St. Francois aquifer is eroded, and less permeable units of the St. Francois confining layer (Imes, 1988~) are directly overlain by the Upper Cretaceous aquifer. Zone 2 is modeled as a zone with high to moderate leakance potential. Rocks of the Ozark-St. Francois aquifer are directly overlain by the Upper Cretaceous aquifer. Zone 3 is a low leakance zone representing a thick sequence of Ordovician through Devonian and possibly pre-McNairy Cretaceous sedimentary rocks that separate the Ozark-St. Francois aquifer from the Upper Cretaceous aquifer. Zone 4 has very low leakance and includes the units of zone 3, as well as thick fine-grained sedimentary rocks of Mississippian and Pennsylvanian age. The out- crop area of the Ozark-St. Francois aquifer (zone 5) is modeled as a zone of high leakance to simulate hydrologic interaction between the aquifer and the water table. The outcrop of post-Middle Ordovician rocks north and south of the Salem Plateau (zone 6) is characterized by a thick se- quence of fine-grained rocks; these are simulated as having low leakance.
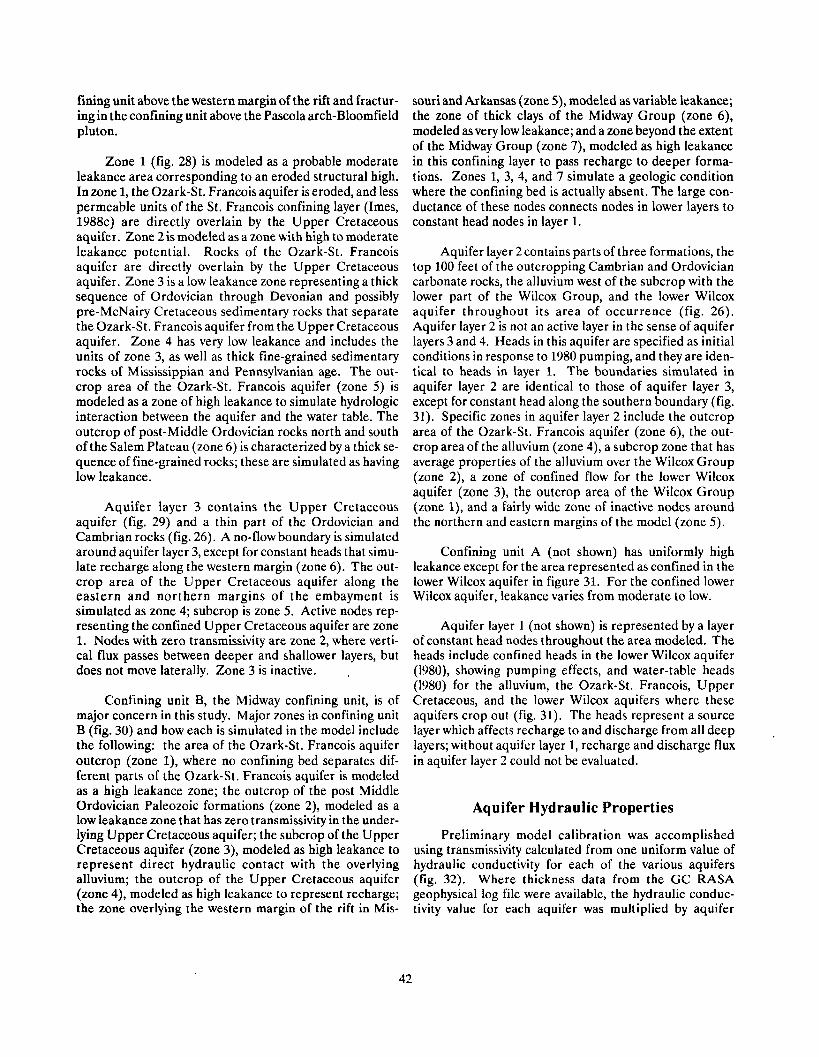
Aquifer layer 3 contains the Upper Cretaceous aquifer (fig. 29) and a thin part of the Ordovician and Cambrian rocks (fig. 26). A no-flow boundary is simulated around aquifer layer 3, except for constant heads that simu- late recharge along the western margin (zone 6). The out- crop area of the Upper Cretaceous aquifer along the eastern and northern margins of the embayment is simulated as zone 4; subcrop is zone 5. Active nodes rep- resenting the confined Upper Cretaceous aquifer are zone 1. Nodes with zero transmissivity are zone 2, where verti- cal flux passes between deeper and shallower layers, but does not move laterally. Zone 3 is inactive.
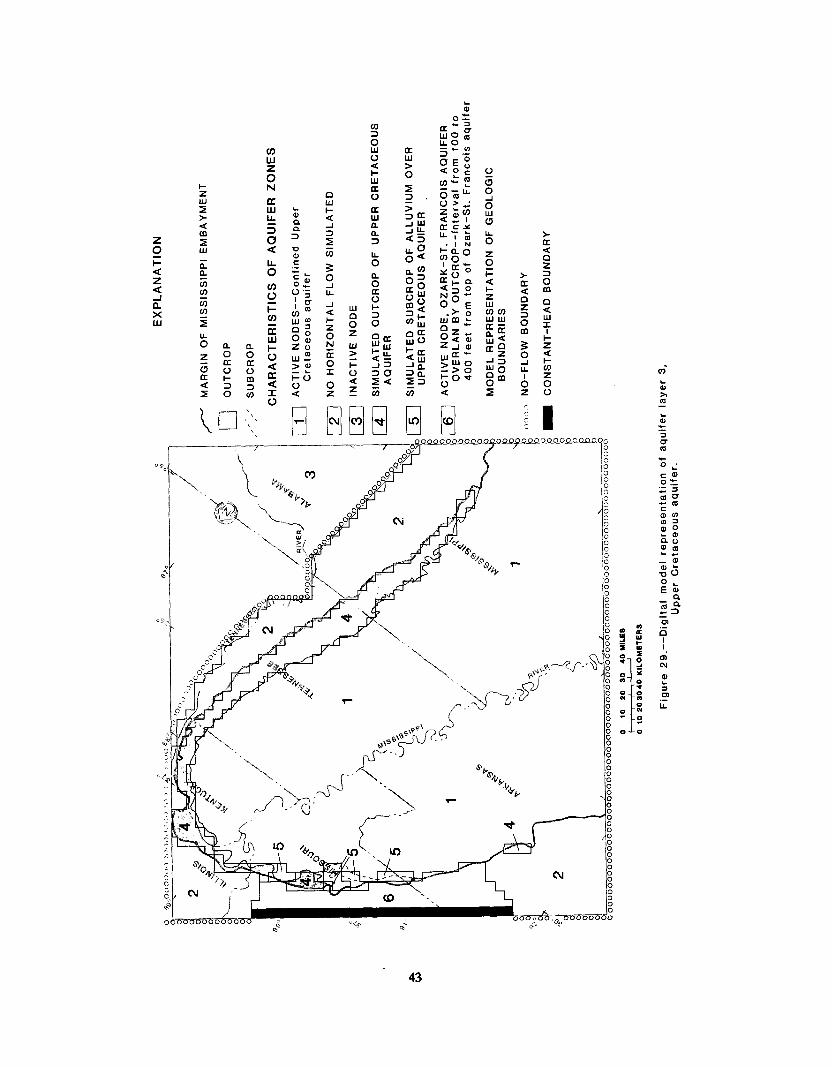
Confining unit B, the Midway confining unit, is of major concern in this study. Major zones in confining unit B (fig. 30) and how each is simulated in the model include the following: the area of the Ozark-St. Francois aquifer outcrop (zone l), where no confining bed separates dif- ferent parts of the Ozark-St. Francois aquifer is modeled as a high leakance zone; the outcrop of the post Middle Ordovician Paleozoic formations (zone 2), modeled as a low leakance zone that has zero transmissivity in the under- lying Upper Cretaceous aquifer; the subcrop of the Upper Cretaceous aquifer (zone 3), modeled as high leakance to represent direct hydraulic contact with the overlying alluvium; the outcrop of the Upper Cretaceous aquifer (zone 4), modeled as high leakance to represent recharge; the zone overlying the western margin of the rift in Mis-
souri and Arkansas (zone 5), modeled as variable leakance; the zone of thick clays of the Midway Group (zone 6), modeled as very low leakance; and a zone beyond the extent of the Midway Group (zone 7), modeled as high leakance in this confining layer to pass recharge to deeper forma- tions. Zones 1, 3, 4, and 7 simulate a geologic condition where the confining bed is actually absent. The large con- ductance of these nodes connects nodes in lower layers to constant head nodes in layer 1.
Aquifer layer 2 contains parts of three formations, the top 100 feet of the outcropping Cambrian and Ordovician carbonate rocks, the alluvium west of the subcrop with the lower part of the Wilcox Group, and the lower Wilcox aquifer throughout its area of occurrence (fig. 26). Aquifer layer 2 is not an active layer in the sense of aquifer layers 3 and 4. Heads in this aquifer are specified as initial conditions in response to 1980 pumping, and they are iden- tical to heads in layer 1. The boundaries simulated in aquifer layer 2 are identical to those of aquifer layer 3, except for constant head along the southern boundary (fig. 31). Specific zones in aquifer layer 2 include the outcrop area of the Ozark-St. Francois aquifer (zone 6) the out- crop area of the alluvium (zone 4), a subcrop zone that has average properties of the alluvium over the Wilcox Group (zone 2), a zone of confined flow for the lower Wilcox aquifer (zone 3), the outcrop area of the Wilcox Group (zone l), and a fairly wide zone of inactive nodes around the northern and eastern margins of the model (zone 5).
Confining unit A (not shown) has uniformly high leakance except for the area represented as confined in the lower Wilcox aquifer in figure 31. For the confined lower Wilcox aquifer, leakance varies from moderate to low.
Aquifer layer 1 (not shown) is represented by a layer of constant head nodes throughout the area modeled. The heads include confined heads in the lower Wilcox aquifer (1980), showing pumping effects, and water-table heads (1980) for the alluvium, the Ozark-St. Francois, Upper Cretaceous, and the lower Wilcox aquifers where these aquifers crop out (fig. 31). The heads represent a source layer which affects recharge to and discharge from all deep layers; without aquifer layer 1, recharge and discharge flux in aquifer layer 2 could not be evaluated.
Aquifer Hydraulic Properties
Preliminary model calibration was accomplished using transmissivity calculated from one uniform value of hydraulic conductivity for each of the various aquifers (fig. 32). Where thickness data from the GC RASA geophysical log file were available, the hydraulic conduc- tivity value for each aquifer was multiplied by aquifer
42
0 z
43
44
P I
45

0 I 0 I
.
C
46

thickness to define transmissivity. Transmissivity for aquifer layers 2 (alluvium and lower Wilcox) and 3 (Upper Cretaceous) was calculated using this method. Because few thickness data were available, transmissivity for aquifer layer 4 was input as a single uniform value.
conductivity for each individual aquifer layer and confin- ing unit, and (3) pumping configurations.
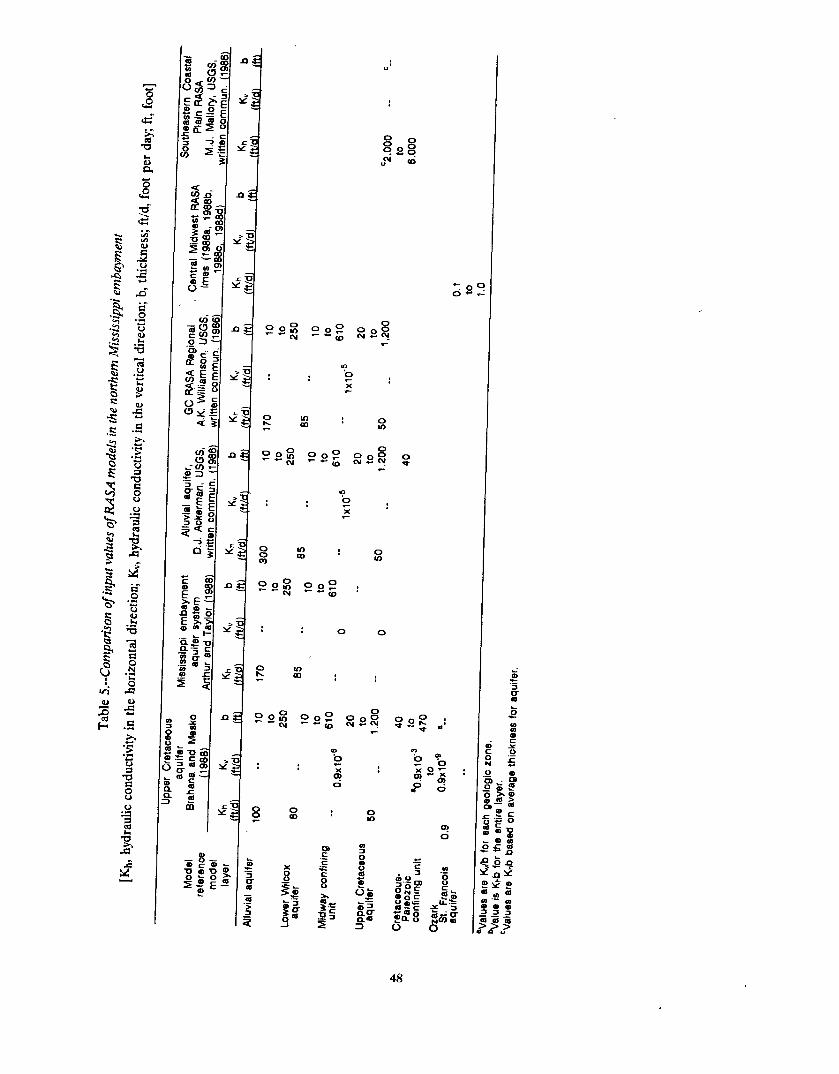
Hydraulic conductivities were initially selected based on the results of aquifer tests (tables 1 and 3 and fig. 32). These conductivities were adjusted during calibration, and the following values of hydraulic conductivity provided the best match of simulated and observed heads:
Alluvium aquifer Lower Wilcox aquifer McNairy-Nacatoch aquifer Ozark-St. Francois aquifer
100 ft/d . 80 ft/d 50 ft/d 0.9 ftfd
The conditions in 1980 are assumed to approximate steady-state. This assumption is valid for all areas of the aquifer except the limited area of major pumping from the Upper Cretaceous aquifer (fig. l8), where sparse data sug- gest there may be a IO to 30 year decline in water levels of less than a foot per year. The effect of the assumption that 1980 conditions represent steady state was tested by includ- ing storage as a component of the model, and the resulting heads in the area of interest generally showed less than 5 feet of change.
Ranges of values of these input parameters are shown for the model of the Upper Cretaceous aquifer, for the Central Midwest (CM) RASA model, the Southeast Coastal Plain (SE) RASA model, and the Mississippi embayment aquifer-system RASA model, the Mississippi River alluvial aquifer RASA model, and the Gulf Coast Regional RASA model (table 5).
As a preliminary approximation, 1980 conditions rep- resent the best available data. Testing of transient condi- tions will be part of the modeling effort to be described in later reports.
Stresses
Model development involved evaluating both unstressed (prepumping) and stressed (pumping) condi- tions. Pumping stresses for point source and estimated domestic and stock use of water were located by grid block for the Ozark-St. Francois aquifer and the Upper Cretaceous aquifer (fig. 18). About 37 f?ls (24 Mgalld) were pumped from these aquifers in the study area in 1980. This pumpage, most of which was concentrated in southeastern Missouri, was assigned to appropriate grid blocks (D.J. Ackerman, written commun., 1986). Inas- much as observed 1980 heads from the lower Wilcox aquifer were input as starting heads, the effect of pumpage was included, and no pumpage was simulated from this layer.
Difference between simulated and actual heads varied considerably as changes were made in boundary conditions. For example, by changing the northwestern boundary of the Ozark-St. Francois aquifer from constant head to constant flux and using a broad range of flux estimates from the CM RASA (J.L. Imes, written commun., 1986), head differen- ces of greater than 100 feet from the best simulation were observed. The final boundary representations shown (figs. 27 to 31) match the known hydrogeologic boundaries as defined by the CC RASA geophysical log data base.
A second method of calibration involved adjusting the hydraulic conductivity. A representative value was tested for each zone of similar geology within a layer. Depending on whether the layer was an aquifer or a confining unit, the hydraulic conductivity was either multiplied or divided by the known thickness of the layer. This calibration methbd allows the effects of known variations to be assessed with a minimum of modeler bias in parameter selection.
PRELIMINARY MODEL DEVELOPMENT
Model development requires that model simulations be tested against actual hydrogeologic conditions. The testing provides a statistical level of confidence and documentation for the simulated results, and it can provide additional understanding of the natural system.
Calibration
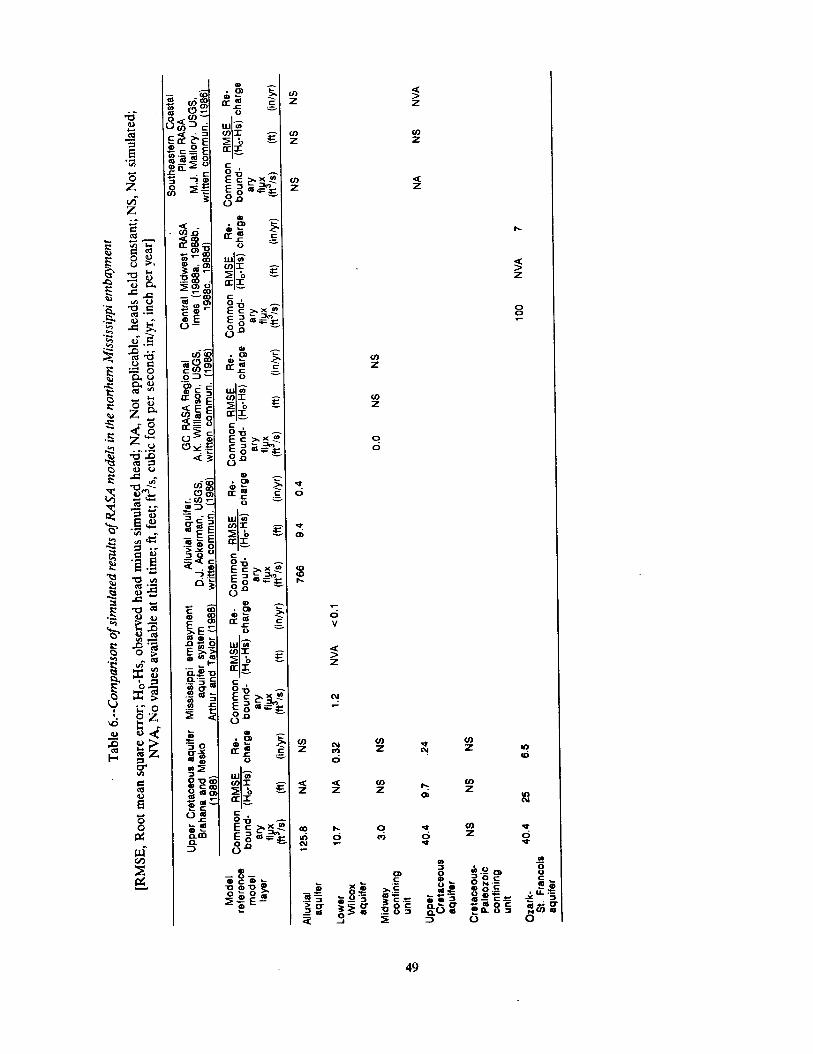
A further constraint of the calibration was that the fluxes between different model layers be “hydrologically reasonable.” Fluxes between units in this regional study cannot be measured directly; however, order of magnitude interaquifer exchanges can be approximated based on literature values from similar geologic settings and calcula- tions from other models. These flux estimates were used as a basis for comparison, and large differences between model calculated fluxes or from fluxes calculated by other RASA models (table 6), may require justification or reevaluation of the conceptual model.
Calibration involved matching observed heads with Heads calculated by the calibrated model are com- calculated heads for 1980 conditions. Calibration was pared to measured heads for the northwestern part of the accomplished by modifying (1) a sequence of selected Ozark-St. Francois aquifer and for the Upper Cretaceous boundary configurations, (2) areally uniform hydraulic aquifer in figures 33 and 34. The observed heads are
47
‘-0 0-
48
49

50

-e------J -- ----T

reasonably matched by calibrated preliminary model cal- culations. For the Ozark-St. Fraocois aquifer, the root mean square error (described in the following section on Sensitivity Analysis) was 25 feet for 14 comparison points having both calculated and observed heads. Eight of 14 of the comparison points had calculated heads within 20 feet of observed. The maximum variation between calculated and observed heads was 53 feet. These values are within an acceptable limit considering the steep gradients in the western part of the area, the large area of the grid blocks compared with the point location of observed wells, and the use of extrapolated data. Water-level data for years other than 1980 were used for some observed match points because water-level data in the Ozark-St. Fraocois aquifer were sparse. For the Upper Cretaceous aquifer, the root- mean square error was 9.7 feet for the 29 comparison points having both model calculated and observed heads. Twenty- one of 29 of the comparison points had calculated heads within 10 feet of observed. The maximum variation between calculated and observed heads in the Upper Cretaceous aquifer was 26 feet. These values are also considered to be within acceptible limits based on the same rationale as given for the Ozark-St. Fraocois aquifer.
Sensitivity Analysis
The response of the model to adjustments in (1) pumping from aquifer layer 4 (Ozark-St. Fraocois aquifer); (2) traosmissivity of aquifer layer 4; (3) leakaoce of confining unit C (Cretaceous-Paleozoic confining unit); (4) pumping from aquifer layer 3 (Upper Cretaceous aquifer); (5) traosmissivity of aquifer layer 3; and (6) leakance of confining unit B (Midway confining unit) was evaluated by sensitivity analysis. The sensitivity of layer 2 was not evaluated because heads representing 1980 con- ditions in layer 2 were input as initial conditions in layers 2 and 1; the heads in layer 2 were maintained by high conduc- tance in confining unit A. Heads in aquifer layer 1 were held constant. The adjustment of each variable (items 1 through 6 above) was uniform over the entire model area while all other variables were held constant. The adjust- ment of each variable was 2,5, and 10 times larger, and I/Z, l/s, aod’/te smaller than values used in the calibrated model.
The root mean square error (RMSE) was calculated as a measure of the difference between model calculated heads and observed heads. The root mean square error is described by the equation:
where RMSE is the root mean square error; HC is calculated head in feet, at a model node; Ho is observed head, in feet; o is the number of comparison points; i is a subscript that defines any specific compar-
ison point, varying between 1 and n.
RMSE was plotted for each adjustment in a variable to dis- play the range of sensitivity.
The results of the sensitivity analysis for aquifer layer 4 (Ozark-St. Francois aquifer) and aquifer layer 3 (Upper Cretaceous aquifer) are shown in figures 35 and 36, respec- tively. RMSE for all values in the original model was 25 feet for the Ozark-St: Fraocois aquifer, and 9.7 feet for the Upper Cretaceous aquifer. The RMSE was considered sensitive to changes in variable values when the RMSE of sensitivity tests exceeded the RMSE of the original model by 5 or more feet. For the Ozark-St. Fraocois aquifer, a RMSE greater than 30 feet was considered sensitive; for the Upper Cretaceous aquifer, a RMSE greater than about 15 feet was considered sensitive. Simulated ground-water flow to streams was not used as an indicator of sensitivity because the amount of ground-water seepage to streams is unknown in the study area.
Heads in aquifer layer 4 (Ozark-St. Fraocois aquifer) are relatively insensitive to the traosmissivity of aquifer layer 4 and the leakance of confining unit C (Cretaceous- Paleozoic confining unit) (fig.35). The model was sensitive to pumping from aquifer layer 4 at rates about 5 times greater than the value used in the calibrated model. Lack of sensitivity of transmissivity is probably due to the model design, which incorporates constant heads around the mar- gins. Such a representation rigidly defines a regional gradient and, in the case of slight to moderate pumping, which characterizes the Ozark-St. Fraocois aquifer, the ef- fect of transmissivity on heads in the system is relatively insignificant.
For this preliminary model, calculated heads in aquifer layer 3 were found to be most sensitive to pumping (figure 36). An order-of-magnitude increase in pumping from the input of the calibrated model resulted in RMSE increases of more than 40 feet. Calculated heads, however, were relatively insensitive to decreases in pumping. Reduction in original pumping stresses by as much as 0.1 resulted in increased RMSE values of only 2 feet. The model was sensitive to transmissivity of aquifer layer 3 and leakaoce of confining unit B (Midway confining unit) at parameter values less than ‘/3 and greater than 3 times the calibrated values.
52

133j NI ‘tdOW3 3ttVflt)S NV3YY 1OOU
---...
54
REGlONALCONTRlBUTIONSTO THEHYDROLOGICBUDGET
Calculations with the model allow a quantitative evaluation of flux across important hydrogeologic boun- daries, as well as a determination of regional contributions to the hydrologic budget. Fluxes calculated for the main components of each layer are shown in an idealized cross section (fig. 37). The values are based on simulation with the calibrated models.
Preliminary results show that about 40 ft3/s are added to the Ozark-St. Francois aquifer system from precipita- tion along the northwest boundary of the model. The model calculates that about 75 percent of this flux moves upward and discharges to rivers and springs in the outcrop area.
Approximately 28 ft3/s of water moves into the Upper Cretaceous aquifer, either vertically through the Cretaceous-Paleozoic confining unit (L6), the rift zone (L5), or laterally through the geologic contact (F3) with the upper Ozark-St. Francois aquifer (fig. 37).
Deep recharge to the Upper Cretaceous aquifer is cal: culated from the outcrop nodes to be about 0.3 in/yr. This is determined by tividing the3summation of flux across the boundary (4653ft /s to 380 ft /s) (fig. 37) by the area (146 blocks x 25 mi-/block) (fig. 29) and converting to inches per year. The flux across the Midway confining unit is greatly influenced by representation of the western rift boundary. For the condition of high leakage alon? the rift, net flux across the Midway is 52 ft3/s, with 49 ft /s in the vicinity of the rift boundary. At the subcrop of the Upper Cretaceous aquifer (L2), the model calculates a net flux up- ward of about 16 ft3/s. For conditions of low leakage along the western rift boundary, the major area of leakage is shifted to a more diffuse zone located between the rift and the subcrop.
The lower Wilcox aquifer receives approximately as much recharge as the Upper Cretaceous aquifer, about 0.3 in/yr, but its area1 distribution of discharge and discharge budget are different from the underlying Upper Cretaceous aquifer. Unlike the Upper Cretaceous, the lower Wilcox aquifer appears to exchange much more water by vertical leakage (74 ft3/s) than to flow across the subcrop with the alluvium (F2) (13 ft3/s ). This is consis- tent with the potentiometric maps of the Upper Cretaceous and lower Wilcox aquifers (figs. 10 and 11) and with the known geology of the upper confining layers of each aquifer.
Results of the preliminary calibration indicated loca- tions and magnitudes of discharge from the Ozark-St. Francois (fig. 38) and the Upper Cretaceous aquifers (fig.
39). The calibrated model indicates that although a zone of greater leakance overlies the western margin of the Mis- sissippi embayment rift in the discharge area, order of mag- nitude flux variations by grid block are discontinuous and more diffuse than expected. This suggests that the geology and hydrology are more complex than originally envisioned in the conceptual model.
SUMMARY The Upper Cretaceous aquifer of Late Cretaceous
age, a regionally extensive but relatively little used aquifer in the northern Mississippi embayment, was studied as part of the Gulf Coast Regional Aquifer- System Analysis. Although data from the Upper Cretaceous aquifer are rela- tively sparse, this study improves understanding of the regional aquifer system by providing (1) a description of the Upper Cretaceous and adjacent aquifers, (2) a documentation of the development and calibration of a preliminary multilayer model used to simulate flow within this sequence of aquifers, and (3) a quantitative evaluation of the various aquifer-system components to the regional hydrologic budget.
On a regional scale, the ground-water system of the northern Mississippi embayment is composed of a series of nonindurated granular sediments that overlie a thick sequence of Paleozoic carbonate rocks, sandstones, and shales. Precambrian crystalline rocks form both the struc- tural and the hydrogeologic basement throughout the northern embayment.
The units that comprise the hydrogeologic framework of the study are:
Alluvium-lower Wilcox aquifer Midway confining unit Upper Cretaceous aquifer Cretaceous-Paleozoic confining unit Ozark-St. Francois aquifer
The Ozark-St. Francois aquifer is composed of several thousand feet of indurated Cambrian and Lower Or- dovician dolomite, sandstone, and shale that directly over- lie the impermeable Precambrian basement. The Ozark-St. Francois is overlain by a highly diverse sequence of rocks that varies in thickness from a few feet to more than 11,000 feet. This diverse sequence of rocks, which includes shale, limestone, sandstone, clay, and marl, is called the Cretaceous-Paleozoic confining unit; the sequence in- cludes rocks from Middle Ordovician to Late Cretaceous in age. The Upper Cretaceous aquifer ranges in thickness from a few to about 500 feet. The Upper Cretaceous aquifer is composed of glauconitic, clayey sand interbedded with clay and chalk, and includes the McNairy Sand in Mis- souri, Tennessee, and Kentucky; the Nacatoch Sand in
55

:
*
3
)
- *
i
- m- ,
1 ,
1
I
8 5 !i : 0 i
O
3000000 ---I- - 0 *
.
3000000 0 T
0 iz 0 Y
$
56

57
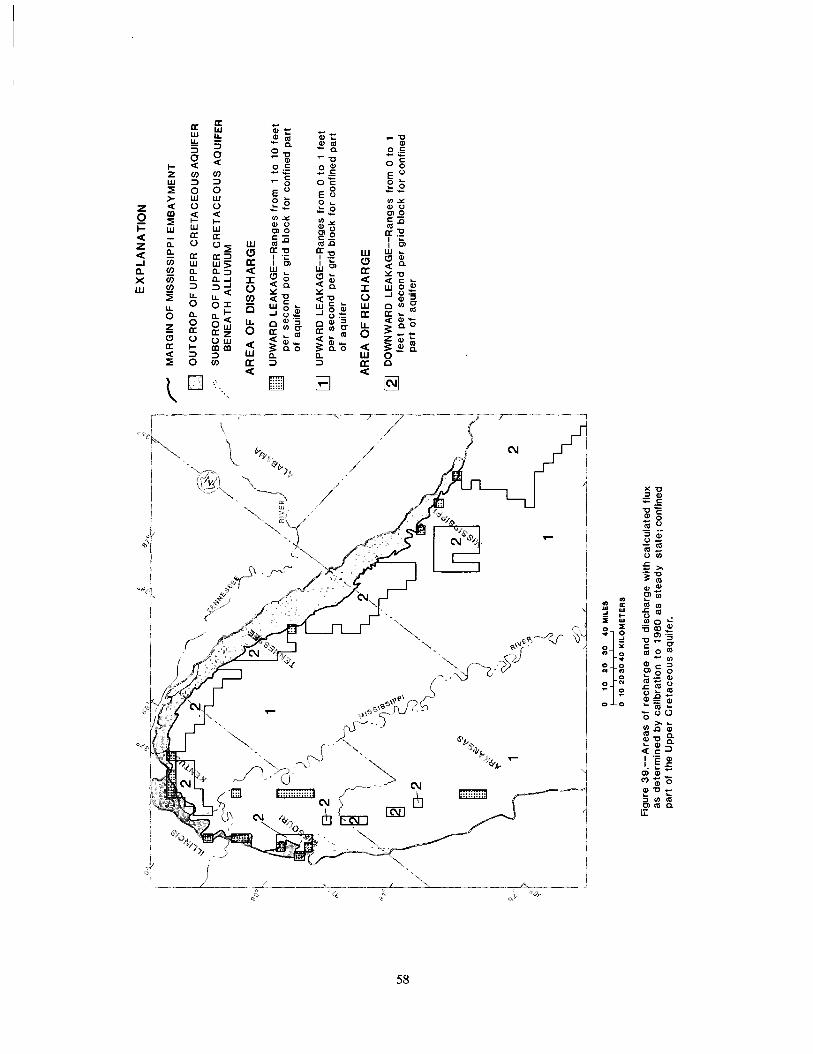
6
58

Arkansas; and the Ripley Formation (including the Mc- Nairy Sand Member) in Tennessee and Mississippi. The Midway confining unit directly overlies the Upper Cretaceous aquifer. The Midway confining unit consists primarily of fine-grained sediments (predominantly clay) that range in thickness from a few feet to about 1,200 feet.
The alluvium-lower Wilcox aquifer overlies the Mid- way confining unit. The alluvium-lower Wilcox is com- posed of sand and clay of the Paleocene and Eocene Wilcox Group, and sand and gravel of the Mississippi River alluvial aquifer west of its subcrop with the lower Wilcox aquifer. Thicknesses of the lower Wilcox sand and alluvium, respec- tively, range from a few feet to more than 600 feet, and from a few feet to about 250 feet.
The Mississippiembayment rift is one of the dominant tectonic features of the northern Mississippi embayment. As a zone of crustal weakness, the rift is thought to be a potential propagator of faults into the overlying younger rocks and sediments. The rift is a potential hydrologic boundary.
Water levels in each of the aquifers were used to estimate regional flow directions. Locally, flow in outcrop areas of all aquifers is toward streams; regionally, flow in all aquifers is toward the Mississippi embayment, which is topographically lower than the recharge areas.
Water-quality data were helpful in describing hydrogeologic boundaries. Specifically, zones of hydrothermal and anomalously warm water that occur in the Upper Cretaceous aquifer on the western and eastern sides, respectively, of the western margin of the Mississippi embayment rift are believed to be an indicator of recharge from a deeper aquifer. Anomalous chloride and dissolved solids concentrations suggest other areas where inter- aquifer leakage may be occurring.
Aquifer tests were used to estimate the range of trans- missivity, hydraulic conductivity, and storage coefficients of all aquifers except the Ozark-St. Francois. Because no aquifer tests have been conducted in the Ozark-St. Fran- cois aquifer within the study area, average hydraulic con- ductivity (0.9 ft/d) was extrapolated from tests made at other locations. Hydraulic conductivity was the main parameter of interest: for the Upper Cretaceous aquifer, hydraulic conductivity was reported to range from 10 to 75 ft/d; for the lower Wilcox aquifer, hydraulic conductivity was reported to range from 25 to 470 ft/d, and for the alluvium, hydraulic conductivity was reported to range from 60 to 450 ft/d. On the basis of values reported in the literature, the Midway confining unit was assumed to have a vertical hydraulic conductivity of 10m6 ft/d, and the Cretaceous-Paleozoic confining unit was assumed to have a vertical hydraulic conductivity of 10” ft/d where the
dominant lithology was limestone and dolomite, and 10T5 ftid where the dominant lithology was shale.
Pumping from the Ozark-St. Francois aquifer was about 3 million gallons per day in 1980 in the study area; pumping from the Upper Cretaceous aquifer for the same time period was about 21 million gallons per day. Pumping was concentrated in the “bootheel area” of Missouri and near the outcrop areas in Kentucky and Tennessee.
As a first step ‘In modeling the Upper Cretaceous aquifer, all known facts were incorporated into a concep- tual model. The conceptual model includes pertinent boundaries, initial conditions, hydraulic characteristics, and stresses, for each hydrogeologic unit of interest.
A four-layer finite difference numerical model was constructed and calibrated to simulate flow in the aquifers defined by the conceptual model. A 48 row by 52 column grid was used to divide the study area. Grid spacing was equidimensional, resulting in blocks 5 miles on a side. The aquifers previously discussed formed layers 2 through 4. Layer 1 is an inactive layer of constant heads that represent shallow water levels. Shallow water levels are a major con- trol on recharge to and discharge from the regional system, and are used to calculate fluxes to the deeper aquifers.
Heads in confining units in the model are not actively simulated. A matrix of leakance values is used to allow ver- tical interchange of water between different aquifers. For confining unit B (Midway Confining Unit), leakance was calculated by dividing an average vertical hydraulic con- ductivity by thickness; for confining units A (undifferen- tiated Claiborne-upper Wilcox Confining Unit) and C (undifferentiated Cretaceous-Paleozoic confining unit), leakance is input by zones, which have an average vertical hydraulic conductivity divided by an average thickness. The model was calibrated to 1980 conditions on the assump- tion that 1980 represented near steady-state conditions. The model was considered to simulate observed heads within acceptable limits. For the Ozark-St. Francois aquifer, the root mean square error was 25 feet for 14 com- parison points having both observed and calculated heads. Eight of 14 of the comparison points had calculated heads within 20 feet of observed. The maximum variation be- tween calculated and observed heads was 53 feet. Twenty- one of 29 of the comparison points had calculated heads within 10 feet of observed. For the Upper Cretaceous aquifer, the root mean square error was 9.7 feet for 29 com- parison points having both observed and calculated heads. The maximum variation between calculated and observed heads in the Upper Cretaceous aquifer was 26 feet.
For the preliminary calibrated model, calculated heads were found to be most sensitive to pumping, and least sensitive to the hydraulicconductivity of the confining layer
59

that separates the aquifers. The sensitivity analysis was based on the response of the model to adjustments in (1) pumping from aquifer layer 4 (Ozark-St. Francois); (2) transmissivity of aquifer layer 4; (3) leakance of confin- ing unit C (Cretaceous-Paleozoic confining unit); (4) pumping from aquifer layer 3 (Upper Cretaceous aquifer); (5) transmissivity of aquifer layer 3; and (6) leakance of confining unit B (Midway confining unit).
The results of this preliminary modeling effort con- tribute to a better understanding of the regional hydrologic
budget. Model results indicate that upward leakage from the Ozark-St. Francois aquifer to the Upper Cretaceous aquifer is about 43 ft3/s, with about 30 ft3/s occurring west of the western margin of the embayment. The model also indicates that throughout most of its area of occurrence, the Midway (Confining Unit B)is an effective confining unit (about 3 ft3/s net leakage). In the discharge area defined by the potentiometric map, the Upper Cretaceous aquifer is leaking about 49 ft3/s upward to the overlying alluvium-lower Wilcox aquifer, mostly in the vicinity of the rift zone.
SELECTEDREFERENCES
Albin, D.R., Hines, M.S., and Stephens, J.W., 1967, Water resources of Jackson and Independence Counties, Arkansas: U.S. Geological Survey Water-Supply Paper 18396,29 p.
Anderson, K.H., and others, 1979, Geologic map of Mis- souri, Missouri Department of Natural Resources, Missouri Geological Survey, Scale 1:50,000.
Arthur, J.K., and Taylor, R.E., 1988, Data compilation, geohydrologic framework definition, and preliminary simulation of ground-water flow in the Mississippt embayment aquifer system, south central United States: U.S. Geological Survey Water-Resources Investigations Report 86-3364,69 p. [in press].
Beckman, H.C., and Hinchey, N.S., 1941, The large springs of Missouri: Missouri Geological Survey and Water Resources, v. XXIX, second series, 138 p.
Bennett, G.D., 1979, Regional ground-water systems analysis, LI Water Spectrum: U.S. Army Corps of Engmeers, v. 2, no. 1, p. 36-42.
Boswell, E.H., 1963, Cretaceous aquifers of northeastern Mississippi: Mississippi Board of Water Commis- sioners Bulletin 63-10,202 p.
----- 1976, The lower Wilcox aquifer in Mississippi: U.S. Geological Survey Water-Resources Investigations Report 60-75, 3 sheets.
----- 1978, The Coffee Sand and Ripley aquifers in Missis- sippi: U.S. Geological Survey Water-Resources Investigations Report 78-114,1 sheet.
Boswell, E.H., Cushing, EM., Hosman, R.L., and others, 1968, Quaternary aquifers in the Mississippi embay- ment: U.S. Geological Survey Professional Paper 448-E, 15 p.
Boswell, E.H., Moore, G.K., MacCary, L.M., and others, 1965, Cretaceous aquifers in the Mississippi embay ment: U.S. Geological Survey Professional Paper 448-C, 37 p.
Brahana, J.V., and Bradley, M.W., 1985, Delineation and description of the regional aquifers of Tennessee-- The Knox Aquifer System: U.S. Geological Survey Water-Resources Investigations Report 83-4012, 32 p.
Brahana, J.V., Mesko, T.O., Busby, J.F., and Krarmer, T.F., 1985, Ground-water quality data from the north- ern Mississippi embayment--Arkansas, Missouri, Kentucky, Tennessee, and Mississippi: U.S. Geologi- cal Survey Open-File Report 85-683,15 p.
Brahana, J.V., Reesman, A.L., and Reesman, R.H., 1982, Stable carbon isotopes as a tool for interpreting the origin of sodium-bicarbonate ground water in the
northern Mississippi embayment: Geological Society of America Abstracts with Programs, v. 11, no. 7, p. 451.
Broom, M.E., and Lyford, F.P., 1981, Alluvial aquifer of the Cache and St. Francois River Basins: U.S. Geological Survey Open-File Report 81-476,48 p.
Bush, P.W., 1982, Predevelopment flow in the Tertiary Limestone aquifer, southeastern United States; a regional analysis from digital modeling: U.S. Geological Survey Water-Resources Investigations Report 82-905,41 p.
Caplan, W.M., 1954, Subsurface geology and related oil and gas possibilities of northeastern Arkansas: Arkansas Geological and Conservation Commission Information Circular 21, 17 p.
Crone, A.J., 1981, Sample description and stratigraphic correlation of the New Madrid test well-l-X, New Madrid County, Missouri: U.S. Geological Survey Open-File Report 81-426, 26 p.
Crone, A.J., and Brockman, S.R., 1982, Configuration and deformation of the Paleozoic bedrock surface in the New Madrid seismic zone, i/l McKeown, F.A., and Pakiser, L.C., eds., Investigations of the New Madrid, Missouri, earthquake region: U.S. Geological Survey Professional Paper 1236-1, p. 115-135.
Crone, A.J., McKeown, F.A., Harding, ST., Hamilton, R.M., Russ, D.P., and Zoback, M.D., 1985, Structure of the New Madrid seismic source zone in southeastern Missouri and northeastern Arkansas: Geology, v. 13, no. 8, p. 547-550.
Crone, A.J., and Russ, D.P., 1979, Preliminary report on an exploratory drill hole--New Madrid test well-l-X in southeast Missouri: U.S. Geological Survey Open- File Report 79-1216, 12 p.
Cushing, E.M., Boswell, E.H., and Hosman, R.L., 1964, General geology of the Mississipi embayment: U.S. Geological Survey Professional Paper 448-B, 28 p.
Cushing, E.M., Boswell, E.H., Speer, P.R., Hosman, R.L., and others, 1970, Availability of water in the Missis- sippi embayment: U.S. Geological Survey Profes- sional Paper 448-A, 13 p.
Davis, R.W., Lambert, T.W., and Hansen, A.!., Jr., 1973, Subsurface geology and groundwater resources of the Jackson Purchase region, Kentucky: U.S. Geological Survey Water-Supply Paper 1987,66 p.
Durfor, C.N., and Becker, Edith, 1964, Public water sup- plies of the 100 largest cities of the United States, 1962: U.S. Geological Survey Water-Supply Paper 1812,364 p.
61
Edds, Joe, 1982, Ground-water levels in Arkansas, Spring, 1982: U.S. Geological Survey Open-File Report 82- 852,51 p.
Ervin, P.C., and McGinnis, L.D., 1975, Reelfoot rift, reac- tivated precursor to the Mississippi embayment: Geological Society of America Bulletin, v. 86, p. 1287- 1295.
Farrar, W., and McManamy, L., 1969, The geology of Stod- dard county, Missouri: Missouri Geological Survey and Water Resources, Reprinted without revision from Appendix VI, 59th Biennial Report, 1937,92 p.
Feder, G.L., 1973, A conceptual model of the hydrologic systemsupplying the large springs in the Ozarks: U.S. Geological Survey open-file report, 148 p.
Fisk, H.N., 1944, Geological investigation of the alluvial valley of the lower Mississippi River: U.S. Depart- ment of the Army, Mississippi River Commission, 7 p.
Frederiksen, N.O., Bybell, L.M., Christopher, R.A.,Crone, A.J., Edwards, L.E., Gibson, T.G., Hazel, J.E., Repetski, J.E., Russ, D.P., Smith, C.C., and Ward, L.W., 1982, Biostratigraphy and paleoecology of lower Paleozoic, upper Cretaceous, and lower Ter- tiary rocks in U.S. Geological Survey New Madrid test wells, southeastern Missouri: Tulane Studies In Geology and Paleontology, v. 17, no. 2, p. 23-45.
Freeman, L.B., 1953, Regional subsurface stratigraphy of the Cambrian and Ordovician in Kentucky and vicinity: Kentucky Geological Survey Bulletin 12, ser. 9,352 p.
Freeze, R.A., and Cherry, J.A., 1979, Groundwater: Englewood Cliffs, New Jersey, Prentice Hall, Inc., 604 p.
Glick, E.E., 1982, Stratigraphy and structure of sediments above the Newport pluton of northeastern Arkansas: U.S. Geological Survey Professional Paper 1236-K p. 151-174.
Godson, R.H., 1981, Digital terrain map of the United States: U.S. Geological Survey Miscellaneous Inves- tigations.
Gori, P.L., and Hays, W.W., eds., 1984, Proceedings of the symposium on the New Madrid seismic zone: U.S. Geological Survey Open-File Report 84-770,471 p.
Graham, D.D., and Parks, W.S., 1985, Preliminary assess- ment of the potential for leakage among the principal aquifers in the Memphis area, Tennessee: U.S. Geological Survey Water Resources Investigations Report, 85-4295,82 p.
Grohskopf, J.G., 1955, Subsurface geology of the Mississip- pi embayment of southeastern Missouri: Missouri Geological Survey and Water Resources, v. 37, ser. 2, 133 p.
Grubb, H.F., 1984, Planning report for the Gulf Coast Regional Aquifer System Analysis in the Gulf of Mexico coastal plain, United States: U.S. Geological Survey Water-Resources Investigations Report 84-
4219,30 p. Halberg, H.N., and Reed, J.E., 1964, Ground-water resour-
ces of eastern Arkansas in the vicinity of U.S. High- way 70: U.S. Geological Survey Water-Supply Paper 1779-V, 38 p.
Haley, B.R., 1976, Geologic map of Arkansas: Arkansas Geological Commission, scale 1:500,000.
Hamilton, R.M., and Zoback, M.D., 1979, Seismic reflec- tion profiles in the northern Mississippi embayment: U.S. Geological Survey Open-File Report 79-1688, 8 P*
----- 1982, Tectonic features of the New Madrid seismic zone from seismic reflection profiles: U.S. Geologi- cal Survey Professional Paper 1236-F, p. 55-82.
Hardeman, W.D., and others, [compiler] (eds.), 1966, Geologic map of Tennessee, west and west central sheets: Tennessee Division of Geology, scale 1:250,000.
Harvey, E.J., 1980, Groundwater in the Springfield-Salem Plateaus of southern Missouri and northern Arkan- sas: U.S. Geolgical Survey Water-Resources Inves- tigations Report 80-101,66 p.
Heyl, A.V., Brock, M.R., Jolly, J.L., and Wells, C.E., 1965, Regional structure of the southeast Missouri and Il- linois-Kentucky mineral districts: U.S. Geological Survey Bulletin 1212-B, 20 p.
Hildenbrand, T.G., Kane, M.F, and Hendricks, J.D., 1982, Magnetic basement in the upper Mississippi embay- ment region--A preliminary report: U.S. Geological Survey Professional Paper 1236-E, p. 39-53.
Hildenbrand, T.G., Kane, M.F., and Stauder, W., 1977, Magnetic and gravity anomalies in the northern Mis- sissippi embayment and their special relation to seis- micity: U.S. Geological Survey Map FF-914,2 sheets.
Hines, M.S., Plebuch, R.O., and Lamonds, A.G., 1972, Water resources of Clay, Greene, Craighead, and Poinsett Counties, Arkansas: U.S. Geological Survey Hydrologic Atlas HA-377, 2 sheets.
Hinze, W.J., Braile, L.W., Keller, G.R., and Lidiak, E.G., 1980, Models for midcontinent tectonism, in Con- tinental Tectonics: National Academy of Science Monograph, Washington, D.C., p. 73-83.
Hollyday, E.F., Brahana, J.V., Harvey, E.J., and Skelton, John, 1981, Comparative regional hydrogeology of three lower Paleozoic carbonate aquifer systems of Missouri, Kentucky, and Tennessee [abs.]: Geologi- cal Society of America Abstracts with Programs, v. .13, no. 7, p. 475.
Hosman, R.L., 1988, Geohydrologic framework of the Gulf Coastal Plain: U.S. Geological Survey Hydrologic Atlas 695 [in press].
Hosman, R.L., Long, A.T., Lambert, T.W., and others, 1968, Tertiary aquifers in the Mississippi embayment: U.S. Geological Survey Professional Paper 448-D, 29 p.
62
Howe, W.B. (compiler), and Koenig, J.W. (ed.), 1961, The stratigraphic succession in Missouri: Missouri Geological Survey and Water Resources Volume 40, Second Series, 85 p.
Howe, W.B., Kurtz, V.E., and Anderson, K.H., 1972, Cor- relation of Cambrian strata of the Ozark and upper Mississippi Valley regions: Missouri Geological Sur- veyand Water Resources, Report of Investigations 52, 60 p.
Imes, J.L., 1988a, Designation of major geohydrologic units in and adjacent to the Ozark Plateau province, Mis- souri, Arkansas, Kansas, and Oklahoma: U.S. Geological Survey Hydrologic Atlas 711-A [in press].
----- 1988b, Major geohydrologic units in and adjacent to the Ozark Plateau province, Missouri, Arkansas, Kan- sas, and oklahoma--St. Francis aquifer: U.S. Geologi- cal Survey Hydrologic Atlas 711-C [in press].
----- 1988c, Major geohydrologic units in and adjacent to the Ozark Plateau province, Missiouri, Arkansas, Kansas, and Oklahoma--St. Francis confining unit: U.S. Geological Survey Hydrologic Atlas 711-D [in press].
----- 1988d, Major geohydrologic units in and adjacent to the Ozark Plateau province, Missiouri, Arkansas, Kansas, and Oklahoma--Ozark aquifer: U.S. Geological Survey Hydrologic Atlas 711-E [in pressj.
Kernodle, J.M., 1981, Two-dimensional ground-water flow model of the Cretaceous aquifer system of Lee Coun- ty and vicinity, Mississippi: U.S. Geological Survey Water-Resources Investigations Report 81-70,53 p.
Koenig, J.W., ed., 1961, The stratigraphic succession in Missouri: Missouri Geological Survey and Water Resources, v. 40, ser. 2,185 p.
Krinitzsky, E.L., 1950, Geological investigation of faulting in (he lower Mississippi Valley: U.S. Army Corps of Engineers Waterways Experiment Station, Technical Memorandum 3-311,91 p.
Krinitzsky, E.L., and Wire, J.C., 1964, Groundwater in al- luvium of the lower Mississipipi Valley (upper and central areas): U.S. Army Engineer Waterways Ex- periment Station, Technical Report no. 3-658,~. I and II, 100 p.
Kuiper, L.K., 1985, Documentation of a numerical code for the simulation of variable density ground-water flow in three dimensions: U.S. Geological Suvey Water- Resources Investigations Report 84-4302,90 p.
Lamonds, A.<;., Hines, M.S., and Plebuch, R.O., 1968, Water resources of Lawrence and Randolph Coun- ties, Arkansas: U.S. Geological Survey Water-Supply Paper 1879-B, 45 p.
Luckey, R.R., 1985, Water resources of the Southeast Lowlands, Missouri, with a section on Water Quality by Dale Fuller: U.S. Geological Survey Water-
Resources Investigations Report 844277, 78 p. Luckey, R.R., and Fuller, D.L., 1980, Hydrologic data for
the Mississippi embayment ofsoutheastern Missiouri: U.S. Geological Survey Open-File Report 79-421, 199 p.
Marcher, M.B., and Stearns, R.G., 1962, Tuscaloosa forma- tion in Tennessee: Geological Society of America Bul- letin, v. 73, p. 1365-1386.
Matthes, F.E., 1933, Cretaceous sediments in Crowleys Ridge, southeastern Missouri: American Association of Petroleum Geologists Bulletin, v. 17, p. 1003-1009.
McCracken, M.H., 1971, Structural features of Missouri: Missouri Geological Survey and Water Resources Report of Investigations 49,99 p.
McDonald, M.G., and Harbaugh, A.W., 1984, A modular three-dimensional finite-difference ground-water flow model: U.S. Geolgoical Survey Open-File Report 83-875,528 p.
McKeown, F.A., and Pakiser, L.C., eds., 1982, Investiga- tions of the New Madrid, Missouri, earthquake region: U.S. Geological Survey Professional Paper 1236,201 p.
Meinzer, O.E., 1927, Large springs of the United States: U.S. Geological Survey Water-Supply Paper 557, 94 p.
Mississippi Geological Survey, 1979, Geologic map of Mis- sissippi: scale 1:500,000.
Missouri Geological Survey, 1979, Geologic map of Mis- souri: scale 1:500,000.
Mitchell, B.J., Cheng, C.C., and Stauder, William, 1977, A three-dimensional velocity model of the lithosphere beneath the New Madrid seismic zone: Seismological Society of America Bulletin, v. 67, p. 1061-1074.
Moore, G.K. and Brown, D.L., 1969, Stratigraphy of the Fort Pillow test well, Lauderdale county, Tennessee: Tennessee Division of Geology Report of Investiga- tion 26, 1 sheet.
Newcome, Roy, Jr., 1971, Results of aquifer tests in Missis- sippi: Mississippi Board of Water Commisioners Bulletin 71-2,44 p.
-_-__ 1974, Water for industrial development in Benton, Lafayette, Marshall, Pontotoc, Tippah, and Union Counties, Mississippi: Mississippi Research and Development Center, 73 p.
O’Connell, D., Bufe, C.G., and Zoback, M.D., 1982, Microearthquakes and faulting in the area of New Madrid, Missouri-Reelfoot lake, Tennessee: U.S. Geological Survey Professional Paper 1236-D, p. 31- 38.
Olive, W.W., 1980, Geologic maps of rhe Jackson Purchase Region, Kentucky: U.S. Geological Survey Miscel- laneous Investigations Series I-1217, scale 1:250,000.
63
Parks, W.S., and Russell, E.E., 1975, Geologic map show- ing Upper Cretaceous, Paleocene, and lower and mid- dle Eocene units and distribution of younger fluvial deposits in western Tennessee: U.S. Geological Sur- vey Miscellaneous Investigations Series I-916, scale 1:250,000.
Peterson, J.C., Broom, M.E., and Bush, W.V., 1985, Geohydrologic units of the Gulf Coastal Plain in Arkansas: U.S. Geological Survey Water-Resources Investigations Report 854116,20 p.
Plebuch, R.O., 1961, Fresh-water aquifers of Crittenden County, Arkansas: Arkansas Geological and Conser- vation Commission, Water Resources Circular 8,65 p.
Pryor, W.A., 1960, Cretaceous sedimentation in upper Mis- sissippi embayment: American Association of Petroleum Geologists Bulletin, v. 44, no. 9, p. 1473-1504.
Randolph, R.B., Krause, R.E., and Maslia, M.L., 1985, Comparison of aquifer characteristics derived from local and regional aquifer tests: Ground Water, v. 23, no. 3, p. 309-316.
Reinhardt, J., Sigleo, W.R., Dever, G.R., and Nichols, D.J., 1985, Cretaceous-Paleozoic boundary relations in the northern Mississippi embayment [abs.]: Geological Society of American Abstracts with Programs, Southeastern Section, v. 17, no. 2, p. 131.
Roberts, J.K., and Gildersleeve, Benjamin, 1950, Geology and mineral resources of the Jackson Purchase region, Kentucky: Kentucky Geological Survey Bulletin 4, ser. 9,113 p.
Russ, D.P., 1979, Late Holocene faulting and earthquake recurrence in the Reelfoot Lake area, northwestern Tennessee: Geological Society of America Bulletin, v. 90, p. 1013-1018.
Russell, E.E., and Parks, W.S., 1975, Stratigraphy of the outcropping Upper Cretaceous, Paleocene, and lower Eocene in western Tennessee (including descriptions of younger fluvial deposits): Tennessee Division of Geology Bulletin 75, 118 p.
Ryling, R.W., 1960, Ground-water potential of Mississippi County, Arkansas: Arkansas Geological and Conser- vation Commission, Water Resources Circular 7,87 p.
Saucier, R.T., 1964, Geological investigation of the St. Francis basin: U.S. Army Corps of Engineers Water- ways Experiment Station, Technical Report 3-659, 81 p.
----- 1974, Quaternary geology of the lower Mississippi val- ley: Arkansas Archeological Survey Research Series 6, 16 p.
Schwalb, H.R., 1969, Paleozoic geology of the Jackson Pur- chase Region: Kentucky Geological Survey, Series X, Report of Investigations lo,40 p.
----- 1982, Paleozoic geology of the New Madrid area: U.S. Nuclear Regulatory Commission, NUREG/CR-2909, 61 p.
Smith, F.L., and Saucier, R.T., 1971, Geological investiga- tion of the western lowlands area, lower Mississippi Valley: U.S. Army Corps of Engineers, Waterways Experiment Station Technical Report S-71-5,47 p.
Speer, P.R., Golden, H.G., Patterson, J.F., and others, 1964, Low-flow characteristics of streams in the Mis- sissippi embayment in Mississippi and Alabama: U.S. Geological Survey Professional Paper 448-1, 47 p.
Speer, P.R., Hines, M.S., Janson, M.E., and others, 1966, Low-flow characteristics of streams in the Mississippi embayment in northern Arkansas and Missouri: U.S. Geological Survey Professional Paper 448-F, 25 p.
Speer, P.R., Perry, W.J., McCabe, J.A., Lara, O.G., and others, 1965, Low-flow characteristics of streams in the Mississippi embayment in Tennessee, Kentucky, and Illinois: U.S. Geological Survey Professional Paper 448-H, 36 p.
Stauder, William, 1982, Present-day seismicity and iden- tification of active faults in the New Madrid seismic zone: in McKeown, F.A., and Pakiser, L.C., eds., Investigations of the New Madrid, Missouri earthquake region: U.S. Geological Survey Profes- sional Paper 1236-C, p. 21-30.
Stauder, William, Kramer, M., Fischer, G., Shaefer, Stephen, and Morrisey, S.T., 1976, Seismic charac- teristics of southeast Missouri as indicated by a regional telemetered microearthquake array: Seis- mological Society of America Bulletin.
Stearns, R.G., 1957, Cretaceous, Paleocene, and lower Eocene geologic history of the northern Mississippi embayment: Geological Society of America Bulletin, v. 68, p. 1077-1100.
-_--- 1979, Recent vertical movement of the land surface in the Lake County uplift and Reelfoot Lake basin areas, Tennessee, Missouri and Kentucky: U.S. Nuclear Regulatory Commission, NUREG/CR-0874, 37 p.
-----1982, Configuration of the base Cretaceous-top of Paleozoic surface: Tennessee Division of Geology open-file map.
Stearns, R.G., and Armstrong, C.A., 1955, Post-Paleozoic stratigraphy of western Tennessee and adjacent por- tions of the upper Mississippi embayment: Tennessee Division of Geology, Report of Investigations no. 2, 29 p.
Stearns, R.G., and Marcher, M.V., 1962, Late Cretaceous and subsequent structural development of the north- ern Mississippi embayment area: Geological Society of America Bulletin, v. 73, p. 1387-1394.
Stearns, R.G., and Wilson, C.W., 1972, Relationships of earthquakes and geology in west Tennessee and ad- jacent areas: Tennessee Valley Authority, 232 p.
Stearns, R.G., and Zurawski, Ann, 1976, Post-Cretaceous faulting in the head of the Mississippi embayment: Southeastern Geology, v. 17, no. 4, p. 207-229.

Stricker. V.A.. Aucott. W.A.. Fave, R.E., Williams, J.S., _. and Mallory, M.J., 1985, Approximate potentiometric surface for the aquifer unit A2, southeastern Coastal Plain aquifer system of the United States, prior to development: U.S. Geological Survey Water-Resour- ces Investigations Report 85-4019, 1 sheet.
Swanberg, C.A., Mitchell, B.J., Lohse, R.L., and Blackwell, D.D., 1982, Heat flow in the upper Mississippi embay- ment, in Investigations of the New Madrid, Missouri, earthquake region: U.S. Geological Survey Profes- sional Paper 1236-M, p. 185-189.
U.S. Geological Survey, 1970, The National Atlas of the United States of America: Washington, D.C., 417 p.
Vineyard, J.D., and Feder, G.L., 1974, Springs of Missouri: Missouri Geological Survey and Water Resources Report no. 29,267 p.
Wasson, B.E., 1980, Potentiometric map of the lower Wil- cox aquifer in Mississippi, Fall 1979: U.S. Geological Survey Open-File Report 80-597,l sheet.
Weinstein, H.C., Stone, H.L., and Kwan, T.V., 1969, Itera- tive procedure for solution of systems of parabolic and
elliptic equations in three dimensions: Industrial Engineering Chemistry Fundamentals, v. 8, no. 2, p. 281-287.
Wells, F.G., 1933, Ground-water resources of western Ten- nessee: U.S. Geological Survey Water Supply Paper 656,319 p.
White, D.E., 1957, Magmatic, connate, and metamorphic waters: Geologic Society of America Bulletin, v. 68, p. 1659-1682.
Willman, H.B., and others, [compilers] 1967, Geologic map of Illinois: scale 1:500,000.
Wilson, J.M., and Criner, J.H., 1969, Geohydrology of Henry and Weakley counties: Tennessee Department of Conservation, Division of Water Resources, 49 p.
Zoback, M.D., Hamilton, R.M., Crone, A.J., Russ, D.P., McKeown, F.A., and Brockman, S.R., 1980, Recur- rent intraplate tectonism in the New Madrid seismic zone: Science, v. 209, p. 971-976.
Zurawski, Ann, 1978, Summary appraisals of the Nation’s ground-water resources Tennessee region: U.S. Geological Survey Professional Paper 813-L, 35 p.
65