hydrogeology and analysis of ground-water withdrawal … · hydrogeology and analysis of...
TRANSCRIPT

HYDROGEOLOGY AND ANALYSIS OF GROUND-WATER WITHDRAWAL IN THE MENDENHALL-D'LO AREA, SIMPSON COUNTY, MISSISSIPPI
By Eric W. Strom and William T. Oakley
U.S. GEOLOGICAL SURVEY Water-Resources Investigations Report 95-4013
Prepared in cooperation with the
PEARL RIVER BASIN DEVELOPMENT DISTRICT and the
MISSISSIPPI DEPARTMENT OF ENVIRONMENTAL QUALITY, OFFICE OF LAND AND WATER RESOURCES
Jackson, Mississippi 1995

U.S. DEPARTMENT OF THE INTERIOR BRUCE BABBITT, Secretary
U.S. GEOLOGICAL SURVEY Gordon P. Eaton, Director
For additional information Copies of this report can be write to: purchased from:
District Chief U.S. Geological SurveyU.S. Geological Survey Earth Science Information CenterSuite 710, Federal Building Open-File Reports Section100 W. Capitol Street Box 25286, MS 517, Federal CenterJackson, Mississippi 39269 Denver, Colorado 80225
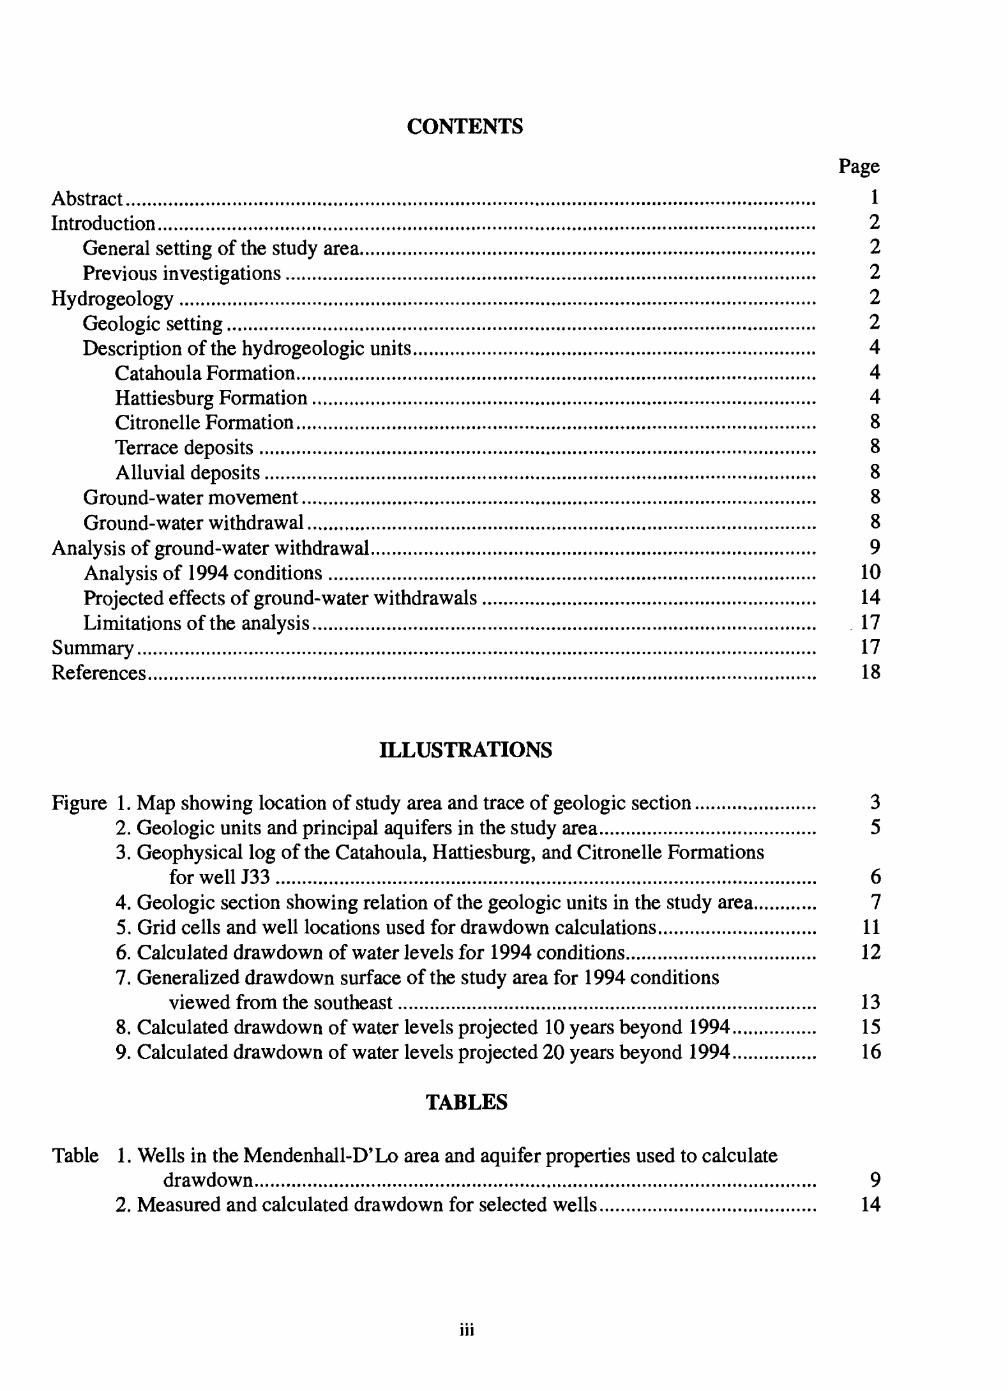
CONTENTS
PageAbstract.................................................................................................................................. 1Introduction............................................................................................................................ 2
General setting of the study area...................................................................................... 2Previous investigations.................................................................................................... 2
Hydrogeology........................................................................................................................ 2Geologic setting............................................................................................................... 2Description of the hydrogeologic units............................................................................ 4
Catahoula Formation.................................................................................................. 4Hattiesburg Formation............................................................................................... 4Citronelle Formation.................................................................................................. 8Terrace deposits......................................................................................................... 8Alluvial deposits........................................................................................................ 8
Ground-water movement................................................................................................. 8Ground-water withdrawal................................................................................................ 8
Analysis of ground-water withdrawal.................................................................................... 9Analysis of 1994 conditions ............................................................................................ 10Projected effects of ground-water withdrawals............................................................... 14Limitations of the analysis............................................................................................... 17
Summary................................................................................................................................ 17References.............................................................................................................................. 18
ILLUSTRATIONS
Figure 1. Map showing location of study area and trace of geologic section....................... 32. Geologic units and principal aquifers in the study area......................................... 53. Geophysical log of the Catahoula, Hattiesburg, and Citronelle Formations
for well J33 ...................................................................................................... 64. Geologic section showing relation of the geologic units in the study area............ 75. Grid cells and well locations used for drawdown calculations.............................. 116. Calculated drawdown of water levels for 1994 conditions.................................... 127. Generalized drawdown surface of the study area for 1994 conditions
viewed from the southeast............................................................................... 138. Calculated drawdown of water levels projected 10 years beyond 1994................ 159. Calculated drawdown of water levels projected 20 years beyond 1994................ 16
TABLES
Table 1. Wells in the Mendenhall-D'Lo area and aquifer properties used to calculatedrawdown.......................................................................................................... 9
2. Measured and calculated drawdown for selected wells......................................... 14
in

CONVERSION FACTORS AND VERTICAL DATUM
Multiply Ey. To obtain
foot 0.3048 meterfoot per day 0.3048 meter per dayfoot per year 0.3048 meter per yearfoot per mile 0.1894 meter per kilometerinch 25.4 millimeterinch per year 25.4 millimeter per yearmile 1.609 kilometermillion gallons per day 0.04381 cubic meter per secondcubic foot per second 0.02832 cubic meter per secondmillion cubic feet per day 0.3278 cubic meter per secondsquare mile 2.590 square kilometerfoot squared per day 0.0929 meter squared per day
Temperature in degrees Fahrenheit (°F) can be converted to degrees Celsius (°C) as follows: °C = (°F-32)/l.8.
Sea level: In this report "sea level" refers to the National Geodetic Vertical Datum of 1929 a geodetic datum derived from a general adjustment of the first-order level nets of both the United States and Canada, formerly called Sea Level Datum of 1929.
The standard unit for transmissivity is cubic foot per day per square foot times foot of aquifer thickness. In this report, the mathematically reduced form, foot squared per day, is used for convenience.
IV

HYDROGEOLOGY AND ANALYSIS OF GROUND-WATERWITHDRAWAL IN THE MENDENHALL-D'LO AREA,
SIMPSON COUNTY, MISSISSIPPI
By Eric W. Strom and William T. Oakley
ABSTRACT
The cities of Mendenhall and D'Lo, located in Simpson County, Mississippi, rely on ground water for their public supply and industrial needs. Most of the ground water conies from an aquifer of Miocene age. A study began in 1991 to describe the hydrogeology, analyze effects of ground-water withdrawal by making a drawdown map, and estimate the effects increased ground- water withdrawal might have on water levels in the Miocene age aquifer in the Mendenhall-D'Lo area.
The study area covers about 30 square miles in Simpson County, south-central Mississippi. Geologic units that crop out range from Tertiary to Quaternary in age. The sediments include alluvial and fluvial gravel, sand, and silt; deltaic sand, silt and clay; and prodeltaic and marginal marine clays. The geologic units, from oldest to youngest, are the Catahoula and Hattiesburg Formations of Miocene age; the Citronelle Formation of Pliocene or Pleistocene age; terrace deposits probably of Pleistocene age; and alluvium of Holocene age.
The significant withdrawals of ground water in the study area are from 10 wells screened in the lower sand of the Catahoula Formation. About 0.53 million gallons of water per day is currently (1994) withdrawn from these 10 wells. Analysis of the effect of withdrawals from the 10 wells was made using the Theis nonequilibrium equation and applying the principle of superposition. The study area was discretized into an equally spaced grid and drawdown was calculated at the center of each grid cell. Analysis of 1994 conditions was based on the pumpage history and aquifer properties determined for each well. The drawdown surface resulting from the analysis indicates three general cones of depression. One cone is in the northwestern D'Lo area, one in the south-central Mendenhall area, and one about 1V2 miles east of Mendenhall. Calculated drawdown ranges from 21 to 47 feet.
Drawdown-surface maps were made for 10 years and 20 years beyond 1994 using a constant pumpage. The map made for 10 years beyond 1994 indicates an average total increase in drawdown of about 5.3 feet. The map made for 20 years beyond 1994 indicates an average total increase in drawdown of about 7.3 feet. Because drawdown and pumpage have a linear relation in the Theis nonequilibrium equation, the projection scenarios may be used for extrapolation or interpolation of drawdown for other pumping rates.

INTRODUCTION
The cities of Mendenhall and D'Lo, located in Simpson County, Mississippi, rely on ground water for their public supply and industrial needs. Most of the ground water comes from an aquifer of Miocene age. Regionally, water levels in the Miocene aquifers in Simpson County are declining at the rate of about 1 foot per year (Newcome and others, 1972). Continued population growth and the development of new industries may increase the rate of water-level decline. In 1991, the U.S. Geological Survey, in cooperation with the Pearl River Basin Development District and the Mississippi Department of Environmental Quality, Office of Land and Water Resources, began an investigation for the purpose of describing the hydrogeology, analyzing effects of ground-water withdrawal by making a drawdown map, and projecting the possible effects of increased ground-water withdrawals on water levels in the Miocene aquifer within the Mendenhall-D'Lo area. This report presents the results of that study.
General Setting of the Study Area
The study area covers about 30 square miles in Simpson County, south-central Mississippi (fig. 1). The area is located in the Southern Pine Hills of the Gulf Coastal Plain physiographic province (Fenneman, 1938). The land surface is hilly, ranging in altitude from about 260 to 520 feet above sea level. The Strong River, the major surface-water drainage, flows southwestward between Mendenhall and D'Lo and drains into the Pearl River about 15 miles southwest of the study area. The Strong River has an alluvial plain that is about 1-mile wide in the study area. The normal mean annual temperature at D'Lo is about 63 degrees Fahrenheit; normal annual precipitation is about 59 inches.
Previous Investigations
Previous investigations that include all or part of the study area have been published by the U.S. Geological Survey, the Mississippi Geological Survey, and the Mississippi Department of Natural Resources. These investigations include those by Stephenson, Logan, and Waring (1928); Newcome and others (1972); May and Marble (1976); and Gilliland and Harrelson (1981).
HYDROGEOLOGY
The hydrogeology of the study area is described here in terms of the geologic setting, the hydrogeologic units and their relation to each other, ground-water movement, and ground-water withdrawal. All of the formations and deposits described have potential water-bearing zones; however, a lower sand in the Catahoula Formation of Miocene age is the principal source of ground water in the study area.
Geologic Setting
The geologic setting of the study area is described by Gushing and others (1964) as resulting from subsidence that may have begun during the late Paleozoic Era and continued through the Cretaceous Period. This subsidence formed the basins of the Gulf Coast geosyncline, and of the southward plunging syncline of the Mississippi embayment. However, most of the syncline of the Mississippi embayment was not formed by the end of the Paleozoic Era, but during the Jurassic Period of the Mesozoic Era when evidence of a sedimentary basin became observable. By the end of the Cretaceous Period the Mississippi embayment had attained the approximate size and shape of today. Since the Cretaceous Period, cyclic transgression and regression of the sea have subsequently deposited an assorted, but ordered array of sediments within the Mississippi

89°5
5'89
°52'
30"
89°5
0'
32°
EX
PLA
NA
TIO
N
TRA
CE
OF
GEO
LOG
IC
SEC
TIO
N
p
TEST
HO
LE A
ND
LET
TER
D
ESIG
NA
TIO
N
31°5
7'30
"
SIM
PSO
N
CO
UN
TY
Bas
e fr
om U
.S. G
eolo
gica
l Sur
vey
A.
Men
denh
all
1 W
est
1:24
,000
,197
0 an
d M
ende
nhal
l 1
East
1:2
4,00
0,19
70
01
MIL
E
1 K
ILO
MET
ER
Figu
re 1
. Loc
atio
n of
the
stud
y ar
ea a
nd tr
ace
of g
eolo
gic
sect
ion.

embayment. The nature of the sediments is directly related to past depositional environments, which in turn are related to fluctuations of sea level and the shifting of the shoreline. Older geologic units crop out in the northeast, and sequentially younger units are present at land surface to the west and south. The dip of the geologic units in the study area generally is toward the southwest.
Description of the Hvdroyeoloyic Units
Geologic units that crop out in the study area range from Tertiary to Quaternary age. The sediments include alluvial and fluvial gravel, sand, and silt; deltaic sand, silt and clay; and prodeltaic and marginal marine clays. The geologic units, from oldest to youngest, are the Catahoula and Hattiesburg Formations of Miocene age; the Citronelle Formation of Pliocene or Pleistocene age; terrace deposits probably of Pleistocene age; and alluvium of Holocene age (fig. 2). Descriptions of the geologic units are from May and Marble (1976) except where noted.
Catahoula Formation
The Catahoula Formation is fluvial to marginal-deltaic in depositional origin. The sediments probably represent a regressive, offlap sequence. The Catahoula Formation reaches a maximum thickness of about 450 feet in the study area and dips to the southwest at about 20 feet per mile. The formation mainly consists of deltaic silt and clay deposited in a low energy environment, and lenses of sand deposited in a high energy environment. Induration of the materials occurs primarily at surface exposures (Gilliland and Harrelson, 1981).
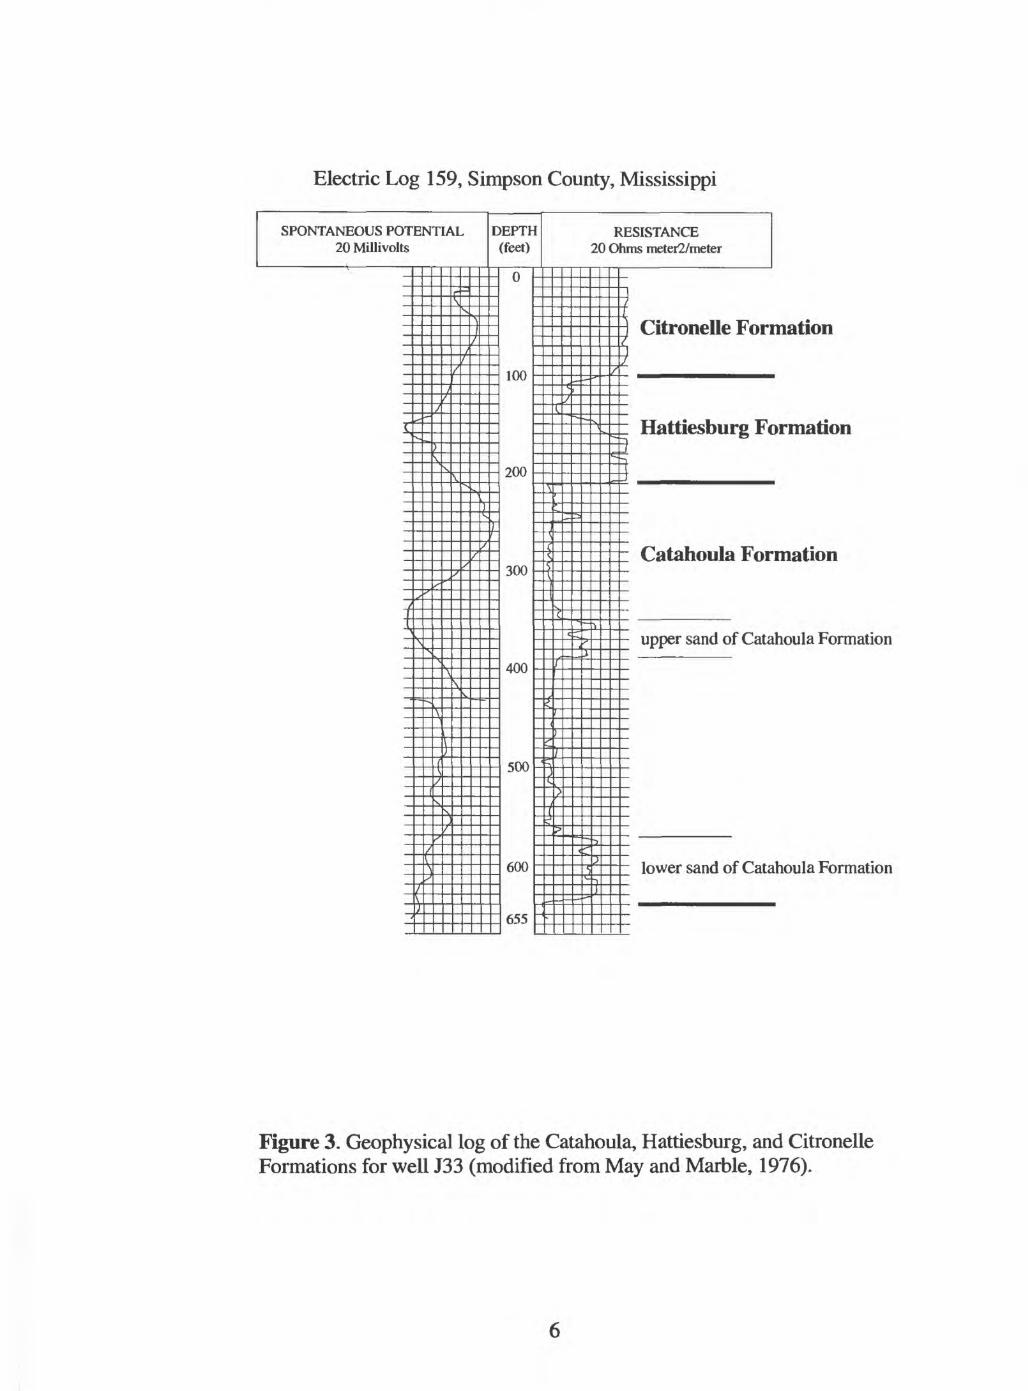
Many of the sand lenses in the Catahoula Formation are not continuous; however, an upper and lower sand interval exists within the formation. The upper sand consists of medium to coarse grained lenses, and ranges from 35 to 45 feet in thickness. The lower sand is fairly continuous in the study area, and ranges from 35 to 65 feet in thickness; greater thicknesses usually contain some clay or silt lenses. The lower sand primarily is a coarse to very coarse, poorly sorted quartz sand that is fluvial in nature. The upper and lower sands are both considered aquifers in the study area; however, most wells are screened in the lower sand. A geophysical log of the Catahoula Formation and overlying formations for well J33 is shown in figure 3.
The Catahoula Formation is unconformably underlain by the Vicksburg Group of Oligocene age. Clay from the Bucatunna Formation confines the Catahoula Formation from aquifers in the Vicksburg Group. The relation between the Catahoula Formation and other units is shown in figure 4.
Hattiesburg Formation
May and Marble (1976) describe a "Post-Catahoula Unit" that will be referred to as the Hattiesburg Formation in this report. Reasons for adopting this nomenclature are the same as those pointed out by Gilliland and Harrelson (1981): the "Post-Catahoula Unit" is in the same stratigraphic position as the Hattiesburg Formation and other publications, such as the geologic map of Mississippi (Bicker, 1969), show the unit as the Hattiesburg Formation.
The Hattiesburg Formation is fluvial to marginal-deltaic in depositional origin. The sediments probably represent a regressive sequence, similar to the underlying Catahoula Formation. The Hattiesburg Formation has a maximum thickness of about 130 feet in the study area and dips slightly west of south at about 20 feet per mile. The formation mainly consists of an upper argillaceous silt deposited in a low energy environment, and a lower medium to coarse grained,

Era
them Cenozo
ic
Syst
em
Quaternary & fi £
Seri
es
Hol
ocen
e
Plei
stoc
ene
Plei
stoc
ene
or P
lioce
ne
Mio
cene
Olig
ocen
e
Gro
up Vicksburg
Geo
logi
c un
it
Allu
vial
dep
osits
Ter
race
dep
osits
Citr
onel
le F
orm
atio
n
Hat
tiesb
urg
Form
atio
n
Cat
ahou
la F
orm
atio
n
Buc
atun
na F
orm
atio
n
Byr
am F
orm
atio
n
Gle
ndon
Lim
esto
ne
Min
t Sp
ring
For
mat
ion
Hyd
roge
olog
ic p
rope
rtie
s
Wat
er-t
able
aqu
ifer
of s
mal
l ar
eal e
xten
t yi
eldi
ng s
mal
l am
ount
s of
wat
er.
Wat
er-t
able
aqu
ifer
of s
mal
l ar
eal e
xten
t yi
eldi
ng s
mal
l am
ount
s of
wat
er.
Aqu
ifer
lim
ited
in a
real
ext
ent.
Aqu
ifer
lim
ited
in a
real
ext
ent.
Sand
s fo
rm im
port
ant
aqui
fer
in t
he s
tudy
are
M
ost p
ublic
and
indu
stri
al w
ells
scr
eene
d in
t lo
wer
san
d.
Not
an
aqui
fer.
Not
an
aqui
fer.
Gen
eral
ly n
ot a
n aq
uife
r.
Pote
ntia
lly a
n aq
uife
r ca
pabl
e of
yie
ldin
g sm
all
amou
nts
of w
ater
.
Figu
re 2
. G
eolo
gic
units
and
pri
ncip
al a
quif
ers
in th
e st
udy
area
(m
odif
ied
from
Gill
iland
and
Har
rels
on,
1981
).
Electric Log 159, Simpson County, Mississippi
SPONTANEOUS POTENTIA 20 Millivolts
1
2^ "
Jv
1
\ ^
S "*
^ 7
J
\^
>j
V
iJ/
T7
j^
^
^7rX
-̂i
L DEPTH (feet)
---- 0 -
sAT~l_
/
i\j\j
onnzuu
iN
~^_/ onnJUU
^
JV/U
----- 600 -
: : _ _ 655 H
RESISTANCE 20 Ohms metei2/meter
"^7
^
'
^c :
"*
JT
2
?
_ ̂
- ^ .̂
c ̂^f
«'-2T
^ ^1
n~j_T
- j Citronelle Formation/
. J/
V : : Hattiesburg Formation"~ ~i
j
-. -- _ _ _-. .: : Catahoula Formation
- - upper sand of Catahoula Formation
_lower sand of Catahoula Formation
Figure 3. Geophysical log of the Catahoula, Hattiesburg, and Citronelle Formations for well J33 (modified from May and Marble, 1976).

Hat
tiesb
urg
Form
atio
n
100 -
SEA
L
EV
EL
100
-
Citr
onel
le F
orm
atio
n
Cat
ahou
la F
orm
atio
n
- V
icks
burg
Gro
up S
A'
DA
TUM
IS S
EA L
EVEL
Not
e: le
tters
inde
x te
st h
oles
des
crib
edin
May
and
Mar
ble,
197
6.0
1 M
ILE
VER
TIC
AL
SCA
LE G
REA
TLY
EX
AG
GER
ATE
D
01
KIL
OM
ET
ER
Fig
ure
4. G
eolo
gic
sect
ion
show
ing
rela
tion
of th
e ge
olog
ic u
nits
in th
e st
udy
area
(m
odif
ied
from
May
and
Mar
ble,
197
6).

poorly sorted sand, deposited in a high energy environment. The Hattiesburg Formation is not heavily pumped in the study area.
Citronelle Formation
The Citronelle Formation is fluvial in depositional origin. The formation probably formed a continuous blanket of sediment in the past (Boswell, 1979), but now occurs only at the higher altitudes in the study area. The Citronelle Formation has a maximum thickness of about 150 feet in the study area and dips slightly west of south at about 10 feet per mile. The formation mainly consists of coarse sand and gravel deposited in a high energy environment. The Citronelle Formation is not heavily pumped in the study area.
Terrace Deposits
Terrace deposits occur on many of the hills at lower altitudes than the hills capped by the Citronelle Formation. Thickness of the deposits is highly variable and dips have not been determined. The deposits mainly consist of fine-to coarse-grained sand. The deposits may have resulted from sea level fluctuations during Pleistocene glaciation.
Alluvial Deposits
Alluvial deposits are present in the river valleys of the study area. These deposits are the result of fluvial erosion of materials from higher elevations. Thickness of the deposits is variable, but may average about 20 feet in the Strong River alluvial plain. The deposits mainly consist of clay, sand, and gravel eroded from terrace deposits and from the Citronelle, Hattiesburg, and Catahoula Formations.
Ground-Water Movement
Both confined and unconfined conditions occur in the aquifers of the study area. Aquifers in alluvial deposits, terrace deposits, the Citronelle Formation, and much of the Hattiesburg Formation are probably under unconfined conditions. Parts of the upper sand trend of the Catahoula Formation, particularly near the river valleys, may also be under unconfined conditions. The lower sand in the Catahoula Formation, however, is under confined conditions, separated from the overlying sand bed by silt and clay.
Ground-water movement in unconfined aquifers is influenced greatly by-topography. Ground water generally moves from areas that are topographically high to areas that are topographically low. In the study area, most of the movement of unconfined ground water is toward the Strong River (Boswell and Arthur, 1988). Limited water-level data for the confined lower sand of the Catahoula Formation indicate flow in the lower sand similarly may be toward the Strong River and to pumping wells.
Ground-Water Withdrawal
The significant withdrawals of ground water in the study area are from 10 wells screened in the lower sand of the Catahoula Formation. Information regarding pumpage and aquifer properties at each well is listed in table 1. Pumpage for the wells represents an average steady pumping rate, or the rate at which the wells would pumped if the pumps ran continuously throughout the year. The average steady pumping rate was determined by estimating the total volume of water pumped from the well and dividing by the total time. In most cases the total

volume of water pumped was known for a group of associated wells rather than for each individual well, and pumpage was distributed equally. About 0.53 million gallons of water per day currently (1994) is withdrawn from these 10 wells. The total years the wells have been pumped are calculated through December 1994.
Table 1. Wells in the Mendenhall-D'Lo area and aquifer properties used to calculate drawdown
Well
D38
D64
D51
D71
D67
E44
E29
J6
J34
J56
Latitude
315920
315908
315948
315948
315922
315752
315748
315734
315735
315731
Longitude
895417
895403
895435
895431
895420
894942
894944
895214
895236
895218
Years pumped
26
14
21
1
4
8
25
27
22
9
Pumpage (cubic feet per
day)
3,475
3,475
9,290
9,290
4,812
6,283
6,283
9,491
9,491
9,491
Transmissivity (feet squared
per day)
645
912
2,139
828
645
825
'1,200
'860
2,156
2,340
Hydraulic conductivity (feet per day)
18
17
35.7
28
18
19
'35
16
31.7
32.5
1 Slack and Darden, 1991.
ANALYSIS OF GROUND-WATER WITHDRAWAL
Analysis of the effect of ground-water withdrawal from the 10 wells listed in table 1 was made using the Theis nonequilibrium equation and applying the principle of superposition. This method should be applicable because pumping tests for the wells indicated that the aquifer is confined and generally non-leaky in the study area. The Theis nonequilibrium equation computes drawdown in a confined aquifer at a desired distance from a pumping well. To perform the analysis, pumpage of the well, the length of time pumping occurred, and the transmissivity and storage coefficient of the aquifer must be known. The equation given by Theis (1935) is of the form:
h0 -h = _G_4nT
Ss4Tt

where
h0 is the initial head (length) at some distance r (length) from the well,h is the head (length) at some time t (time),s is the resulting drawdown (length),Q is the pumping rate (length cubed per time),T is the transmissivity (length squared per time), and5 is the storage coefficient (dimensionless).
The Theis nonequilibrium equation is a solution to the radial form of the diffusion equation for a given set of initial and boundary conditions. Because the diffusion equation is linear, the principle of superposition allows for the determination of total drawdown caused by multiple wells being pumped simultaneously by summing the drawdown determined for each individual well.
The study area was discretized into an equally spaced grid. Each grid cell was 264 feet on a side for a total of 12,000 grid cells (fig. 5). This discretization provided the resolution necessary to delineate the surface of combined drawdown from multiple wells, and to place each well in the center of a grid cell. The Theis nonequilibrium equation was then applied at the center of each cell for each individual well using numerical approximations. Drawdown for each well in each cell was summed to produce a composite drawdown map. Drawdown was calculated using a well radius of 1 foot in cells that contained a well; however, the analysis does not account for drawdown near a well caused by other factors, such as turbulent flow or regional drawdown. A storage coefficient of 0.0002 was determined by an aquifer test only at well J6 (Slack and Darden, 1991). This value was used for each well in the analysis.
Analysis of 1994 Conditions
Analysis of 1994 conditions was based on the pumpage records and aquifer properties determined for each well (table 1). The Theis nonequilibrium equation is based on the assumption that the aquifer is homogeneous and isotropic. For the analysis of each individual well this assumption was made. The Theis nonequilibrium equation was applied using the value of transmissivity determined from an aquifer test for each individual well for each cell in the grid. The total drawdown in each cell was then determined by summing the drawdown caused by each individual well. An alternative method would be to assume a single average value of transmissivity for all of the wells; however, error likely is reduced by using site specific values of transmissivity for each individual well because calculated drawdown is greatest at the center of a well and decreases exponentially with distance from the well.
The calculated drawdown surface (fig. 6) indicates three general cones of depression. One cone is in the northwestern D'Lo area, one cone in the south-central Mendenhall area, and one cone about 1V2 miles east of Mendenhall. A generalized view of the drawdown surface (fig. 7) shows the coalescing nature of the drawdown cones caused by multiple wells.
Because the computed drawdown surface is a composite of drawdowns from wells that began pumping at different times, drawdown measured at the oldest wells should provide the best verification. The oldest wells are J6, D38, E29, J34, and D51 (table 1). Water-level measurements are no longer possible at well J6 due to reworking of the well. Water-level measurements made in fall 1994 indicate total drawdown of about 39 feet for well D38,42 feet for well D51, and 39 feet for well J34 (table 2). The analysis indicated a total drawdown of about 42 feet at well D38,
10

,89°
55'
89°5
2'30
"
32°
31°5
7'30
"
100
^Ti"
111
1111
1111
11-1
Bas#
from
U.S
. Gw
logk
al S
urw
? M
wxt
eRha
H 1
Wes
t 1;2
4,00
0,19
70 a
sd
Men
tteha
ll i E
ast 1
:24,
000,
1970
89°5
0'
1111
1
120 T2
N
TIN
R4E
R5E
0 1
MIL
E
01
Figu
re 5
. Gri
d ce
lls a
nd w
ell l
ocat
ions
use
d fo
r dra
wdo
wn
calc
ulat
ions
.

89°5
5'89
°52'
30"
89°5
0'
32°
-T.
31°5
7'30
"
/s, G
eolo
gica
l S«i
v«y
i W«s
i 1:
24,0
00,
1970
and
24
EX
PLA
NA
TIO
NL
INE
OF
EQ
UA
L D
RA
WD
OW
N I
N
FE
ET
-Int
erva
l 2 f
eet
01
MIL
E
1 K
ILO
ME
TE
R
Figu
re 6
. Cal
cula
ted
draw
dow
n of
wat
er le
vels
for
199
4 co
nditi
ons.

Figu
re 7
. Gen
eral
ized
dra
wdo
wn
surf
ace
of th
e st
udy
area
for
199
4 co
nditi
ons
view
ed f
rom
the
sout
heas
t.
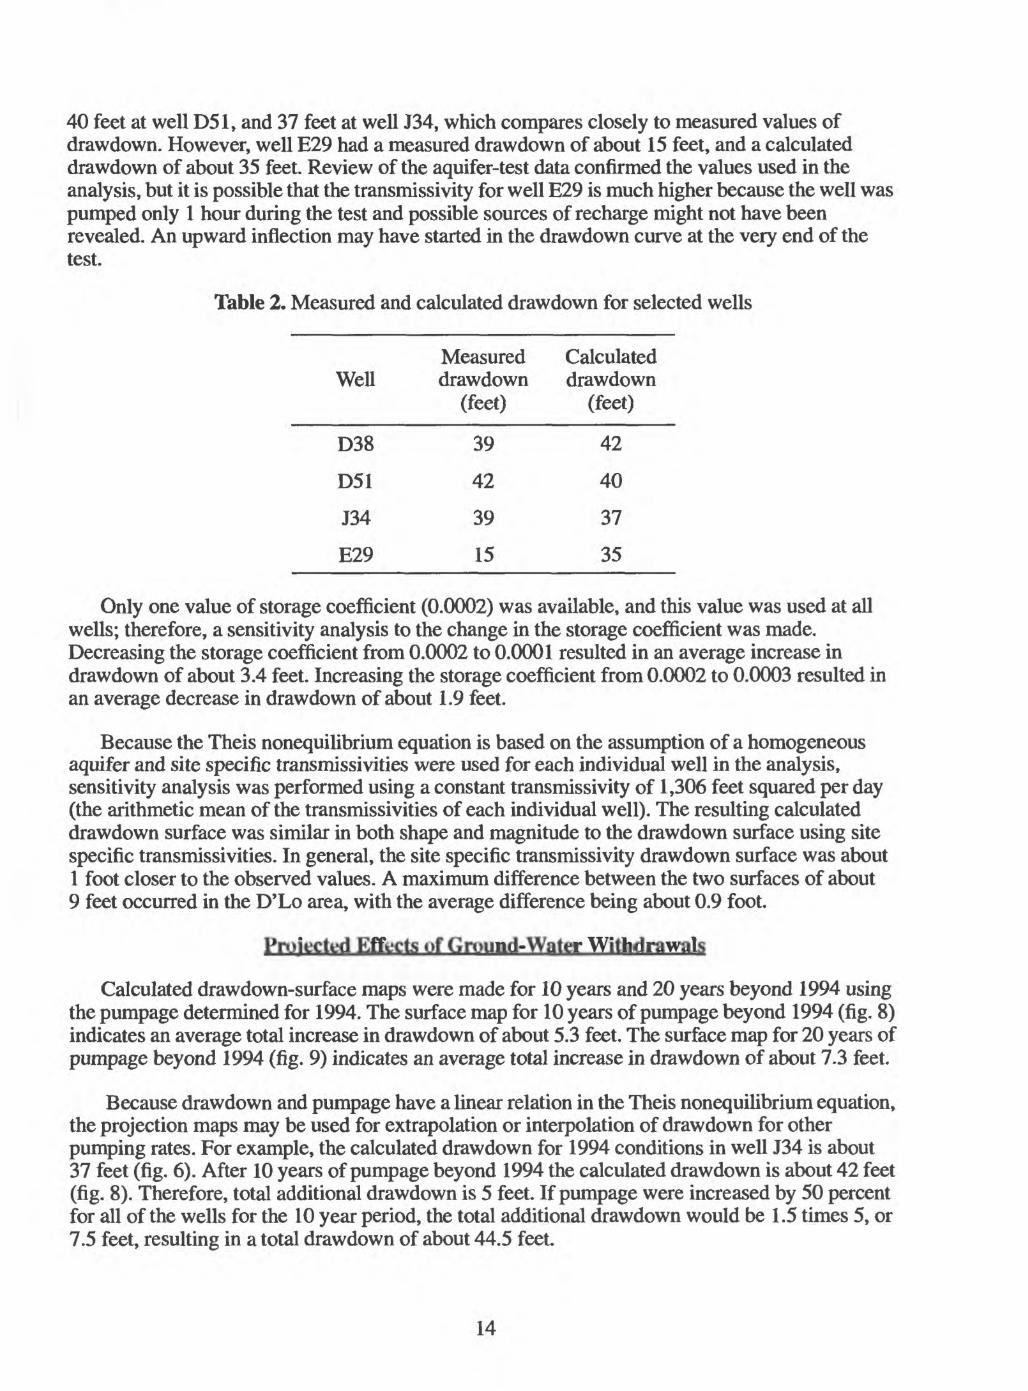
40 feet at well D51, and 37 feet at well J34, which compares closely to measured values of drawdown. However, well E29 had a measured drawdown of about 15 feet, and a calculated drawdown of about 35 feet. Review of the aquifer-test data confirmed the values used in the analysis, but it is possible that the transmissivity for well E29 is much higher because the well was pumped only 1 hour during the test and possible sources of recharge might not have been revealed. An upward inflection may have started in the drawdown curve at the very end of the test.
Table 2. Measured and calculated drawdown for selected wells
Well
D38
D51
J34
E29
Measured drawdown
(feet)
39
42
39
15
Calculated drawdown
(feet)
42
40
37
35
in
Only one value of storage coefficient (0.0002) was available, and this value was used at all wells; therefore, a sensitivity analysis to the change in the storage coefficient was made. Decreasing the storage coefficient from 0.0002 to 0.0001 resulted in an average increase in drawdown of about 3.4 feet. Increasing the storage coefficient from 0.0002 to 0.0003 resulted an average decrease in drawdown of about 1.9 feet.
Because the Theis nonequilibrium equation is based on the assumption of a homogeneous aquifer and site specific transmissivities were used for each individual well in the analysis, sensitivity analysis was performed using a constant transmissivity of 1,306 feet squared per day (the arithmetic mean of the transmissivities of each individual well). The resulting calculated drawdown surface was similar in both shape and magnitude to the drawdown surface using site specific transmissivities. In general, the site specific transmissivity drawdown surface was about 1 foot closer to the observed values. A maximum difference between the two surfaces of about 9 feet occurred in the D'Lo area, with the average difference being about 0.9 foot.
Pmfecti-d Effects uf Ground-Water Withdrawals
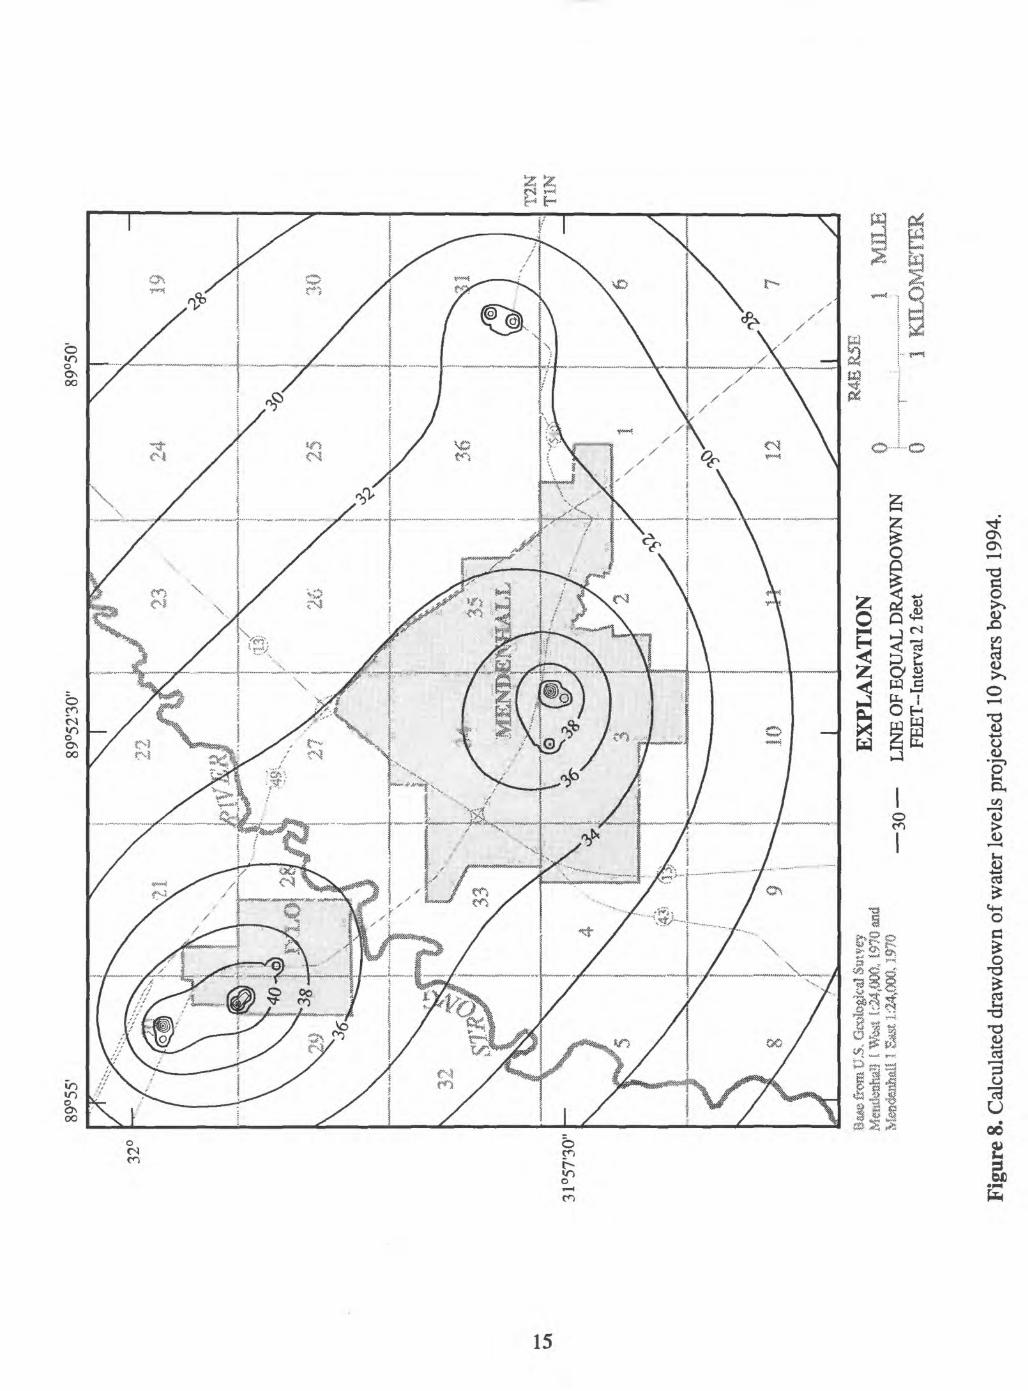
Calculated drawdown-surface maps were made for 10 years and 20 years beyond 1994 using the pumpage determined for 1994. The surface map for 10 years of pumpage beyond 1994 (fig. 8) indicates an average total increase in drawdown of about 5.3 feet. The surface map for 20 years of pumpage beyond 1994 (fig. 9) indicates an average total increase in drawdown of about 7.3 feet.
Because drawdown and pumpage have a linear relation in the Theis nonequilibrium equation, the projection maps may be used for extrapolation or interpolation of drawdown for other pumping rates. For example, the calculated drawdown for 1994 conditions in well J34 is about 37 feet (fig. 6). After 10 years of pumpage beyond 1994 the calculated drawdown is about 42 feet (fig. 8). Therefore, total additional drawdown is 5 feet. If pumpage were increased by 50 percent for all of the wells for the 10 year period, the total additional drawdown would be 1.5 times 5, or 7.5 feet, resulting in a total drawdown of about 44.5 feet.
14
89°5
5'89
°52'
30"
89°5
0'
32°
31°5
7'30
" - 8a/»
from
U.S
. Gto
fegk
al S
atve
y M
eiuf
eBha
S 1 W
&it
1:24
,000
, 19
70 a
nd
Msm
tenM
t 1 E
ast 1
:24,
0«),
1970
EX
PLA
NA
TIO
N 3
0
LIN
E O
F E
QU
AL
DR
AW
DO
WN
IN
FE
ET
-Int
erva
l 2 f
eet
R4E
R51
1
0
Figu
re 8
. Cal
cula
ted
draw
dow
n of
wat
er le
vels
pro
ject
ed 1
0 ye
ars
beyo
nd 1
994.

89°5
5'
89°5
2'30
"89
°50'
31°5
7'30
"
tia U
,S. C
aH i.
Wes
t 1:
24,0
00,
1 Ea
st J
:24.
0i>0
. 19
70 3
2
LIN
E O
F E
QU
AL
DR
AW
DO
WN
IN
FEE
T-I
nter
val 2
fee
t 0
1
1 K
ILO
ME
TE
R
Figu
re 9
. Cal
cula
ted
draw
dow
n of
wat
er le
vels
pro
ject
ed 2
0 ye
ars
beyo
nd 1
994.

Limitations of the Analysis
To perform the analysis, several assumptions were made: (1) the lower sand of the Catahoula Formation is confined and infinite in extent, (2) wells are of infinitesimal diameter and fully penetrate the aquifer, (3) water is released instantaneously with decline in head in the aquifer, (4) the aquifer is homogeneous and isotropic, and (5) no contributions of water are made from overlying or underlying aquifers. The first assumption is valid if the extent of the aquifer is large compared to the extent of the drawdown cones of the pumping wells. If impermeable geologic boundaries are reached by the drawdown cones, however, computed drawdown will be less than actual drawdown. Nearby sources of recharge would cause computed drawdown to be greater than actual drawdown. The second assumption ignores any storage in the well, which is a reasonable assumption for long-term analyses in which the total water pumped is large relative to wellbore storage. Wells in the study were screened to take full advantage of the sand interval. The third assumption is valid for the confined case, but would be invalid if water-table conditions were encountered. The fourth assumption was made for the analysis of each individual well; however, aquifer tests indicated variations in transmissivity. Because site-specific aquifer properties were used at each individual well, the drawdown calculated near each well probably is a better approximation than if a single uniform value of transmissivity had been applied to all wells. The fifth assumption assumes the clay and silt act as effective confining layers under pumping conditions as indicated by the pumping tests. The calculated drawdown will be greater than the actual drawdown if water is contributed from other sources.
Sparsity of historical water-level data and aquifer properties precluded the use of numerical techniques of analysis. However, the analytical technique used provides a guide for estimating drawdown in the past, as well as estimating drawdown trends that may occur in the future. The results from this investigation (feet of drawdown) do not necessarily represent precise drawdowns that will be observed in the field. The drawdown maps in figures 6 to 9 probably indicate too much drawdown in the vicinity of well E29 because transmissivity may be greater than assumed. The addition or deletion of wells, or significant changes in pumping rates would require additional analysis of the projected drawdown surfaces.
SUMMARY
The cities of Mendenhall and D'Lo, in Simpson County, Mississippi, rely on ground water for their public supply and industrial needs. Most of the ground water comes from an aquifer of Miocene age. In 1991, the U.S. Geological Survey, in cooperation with the Pearl River Basin Development District and the Mississippi Department of Environmental Quality, Office of Land and Water Resources, began an investigation for the purpose of describing the hydrogeology, analyzing effects of ground-water withdrawal by making a drawdown map, and projecting the possible effects of increased ground-water withdrawals on water levels in the Miocene aquifer within the Mendenhall-D'Lo area.
The study area covers about 30 square miles in Simpson County, south-central Mississippi. Geologic units that crop out in the study area range from Tertiary to Quaternary in age. The sediments include alluvial and fluvial gravel, sand, and silt; deltaic sand, silt and clay; and prodeltaic and marginal marine clays. The geologic units, from oldest to youngest, are the Catahoula and Hattiesburg Formations of Miocene age; the Citronelle Formation of Pliocene or Pleistocene age; terrace deposits probably of Pleistocene age; and alluvium of Holocene age.
The significant withdrawals of ground water in the study area are from 10 wells screened in the lower sand of the Catahoula Formation. About 0.53 million gallons of water per day currently
17
(1994) is withdrawn from these 10 wells. Analysis of the effect of ground-water withdrawal was made using the Theis nonequilibrium equation and applying the principle of superposition. The study area was discretized into an equally spaced grid, and drawdown was calculated at the center of each grid cell for each individual well. Analysis of 1994 conditions was based on the pumpage records and aquifer properties determined for each well. The calculated drawdown surface indicates three general cones of depression. One cone is in the northwestern D'Lo area, one in the south-central Mendenhall area, and one about 1V2 miles east of Mendenhall.
Calculated drawdown-surface maps were made for 10 years and 20 years beyond 1994 using the pumpage determined for 1994. The map for 10 years of pumpage beyond 1994 indicates an average total increase in drawdown of about 5.3 feet. The map for 20 years of pumpage beyond 1994 indicates an average total increase in drawdown of about 7.3 feet. Because drawdown and pumpage have a linear relation in the Theis nonequilibrium equation, the projection maps may be used for extrapolation or interpolation of drawdown for other pumping rates.
REFERENCES
Bicker, A.R., Jr., 1969, Geologic map of Mississippi: Mississippi Geological Survey, 1 sheet.Boswell, E.H., 1979, The Citronelle aquifers in Mississippi: U.S. Geological Survey Water-
Resources Investigations Open-File Report, 78-131,1 sheet.Boswell, E.H., and Arthur, J.K., 1988, Generalized potentiometric surface of shallow aquifers in
southern Mississippi: U.S. Geological Survey Water-Resources Investigations Report 87- 4257,1 sheet.
Gushing, E.M., Boswell, E.H., and Hosman, R.L., 1964, General geology of the Mississippi embayment: U.S. Geological Survey Professional Paper 448-B, 28 p.
Fenneman, N.M., 1938, Physiography of the Eastern United States: New York, McGraw-Hill Book Co., p. 67-83.
Gilliland, W.A., and Harrelson, D.W, 1981, General geology and mineral resources of the Braxton Quadrangle, Mississippi: Mississippi Department of Natural Resources, Bureau of Geology, Map GQ 95-SW, 1 sheet.
May, J.H., and Marble, J.C., 1976, General geology and mineral resources of the Mendenhall west quadrangle, Mississippi: Mississippi Geological, Economic and Topographical Survey, Map GQ 82-NW, 1 sheet.
Newcome, Roy, Jr., Tharpe, E.J., and Oakley, W.T., 1972, Water for industrial development in Copiah and Simpson Counties, Mississippi: Mississippi Research and Development Center Bulletin, 60 p.
Slack, L.J., and Darden, Daphne, 1991, Summary of aquifer tests in Mississippi, June 1942 through May 1988: U.S. Geological Survey Water-Resources Investigation Report 90-4155, 40 p.
Stephenson, L.W., Logan, W.N., and Waring, G.A., 1928, The ground-water resources of Mississippi, with a discussion o/The chemical character of the waters by C.S. Howard: U.S. Geological Survey Water-Supply Paper 576,515 p.
Theis, C.V., 1935, The relation between the lowering of the piezometric surface and rate and duration of discharge of a well using groundwater storage: Transactions of the American Geophysical Union, v. 16, p. 519-524.
18 * U.S. GOVERNMENT PRINTING OFFICE: 1995 655-177/00023