hydrogeologic conditions at the superconducting super collider site...
TRANSCRIPT

SSCL-SR-1l22
Project No. 87-888-0017
Report No. G R-63
August 1990
Hydrogeologic Conditions at the Superconducting Super Collider Site
Prepared by: III The Earth Technology Iiiiiii Corporat/on Long Beach, California
Prepared for: RLlTkI...U;~~;;;;i.;;;joInt~wn;;; .... ~ Oakland, California

wp.V98N1IGEQ.SSC
HYDROGEOLOGIC CONDITIONS AT THE
SUPERCONDUCTING SUPER COLLIDER SITE
WAXAHACHIE, TEXAS
Prepared by:
Michael Osburn and Gregory Tessier
The Earth Technology Corporation
100 W. Broadway
Suite 5000
Long Beach, California 90802
Prepared for: RTK Joint Venture
1800 Harrison Street P.O. Box 23210
Oaldand, California 94623-23321
Project No. 87-888-0017
August 1990
GR-63

TABLE OF CONTENTS
1.0 INTRODUCTION ....................................................................................................................... 1 1.1 BACKGROUND .............................................................................................................. . 1.2 SITE HYDROGEOLOGY ................................................................................................. 1 1.3 PREVIOUS INVESTIGATIONS........................................................................................ 3 1.4 PRESENT INVESTIGATION OBJECTIVES .................................................................... 3 1.5 SCOPE OF WORK .......................................................................................................... 4 1.6 GENERAL FINDINGS ..................................................................................................... 4
2.0 FIELD ACTIVITIES .................................................................................................................... 5 2.1 BOREHOLE DRIWNG ................................................................................................... 5 2.2 PACKER HYDRAUUC CONDUCTIVITY TESTING ........................................................ 5 2.3 MONITORING WELL CONSTRUCTION ........................................................................ 9 2.4 SLUG TESTING............................................................................................................... 9 2.5 WATER-LEVEL MONITORING ....................................................................................... 9
3.0 INVESTIGATION RESULTS...................................................................................................... 14 3.1 HYDRAUUC CONDUCTIVITY TESTING RESULTS ...................................................... 14 3.2 SLUG TESTING RESULTS ............................................................................................. 18 3.3 WATER-LEVEL MONITORING RESULTS ...................................................................... 23
4.0 SUMMARY ................................................................................................................................ 25 5.0 REFERENCES .......................................................................................................................... 26
APPENDICES
A. MONITORING WELL AS-BUILT DIAGRAMS
B. WATER-LEVEL MEASUREMENTS
C. BAIL TEST RECOVERY MEASUREMENTS AND CURVES
wp.V-eeN1iOE().1OC

UST OF TABLES
faae.
2-1 BORING/WELL COORDINATES.............................................................................................. 7
2-2 MONITORING WELL SPECIFICATIONS ................................................................................. 10
3-1 PACKER TEST DATA................................................................................................................ 15
3-2 COMPARISON OF TEST METHOD RESULTS................... ..................................................... 22
UST OF FIGURES
1-1 HYDROSTRATIGRAPHIC CROSS SECTION OF SSC REGION ........................... _................ 2
2-1 GENERAL LOCATION MAP ..................................................................................................... 6
2-2 TUNNEL PROFILE.................................................................................................................... 13
3-1 CUMALATIVE PERCENT OF HYDRAUUC CONDUCTIVITY OBSERVATIONS.................... 19
3-2 HYDRAUUC CONDUCTIVITY VALUES BY DEPTH BELOW GROUND SURFACE .............. 20
3-3 HYDRAUUC CONDUCTIVITY VALUES BY STRATIGRAPHIC UNIT...................................... 21
3-4 AREAL DISTRIBUTION OF HYDRAUUC CONDUCTIVITY VALUES ...................................... MAP POCKET
3-5 WATER-LEVEL ELEVATION VERSUS SURFACE LAND ELEVATION ................................... 24
wp.V .... 'IOEO-TOC ii

1.0 INTRODUCTION
1.1 BACKGROUND
• Preliminary results
This report presents the results of hydrogeologic investigations at the Superconducting Super Coil icier (SSC) site near Waxahachie, Texas. The hydrogeologic data were collected from May 1989 through June 1990, as part of the SSC Startup Geotechnical Characterization. The program goal is to allow the geologist and engineer to build their level of knowledge and confidence about the geologic structures and geotechnical properties of the site materials to the point at which there remains only a realistically small risk of encountering geotechnical conditions during construction that would significantly increase construction costs or delay construction schedules.
The report has been prepared at this time to provide preliminary information on the site hydrologic conditions to support ongoing engineering studies. Additional evaluation of the hydraufic connection between host formations for the tunnel and of the surficial alluvium and terrace deposits are ongoing. Also only 5 months have passed between construction of some SSC site characterization wells and the writing of this report. Repeated measurements show a continuing slow rise in the water level in many wells, suggesting that the screened formations have a low permeability. Therefore, the report is partiaUy based on preliminary data and estimated static groundwater levels. For 50 percent of the wells, the present data are insufficient to determine if the water level in the wei has stabilized. Additional water-tevel measurements are ongoing and it is expected that some values will change with time, possibly affecting the results presented in this report.
1.2 SITE HYDROGEOLOGY
• Hydrostratigraphy
• Quatemary deposits
wp.V9IIN1IGEC>SSC
The hydrostratigraphy of the SSC site is illustrated schematically in Figure 1-1. Both the near-surface aquitards and the underlying aquifers are significant to the construction and long-term stability at the SSC site. The near-surface aqultard includes Taylor Marl, Austin Chalk, and Eagle Ford Shale in descending order; SSC tunnels and experimental haUs will be excavated in these three units. The two primary regional groundwater aquifers are the lower Woodbine group and the Twin Mountain Formation (in the Trinity Group). The two primary aquifers are a minimum of 600 feet and 2,000 feet, respectively, below the proposed tumel depth. The Paluxy Sand Is a less significant aquifer in the Trinity Group. The potentiometric level of groundwater In both major aquifers has declined as a result of long-term overdrafting, or withdrawal greater than the rate of recharge.
Not shown in Figure 1-1 are relatively thin layers of surficial Quaternary alluvium and terrace deposits and weathered bedrock. Where encountered during construction, these units may yield signifICant quantities of water; however, their distribution is limited, generally restricted to about four shaft locations. These units have not been evaluated systematically and, hence, are not Included in this report. Terrace deposits near Lumklns have been examined in some detail, as reported in Geotechnical Report GR-62. Other areas of Quaternary
1

Il00'
100'
,00'
120ft
1400'
..".,'
1000'
'000'
"00'
1000'
...,.,'
MOO'
.-'0011
A Iun,,'·_
-
FIGURE 1-1 HYDROSTRATIGRAPHIC CROSS SECTION OF SSC REGION
Projected Tunne. loceUon*'--7
Aquifer Aqultard
JII U'",IOI J~ ,,·n·tol
Projected Tunnel Location
Seellon Key
JK "·J4·JOI J~ n· 4)'101
A,,~ __________ ~
o I 4 , , to ...
TY ",,,. JOI
WELL NUMBERS)
Adapted From: Enyironmentallnformatlon Qocument for the Dallas-Fort Worth sse Site fWater), Texas National Research laboratory Commission
-The tunnel will be excavated In Eagle Ford Shale on the western side of the ring.
-' -' .Off
loti
120ft
100II
100II
-' ,ood
,-' -,...,' ,-' ,..,.,. -

deposits at the site are being investigated by SSC Lab and the Texas National Research Laboratory Commission, and will be reported in the future.
1.3 PREVIOUS INVESTIGATIONS
Previous investigators have reported that the units which comprise the near-surface aquitard yield only small quanities of water to a few hand-dug wells in Ellis County (Thompson, 1967). During the SSC Site Pre-Proposal investigations (Texas National Research Laboratory Commission, 1987), several packer tests were conducted in the bedrock aquitard. The tests yielded hydraulic conductivity values of less than 10.7 centimeters per second (3 x10⁻⁴feet/day).*
Results were obtained from 18 boreholes distributed around the originally proposed tunnel location and included all three geologic formations. These tests were run at low test interval pressures (5 to 10 pounds per square inch measured at the surface) and generally included the entire section of unweathered bedrock in each borehole, i.e., a single packer was inflated near the top of the hole. Monitoring wells were constructed in seven of these borings, but were not systematically monitored. These wells were identified as E-8, E-9, F-2, F-4, J-2, J-6, and K-6.
Potentiometric levels in the Woodbine and Twin Mountain formations have also been measured and the amount of drawdown over time has been evaluated for these deep regional aquifers (Thompson, 1967, and Guyton, 1987). Subsequent to the pre-proposal phase studies, a regional water supply study considering present and future water requirements both with and without the SSC project was prepared (Espry, Huston and Assoc., 1989). In part, this report concluded that groundwater supplies in the study area are dwindling, and that well productivity is generally low and water is of marginal quality and high temperature. Therefore, groundwater is not considered a primary alternative for future water demand.
1.4 PRESENT INVESTIGATION OBJECTIVES
Hydrogeologic investigations were included in the SSC Startup Geotechnical Characterization wlth the following objectives:
• To assess hydrogeologic condltions in the construction zone
• To provide data for predicting water-handling requirements during construction and operation
* The engineering standard for the SSC ProJect is english units which are used for all linear and pressure measurements presented in this report. Hydraulic conductivity is presented in centimeters per second (cm/sec); the industry standard for hydrologic investigations. Metric units are followed by the equivilant value in feet/day (ft/day) in parentheses in the text. Both units are presented on the graphs, but only cm/sec are induded in the tables. To convert from cm/sec to ft/day multiply by 2,835.
wp.\l96N1iGED-SSC 3

1.5 SCOPE OF WORK
To meet these objectives. The Earth Technology Corporation and subcontractors Southwestern Laboratories and Mason-Johnston and Associates expanded on the approach used during the pre-proposal investigation studies by:
• Performing straddle packer tests to assess the hydraulic conductivity of discrete stratigraphic and structural geologic features
• Constructing and monitoring wells with short screen intervals to assess hydraulic head at discrete depths
• Performing slug withdrawal tests as an adjunct to the packer test data
Packer and slug test data were used to assess the hydraulic conductivity in the tested intervals. Hydraulic conductivity values along with hydraulic head data can be used to predict the rate of groundwater inflow to the tunnel during construction. Results of water-level monitoring indicate where water will be encountered during construction and define the hydraulic head at the tunnel elevation.
1.6 GENERAL FINDINGS
wp.V98N1IGE~
Several hydrogeologic conditions interpretated at the SSC Site as a result of this investigation are as follows:
• The host rock formations for the tunnel appear saturated.
• Groundwater Is generally within 20 feet of the ground surface.
• The medium of hydraulic conductivity test values is 2 x 10.7 cm/sec {6 x 10'" ftlda1 and the median plus one standard deviation is 5.5 x 10 cm/sec (1.6 x 10;.a ft/day).
• The distribution of hydraulic conductivity values cannot be cleariy correlated with depth or areally.
4

2.0 FIELD ACTIVITIES
2.1 BOREHOLE DRILLING
Hydrologic tests and water-level observations were conducted in 48 holes drilled during startup geotechnical characterization of the Texas SSC site. The locations of these borings are shown in Figure 2-1 and listed in Table 2-1. Avalable location coordinates for wells constructed during SSC pre-proposal activities are also listed in the table. The holes were drUled at 3.125-1nch or 4.75-inch diameters by rotary coring using a diamond bit. Water for drilling was obtained from the most convenient surface or municipal water source.
2.2 PACKER HYDRAUUC CONDUCTIVITY TESTING
• Test objectives
• Procedures
wp.l/geNl/GEo-SSC
Straddle packer tests were made in 44 open boreholes. Tests were generally run the day after the drilling was completed.
The objective was to estimate the hydraulic conductivity in the Taylor Marl. Austin Chalk. and Eagle Ford Shale in a range of unfractured rock. fractured or suspected water-bearing rock. formation contacts. and tunnel elevations. Tests at tunnel elevations were based on a tunnel dipping 0.35 degree to the southeast; this was the deepest of the range of tunnel alignments being considered at the time of testing. Therefore. many of the tested intervals are significantly below the current shallowly dipping (see Figure 2-2) tunnel.
Test depths were selected based on wireline geophysical logs and visual inspection of rock cores. The pneumatically operated rubber straddle packers (separated by about 20 feet of perforated pipe) were lowered into the borehole to the test depth. The packers were inflated to a precalculated pressure to seal against the rock side walls and water was pumped into the test Interval at a selected pressure; the flow rate was measured with a cumulative flow meter and sometimes also with a calibrated container from which the water was drawn. The packer inflation pressure was determined by multiplying the depth to the test Interval. in feet. by 0.43 psVfoot of water (hydrostatic pressure) and adding 150 percent of the maximum water pressure to be applied. The applied water pressure was between 10 and 60 percent of the hydrostatic pressure at the test depth. depending on conditions encountered. Testing was done In three pressure steps. first pressurizing the test interval to a relatively low pressure. then raiSing the pressure. and finally lowering the pressure to the original rate. At each of these steps. the pressure and flow rate were recorded at 1-mlnute intervals for 15 minutes.
5

RGURE 2-1. GENERAL LOCA 110N MAP
Explanation • Boring with hydraulic conductivity data
• Monitoring well with hydraulic conductivity data
• Monitoring well without hydraulic conductivity data
o Monitoring wells constructed as part of pre-proposal site surveys
A larger scale map with well and boring identification numbers and additional data is located in the map pocket.
6
8 rLrI o 8000 16000 32000
Feet

sse HydrolTllble 2.1
TABLE 2-1. BORINGIWELL COORDINATES
Page 1 of 2
7
GEOTECHNICAL REPORT NUMBER

•
sse HydrotT IIbIe 2.1
TABLE 2-1. BORINGIWELL COORDINATES
Page 2 of 2
N/A - Not Available
Boreholes listed as boring only were grouted to the surface after packer tests. Monitoring wells were constructed in the remaining boreholes after packer, pressure meter, or hydro-fracture tests.
8
GEOTECHNICAL REPORT NUMBER
GR-SS

2.3 MONITORING WELL CONSTRUCTION
2.4 SLUG TESTING
Monitoring wells were constructed in 31 of the borings following packer testing. No packer tests were performed in monitoring wells BF 1, BE 2, BE 5, or BF 6. Table 2-2 lists these wells and wells constructed during the SSC pre-proposal phase studies, showing construction specifications and the formation screened. The entries in the table, as in all other tables in this report, are ordered as follows:
• Interaction regions
• High Energy Booster area
• Shaft locations
• Pre-proposal phase wells.
The monitoring wells were not developed; the bedrock generally has low hydraulic conductivity and no thickening agents (drilling "mud") were added to the water used as drDlIng fluid. Very fine cuttings produced by the diamond drilling bits may have clogged some small fracture openings, but based on study results, this is not believed to be a significant concern. The majority of wells were bailed dry after construction. Well construction "as-buUt" diagrams for all wells are included in Appendix A.
Slug tests were done by the withdrawal method, bailing the water-level down in an monitoring well and measuring the water-level recovery over time. Water levels were generally lowered substantially during baUing that usually continued for about 1 hour, rather than just removing a discrete slug, to minimize the effect of water draining from the sand pack between the wells and the low hydrauic conductivity formations. Frequent measurements were made immediately after bailing and the measurement interval was increased as the rate of water -level rise decreased with time. The date and time of measurements, measured water level, and a plot of the recovery data for each of the bail tests are presented in Appendix C.
2.5 WATER-LEVEL MONITORING
wp. \III6N 1/GEO-SSC
Water levels have been measured periodically in each of the monitoring wells using a steel tape measure. Measurements are listed in Appendices B and C. The purpose of these measurements is to:
• Assess hydraulic head data necessary for the calculation of hydrauic conductivity from the packer test data
• Provide input for dewatering requirements during construction and operation.
Water levels in many wells have not changed Significantly during the latest measurements, indicating that the levels are at or near equlibrlum. Levels in other wells are stll rising significantly. Water levels in all wells have recovered to an elevation above the screened
9

sse ~drolTlIb" 2 2
DATE CONSTRUCTION
OOMPlETED
TABLE 2-2. MONITORING WELL SPECIFICATIONS
Page 1 of 2
SCREENED SAND

.... ....
TABLE 2-2. MONITORING WELL SPECIFICATIONS
Page 2 of 2
• Geotechnical Report Number (see list of references for report titles). •• Standard sieve size.
N/A - Not Available .
sse HydrofToble 2.2

• Recovery rates
wp.V96N1IGEo-SSC
interval. The water level has risen above the ground surface in wells BIR 54 and BF 3 indicating confined or semiconfined hydrologic conditions. The extent of these confined areas has not been determined. The higher hydraulic head associated with confined beds would cause higher ground water inflow rates if penetrated during subsurface excavation than areas where unconfined conditions and a lower hydraulic head are present.
Short-period water-level measurements were made in nine wells to monitor their recovery rates (Appendix C). Measurements were made over short periodS to evaluate water-level recovery after initial bailing In wells BI2A, BI3, BF 3, BE 6, BE 7A, BE 8, BF 8,BF 9 and BE 10. Water-level recovery rates In these wells ranged from 1 foot (BF 8) to 55 feet (BF 9) in the first 4 hours after baaing.
The most recent water-level measurements for the shaft and interaction hall area wells are shown on a geologic profile of the tunnel alignment in Figure 2-2. The packer test Intervals and screened intervals for these wells are also presented in the figure.
12

, I i I
I I
HYDROLOGIC DATA
T STATIC WATER LEVEL
V PRESENT WATER LEVEL
A ESTIMATED STATIC WATER LEVEL
J... BOTTOM OF BOAING
o pACKEA TEST INTERVAL
+ SCAEENED INTERVAL (Wells Construcled al'ter Pac:lo;erTesl)
I
I
10
SEE BEDROCK GEOLOGY OF THE SUPER CONDUCTING SUPER COLUDER SITE REPORT GR·65 FOR LATEST GEOLOGIC INTERPRETATION
GROUNQ PROF lLE BASED ON USGS TQPOGRRPHIC MAP ELEvAT IONS.
GEOLOGY BASED ON JANUARY 1990 GEOTECHNICAL INVESTIGATION.
i 15
I I I IT 1 1 1 1 " Til Iii I I I I I ! ' r -I I
1 I I I ! I "i I 1 [ I I r I I "L I
25 " DISTANCE (HILESI
LEGEND
~TUNNEL PROFILE - S::e: "[r PLAN ;;0" STRiKE. OBUOUITy. ANO CENi~R LOCATION
APPAOXIHRTE BASE OF EXPEAIMt:NTAL HALL
ALlUV I UN/TERRACE O::PQSI TS
TAYLOR MARL - alAN FORMAT I ON
RUSi IN CHALK
40
"
/ ~
CONTACT
INFERRED CONTACT
FAQT
GROUND ELEVATION OET£AMlt-IEO FADM USGS TOPOGRAPHIC HAPS
BIAS
e~o
500 w w ~
<00 Z 0
3CO ~ i.J
2CO
I 100
50 54. !3
SOUTH BOSOUE FOR'1RT ION - • [AulE FORO S~'...£' o CRE~KS AT WHICH 50 Fr. MI"I!MUM O!STANCE TO TUNNEL CE"ITERLlt-I£ OCcuRS
j h-~~H~~:~~~~~~~il~~~~;l=;~,~.~ TO 1.5 H.
\< ... \
VERT!CAL;
$tIGHTLY Ta MOO(~TEl' AA"IllRC[(111S c-.~. F\RGIlllIC[OVS lflT£FtS tt ... TO l. 0 ~,. TOOle.> CiJI"I'RIS( LESs T_50101 ROCK; 1oI1A~lrN£UNITP.2'
SCALES lFEEl)
10C ICO ZCC JOO <00 ...........-HOAr ZONTAL: IC;;~o;O=.s0=~iO~0::::OO;"."2::::00,,,0;;;0;;;;;;;J;;OO,,0::::0 "",';:;;COCO
v V 17
U. S. DEPFFl:Tt>£NT a: E~RG'I'
SuPERCDNDUCTING SUPER CDLL IDER
FIGU RE 2·2 TUNNEL PRDFfLE
JR'I(. CO!cTIW"CTO[_RCOZ_II'5[It"lolJO f'S'tO-ECT r..!Z?
~CR'III[1\Ii no-IS _!0I'IT£lDflJ!'3_(:'ZI)4r€!.S>-IF.:CT
13

3.0 INVESTIGATION RESULTS
3.1 HYDRAULIC CONDUCTIVITY TESTING RESULTS
• Hydraulic conductivity
• Conservative estimate
wp.V9IIN1IGEo.ssc
Hydraulic conductivities based on packer tests are listed In Table 3-1 . The table also lists the ground surface and water-level elevation, test interval elevation, formation tested, and whether the tested interval was fractured. Hydraulic conductivity values were calculated using the methodology presented in Earth Mama!: A Water Resources Technical publication (U.S. Department of the Interior, 1974).
Static water level or hydraulic head for the test zone is one of the input data needed to calculate the hydraulic conductivity. For wells that appear to have equDibrated, the measured water level was used. For packer tests in observation wells in which the water level had not recovered to static conditions, the static water level was estimated based on one of two methods:
• Using the regression analysis results presented in Section 3.3, or
• Comparing the ground surface elevation and bedrock lithology at the well site with a nearby well in which the water level appears to have stabilized.
The same methods were used to estimate hydraulic head in borings in which packer tests were run but no well was constructed. The regression analysis method of estimating the likely static water level was used for shaft location wells (BE 1-90, BE 3, BE 4, BF 4, BE 6, BE 7A, BF 7, and BE 9) for which there were no nearby wells from which a static water-level estimate could be extrapolated. This was considered the best method of water-level estimation based on the data available; however, although analysis indicated a high correlation between static water-level and ground-surface elevation, values calculated using the regression analysis may be ± 50 feet or more from the actual static level. This level of uncertainty corresponds to an uncertainty in hydraulic conductivity of about one-half an order of magnitude.
The water level In some of the wells assessed using the regreSSion analysis is currently 100 to 150 feet below the estimated value and rising slowly. If the actual static water level is substantially below the estimated leVel, the hydraulic conductIVIty calculated from the packer test data would be lower. Additionally, the upper bounding limit of the test condition was used In the calculation of hydraulic conductivity; that is, the highest gauge pressure used for each test. The highest applied pressure from each three-step test was used to calculate hydraulic conductivity because the step tests Indicated that the formations were not fractured during testing. Therefore, the hydralJic conductivity values presented In Table 3-1 are generally expected to be conservative, or greater than actual conditions In the test Interval.
14

sse HydrofTABI.£ 4.1
TABLE 3-1. PACKER TEST DATA Page 1 of 3

sse HydrofTABL£ 4.1
TABLE 3-1. PACKER TEST DATA Page 2 of 3

TABLE 3-1. PACKER TEST DATA Page 3 of 3
BORING NUMBER
ELEVATION OF PA.CKER TEST
RV
* Water level estimated based on nearby wells, surface topography, and lithology.
* * Water level estimated using regression analysis presented in Section 4 for wells that have not stabilized.
* • * No data available.
t Geotechnical Report Number (see list of references for report titles).
sse HydretlTABlE 4.1

• Cumulative results
• Vertical distribution
• Areal distribution
All results from tests in which the calculated hydraulic conductivity is less than 10.7 Cm/sec (3 x 10'" ft/day) were obtained from tests in which the volume of water, if any, forced into the formation was smaller than the accuracy of test measurements. These hydraulic conductivity values were calculated based on the smallest amount of water that could be measured during a test (about 0.01 gaUon). Again, the actual formation conductivity may be lower.
Hydraulic conductivity values from packer tests are plotted as cumulative percentages of the total set of results in Figure 3-1. As depicted, values from packer tests during which some measurable amount of water was forced into the formation in the test interval (greater than 1.7 x 10.7 cm/sec [4.8 x 10'" ft/day)) have a relatively straight line distribution in semUog format. This suggests a normally distributed, statistical~ well-behaved data set. The median conductivity of the tests is 2 x 10' cm/sec (6 x 10'" ft/day); fully half of the tests were in intervals with conductivity lower than this and therefore too low to measure. The conductivity of the median of plus one standard deviation is 5.5 x 10⁻⁶ cm/sec (1.6 x 10.2 ft/day). The median hydraulic conductivity value obtained from packer tests in fault investigation borings (see Table 3-1) is significantly higher than the median of all values. The median conductivity is fault investigation borings is 3.5 x 10⁻⁶ cm/sec (9.9 x 10⁻³ ft/day).
To determine whether there Is a correlation between the hydraulic conductivity and depth below surface, or fractured versus unfractured rock, the data were plotted as shown in Figure 3-2. There appears to be no clear differentiation of hydraulic conductivity on the basis of formation, fractured or unfractured rock, or depth from the ground surface. Conductivities were also plotted against wireline stratigraphic units in Figure 3-3 (this plot is independent of test interval depth). There appears to be no obvious relationship between hydraulic conductivity and wireline stratigraphic units in the Austin Chalk.
Hydraulic conductivities are shown in areal distribution in Figure 3-4 (in map pocket). All values greater than 10.5 cm/sec (about 3 x 10.2 ft/day) order of magnitude are in the western one-third of the tunnel alignment. However, the significance of this relationship is speculative because two-thirds of the tests were located in this region. Aside from this possible correlation, the figure shows that values frequently vary by one order of magnitude and occasionally by two orders of magnitude within the same boring, and vary from boring to boring with no clear pattern.
3.2 SLUG TESTING RESULTS
• Comparison with slug-withdrawal tests
wp.V88N11GEO-SSC
Packer-test-derlved hydraulic conductivity values are compared with values obtained from recovery tests in Table 3-2. Recovery test conductivities were calculated using the methodology developed by BOlNier and Rice (1976) for all wells except BF3. The equation developed by HVorslev, 1951 (Freeze and Cherry, 1979). was used to evaluate test data for BF3 because of the clearly confined hydrologic condition. Water-level recovery 1 hour after cessation of baling was used to calculate hydraulic conductivity beCause of the very low recovery rates in most wells. Recovery tests are generally considered to be less accurate than packer tests because only a short time interval at the outset of water-level recovery can be used and the recovery level during this period is subject to inhomogeneities in the formation.
18

FIGURE 3-1. CUMULATIVE PERCENT OF HYDRAULIC CONDUCTIVITY OBSERVATIONS
Hydraulic Conductivity (Wday) 10-1 10-2 10-3
80 ." ."
." ."
." U) ." Q) ." ::» ." 1i > - 60 0 ... ." C ." Q)
.... u ... co Q) Q. Q) > i 40 ::» E ::» 0 For these packer tests the
amount of water taken into the formation was below
20 measurement accuracy. The plotted values therefore
Md+1<J 0 are maximums; actual
hydraulic conductivity is lower.
10-4 10-5 10-6
Hydraulic Conductivity (cm/sec)

AGUFE 3-2. HYDRAULIC CONDUClMlY VALUES BY DEP1lI BELOW GROUND SURFACE
o . ,
, eo 'I 100
i ! J l '&
I s
I
, Ieoo "I
j ! J l '&
I s
I
200
300
400 10~
o
100
200
3D(]
Unlracturad Test Interval
•
Fractured Test Interval
Geologic Formations: • Taylor Marl
•
,
• •
• Taylor MarVAustin Chait Contaot
Hydraulic Oonduc:tlvity (ItIday) 10-2 10~ .
• • • •
• •• •
• • •
•
10-6 10~
10~
• • • • • • • •• • • ~ • 0 • • • 0
O~)
• • •
10-6 10~ HydrauHc Conductivity (cmJsec)
• Austin Ohalt • Austin Ohalk/Eagle Ford Shale Contecrl
Note: Packer Test intervals are about 20 feet. 20
10-4 -,
• •
Ie • • ,... • • til • •
•
-,
• • , • • • • • • .0. •
o Eagle Ford Shale

FIGURE 3-3. HYDRAULIC CONDUCTIVIlY VALUES BY STRATIGRAPHIC UNIT
Hydraulic Conductivity (lflday)
100 10-1 10-2 10-3 10-4 I 0 0 I 1 --'---'- -~ _I I.. • . I 00 .
T23 Taylor Marl ;1"\ ...0 Oa
0 • -v 0 • • A15 • •• •
II A18 c -::;) A17 oS! .c A 18 • Co
! A19 = i A20 • .. 0 • Austin '" D) .... • Chalk III 0 .5 • ! A21 • 0 0
i A22 0
A23 0 -A24 v • .... A25 - in -<'I • .. ...,
~ A28 .... u • 0 A27 n~ n • ~-.. i- ,.. 0- "'" • Eagle Ford E20 Shale
1 0 0 1 I , 10~ 10 .... 10-6 10..fl 10-7
Explanation Hydraulic Conductivity 0 Unfractured (cm/Sec)
• Fractured
Note: Only packer test data are depicted.

TABLE 3-2. COMPARISON OF TEST METHOD RESULTS
SCREENED SCREENED PACKER TEST PACKER TEST
sse HydrolTable 4.2

However. well-recovery tests do provide an indication of the average hydraulic conductivity of the saturated interval above the screened interval. Table 3-2 shows that the values obtained from the different methods are in general agreement (a low permeability is indicated). Calculated values are generally within an order of magnitude in all but two wells. These differences are roughly within the test measurement accuracy. The measured values vary by about two orders of magnitude in wells BE 6 and BF 9. The reason for the difference Is not clear. As the bail test values are lower than the packer test values in both wells. it is probable that grout sealing is not the reason for these differences. As stated above. the packer test results are believed to be more representative of site conditions.
3.3 WATER- LEVEL MONITORING RESULTS
• Static water level
• Regression analYSis
wp.V96Nl/GEo-SSC
Wells in which water levels appear to have reached equilibrium were identified from measurements made to date. The groundwater level ranges from 55 feet below the ground surface to 15 feet above the ground surface in these wells. A plot of ground-surface elevation versus elevation of static water level in these wells is shown in Figure 3-5. There is a very high correlation (correlation coefficient = 0.99) between the ground-surface elevation and the elevation of apparent static water level in wells. The majority of the data in this plot are from wells screened in Austin Chalk; however, several wells are screened across the contacts with Taylor Mart and Eagle Ford Shale, suggesting that all three geologic formations are saturated below a ground-water level that closely mimics the ground surface topography. Data also indicate that regional ground water flow in these units is generally to the southeast, similar to the deep aquifers. No data are available for the upper portion of the Taylor Mart.
A linear regression equation was developed based on the relatively high correlation shown in Figure 3-5. The regression equation Is:
y = 0.97 x +5.3 where: x = land surface elevation in feet
y = predicted water-level elevation in feet
The regression was then used to estimate the likely static water levels in wells BE 1-90, BE 3, BE 4, BF 4, BE 6, BE 7A. and BF 7, in which water level does not appear to have equlibrated. These estimated water levels were used in the calculations of hydraulic conductivity presented in Sections 3.1 and 3.2.
For comparison, Figure 3-5 also shows water levels in wells in which the level was continuing to raise as of the last measurement. It can be seen that the water level in many of the recovering wells is at or near the regression line, Indicating that they are likely to be near equlibrium. Figure 3-5 also shows that the water level in all three of the wells screened in the Eagle Ford Shale are still significantly below the regreSSion line. BE 1 A was the first to be completed, suggesting that water level recovery in the Eagle Ford Shale Is much slower than the Austin Chalk, or that the hydraulic head is lower in this formation.
23

--Q)
~ c: .2 C6 > Q)
LD Q) > Q)
..J ~ Q)
C6 3:
FIGURE 3-5. WATER-LEVEL ELEVATION VERSUS LAND SURFACE ELEVATION
800-r----------------------------------------------------------~
700
600
500
400
300
Linear regression y = 0.97x + 5.3 Correlation coeficient r =0.99
0 0
0 0
0
0 0
0
0 0
200-r----r----.----.---_r--~r_--_r----r_--_.--~----,_--~r_~
200 300 400
Static Water Levels
• Taylor Marl/Austin Chalk
• Austin Chalk
• Austin Chalk/Eagle Ford Shale
• Eagle Ford Shale
500 600 Land Surface Elevation (feet)
Recovering Water Levels
o Taylor Marl/Austin Chalk
o Austin Chalk
700
b. Austin Chalk/Eagle Ford Shale
o Eagle Ford Shale
Note: Water-level measurements used to evaluate static versus recovering condition are presented in Appendix B.
24
800

4.0 SUMMARY
wp.llll8Nl/GEO-SSC
The following is a summary of conditions encountered:
• The groundwater level ranges from 40 feet below to 30 feet above the ground surface in wells that appear to have reached static conditions, except in well BE1A, in which the water level is 91 feet below the ground surface.
• Static groundwater level conditions cannot be estimated with a high degree of accuracy for the Taylor Marl and Eagle Ford Shale formations with the present data.
• Water-level recovery rates in bailed wells ranged from 1 foot (BFa) to 55 feet (BF9) in the first 4 hours after bailing.
• The Austin Chalk and Eagle Ford Shale formations appear to be saturated. At least the base of the Taylor Marl appears saturated.
• Hydraulic conductivity in the tested intervals ranged from 3.5 x 10 -5 cm/sec (9.9 x 10⁻² ft/day) to less than 1.2 x 10⁻⁸ cm/sec (3.4 x 10⁻⁵ ft/day). The median value is 2.0 x 10⁻⁷
cm/sec (5.7 x 10'" ft/day).
• The hydraulic conductivity determined from packer tests appear to be representative of the range of actual conditions, although only a very limited number of tests were done in the Taylor Marl and Eagle Ford Shale formations.
• The median of hydraulic conductivity values obtained from packer tests in fault Investigation borings is 3.5 x 10⁻⁶ cm/sec (9.9 x 10⁻³ ft/day), which is significantly higher than the median of all values.
• Hydraulic conductivity values cannot be clearly correlated (except as noted above) with
fractured versus unfractured test intervals formation tested layers within the Austin Chalk test Interval depth areal distribution.
25

5.0 REFERENCES
OPEN UTERATURE
Bouwer, H. and Rice, A.C, 1976. A Slug Test for Determining Hydraulic Conductivity of Unconfined Aquifers with Completely or Partially Penetrating Wells, Water Resources Research, Volume 12, June.
Espey, Houston and Associates, Inc., 1989. Regional Water Study for Ems County arxJ Southern Dallas County, Trinity River Authority of Texas in Conjunction with the Texas Water Development Board, September.
Freeze, A.A. and J.A., Cherry, 1979. Groundwater, Prentice-Hall, Englewood, N.J.
Texas National Research Laboratory Commission, 1987. E nyiron mental Information Document for the Dallas-Fort Worth Superconducting Super Colljder Site. Water. Texas National Research Laboratory Commission, Dallas, Texas.
Texas Natural Resources Information System, (undated). Texas Water Development Board Water Leyel Observation Well Repqrt.Texas Natural Resources Information System, Austin, Texas.
Thompson, G.L, 1967. Ground-Water Resources of Ellis County. Texas Report No. 62, Texas Water Development Board.
William F. Guyton Associates, Inc., 1987. Letter Memorandom on AvaBabUIty of Ground Water for Proposed Superconducting Super CoIlider FacUity Near Waxahachie, Texas, prepared for The Natural Research Laboratory Commission, Austin, Texas, June.
U.S. Department of the Interior, 1974. Earth Manual: A Water Resources Technical publication. 2nd Edition, United States Government Printing Office, Washington.
SSC GEOTECHNICAL REPORTS
GR-16 GR-2O GR-21 GR-23 GR-26
GR-27 GR-28 GR-29 GR-30 GR-31 GR-32 GR-33
GR-34
GR-35 GR-36 GR-37
GR-38
GR-39 GR-40
wp.\llMlN11G~
Data Report for Structure Study Zone SE 1 and Angled Corehole SE 1, 1989 Data Report for Corehole BK1', 1990 Data Report for Corehole BE 1 and Monitoring Well BE 1 A, 1990 Superconducting Super CoIlider Site Reference Stratigraphic Column, 1990 Data Report for Interaction Region 8 and Coreholes BIR 81, BIR 82, BlR 83 and BlR 84,1990 Data Report for Corehole BF 9, 1990 Data Report for Corehole BE 7 A, 1990 Data Report for Corehole BF 8, 1990 Data Report for Corehole BE 8, 1990 Data Report for Corehole BE 10, 1990 Data Report for Corehole SE 1.8, 1990 Data Report for Interaction Region 5 and Coreholes BI R 51, BI R 52, BI R 53 and BIR 54,1990 Data Report for Interaction Region 4 and Coreholes BIR 41, BIR 42, BIR 43, BIR 44, and BIR 45,1990 Data Report for Interaction Region 3 and Coreholes BIR 31, BIR 32 and BIR 33,1990 Data Report for Interaction Region 2 and Coreholes BIR 21, BIR 22 and BIR 23,1990 Data Report for Interaction Region 1 and Coreholes BIR 11, BIR 12, BIR 13, and BIR 14,1990 Data Report for Marker Bentonite Coreholes B 1296, B 1316, B 2052, and B 2062, 1990 Data Report for Corehole BE 1-90, 1990 Data Report for Corehole BE 5, 1990
26
GR-41 GR-42 GR-43 GR-44 GR-45 GR-46 GR-47 GR-48 GR-49 GR-SO
GR-51 GR-53 GR-54
GR-55
GR-58
GR-59
GR~
GR-61
GR-64
wp.Vll8N1iGEO-SSC
Data Report for Corehole BF 6, 1990 Data Report for Corehole BE 9, 1990 Data Report for Corehole BF 7, 1990 Data Report for Corehole BF 2, 1990 Data Report for Corehole BE 4, 1990 Data Report for Corehole BF 1, 1990 Data Report for Corehole BF 3,1990 Data Report for Corehole BE 6, 1990 Data Report for Corehole BE 2,1990 Data Report for High Energy Booster and Coreholes BI 1, BI 2A, BI 3, BI 4, BI 5, BI 6, B 1527, B 1533, and B 1540,1990 Data Report for Corehole BE 3, 1990 Data Report for Corehole BF 4, 1990 Data Report for Structure Zone SF 10.1, Air Rotary Boreholes SF 10.1 A, SF 10.1 B, and Corehole SF 10.1 C, 1990 . Data Report for Structure Zone SIR 3, Air Rotary Borehole SIR 3A, and Corehole SIR 3B, 1990 Data Report for Tunnel Intercept with Taylor Marl/Austin Chalk - Coreholes B 802, and B 2758, 1990 Data Report for Structure Study Zone SE 10.9, and Coreholes SE 10.9C and SE 10.90, 1990 Data Report for Structure Study Zone SI 2, Air Rotary Boreholes SI 2A, SI 2B, and Corehole SI 2C, 1990 Data Report for Structure Study Zone SE 5.2, Air Rotary Boreholes SE 5.2A, SE 5.2B, SE 5.2C, SE 5.20, and Corehole SE 5.2E, 1990 Groundwater Monitoring Wells at the Superconducting Super CoIlider Site May 1989 to May 1990,1990.
27

APPENDIX A
MONITORING WELL
AS-BUILT DIAGRAMS

Locking Cover -------l~----l
Cap-----------~~
Concrete Pad ---,
2-lnch Schedule SO ...... . PVC Pipe -------+ . ...,.:: ..... ~.:
....... 7 7/S-lnch Hole - __ ~ ....... . ....... ....... .......
Cement - Bentonite Grout _____ ::::<
PVC Screen with
........ ....... ....... ....... ....... ....... .......
0.010-lnch Slots -----4...::.:..;:,.-
Bentonite Plug ~
Sand~
. ..... . . .....
. ..... . . ...... . ........ ........ ....... . ..... . ..... .
. ..... . . ..... . . ...... . ....... . ..... .
Total Depth: 265.0 Feet: ___ ~s:.::::E:='iili.:.~
Boring: BIR 11 Location: N 239,029
E 2,175,454 Oate(s) Installed: 9/19-9/20189 Well Construction SUpervising Geologist: Shawn Wood Approved By: Shawn Wood
NOT TO SCALE
Date: 5/18190
672.2 MSL
5-4" stainless steel centraliZers spaced 40'-50' apart between 670.2 and 425.2
5190
470.2 MSL
467.2 MSL
465.2 MSL
458.2 MSL Austin Chalk
445.2 MSL
443.2 MSL
440.2 MSL
405.2 MSL
Eagle Ford Shale
Note: All the backfill materials (sand, bentonite pellets and cemenU bentonite slurry) were placed by tremie.
"As Built" Well Construction Diagram
Monitoring Well No. BIR 11
Figure Al

Locking Cover ------... ~ Cap----------------~~I
1.0---......
Concrete Pad ----,
2-lnch Schedule 80 PVC Pipe ------------f-.. :I. ~., .......
7 7/8-lnch Hole --.. -f ...... . ....... ....... ....... ....... ....... Cement - Bentonite Grout ~ :.-.:.-.:.
PVC Screen with
........ ....... ....... :".: ".: ....... ....... .......
0.010-lnch Slots -----~~..e
Bentonite Plug --......
. ..... . ....... . ..... . ...... . . ...... . . ...... . . ..... . ....... . ..... . . ..... . . ..... . ........ . ..... . .......
NOT TO SCALE
Boring: BIR 21 Location: N 238,620
E 2,175,708 Data(s) Installed: 9/21/89 Well Construction Supervising Geologist: Ron Randall Approved By: Shawn Wood Date: 5/18190
667.1 MSL
665.3 MSL
Austin Chalk
7_4W stainless steel centralizers spaced 40'-50' apart between 665.3 and 352.5
472.3 MSL
468.3 MSL
462.8 MSL
452.7 MSL Austin Chalk Eagle Ford Shale
442.8 MSL
439.1 MSL
436.8 MSL
352.5 MSL
Note: All the backfill materials (sand, bentonite pellets and cement! bentonite slurry) were placed by tremie.
"As Built" Well Construction Diagram
Monitoring Well No. BIR 21
Figure A2

Locking Cover ------... r----, Cap-----------------___ I
Concrete Pad --....,
2-lnch Schedule 80 ....... PVC Pipe --------4;;...: ...... Iio-I.:: .......
7 7/8-lnch Hole-~-4······· ....... ....... ....... ....... Cement - Bentonite Grout ~ ::::::::::
PVC Screen with
....... ....... ....... ....... ....... ....... .......
0.010-lnch Slots -------f:~,..
Bentonite Plug ~
....... . ..... . . ..... . . ...... . . ...... . ........ ...... . ..... . ..... . . ..... . . ..... . . ..... . . ..... . .....
620.2 MSL
617.5 MSL
Austin Chalk
6-4" stainless steel centralizers spaced 40'-50' apart between 617.5 and 322.5
475.0 MSL
471.0 MSL
462.5 MSL
452.5 MSL Austin Chalk Eagle Ford Shale
442.5 MSL
440.5 MSL
436.5 MSL
Total Depth: 295.0 Feet[ __ ~s;::.:.~=~~ ____ 3_22:::......5-.:.;.;M.,:;.S.::.-L
Note: All the backfill materials (sand, bentonite pellets and cement! bentonite slurry) were placed by tremie.
Boring: BIR 31 Location: N 232,079
E 2,178,422 Date(s) Instalied: 9128-9/29189 Well Construction Supervising Geologist: E.C. Nicholas Approved By: Shawn Wood
NOT TO SCALE
Date: 5118190 5t9O
"As Built" Well Construction Diagram
Monitoring Well No. BIR 31
Figure A3

Locking Cover ------II~----,
Cap---------------~'_I
Concrete Pad ---.
2-lnch Schedule 80 ...... . PVC Pipe --------+-.. ;.,t. ~ ••• ;.;.J.
0" 00 ....... 7 7/8-lnch Hole - ..... 0-# .••••••• ....... ....... ....... .......
Cement - Bentonite Grout ~ ::::::::::
PVC Screen with
....... ....... : "0: eo: ....... : ".:".: :".:".: .......
0.010-lnch Slots -----4.;:,:;.;;.-
Bentonite Plug _____
Sand _____
. ..... . . ...... . ":".: " . . ..... . -:".: "'. . ..... . ':"0:"' . . ...... . . ...... . ........ ....... .:".:-. -:".:". ....... -:"0:-'. ........ .:"0:" .. . ..... .
621.3 MSL
Austin Chalk
5-4" stainless steel centralizers spaced 40'-50' apart between 618.7 and 392.7
458.7 MSL
455.7 MSL
453.7 MSL
443.7 MSL Austin Chalk Eagle Ford Shale
433.7 MSL
431.7 MSL
428.3 MSL
Total Depth: 226.0 Feet[ __ ~s,:..;:.~=;;Z.:;;~ 392.7 MSL ------~~~~~
Note: All the backfill materials (sand, bentonite pellets and cemenV bentonite slurry) were placed by tremie.
Boring: BIR 41 Location: N 231,388
E 2,178,618 Date(s) Installad: 9/28-9/29189 Well Construction Supervising Geologist: Shawn Wood Approved By: Shawn Wood
NOT TO SCALE
Date: 5118190 5190
"As Built" Well Construction Diagram
Monitoring Well No. BIR 41
FigureA4

Locking Cover ------... ..r------, Cap------------------~~
"r--~
Concrete Pad ----,
2-lnch Schedule 80 ....... .......
442.2 MSL
423.3 MSL Soil PVC Pipe --------~.:~: ..... :~: ..... .. ,'1----------:;::--:---:-:---:--
Taylor Marl ....... ....... ....... 7 7/8-lnch Hole -~-I, ... ... . . ..... . ....... ....... ....... . ..... ....... . ...... . ....... . ...... . ....... . ...... .
Cement - Bentonite Grout _____ :.-.:.-.: ...... .
PVC Screen with
........ . ..... . ....... . ..... . ....... . ..... . ....... . ..... . ....... . ..... . ....... ....... . ..... . .......
0.01 O-Inch Slots --------~~ ..
Bentonite Plug ~
Total Depth: 421.0 Feet
Boring: BIR 54 Location: N 265,911
E 2,250,528 Date(s) Installed: 10110-10/11/90 Well Construction Supervising Geologist: Ron Randall Approved By: Shawn Wood
NOT TO SCALE
Date: 5/21/90
8-4" stainless steel centralizers spaced 40'-50' apart between 440.3 and 19.3
273.3 MSL
270.3 MSL
264.3 MSL
253.3 MSL Ta lor Marl Austin Chalk
244.3 MSL
241.3 MSL
238.3 MSL
19.3 MSL
Note: All the backfill materials (sand. bentonite pellets and cement! bentonite slurry) were placed by tremie.
"As Built" Well Construction Diagram
Monitoring Well No. BIR 54
Figure AS

Locking Cover ------.r----, Cap------------------__ ~
Concrete Pad --..,
2-lnch Schedule BO ....... PVC Pipe ------------~.:.;., ........... .
• °0 0° ....... 7 7lB-lnch Hole - .... .., ...... .
: -.:0°: ....... : 0.:".: : ".:0.:
Cement - Bentonite Grout ~ ~:::::::: ........ :".:".: ....... ....... ....... ....... .......
PVC Screen with 0.010-lnch Slots -------f::.:,:..;ME
Bentonite Plug ~
Total Depth: 405.0 Feet
. .....
......
. ..... ........ .: -.:00: ........ ...... . ..... ...... . ..... . . ..... . ...... . . ..... . . .....
NOT TO SCALE
Boring: BIR 81 Location: N 273,893
E 2,247,359 Date(s) Installed: 1214-1215190 Well Construction Supervising Geologist: Mike Granger Approved By: Shawn Wood Dete: 5121190
454.0 MSL
5-4" stainless steel centralizers spaced 40'-50' apart between 452.2 and 47.2
326.2 MSL
324.2 MSL
322.2 MSL
311.B MSL Ta lor Marl Austin Chalk
302.2 MSL
300.2 MSL
29B.2 MSL
47.2 MSL
Note: All the backfill materials (sand, bentonite pellets and cement! bentonite slurry) were placed by tremie.
5190
"As Built" Well Construction Diagram
Monitoring Well No. BIR 81
FigureA6

Locking Cover -------1~---1 Cap-----------_____ ~~I
"r----T'
Concrete Pad ----,
2-lnch Schedule 80 0" ••••
PVC Pipe -------~ ..•. "'='I .• .......
6.75-lnch Hole ...... . ....... ....... : "0: 0.: : .... -.: .......
Cement - Bentonite Grout ~ :.-.:.-.: : "0:"': :".:".: :".:".: ....... : ".: ".: ....... .......
:.:.::.:::.".
PVC Screen with 0.010-lnch Slots ------~'!!IIt§
. ..... . ...... . ..... . . ...... . ........ ":".: ".: ...... ....... ...... ....... ...... . ..... . ....... .......
Sand ~ : ..... : .. : .. :. - - - ..... \.:: .. :.
{i.ii~tf1%i0 PVC Tip
Bentonite Plug ----9~i.8.~r·
Sand ---.. ~ ~~*~%.
Bentonite Plug ..
4.75-lnch Core Hole --........... Total Depth: 211.0 Feet. _____ -....",..--
Boring: BI1 Location: N 251,717
E 2,171,756 Data(s) Installed: 1212190 Well Construction
NOT TO SCALE
Supervising Geologl8t: David Hartsfield Approved By: Shawn Wood Date: 5/14190
744.0 MSL
4-2" stainless steel centralizers spaced 40'-50' apart between 741.4 and 551.4
581.4 MSL
576.4 MSL
571.4 MSL
558.4 MSL Austin Chalk Eagle Ford Shale
551.4 MSL
549.4 MSL
546.4 MSL
540.4 MSL
Note: All the backfill materials (sand, 530.4 MSL bentonite pellets and cement! bentonite
slurry) were placed by tremie.
"As Built" Well Construction Diagram
MonitOring Well No. BI1
FigureA7

Locking Cover ------... r----, Cap-----------------~~I
Lw---~
642.1 MSL
........ ........ . ....... 1-----==:...:.:.:=----:=:...----2-lnch Schedule 40 : .. : .. : .......
,0" ••••
PVC Pipe --------~: .•.. Iio:-I.:
........ ....... ....... ....... 6.75-lnch Hole - .... --1 •...••• . ..... ....... . ..... .
:'0: '.: : '.: ".: : ',:',: .......
Cement - Bentonite Grout ~ : ... : .. :. :",:'0: :"0: 00: ....... : "0: "0: ....... :"0: "0: .......
PVC Screen with 0.010-lnch Slots ----------f..;;.;.:, ....
Sand - ....... PVCTIp--------------~~~~
....... ........ ........ ........ . ..... ...... ....... ....... . ..... . ........ . ..... . ......
Austin Chalk
597.5 MSL
594.2 MSL
590.2 MSL
570.2 MSL
Bentonite Plug ~·t8~~~m~ ___ .....:56~2~.6wM!!:S~L=-- 561.9 MSL
567.6 MSL
Sand --_ .. ~r.
3.125-lnch Core Hole---"~f Total Depth: 261.5 Feet. ___ _ - ........ -
Boring: BI 2A Location: N 256,267
E 2,179,204 Date(s) Installed: 12/6-12/7189 Well Construction Supervising Geologist: Scott Leslkar Approved By: W.O. Flanigan
NOT TO SCALE
Date: 5/15190
405.7 MSL Austin Chalk Eagle Ford Shale
Note: Placement depths of backfill materials (sand and bentonite pellets) were confirmed by manual measurement.
378.4 MSL Cement! bentonite slurry was placed by tremie.
SI90
MAs Built" Well Construction Diagram
Monitoring Well No.BI2A
Figure AS

Locking Cover ------......
cap---------------~._~I--~
Concrete Pad --..,
2-lnch Schedule 80 .... '.' 0° ••••
PVC Pipe ----------+:-: .. !'I. '!'1., ....... 6.75-lnch Hole -~"""'., ....... ....... .......
: -.:".: ....... Cement - Bentonite Grout~ :'-':"':'
PVC Screen with
........ ....... ....... ....... ....... ....... .......
0.01 O-Inch Slots ---------f-~ ..
PVC Tip--------~~~
....... ....... ":0°: "'. ....... ":"0:" .. . ...... . ":"0:".: -:".:".: ....... ....... . ..... . . ..... . . ..... . .:"0:"0 . -:-0:-00 .......
Bentonite Plug ---~~9~~~~"'"
sand--....... ~~I Bentonite Plug ----l~~m~gs~
Sand --... -rf.!t~~ Bentonite Plug ----l~~·tBm:~~
TotoJ ~~~~h 2~;:S= ---l:~ ~i~1 Boring: BI3 Location: N 246,179
E 2,180,466 Date(s) Installed: 1/12190 Well Construction Supervising Geologist: Mike Brown Approved By: Shawn Wood
NOT TO SCALE
Date: 5114190
698.9 MSL
691.7 MSL Soil Austin Chalk
2-2- stainless steel centralizers spaced 40'-50' apart between 696.7 and 600.7
625.7 MSL
622.7 MSL
620.7 MSL
600.7 MSL
598.7 MSL 595.7 MSL
587.7 MSL
585.7 MSL
547.7 MSL 543.7 MSL
435.2 MSL Austin Chalk Eagle Ford Shale Note: All the backfill materials (sand,
___ ---'-4"'_14~."'_7_M_S;;..;L_ bentonite pellets and cemenU bentonite
5190
slurry) were placed by tremie.
"As Built" Well Construction Diagram
Monitoring Well NO.BI3
FigureA9

Locking Cover ------..... r----, Cap------------------~~I
"'r---""""T"
Concrete Pad --....
2-lnch Schedule 80 .... '., 0° ••••
PVC Pipe -------+.-:,' .•.. "'='I.,' ....... 6.75-lnch Hole --.... --1: •. ,' .. ,' ....... .......
: 00: 00: ....... Cement - Bentonite Grout ____ :::::<
PVC Screen with
-:0.: -0: ....... :0°: 00: : "0: 00: ....... :"0:".: .......
0.01 O-Inch Slots -----"""'i~iINi
PVC Tlp---------f'~~~
....... ....... . ..... . . ...... . ........ . ...... .
.: ".:" . ....... ......
.: -.:". 0: ·0: -'. ........ . ..... . .......
713.8 MSL
5-2" stainless steel centralizers spaced 40'-50' apart between 710.9 and 550.0
575.9 MSL
572.9 MSL
570.0 MSL
550.0 MSL
___ ~;:l§~~~~~====~54~6~.4~M~S~L~-1A~u~~~in~~Cha~lk~~ Bentonite Plug. 544.9 MSL Eagle Ford Shale
547.9 MSL
Sand ..
Boring: BI4 Location: N 255,921
E 2,174,201 Date(s) Installed: 1/23/90 Well Construction Supervising Geologist: Dale Brown Approved By: Shawn Wood
NOT TO SCALE
Date: 5/14190
Note: 6.75" hole extends to elevation 543.90 feet.
541.9 MSL 539.9 MSL
5190
Note: All the backfill materials (sand, 526.4 MSL bentonite pellets and cemenV bentonite
slurry) were placed by tremie.
"As Built" Well Construction Diagram
Monitoring Well NO.BI4
Figure A10

Locking Cover ------.... ~ Cap--------------~~
Lr--~
Concrete Pad --..,
2-lnch Schedule 80 " ..... . ..... • 0- ••••
PVC Pipe ---------+'=': ..•. ~., . ...... . ....... ....... ....... 6.75-lnch Hole --..... ~ ...... . . ..... . ....... ...... ....... . ..... .
: ".:0°: .. "0.°0. ....... . ...... . ....... . ...... . Cement - Bentonite Grout ~ :"';":' .......
PVC Screen with
....... ....... ....... ....... :"0:".: ....... .......
....... . ..... . . ..... . . ..... . ':-0: 0.: . ..... . ..... .
0.010-lnch Slots --------~..;IfE
PVC Tip Sand~········--- ...... .
{iii.t~fJ~
662.0 MSL
5-2" stainless steel centralizers spaced 40'-50' apart between 658.4 and 550.4
573.4 MSL
572.4 MSL
570.4 MSL
550.4 MSL
548.4 MSL 545.4 MSL
Note: 6.75" hole extends to elevation 546.4 ft. Bentonite Plug -----~9~~~r-
Sand---~~~~J?~~J \
Bentonite Plug ---"~~1~~~3 Alternating layers of ± 10 linear feet
Sand ---~twJf.$.f 402.81ASL Au.t. ~:!n:n~~!n .. ~~~ a~d 378.4
Tmal~:;~~ ~1 ~~~~~:::'I;~~~~~~l~~3.~~~~~ ----........;:!.:37::!:8:.:.:.4:...:.::M:=/:.'::L~Er~~:~~~t;R;~~;dtS~;tj:aiE~~dm~:~~ 1:.~~~~it9 Boring: BI5 Location: N 251~
E 2,182,381 Date(s) Installed: 1130/90 Well ConstRIction Supervising Geologist: Dale Brown Approved By: Shawn Wood
NOT TO SCALE
Date: 5/15190 5190
slurry) were placed by tremie.
"As Built" Well Construction Diagram
Monitoring Well NO.SI5
Figure A11

Locking Cover ------.r----, Cap------------~~I
"'r---r'
Concrete Pad ---.
2-lnch Schedule 80 ...... PVC Pipe -------~~~
........ ....... ...... 6.75-lnch Hole - .... --1, ......
....... ....... . ..... . ....... . ...... . ....... .: "':": ....... . ...... .
Cement - Bentonite Grout~ :.-.:.-.:. . ..... .
PVC Screen with
........ . ..... ....... . ..... . ....... . ..... . ....... . ..... . ....... . ...... . ....... ....... ....... .......
0.010-lnch Slots -----~~1Mi
PVC Tip--------~ .. ~
Bentonite Plug --.... ~9~SE~:r-Sand --... ~.:{:{:}:::~:~~::{
735.7 MSL
4-2" stainless steel centralizers spaced 40'-50' apart between 734.15 and 503.15
580.1 MSL
576.1 MSL
572.1 MSL
552.1 MSL
548.1 MSL 544.1 MSL
534.1 MSL 532.1 MSL Bentonite Plug --.... ~~I~~~~
Sand ---~~.r.·:~~~~}}~~{~t 523.1 MSL Austin Chalk Bentonite Plug --.... ~~I~~~r-====5~2~1~.1~M~S~L='E~a~g~leilFRo~rddSSa;hi8alle
Sand--.... ~~[)1.~*~tt Bentonite Plug --.... ~~I~~~~
TOlal::~~2~:= : ft.l~1 Boring: BI 6 Location: N 245,951
E 2,174,687 Data(s) Installed: 1/24190 Well Construction Supervising Geologist: Mike Granger
NOT TO SCALE
Approved By: Shawn Wood Date: 5/15/90
513.1 MSL 511.1 MSL
503.1 MSL
5190
Note: All the backfill materials (sand, bentonite pellets and cement! bentonite slurry) were placed by tremie.
MAs BuiW Well Construction Diagram
Monitoring Well NO.BI6
FigureA12

Locking Cover ------... ,r---i Cap------------------__ ~
1.0-----' Concrete Pad ----.....
2-lnch Schedule 80 ...... . PVC Pipe ----------+.":'::: ... ~ .. :
....... 6.75-lnch Hole ...... .
." '.: '.: :'.: '.: ....... :'.: '.:
. ..... . ........ ....... . ..... .
. ..... . .......
.: '.: " . . ...... .
.: '.: '.:
681.3 MSL
........ 573.0 MSL Austin Chalk ....... I-----=...:.=:...:.:.:=---=.=:.:.:.:..:.-=..:.:=~-.......
Cement - Bentonite Grout ~ :"':"':'
PVC Screen with
....... ....... ....... ....... ....... :'.: '.: .......
0.010-lnch Slots -----.....(0..;.:..:..,.;
PVCTIp--------------~~~~
. ..... . ..... . . ..... . . ..... . : '.;'" ....... . ..... .
Total Depth: 140.0 Feet. ___ ... ~.;:.:.;.:.~~~
Boring: BE 1A Location: N 261,647
E 2,172,257 Date(s) Installed: 611/89 Well Construction Supervising Geologist: Judy Hamilton
NOT TO SCALE
ApprOVed By: W.D. flanigan Date: 5115190
556.2 MSL
553.1 MSL
550.0 MSL
540.0 MSL
539.0 MSL
Eagle Ford Shale
Note: 1) Observation Well Installed in Boring offset 10' West of BE 1 location. 2) Placement depths of backfill materials were confirmed by manual measurement. Cement! bentonite slurry was placed by tremie.
"As Built" Well Construction Diagram
Monitoring Well No. BE 1A
5190 FigureA13

Locking Cover -------1~---1
Cap----------------~._I i.r--"""" Concrete Pad --..,
2·lnch Schedule 80 ....... .0 ••••
PVC Pipe ---------t'!-i ..•. ~ .. .0.: "0:
6.75·lnch Hole --..... ~: .. : .. : ....... : "0: 00: ....... : eo: -0: .......
Cement· Bentonite Grout ~ :. -.:.-.:.
....... ....... . ..... . ........ . ...... . ........ .......
766.0 MSL
753.1 MSL Soil Austin Chalk
5·2" stainless steel centralizers spaced 40'·50' apart between 763.1 and 533.1
.:".:". : : "0: -0:
567.8 MSL Austin Chalk ....... J---~::.=..:..:...;:..;=::......:=-'""'-;"-'-::=:-~;:-::-;:: ....... Eag Ie Ford Shale
PVC Tip
....... :0.: -0: :",:".: ....... .......
....... . ..... . ........ ...... .......
Bentonite Plug ..
Boring: BE1-90 Location: N 253,843
E 2,171,122 Date(s) Installed: 2115190 Well Construction Supervising Geologist: Dale Brown Approved By: Shawn Wood
NOT TO SCALE
Date: 5111/90
558.1 MSL
555.1 MSL
553.1 MSL
533.1 MSL
531.1 MSL 527.1 MSL
\ AHemating layers of ± 10 linear feet of sand and .:t2 linear feet of bentonite between 527.1 and 505.7
Note: All the backfill materials (sand, 505.7 MSL bentonite pellets and cementl bentonite
slurry) were placed by tremie.
"As Built" Well Construction Diagram
Monitoring Well No. BE1-90
FigureA14

Locking Cover ------.... r----, Cap------------------__ ~I
Concrete Pad ---.
2-lnch Schedule 80 PVC Pipe --------..f"!":I~
6.75-lnch Hole -~.., :0°: 00: : ",:0,: :0°: '0: :'0: ":
.......
....... ....... ....... ....... ........ ': -':'0: ....... ,:'0:'0 .......
730.7 MSL
8-2" stainless steel centralizers spaced 40'-50' apart between 727.7 and 533.7
Cement - Bentonite Grout ~ :::::::::: :',:0.: :',:'.: :',:'.: : '0 : •••• ....... :::::::::.:t-___ ..::.58::;,.4.;,,:. . ..:..1 ~M.:.:S:.:L::.........:A~u:.:s:.:.:ti.;,,:.n-=C:.:.:h:.::a:.:.:lk:.....__
........ Eagle Ford Shale :'0: 00: -:"0: ", ....... . ..... .
PVC Screen with 0.010-lnch Slots ------f.:'.:..:;,:,.-
PVC Tip---------I~~~
Bentonite Plug ~ ~:m~~~~
Sand - Wi~¥.~fj Bentonite Plug ~ rg~~~~gs
Sand - f~1~i~~~~ Bentonite Plug ~
6.75-lnch Core Hole ~ t~~~i~~:~:f~}{~~:~~~~:f~~~~} Total Depth: 221.0 Feet .. \:::/~~(:\:~::\~::\.~.
Boring: BF 1 Location: N 267,430
E 2,171,093 Date(s) Installed: 3/16190 Well Construction Supervising Geologist: Alan Dover Approved By: Shawn Wood
NOT TO SCALE
Date: 614190
560.7 MSL
556.7 MSL
553.7 MSL
506.7 MSL
Alternating layers of sand and bentonite between 533.7 and 506.7
Note: All the backfill materials (sand, bentonite pellets and cement! bentonite slurry) were placed by tremie.
"As Built" Well Construction Diagram
Monitoring Well No. BF 1
5190 Figure A15

Locking Cover ------..... Cap-----------------~~
'T--"""T"'
Concrete Pad ---,
2-lnch Schedule 80 ....... " ... .
PVC Pipe -------------~.:_:t ..... ":'t. .......
6.75-lnch Hole --"'-1' ...... . ....... ....... ....... ....... ....... Cement - Bentonite Grout ~ :.-.:.-.:.
PVC Screen with
........ ....... ....... :":": ....... ....... .......
0.010-lnch Slots ----------t~W!!i
PVC Tip--------~~~!':.
....... . ...... .
. ..... .
....... . ..... . ...... . ..... . . ...... . . ...... . . ...... . . ..... . ....... . ..... . . ..... . . ..... . .......
. ..... . .......
Bentonite Plug --~~-=mm:~J-Sand --..... ~::::~::{::{;~::::{~
Bentonite Plug --...... ~l~~~~
Sand --~~~'f-.'~~~::~@~~~}~~ Bentonite Plug --~ .. ~~~5<'5(1
Sand----~~·[t*~~~~~~ Bentonite Plug ---~~~,~~~~
Toml~:~~h2~:S:; : I.~W~] Boring: BE 2 Location: N 281,050
E 2,175,700 Date(s) Installed: 1/4190 Well Construction Supervising Geologist: Mike Granger Approved By: Shawn Wood
NOT TO SCALE
Date: 5114190
675.7 MSL
674.1 MSL
~673.6 M~ '\~Oi~ '\ Austin Chalk
4_2W stainless steel centralizers spaced 40'-50' apart between 674.1 and 523.1
553.1 MSL
549.1 MSL
543.1 MSL 542.7 MSL Austin Chalk
523.1 MSL
520.1 MSL 517.1 MSL
508.1 MSL 505.1 MSL
494.1 MSL 492.1 MSL
485.1 MSL 483.1 MSL
463.1 MSL
Eagle Ford Shale
Note: All the backfill materials (sand, bentonite pellets and cement! bentonite slurry) were placed by tremie.
"As Built" Well Construction Diagram
Monitoring Well No. BE 2
Figure A16

Locking Cover ------... ..r---, Cap------------------__ ~I
'T--"""'T"
Concrete Pad ---..,
2-lnch Schedule 80 ....... 0° ••••
PVC Pipe ---------------e ..•. ~ .. ....... 6.75-lnch Hole ...... . ....... ....... .......
." "0: 00: Cement - Bentonite Grout~ ~::~::::
PVC Screen with
........ ....... ....... ....... : "0: -0: ....... .......
0.010-lnch Slots ---------t:~1Mi
PVC Tip-----------f~~~
....... . .... .
. ...... . ": 00: 00: ": 00: 00: ...... ...... . ..... -:".:" . ": -.:"0 . .: 00: -'. 0:".: "' . .......
684.5 MSL
4-2" stainless steel centralizers spaced 40'-50' apart between 683.1 and 500.1
527.1 MSL
524.1 MSL
520.1 MSL
500.1 MSL
Bentonite Plug --.... ~9~~as;:=-====4~9~5~.1~M~S~L~A~u~st~in~C~ha~l~k~ Eagle Ford Shale
498.1 MSL
Sand ----...... -t
Bentonite Plug --...... ~ .. Its~~~
Totaj ~~t~~ :a~=---... ~ .. tll Boring: BF2 Location: N 291,450
E 2,184,280 Date( s) Installed: 1/10-1/11/90 Well Construction Supervising Geologist: Mike Granger
NOT TO SCALE
ApprOVed By: Shawn Wood Date: 614190
486.1 MSL 483.1 MSL
Note: All the backfill materials (sand, 475.1 MSL bentonite pellets and cemenU bentonite
slurry) were placed by tremie.
"As Built" Well Construction Diagram
Monitoring Well No. BF 2
FigureA17

Locking Cover -----~~r---l
Cap----------------~~I "'r-----rI
2-lnch Schedule 40 PVC Pipe --------fo:,~
PVC Screen with
: ".: "0: ....... ....... ....... .......
0.010-lnch Slots -------f.~M
Sand-......... PVC Tip---------+~~~
...... . :"0:".: ........ ....... ....... ....... ...... ....... ':"':"' . . ..... . . ..... . .......
Sand ----..,i,*%i~it.t. Bentonite Plug --...... I~s.3Sa
Sand ~
Alternating layers of 1.03ft. sand and 0.15'ft bentonite --_ ... t~
3. 125-lnch Core Hole--...... , Total Depth: 266.9 Feet, _____ ....... .:.. __
Boring: BE3 Location: N 298,700
E 2,197,111 Date(s) Installed: 3115-3/22190 Well Construction Supervising Geologist: W.D. flanigan
NOT TO SCALE
Approved By: Scott Leslkar Date: 5115190
680.0 MSL
528.0 MSL
525.6 MSL
523.5 MSL
503.5 MSL
501.5 MSL
485.4 MSL 483.3 MSL
Note: Placement depths of backfill materials (sand and bentonite pellets) were confirmed by manual measurement.
412.6 MSL Cementl bentonite slurry was placed by tremie.
5190
"As Built" Well Construction Diagram
Monitoring Well No. BE 3
Figure A18

Locking Cover ------... ,r-----, Cap--------------~~
"----,.I Concrete Pad ---...,
2-lnch Schedule 80 PVC Pipe --------"'t":':' ..... ~.,
. ".:",: 6.75-lnch Hole --..... ..,: .. : .. : ....... .......
:"':" : ....... ....... Cement - Bentonite Grout ~ : ... :.-,:.
':":":
PVC Screen with
....... ....... . . . :'.: ": ....... :": ": .......
0.010-lnch Slots ------t:o'r:''!oIIf'!!§
PVC~p------------~~~~
-:":" . .: ": ", . ..... . ...... . .:'0: ": . ...... . . .... . . .... . . .... .
.: '.:",: . .....
Bentonite Plug --"'~92}mm;r-
Sand ---...... "i!i~t.*1 Bentonite Plug ----1~~,m~~~
Sand---..... ~
4.75-lnch Core Hole --.... -. Total Depth: 208.0 Feet. _____ .......... .-......~
Boring: BF3 Location: N 300,n6
E 2,211,027 Oata(s} InstalJad: 2110/90 Well Construction Supervising Geologist: Mike Granger
NOT TO SCALE
Approved By: Shawn Wood Date: 5/14190
550.1 MSL
528.4 MSL Soil Austin Chalk
4-2" stainless steel centralizers spaced 40'-50' apart between 548.4 and 365.4
392.4 MSL
389.4MSL
385.4 MSL
365.4 MSL
362.4 MSL 358.4 MSL
353.4 MSL 351.4 MSL
Note: All the backfill materials (sand,
5190
340.4 MSL bentonite pellets and cemenU bentonite slurry) were placed by tremie.
"As Built" Well Construction Diagram
Monitoring Well No. BF 3
FigureA19

Locking Cover ------... ~---_,
Cap------------------~~ "r---"""'" Concrete Pad --..,
2-lnch Schedule 80 :'.:'.: 0° ••••
PVC Pipe ----------+~ ..... ":i. ....... 6.75-lnch Hole .' '.: '.: ....... ....... ....... .......
Cement - Bentonite Grou\ ____ :,:::::::,
PVC Screen with
........ : ".:".: :".:-.: : -.:".: :0°: "0: :0°: 00: .......
?}:~~ '.1-=-=-=.-1
0.010-lnch Slots -----------t~ __
....... ......
. ..... . . ..... . . ..... . . ...... . ...... ....... . ..... . ....... ....... ....... ....... .......
Sand ____ , ...... - - ........ ..
rjji¢.~ff.i$%t PVC Tip
Bentonite Plug --..... 9~~~~--
Sand --"-i~~~WI Bentonite Plug --...... ~)~s.~~
Sand--"'~
4.75-lnch Core Hole --_"~t Total Depth: 287.0 Feet'--____ -.... ....... ....-
Boring: BE 4 Location: N 297,829
E 2,225,784 Oate(s) Installed: 1125190 Well Construction Supervising Geologist: Mike Granger Approved By: Shawn Wood
NOT TO SCALE
Data: 5114190
551.6 MSL
519.8 MSL Soil Austin Chalk
5-2w stainless steel centralizers spaced 40'-50' apart between 549.8 and 287.8
315.8 MSL
311.8 MSL
307.8 MSL
287.8 MSL
283.8 MSL 280.8 MSL
272.8 MSL
270.8 MSL
Note: All the backfill materials (sand. 262.8 MSL bentonite pellets and cement! bentonite
slurry) were placed by tremie.
"As Built" Well Construction Diagram
Monitoring Well No. BE 4
FigureA20

Locking Cover ------.... r----, Cap-----------------__ ~I 504.3 MSL
Concrete Pad ----
." '. 2-lnch Schedule 80 :'.:'.: ....... 451.7 MSL Soil
.' ....... }----.-:::..:..:.!...!!::::.:~~~.,--,-PVC Pipe ----------f.:-. ..... '!io-I"
: '0 •• : ....... S.7S-lnch Hole -~.f""'., ....... ....... ....... .......
Cement - Bentonite Grout~ ~:::::::: ........ ....... ....... ....... ....... :",:".; .......
PVC Screen with 0.010-lnch Slots --------I.;:,.:.:,tiE
PVC Tip----------t,:;;.,:~::...... ... ~
.......
. ..... . .......
. ..... .
. ..... . . ...... . . ...... . ........ .......
. ..... .
. ..... . . ..... . . ..... . ":'0:"': ....... . ..... .
Bentonite Plug --.., ... ;:~2!;;~~'"
Sand --..... .t\;ifffij~~ Bentonite Plug ---I~~l~~~~
Sand--_M".
4.7S-lnch Core Hole --_~_ •.
Total Depth: 310.0 Feet"-____ ........:..::~ ....
Boring: BF 4 Location: N 290,237
E 2,236,629 Date(s) Installed: 4116190 Well Construction Supervising Geologist: Alan Dover Approved By: Shawn Wood
NOT TO SCALE
Date: 5/22190
Austin Chalk
7-2- stainless steel centralizers spaced 40'-50' apart between 501.7 and 217.7
245.7 MSL
240.7 MSL
237.7 MSL
217.7 MSL
215.7 MSL 211.7 MSL
\ Alternating layers 01 sand and
191.7 MSL
bentonite between 211.7 and 191.7
Note: All the backfill materials (sand, bentonite pellets and cementl bentonite slurry) were placed by tremie.
"As Built" Well Construction Diagram
Monitoring Well No. BF 4
FigureA21

Locking Cover ------.... .r-----, Cap-------------____ ~._I
"r---yJ
Concrete Pad ----,
2-lnch Schedule 80 ....... ." .... PVC Pipe -------t. .. tII. ~ •• .......
6.75-lnch Hole : .. : .. : ....... : 0.: 00:
.......
.: "0: "' • . ..... .
463.9 MSL
Taylor Marl
8-2" stainless steel centralizers spaced 40'-50' apart between 462.5 and 156.5
....... ....... . ....... 342.1 MSL Ta lor Marl . ....... l-----=:...;=:...:....:.:=~~~;:_;__i7_ ....... Cement - Bentonite Grout~ :.-.: ... ;
Austin Chalk .:".:-,:
PVC Screen with
:".:0.: ....... :"0:-,: ....... : "0: "0: :"':"0: .......
....... ....... .......
. ..... . ....... . ...... . ....... .......
0.010-lnch Slots -------i~tH!
PVCTrp-----______ ~~~
Bentonite Plug --....... 9~SE.~~-
Sand ----.... i~&ll Bentonite Plug ---I~ ... tg~)g(~
f'A~~~
Sand --..... --.rl%tt.~ Bentonite Plug --...... ~I~~~~
T01al';;:~Ch:S: ~~ --......... ~w~1 Boring: BE 5 Location: N 278,967
E 2,245,051 Oate{s) Installed: 2/9-2113190 Well Construction Supervising Geologist: Shawn Wood Approved By: Shawn Wood
NOT TO SCALE
Date: 5114190
181.5 MSL
179.5 MSL
176.5 MSL
156.5 MSL
153.5 MSL 150.5 MSL
\ Alternating layers of ± 10 linear feet
5190
of sand and ±2 linear feet of bentonite between 150.5 and 127.5
Note: All the backfill materials (sand, 127.5 MSL bentonite pellets and cemenU bentonite
slurry) were placed by tremie.
"As Built" Well Construction Diagram
Monitoring Well No. BE 5
FigureA22

Locking Cover ------... r---...., Cap------------------~ 487.2 MSL
Concrete Pad --..,
Soil 2-lnch Schedule 40 PVC Pipe -------+."!":" ..•.. ~ .. : ... -:
....... Taylor Marl
....... 6.75-lnch Hole - ... -1 ..... '.' ...... ....... . ..... . ....... . ..... . ....... . ...... . ....... . ..... .
Cement - Bentonite Grout ~ ::::::::~ ........ ....... .......
....... ...... . ' ' .. ··I ____ ...:.1.:.7::;5.:.:.7....:;M::.:S~L=__..:.T::.ayt::lo:::.:r..!M!!:a:::.:r.!_1 ....... Austin Chalk
PVC Tip
: 00: "0: :".:"0: :"0:"0: .......
Sand ----.... -t-.
3.125-lnch Core Hole ---l.~
. ..... ....... ........ ....... . ..... .
Total Depth: 419.0 Feet, ____ .. ~~:-.-
Boring: BE6 Location: N 251,280
E 2,255,023 Date(s) Installed: 2119-2127190 Well Construction
NOT TO SCALE
Supervising Geologist: Boyd Dreyer/Jim Sansom Approved By: W.O. flanigan Data: 5115190
130.7 MSL
124.7 MSL
120.2 MSL
100.2 MSL
98.2 MSL 96.2 MSL
Note: Placement depths of backfill materials were confirmed by manual
____ -=6:::;5:.=:.2:..:M=S=.,.L measurement. Cement! bentonite slurry was placed by tremie.
51'90
"As Built" Well Construction Diagram
Monitoring Well No. BE 6
Figure A23

Locking Cover ------... r-----, Cap------------------~~
"T----T"
Concrete Pad ----..,
2-lnch Schedule 80 ....... PVC Pipe --------~ ..•.. ~ ..
: '° 0 .: ....... 12.25-lnch Hole -"'~"., '.'
(0-40') ....... ....... ....... ....... .......
Cement - Bentonite Grout ~ :.<.<.
....... ....... .......
. ...... . . ...... . . ...... . . ..... . ........ . ..... .
PVC Screen with
....... . .... . ....... . ..... . ....... . ..... . ....... ....... ....... ....... . ..... . .......
0.010-lnch Slots -------I!~ .. . :.:::.:::.:: .. ::-
PVC Tip--______ ~~~~
Bentonite Plug --.... .,9ts.~~~-
Sand ---II~\.%iMj Bentonite Plug --..... .,_)~~~~
Sand --... -r.~~~i~ Bentonite Plug ----I.,~~~~~
Boring: BF6 Location: N 238,075
E 2,255,063 Data(s) Installed: 1/8-119/90 Well Construction Supervising Geologist: Shawn Wood Approved By: Shawn Wood
NOT TO SCALE
Date: 5114190
457.3 MSL
421.3 MSL Soil Taylor Marl
8-2" stainless steel centralizers spaced 40'-50' apart between 101.3 and 76.3
129.3 MSL
126.3 MSL 122.4 MSL Ta lor Marl 121.3 MSL Austin Chalk
101.3 MSL
99.3 MSL 96.3 MSL
\ Alternating laye .. ot ± to linear teet of sand and ±2 linear feet of bentonite between 96.3 and 73.3
Note: All the backfill materials (sand, ____ ..;..7..;;;.6.;..;;3....;M..;.;.~SL bentonite pellets and cement! bentonite
slurry) were placed by tremie.
5190
"As Built" Well Construction Diagram
Monitoring Well No. BF 6
Figure A24

Locking Cover ------~r---_,
Cap-----------------__ ~I 457.3 MSL
Concrete Pad ---....
· ..... . . .... ... I-___ 44..:...:..:7~.3=....:.:.M:..::S:..::L:...__=S~0:.:.:iI---....... Taylor Marl
....... 2-lnch Schedule 80 PVC Pipe -------......... :...1: .•.. :.(:
....... 6.7S-lnch Hole - ..... ..f ......•. ....... ....... ....... .......
Cement - Bentonite Grout ____ ::::::::~
PVC Screen with
: .. : .. : : .. : .. : : .. : .. : : .. : .. : ....... ....... .......
0.010-lnch Slots ------4.;:,;;.;.1IiE
PVC Tip------------j~:..:.~~
. ..... . . ..... . . ..... . . ..... . . ...... . . ..... . ........ ....... ...... ....... ....... ......
. ...... . . ..... . ....... 161.4 MSL
157.2 MSL
154.8 MSL
145.7 MSL Taylor Marl Austin Chalk
134.8 MSL
Bentonite Plug ~ m~~m~§ ___ ....:1~2=8.~8:..::M~S::.!L=-Sand -- *tt4t~W0f,
132.6 MSL
DrIll Cuttings .,
3.125-lnch Core Hole ----......
Total Depth: 350.0 Feet _____ -..~_
Boring: BE 7A Location: N 222,oao
E 2,249,320 Date(s) Installed: 216190-217/90 Wen Construction Supervising Geologist: Scott Laslkar Approved By: W.D. flanigan
NOT TO SCALE
Data: 511 SJ90
122.8 MSL
104.8 MSL
Note: Placement depths of backfill materials (sand and bentonite pellets) were confirmed by manual measurement. Cementibentonite slurry was placed by tremie.
"As Built" Well Construction Diagram
Monitoring Well No. BE 7A
Figure A25

Locking Cover ------... ~ Cap------------------~ .. f
"r---.......
Concrete Pad ---,
2-lnch Schedule 40 PVC Pipe -----------~~":1
7.0-lnch Hole : '.: ":
........ ....... ....... ....... ....... ....... . ..... . ',.".. .: ',: ": .......
Cement - Bentonite Grout ____ ::::::::::
PVC Screen with
: ',:'0: ....... : ....... . ....... ....... : ":": .......
0.010-lnch Slots -----------t:~tI'Ii
PVC Tip --------------f:oi:':"':l~~
.: '.: ": . ...... . ......
....... . ..... . ':":", . ...... . .: ...... . .......
Bentonite Plug --..... 9~~~r-
Sand ---...... ~~il%! Bentonite Plug -----t .. ~
Sand--... ~
Bentonite Plug ..
Sand ----... -t 3.125-lnch Core Hole --__ -.
Total Depth: 343.5 Feet~ ____ -..:.~~
Boring: BF7 Location: N 213,426
E 2,241,756 Oate(s) Installed: 2116-2127190 Well Construction Supervising Geologist: Scott Laslkar Approved By: W.O. flanigan
NOT TO SCALE
Date: 5/15190
484.5 MSL
194.8 MSL
189.3 MSL
186.1 MSL 183.0 MSL
166.1 MSL
164.3 MSL 160.8 MSL
151.8 MSL
148.7 MSL
Soil Taylor Marl
Taylor Marl Austin Chalk
Note: Placement depths of the backfill materials (sand & bentonite pellets) we~ confirmed by manual measurement.
139.8 MSL Cementlbentonite slurry was placed by tremie.
5190
"As Built" Well Construction Diagram
Monitoring Well No. BF 7
FigureA26

Locking Cover ------.... r----, Cap-----------~ .. I 430.7 MSL
....... --....,..
........ 2-lnch Schedule 40 ...... . 411.0 MSL Soil
" ... . PVC Pipe -------+.-: ..... ~., Taylor Marl
....... 7.0-lnch Hole " ..... ....... . .... . ....... . ..... . ....... . ...... . ....... . ...... .
. : ".:".: ....... Cement - Bentonite Grout ---.... :"';":' ...... ....... .......
. ..•• ··'I ____ -=2:.::94.,.;..;.:8:-,;M.:.:.S::.:L=--_T.:.;a::.ly:..:.;lo:.;.r.,.;.M;.;,:a;:;.,:.rl
.:'.:'. Austin Chalk ....... : ".:".: ....... ....... ....... . ...... . ....... . ..... . ....... ....... 264.5 MSL
259.7 MSL
256.5 MSL
PVC Screen with 0.010-lnch Slots -------4~ ..
Sand-"'~ 236.5 MSL PVC Tip--------~ ... ~
233.5 MSL
Bentonite Plug ~·t!l~~~m~ ___ ~2::!::3:...:.1 =..:::.O~M::.:::S:::.!L=-- 230.0 MSL
Bentonite Plug ---j~~
Sand ~
3.125-lnch Core Hole --_~"f Total Depth: 220.0 Feet, _____ ~:.:.. ........
Boring: BE8 Location: N 206,364
E 2,229,026 Oate(s) Installed: 12127·12128189 Well Construction
NOT TO SCALE
Supervising Geologist: Scott E. Leslkar Approved By: W.O. Flanigan Dat.: 5115190
222.0 MSL 218.0 MSL
Note: Placement depths of backfill materials (sand and bentonite pellets) were confirmed by manual measurement.
208.0 MSL CemenV bentonite slurry was placed by tremie.
"As Built" Well Construction Diagram
Monitoring Well No. BE 8
Figure A27

Locking Cover ------.... .r---i Cap-----------------~~I
Lr---r
2-lnch Schedule 40 ........ .......
• 0 ••••
PVC Pipe -------~ ..•. ~., ....... 6.75-lnch Hole - ..... ~ ...... . ....... ....... .......
: "0: "0: ....... Cement - Bentonite Grout ~ :--.: ... ; .......
. ..... . .......
. ..... .
. ...... . ": "0: 00: ........ ....... .......
514.7 MSL
:".:".: :".:-.: ....... 399.7 MSL Ta lor Marl ...... ,l------..:~.:.:.....:::;::.:=--__;..::;~~~
....... Austin Chalk
PVC Screen with
....... ....... ....... .......
0.010-lnch Slots --------i~W'!§
Sand-.... ~ PVC Tip-__________ ~ .... ~
. ..... . . ..... . ....... 342.7 MSL
335.5 MSL
327.7 MSL
307.7MSL
304.2 MSL
Bentonite Plug ~~ml~m~ ____ =.=--=~ t 299.2 MSL
Sand --..... oof.i.i%.1.i,i%. Bentonite Plug ---....... -B~~sa
Sand ..
3. 125-lnch Core Hole--"",,"'~·f. Total Depth: 232.0 Feet. _____ .............. .....-
Boring: BF8 Location: N 204,307
E 2,215,118 Date(s) Installed: 1/8-1/10190 Well Construction
NOT TO SCALE
Supervising Geologist: Mark G. Thomas Approved By: W.D. Flanigan Date: 5/15190
293.2 MSL 289.7 MSL
Note: Placement depths of backfill materials (sand and bentonite pellets) were confirmed by manual measurement.
280.2 MSL Cement! bentonite slurry was placed by tremie.
"As Built" Well Construction Diagram
Monitoring Well No. BF 8
Figure A28

Locking Cover --------1~r---l Cap--_______________ ~ .. I
Ior---"""T'
....... 2-lnch Schedule 40 .......
0° ••••
PVC Pipe --------&: ..•. ~ .. ....... 10.0" hole from 0.0'-38.0' ...... . 7.0" hole from 38.0'-50.0' ~ .::::::-:
6.75" hole from 50.0'-138.5' ...... . ....... ....... Cement - Bentonite Grout~ :.-.:.-.:.
PVC Screen with
....... ....... ....... ....... ....... ....... .......
0.010-lnch Slots ---------f.~tIf@
Sand - ..... 4-PVC Tip--------~ ... ~~
. ..... ...... ....... . ...... . ........ . ..... . . ..... . ...... . ..... . . ..... . ..... . . ...... . . ..... . .......
513.6 MSL
474.5 MSL Soil Austin Chalk
403.7 MSL
400.6 MSL
398.0 MSL
378.0 MSL
Bentonite Plug ~~~~~~~ ___ ...::3:..:..7=3.=5~M=S::;.;:L,,-I: 367.1 MSL
374.8 MSL
Sand ---..... ..,i~~~f0. Bentonite Plug ---0001"'~
Sand ...
3.125-lnch Core Hole --..... ~t Total Depth: 162.3 Feet, _____ ---.-.-.~
Boring: BE9 Location: N 207,540
E 2,200,560 Oata(s) Installed: 2119-2120190 Well Construction Supervising Geologist: W.O. flanigan
NOT TO SCALE
Approved By: Scott Leslkar Data: 5/15190
361.9 MSL 357.2 MSL
Note: Placement depths of backfill materials (sand and bentonite pellets) were confirmed by manual measurement.
349.7 MSL Cement! bentonite slurry was placed by tremie.
5190
"As Built" Well Construction Diagram
Monitoring Well No. BE 9
FigureA29

Locking Cover ------... ~---__, Cap---------------__ ~._I Lr--""'"
2-lnch Schedule 40 PVC Pipe -------t.: .•.. '!'rl.: .......
6.75-lnch Hole-....... ······· ....... ....... ....... ....... ....... Cement - Bentonite Grout~ ; .. ; .. :.
PVC Screen with
....... : 00: 00: ....... :".:00: :"':-0: :"':"0: .......
0.010-lnch Slots -----------f.~1HE
Sand-... --t. PVC Tip ________ ~ ... ~
....... .......
.: 00: -' • . ...... . . ...... . . ...... .
. ..... . ....... . ..... . ...... . ..... . ........ ....... .......
545.0 MSL
527.3 MSL Soil Austin Chalk
425.8 MSL
418.9 MSL
415.0 MSL
395.0 MSL
392.8 MSL
Bentonite Plug ~~~~m~~ ____ .;;;...;;..=..=.~ ____ t 390.3 MSL
Sand --.... "'ff1*-%.*~ Bentonite Plug --.... ~~I~~~a
Sand •
3.125-lnch Core Hole ---~ .. ·r. Total Depth: 167.5 Feet. ___ _ -....... --
NOT TO SCALE
Boring: BF9 Location: N 214,885
E 2,189,515 Oate(s) Installed: 1/24-1/25190 Well Construction Supervising Geologist: Scott E. Leslkar Approved By: W.O. Flanigan Date: 5/15190
387.5MSL 385.5MSL
Note: Placement depths of backfill materials (sand and bentonite pellets) were confirmed by manual measurement.
375.8 MSL CemenV bentonite slurry was placed by tremie.
5190
"As Built" Well Construction Diagram
Monitoring Well No. BF 9
FigureA30

Locking Cover ------... .r------, Cap----------------__ ~ __ I
Lt-----r'
2-lnch SChedule 40 PVC Pipe ----------b .. ~ ..
. 00: 00: 6.75-lnch Hole --.... ~: .. : .. : ....... .......
:00 :0°: :0°: "0: .......
Cement - Bentonite Grout ~ : . ..: . ..:. ":".:".: : -.:0.:
PVC Screen with
: -':"0: : "0: 00: ....... :".:0.: .......
0.01 O-Inch Slots -----------f.~ __ Sand --.... --t
PVC Tip--------+~ ....... ~
Bentonite Plug ---1"~
Sand ..
3.125-lnch Core Hole --.... ~f.
....... ....... . ..... . . ...... .
.: ".:0.: ........
. ..... . ....... ....... .......
.: 00: "'. ........ . ..... . .......
Total Depth: 128.0 Feet. ___ _ ---....... ~
Boring: BE 10 Location: N 225,960
E 2,181,380 Date(s) Installed: 1/12-1/13190 Well Construction Supervising Geologist: Scott Leslkar Approved By: W.O. Flanigan
NOT TO SCALE
Date: 5115190
562.7 MSL
489.5 MSL
485.3 MSL
481.8 MSL
461.8 MSL
458.3 MSL
444.8 MSL 441.8 MSL
Soil Austin Chalk
Note: Placement depths of backfill materials (sand and bentonite pellets) were confirmed by manual measurement.
432.8 MSL Cement! bentonite slurry was placed by tremie.
5190
"As Built" Well Construction Diagram
Monitoring Well No. BE 10
Figure A31

APPENDIX B
WATER-LEVEL MEASUREMENTS

sse HydrolT able B-1
TABLE B-1. WATER-LEVEL MEASUREMENTS Page 1 of 6
OBSERVATION DATE WATER WELL MEASURED LEVEL
NUMBER ELEVATION (FEET)
BIR 11 16 Dec 89 664.3 12 Jan 90 666.2 16 Feb 90 666.9 23 Mar 90 667.2 10 Apr 90 667.0 26 Jun 90 667.1
BIR 21 16 Dec 89 650.3 20 Jan 90 6'54.6 16 Feb 90 655.7 23 Mar 90 656:2 10 Apr 90 656.4 26 Jun 90 657.6
BIR 31 16 Dec 89 587.9 29 Jan 90 592.0 16 Feb 90 596.8 23 Mar 90 601.8 10 Apr 90 602.5 26 Jun 90 601.4
BIR 41 20 Dec 89 593.5 29 Jan 90 593.8 16 Feb 90 594.0 29 Mar 90 594.5 10 Apr 90 594.6 27 Jun 90 595.1
BIR 54 16 Dec 89 435.8 16 Feb 90 >442.2 07 Apr 90 452.1
BIR 81 16 Dec 89 439.2 16 Feb 90 446.6 23 Mar 90 447.4 11 Apr 90 447.7 27 Jun 90 447.9
BI 1 16 Dec 89 679.8 21 Feb 90 719.7 10 Apr 90 720.4 26 Jun 90 720.2
B-1

sse HydrofTUIIe B-1
TABLE B-1. WATER-LEVEL MEASUREMENTS Page 2 of 6
OBSERVATION DATE WATER WELL MEASURED LEVEL
NUMBER ELEVATION (FEET)
81 2A 07 Dec 89 570.4 08 Dec 89 593.2 11 Dec 89 593.6 11 Dec 89 572.4 .. 15 Dec 89 582.2 16 Dec 89 582.3 18 Dec 89 587.7 18 Dec 89 572.1 .. 18 Dec 89 575.7 19 Dec 89 577.2 20 Dec 89 578.5 21 Dec 89 580.1 26 Dec 89 587.8 02 Jan 90 601.6 30 Jan 90 609.3 31 Jan 90 609.4 17 Feb 90 610.4 05 Apr 90 611.7 27 Jun 90 611.7
81 3 16 Dec 89 687.3 17 Feb 90 693.8 23 Mar 90 694.0 27 Mar 90 693.9 27 Mar 90 691.6 .. 27 Mar 90 693.9 04 Apr 90 694.2 26 Jun 90 690.0
81 4 17 Feb 90 679.8 23 Mar 90 680.5 10 Apr 90 680.9 26 Jun 90 681.2
81 5 17 Feb 90 634.6 23 Mar 90 641.0 10 Apr 90 641.2 26 Jun 90 641.3
81 6 17 Feb 90 712.4 23 Mar 90 717.2 10 Apr 90 717.5 26 Jun 90 716.0
8-2

sse HydrolT.tlle B-1
TABLE B-1. WATER-LEVEL MEASUREMENTS Page 3 of 6
OBSERVATION DATE WATER WELL MEASURED LEVEL
NUMBER ELEVATION IFEETl
BE1A 17 Feb 90 583.2 27 Jun 90 588.3
BE 1-90 20 Feb 90 549.8 24 Feb 90 556.0 22 Mar 90 557.5 10 Apr 90 560.4 27 Jun 90 562.1
BF 1 10 Apr 90 572.2 27 Jun 90 610.5
BE2 20 Feb 90 619.3 22 Mar 90 619.2 11 Apr 90 619.2 27 Jun 90 618.2
BF2 20 Feb 90 669.4 22 Mar 90 670.5 10 Apr 90 670.8 27 Jun 90 671.1
BE3 11 Apr 90 638.5 25 Jun 90 667.1
BF 3 20 Feb 90 >550.1 22 Mar 90 >550.1 26 Mar 90 517.2 * 26 Mar 90 530.6 10 Apr 90 574.7 11 Apr 90 575.4 25 Jun 90 583.2
BE4 20 Feb 90 306.4 22 Mar 90 329.7 09 Apr 90 349.9 25 Jun 90 410.3
BF4 25 Jun 90 497.6
BE5 20 Feb 90 196.8 22 Mar 90 275.1 07 Apr 90 304.8 25 Jun 90 389.4
8-3

sse Hydrofhble 8-1
TABLE B-1. WATER-LEVEL MEASUREMENTS Page 4 of 6
OBSERVATION DATE WATER WELL MEASURED LEVEL
NUMBER ELEVATION jFEET)
BE6 17 Mar 90 280.3 26 Mar 90 379.9 26 Mar 90 340.7 * 26 Mar 90 342.2 28 Mar 90 363.2 02 Apr 90 406.4
BF6 15 Feb 90 156.3 22 Mar 90 228.2 07 Apr 90 258.7 26 Jun 90 447.3
BE7A 10 Feb 90 135.8 * 10 Feb 90 141.2 12 Feb 90 137.1 19 Feb 90 135.7 20 Feb 90 163.3 23 Mar 90 292.7 05 Apr 90 308.2 26 Jun 90 344.7
BF7 17 Mar 90 235.9 05 Apr 90 294.2 26 Jun 90 352.2
BE8 29 Dec 89 239.0 * 29 Dec 89 241.5 31 Dec 89 271.3 02 Jan 90 299.6 22 Jan 90 399.2 25 Jan 90 404.0 30 Jan 90 409.3 31 Jan 90 410.1 05 Feb 90 412.9 20 Feb 90 418.4 23 Mar 90 418.8 05 Apr 90 416.1 26 Jun 90 427.0
BF 8 13 Jan 90 310.0 * 13 Jan 90 311.0 25 Jan 90 352.9
8-4

sse HydralTmIe B-1
TABLE B-1. WATER-LEVEL MEASUREMENTS Page 5 of 6
OBSERVATION DATE WATER WELL MEASURED LEVEL
NUMBER ELEVATION (FEET)
BF 8 30 Jan 90 384.8 31 Jan 90 390.5 05 Feb 90 415.0 20 Feb 90 459.0 23 Mar 90 484.0 05 Apr 90 486.8 26 Jun 90 492.3
BE9 17 Mar 90 378.7 05 Apr 90 380.3 26 Jun 90 385.6
BF9 26 Jan 90 404.5 • 26 Jan 90 460.4 29 Jan 90 516.5 31 Jan 90 520.4 05 Feb 90 524.5 23 Feb 90 526.4 23 Mar 90 528.0 25 Mar 90 527.7 25 Mar 90 504.0 • 25 Mar 90 522.0 26 Mar 90 526.2 02 Apr 90 527.4 26 Jun 90 526.4
BE10 18 Jan 90 472.9 • 18 Jan 90 477.3 22 Jan 90 491.7 25 Jan 90 502.5 29 Jan 90 521.2 31 Jan 90 527.3 05 Feb 90 536.0 23 Feb 90 548.1 23 Mar 90 552.9 05 Apr 90 553.6 26 Jun 90 554.0
E8-87 06 Jun 87 406.1 10 Jul 87 406.2
E9-87 27 Jun 89 501.0 10 Jul 89 500.6
8-5

TABLE B-1. WATER-LEVEL MEASUREMENTS Page 6 of 6
OBSERVATION DATE WELL MEASURED
NUMBER
F2-87 02 Jun 87 10 Jul 87 03 Jul 89
F4-87 29 Jun 87 10 Jul 87 02 Jun 89
J2-87 29 Jun 87 10 Jul 87 02 Jun 89
J6-87 29 Jun 87 10 Jul 87 02 Jul 89 24 Feb 90 23 Mar 90 26 Jun 90
K6-87 02 Jun 89
• Well bailed. See Appendix C for additional measurements and recovery curves.
•• Not measured.
B-6
WATER LEVEL
ELEVATION (FEET)
684.3 677.8 683.4
491.5 490.8 493.1
747.3 748:3 748.0
543.3 608.5 618.8 618.6 618.9 619.0
328.7

APPENDIXC
BAIL TEST RECOVERY
MEASUREMENTS AND CURVES

DATE 12-07-89
12-08-89 12-11-89 12-11-89 12-15-89 12-16-90 12-18-89 12-18-89 12-18-89 12-18-89 12-18-89 12-18-89 12-18-89 12-18-89 12-18-89 12-18-89 12-18-89 12-18-89 12-18-89 12-18-89 12-18-89 12-19-89 12-20-89 12-21-89 12-26-89 01-02-90 01-30-90 01-31-90 02-17-90 04-05-90
TABLE C-1. WATER-LEVEL MEASUREMENTS MONITORING WELL BI 2A
DEPTH WATER TO ELEVATION
TIME WATER (FT) (FT) REMARKS 10:00 a.m. 69.5 570.4 Boring bailed prior to well
construction. 2:00 p.m. 46.7 593.2
11:00 a.m. 46.3 593.6 Before bailing. 3:30 p.m. 67.5 572.4 After baYing. Water mUky gray. 3:45 p.m. 57.7 582.2 .
11:40 a.m. 57.7 582.3 9:55 a.m. 52.2 587.7 Before bailing.
11:23 a.m. 67.8 572.1 After baRing. Water mUkygray. 11:28a.m. 67.1 572.8 11:33 a.m. 66.6 573.3 11:38 a.m. 66.3 573.6 11:43 a.m. 66.0 573.9 11:48 a.m. 65.8 574.1 11:53 a.m. 65.6 574.3 11:58 a.m. 65.5 574.4 12:08 p.m. 65.3 574.6 12:18 p.m. 65.2 574.7 12:28 p.m. 65.1 574.8 12:58 p.m. 64.9 575.0 1:58 p.m. 64.7 575.2 3:58p.m. 64.2 575.7
11:56 a.m. 62.7 577.2 5:15 p.m. 61.4 578.5 2:20p.m. 59.8 580.1
11:25 a.m. 52.1 587.8 2:45 p.m. 38.3 601.6 1:45 Q.m. 30.6 609.3
12:50 p.m. 30.5 609.4 3:20 p.m. 29.6 610.4 2:50 p.m. 28.3 611.7
C-1

FIGURE C-1. WATER-LEVEL RECOVERY CURVE
Observation Well BI2A 18T-------------------------------------------------------------~620
:;::- :e 38 600 I»
i ... CD .... • - r-
oC CD - < () a. !!. CD N Q m
CD CD < > I» ~ ... • 0 .. :::J
CD --; 58 580 -n I ... -
78~~~~~~~~------~--~~~~~~~--~--~--~~~~~~~560
Dec 4 Jan 1 Feb 1 Mar 1 Apr 1
Time (Days)

DATE 12-16-89 02-17-90 03-27-90 03-27-90 03-27-90 03-27-90 03-27-90 03-27-90 04-04-90
TABLE C-2. WATER-LEVEL MEASUREMENTS MONITORING WELL BI 3
DEPTH WATER TO ELEVATION
TIME WATER (FT) _(f!l REMARKS 11:00 a.m. 9.4 687.3 3:42p.m. 2.9 693.8 8:45a.m. 2.8 693.9 Before bailing. 9:15 a.m. 5.0 691.7 After 0.5 hour of bailing. 9:45a.m. 3.8 692.9 After 1.0 hour of bailing.
10:00 a.m. 2.9 693.8 10:15 a.m. 2.9 693.8 10:30 a.m. 2.8 693.9 10:30 a.m. 2.6 694.1
C-3

FIGURE C-2. WATER-LEVEL RECOVERY CURVE
Observation Well 813 2 695
Well Bailed
3 694 --------..,'1 ... --
4 / 693 I ~
i' I I» ... I) I co
5 692 ... IL. I - r-s:. I co a <
Q I) I !!. ". Q 6 691 m
"i I co C'- < > I I» !I I ...
I c)" ... 7 690 ::J S I -~
"11
I co co ... -8 f 689
9 688
10~--~--~~~,--~~~~~~~1~~~~~~~~-,~~~~~~~~~,~~687
Dec 13 Jan 1 Feb 1 Mar 1 Apr 1
Time (Days)

DATE 03-26-90
03-26-90 03-26-90 03-26-90 03-26-90 03-26-90 03-26-90 03-26-90 03-26-90 03-26-90 03-26-90 03-27-90
04-10-90
04-11-90 04-13-90
TABLE C-3. WATER-LEVEL MEASUREMENTS MONITORING WELL SF 3
DEPTH WATER TO ELEVATION
TIME WATER* (t=T} (FJ) REMARKS 9:00 a.m. > + 1.7 >550.1 Water flowing over top of PVC
casi~ before baUinil. 9:15 a.m. 31.2 517.2 Water level after bailing. 9:30a.m. 30.3 518.1 9:45a.m. 29.7 518.7
10:00 a.m. 29.0 519.4 10:15 a.m. 28.4 520.0 10:30 a.m. 27.8 520.6 10:45 a.m. 27.2 521.2 11:00 a.m. 26.6 521.8 11:15 a.m. 26.1 522.3 3:30 p.m. 17.8 530.6 5:00p.m. > + 1.7 >550.1 Water flowing over top of PVC
casing. 9:40 a.m. +26.3 574.7 Pressure gauge installed on top
of casing. 10:15 am. +26.8 575.2 9:00a.m. +27.0 575.4
* + indicates distance above ground surface.
C-5
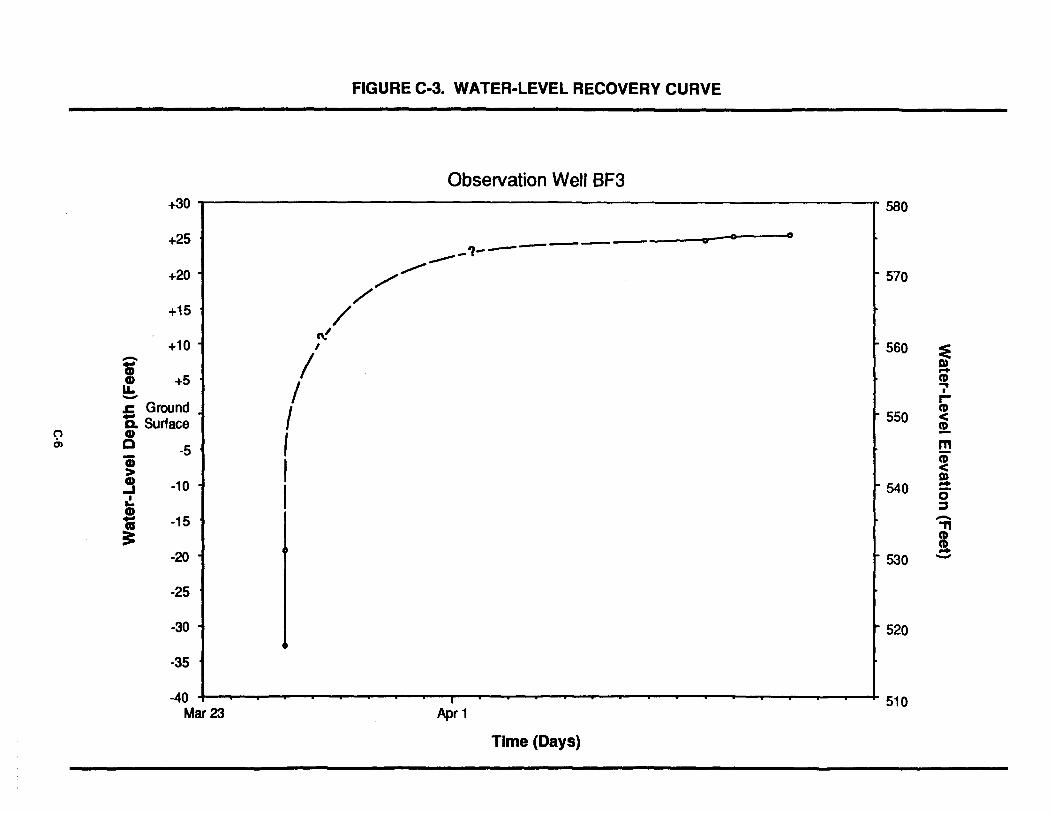
FIGURE C-3. WATER-LEVEL RECOVERY CURVE
Observation Well BF3 +30 580
+25 a a ,,------------- 0 ---+20 /~ 570 /'
+15 / +10 n!
560 I
== - I a • +5 CD CD / ~ u.. • - r-oC Ground I 550 CD < D. Surface !! n CD I !!l en Q -5 'iii CD I < > D)
~ -10 540 -I o· • :l .. CD -'S -15 ." 3: I --20 530 -
-25
-30 520
-35
-40 510 Mar 23 Apr 1
Time (Days)

DATE 03-17-90 03-26-90 03-26-90 03-26-90 03-26-90 03-26-90 03-26-90 03-26-90 03-26-90 03-26-90 03-26-90 03-28-90 04~2-90
TABLE C-4. WATER-LEVEL MEASUREMENTS MONITORING WELL BE 6
DEPTH WATER TO ELEVATION
TIME WATER (FT) (FT) REMARKS 1:30 p.m. 203.9 280.3
12:00 p.m. 104.3 379.9 Before bailing. 1:00 p.m. 143.5 340.7 After bailing. 1:15 p.m. 143.1 341.1 1:30 p.m. 143.0 341.2 1:45 p.m. 142.8 341.4 2:00p.m. 142.7 341.5 2:15 p.m. 142.5 341.7 2:30p.m. 142.4 341.8 2:45 p.m. 142.2 342.0 3:00p.m. 142.0 342.2
11:00 a.m. 121.0 363.2 3:00p.m. 77.8 406.4
C-7

FIGURE C-4. WATER-LEVEL RECOVERY CURVE
Observation Well BE6
55 420
Well Bailed :E - / - m
CD -CD /'" CD 105 370 ... u.. /'" • - r-
oC / CD - < (>
S1
/~ !!!. CD CD Q m
'ii CD / < > m !I / =. • 0 .. / :J
CD -1i ." ;: 155 II 320 CD
CD --I I ~
205 270 Mar 14 Apr 1
Time (Days)

DATE 02-10-90 02-10-90 02-10-90 02-10-90 02-10-90 02-10-90 02-10-90 02-10-90 02-10-90 02-10-90 02-10-90 02-12-90
02-19-90
02-20-90 03-23-90 04-05-90
TABLE C-S. WATER-LEVEL MEASUREMENTS MONITORING WELL BE 7 A
DEPTH WATER TO ELEVATION
TIME WATER eFT) eFT) REMARKS 10:00 a.m. 318.0 136.8 After bailing. 11:50 a.m. 315.2 139.6 11:51 a.m. 315.1 139.7 11:52 a.m. 315.1 139.7
11:55am. 315.0 139.8 12:00 p.m. 314.9 139.9 12:05 p.m. 314.8 140.0 12:20 p.m. 314.7 140.1
12:50 p.m. 314.3 140.5 1:50 p.m. 314.1 140.7 3:50 p.m. 313.6 141.2 9:55 p.m. 317.7 137.1 Water-level decline since prior
reading. 4:45 p.m. 319.1 135.7 Continued decline since prior
reading. 4:09p.m. 291.5 163.3
10:30 a.m. 162.1 292.7 11:40 a.m. 146.6 308.2
C-9

FIGURE C-S. WATER-LEVEL RECOVERY CURVE
Observation Well BE7 A
155 300 ,," ,," ,,"
'\'" /~
/ :e / ~ . / r250 DJ CD // -CD CD .. U. / • - // r .c CD a / <
Q CD / !!. ... C / m q t( 'ii CD ~ < > 255 / 200 DJ !I / -/ o· • / ... :::J CD / -- / as -n ~ // CD
CD --/ !Y'/ 150
.JL. ...... " 01-;- 01
355~~~~~~~~--~-----~,~~~--~~----~--~~~------~,~~~~100
Feb 7 Mar 1 Apr 1
Time (Days)

DATE 12-29-89 12-29-89 12-29-89 12-29-89 12-29-89 12-29-89 12-29-89 12-29-89 12-31-89 01~2-90
01-22-90 01-25-90 01-30-90 01-31-90 02~5-90
02-20-90 03-23-90 04~5-90
TABLE C-6. WATER-LEVEL MEASUREMENTS MONITORING WELL BE 8
DEPTH WATER TO ELEVATION
TIME WATER (FT) (FT) REMARKS 3:03 p.m. 189.0 239.0 After bailing. 3:04 p.m. 189.0 239.0 3:08 p.m. 188.8 239.2 3:13 p.m. 188.5 239.5 3:18p.m. 188.2 239.8 3:34 p.m. 187.6 240.4 3:48p.m. 187.2 240.8 4:03~m. 186.6 241.5 9:08a.m. 156.7 271.3 2:03p.m. 128.4 299.6
12:00 ~.m. 28.8 399.2 9:05a.m. 24.0 404.0 3:10~m. 18.7 409.3
11:25 a.m. 17.9 410.1 12:25~m. 15.1 412.9 4:44p.m. 9.6 418.4
10:58 a.m. 9.2 418.8 12:30 p.m. 11.9 416.1
C-ll

FIGURE C-S. WATER-LEVEL RECOVERY CURVE
Observation Well BE8 T---------------------------------------------------------------~450
30 400
i ~ m -CD CD ... U. • - 80 350 r-
oC CD ... < Q a. !!!. CD ... c m i'J
"i CD < > m .3 -• 130 300 o· .. :;, CD -1i "T1 3: CD
CD --180 250
roO+-~~~~~~--~~~~~~~~~~~~~~~~~~~~~~T_~~200
Oec26 Jan 1 Feb 1 Mar 1 Apr 1
Time (Days)

DATE 01-13-90 01-13-90 01-13-90 01-13-90 01-13-90 01-13-90 01-13-90 01-13-90 01-13-90 01-25-90 01-30-90 01-31-90 02-05-90 02-20-90 03-23-90 04-05-90
TABLE C-7. WATER-LEVEL MEASUREMENTS MONITORING WELL BF 8
DEPTH WATER TO ELEVATION
TIME WATER {ffi (FT) REMARKS 10:05 a.m. 202.2 310.0 After bailing. 10:06 a.m. 202.2 310.0 10:10 a.m. 202.0 310.2 10:15 a.m. 201.9 310.3 10:20 a.m. 201.9 310.3 10:35 a.m. 201.7 310.5 11:05 a.m. 201.6 310.6 12:05 p.m. 201.3 310.9 2:05 p.m. 201.2 311.0 8:35a.m. 159.3 352.9 2:20 p.m. 127.4 384.8
11:45 a.m. 121.7 390.5 12:45 p.m. 97.2 415.0 5:04p.m. 53.2 459.0
11:11 a.m. 28.2 484.0 12:50 p.m. 25.4 486.8
C-13

FIGURE C-7. WATER-LEVEL RECOVERY CURVE
Observation Well BFa
50
450 :e - D) 1; -100 (I) CD ~ U. • - r-.c (I)
a < Q !!. CD ... c m ... 400 CD "i < > D)
!I -o· • 150 ::J a.. CD -'&i ." ;: m --
350
200
Jan 10 Feb 1 Mar 1 Apr 1
Time (Days)

DATE 01-26-90 01-26-90 01-26-90 01-26-90 01-26-90 01-26-90 01-26-90 01-26-90 01-26-90 01-26-90 01-26-90 01-26-90 01-26-90 01-26-90 01-29-90 01-31-90 02-05-90 02-23-90 03-23-90 03-25-90 03-25-90 03-25-90 03-25-90 03-25-90 03-25-90 03-25-90 03-25-90 03-25-90 03-25-90 03-25-90 03-26-90 03-26-90 04-02-90
TABLE C-8. WATER-LEVEL MEASUREMENTS MONITORING WELL BF 9
DEPTH WATER TO ELEVATION
TIME WATER {ffl _(FIl REMARKS 2:33 p.m. 138.8 404.5 After bailing. 2:34p.m. 137.6 405.7 2:35 p.m. 137.1 406.2 2:38p.m. 135.3 408.0 2:43 p.m. 133.3 410.0 2:48 p.m. 131.7 411.6 3:03 p.m. 128.6 414.7 3:33 p.m. 119.5 423.8 4:03p.m. 112.5 430.8 4:33 p.m. 104.9 438.4 5:03 p.m. 98.1 445.2 5:33~m. 92.3 451.0 6:03 p.m. 87.2 456.1 6:33p.m. 82.9 460.4 1:20 p.m. 26.8 516.5
12:05 p.m. 22.9 520.4 1:30 p.m. 18.8 524.5 2:45 p.m. 16.9 526.4
11:51 a.m. 15.3 528.0 10:00 a.m. 15.57 527.73 Before baRing. 11:10 a.m. 39.30 504.0 After bailing. 11:25 a.m. 31.82 511.48 11:40 a.m. 29.48 513.82 11:55 a.m. 27.22 516.08 12:10 p.m. 26.22 517.08 12:25 p.m. 25.36 517.94 12:40 p.m. 24.71 518.59 12:55 p.m. 24.15 519.15
1:10 p.m. 23.64 519.66 3:10 p.m. 21.35 521.95 8:25a.m. 17.55 525.75 4:15 p.m. 17.10 526.2
10:05 a.m. 16.1 527.2
C-15

:;::;-CD :. -.c -(l 0. ... ~ 0) .. > !I
I .. CD '&i ==
FIGURE C-S. WATER-LEVEL RECOVERY CURVE
Observation Well BF9 ~--------------------------------------------------------------T550
o
50
100-
r Jan 23 Feb 1
Well Bailed
--~----------~--------------~?
I
Mar 1
Time (Days)
500
450
I 400 Apr 1
=E m -CD .. I r-
CD < !!. m CD < m -o· :::J -." CD CD --

DATE 01-18-90 01-18-90 01-18-90 01-18-90 01-18-90 01-18-90 01-18-90 01-18-90 01-18-90 01-18-90 01-22-90 01-25-90 01-29-90 01-31-90 02-05-90 02-23-90 03-23-90 04-05-90
TABLE e-g. WATER-LEVEL MEASUREMENTS MONITORING WELL BE 10
DEPTH WATER TO ELEVATION
TIME WATER (FT) (FT) REMARKS 11:258.m. 87.9 472.9 After bailing. 11:268.m. 87.5 473.3 11:278.m. 87.2 473.6 11:30 8.m. BS.5 475.3 11:358.m. BS.3 475.5 11:40 8.m. BS.3 475.5 11:558.m. BS.1 475.7 12:25 p.m. 84.6 476.2
1:25 p.m. 83.8 4n.O 3:25p.m. 83.5 477.3
12:00 p.m. 69.1 491.7 11:40 8.m. 58.3 502.5 1:00 p.m. 39.6 521.2
12:20 p.m. 33.5 527.3 1:55p.m 24.8 536.0 2:00 p.m. 12.7 548.1
12:04 p.m. 7.9 552.9 2:00p.m. 7.2 553.6
C-17

FIGURE C-9. WATER-LEVEL RECOVERY CURVE
Observation Well BE10 o~------------------------------------------------------------~
550
:E ~ D) CD -CD CD .... u.. • - r-oC CD a <
c:> 50 !!. CD .... Q m co CD CD
500 < > D)
!I -o· • .. ::J CD -1ii -n ;: CD CD --
100
Jan 15 Feb 1 Mar 1 Apr 1
Time (Days)