hydrogen? the viable storage option - assets-us-01.kc ... · uk requirements for energy storage...
TRANSCRIPT

Partner for progress
Hydrogen
The viable storage option
Mark Crowther March 2013
Any reproduction of this presentations form or
content in part or in whole without the written
consent of the owner Kiwa GASTEC at CRE is
strictly prohibited and would be in breach of
copyright
Copyright 2013 Kiwa GASTEC at CRE
2
Assertions
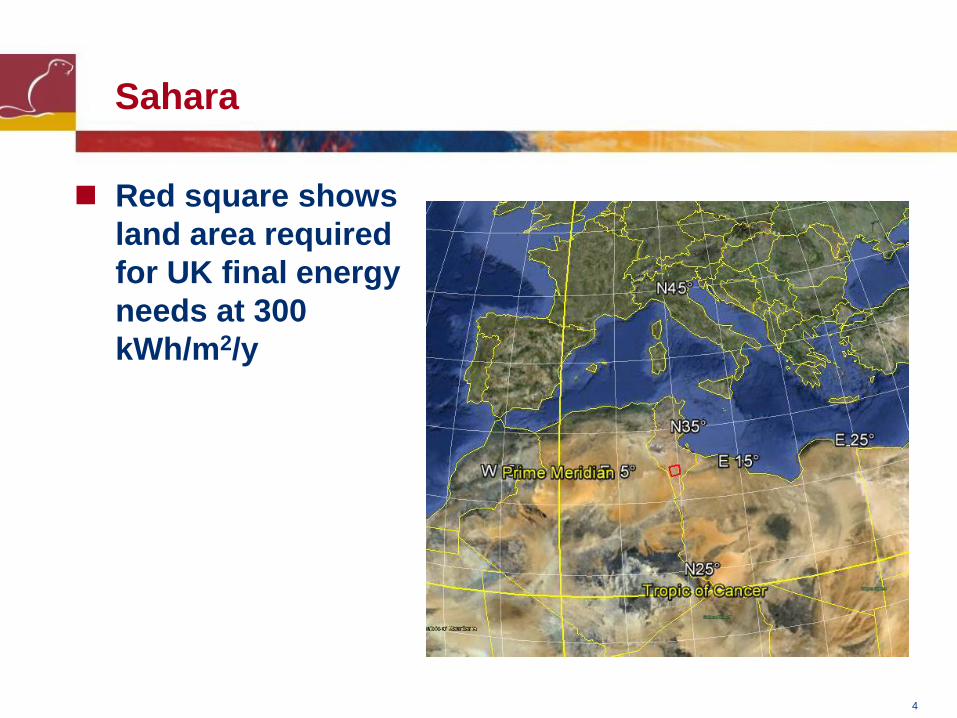
The world is not short of renewable energy 6200 km2 of Sahara desert would produce all UK final energy
needs
The world does require an energy vector Reliable and modestly priced to move this energy from its point of
productioncapture and transfer it to the consumer when it is
required
Historically storage has enabled transparent markets The separation of production from use improves the efficiency of
both
Ideally the vector should not be poisonous or of
short life
Ideally no greenhouse gas emissions at point of use
3
Sahara
Red square shows
land area required
for UK final energy
needs at 300
kWhm2y
4
Options for energy vectors include
Electricity - a good vector but no storage
Hot watersteam - expensive and complex to store
Methane with a biologically derived carbon atom
(always risks food competition the market moves in
complex ways)
Ammonia etc - technologically complex
Hydrogen
5
Hydrogen
Flammable colourless biologically inert gas
burns to water
Very light gas density ~008kgm3
(about 18 methane ~067kgm3)
Low calorific value of about 12750kJm3
(about 13 methane ~39000kJm3)
Good safety record with ~60million tonnes per year
produced transported and used in industry
A long record as Towns Gas (50-65 hydrogen) both
in the UK and still in the Far East
Can be conveyed through repurposed existing MP
and LP gas networks with change of appliance
6
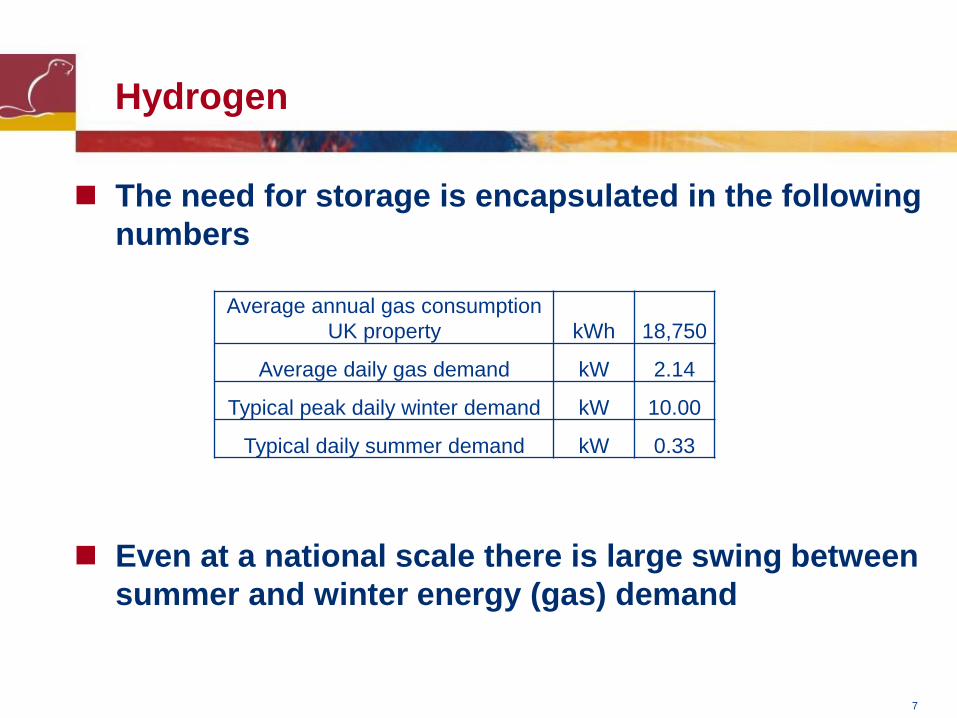
Average annual gas consumption
UK property kWh 18750
Average daily gas demand kW 214
Typical peak daily winter demand kW 1000
Typical daily summer demand kW 033
Hydrogen
The need for storage is encapsulated in the following
numbers
Even at a national scale there is large swing between
summer and winter energy (gas) demand
7
0
10
20
30
40
50
60
70Jan-9
6
Jul-9
6
Jan-9
7
Jul-9
7
Jan-9
8
Jul-9
8
Jan-9
9
Jul-9
9
Jan-0
0
Jul-0
0
Jan-0
1
Jul-0
1
Jan-0
2
Jul-0
2
Jan-0
3
Jul-0
3
Jan-0
4
Jul-0
4
Jan-0
5
Jul-0
5
Jan-0
6
Jul-0
6
Jan-0
7
Jul-0
7
Jan-0
8
Jul-0
8
Jan-0
9
Gas
Ele
ctri
city
use
pe
r d
ay p
er
pe
rso
n in
th
e U
K
kWh
day
GAS
ELEC
UK inter-seasonal variation in energy demand
14 years energy demand
8
UK requirements for energy storage
9
Ref httpwwwenergyresearchpartnershiporguktiki-download_filephpfileId=291|Energy20Storage20Full20Reportpdf
UK requirements for energy storage
Typical UK average wind intermittency
0
10
20
30
40
50
60
70
80
90
100
30062012 0000 31072012 0000 31082012 0000 30092012 0000
10
Relative space for 90 days of energy
11
Annual demand
per property kWh 18750
Mean load kW 214
Turbine yield 29
Size of turbine kW 738
Days storage 90
Required store kWh 4623
Options Mass of
Hydrogen kg 119
Hot water
Upper temp degC 75
Lower temp degC 60
Delta T degK 15 Mass of hot water
storage Tonnes 265
UK requirements for energy storage
Hydrogen is particularly suitable for inter-seasonal
down to daily load swings
This indicates monthly mismatch between central
heating demand and monthly wind production
Sized to meet annual demand
Month
20 year
average
degree days
Degree
hours Demand Production Balance
Oct-10 174 4176 7 11 3
Nov-10 258 6192 11 11 3
Dec-10 360 8640 15 11 -2
Jan-11 345 8280 14 9 -7
Feb-11 300 7200 13 9 -11
Mar-11 291 6984 12 9 -14
Apr-11 219 5256 9 6 -17
May-11 158 3792 7 6 -17
Jun-11 87 2088 4 6 -14
Jul-11 52 1248 2 7 -9
Aug-11 54 1296 2 7 -4
Sep-11 91 2184 4 7 0
Total 2389 57336
12
Biomass plant pound 2600 poundkW
Cost of biomass pound 0020 poundkW
Electric efficiency 45
Cost of fuel to electric pound 0044 poundkW
Depreciation 20 years
OampM 4
Investor return 8
Annual cost pound 442 poundkW
Cost of electricity
7500hoursy Note 1 pound 010 poundkWh
2000hoursy Note 2 pound 027 poundkWh
Note 1 Approximate base-load design
Note 2 Upper end of hours to provide electric space heating + DHW
Effect of annual production on cost
The higher the capital cost (eg nuclear power) the
greater the effect
Value of storage in this instance 017pkWh
13
By Electrolysis
By electrolysis from renewable sources eg this
electrolyser operates at an efficiency of around 80
(including ancillary power consumption)
14
1 Energy storage cavern in Texas =
50 Cruachan pumped storage schemes
Hydrogen Storage
15
Refs httpwwwpbworldcomcapabilities_proj
ectspower_energyunderground_storage
aspx
httpwwwscotsrenewablescomblogw
p-contentuploads201102cruachangif
httpwwwobanorguklistingCruachan-
Power-Station
Hydrogen Storage
Compressed underground hydrogen storage is
entirely proven and new sites are under-construction
today eg PRAXAIR in Texas
This last facility has the capacity of up to 65000toe
or gt50 Cruachan pumped storage stations
16
Hydrogen Storage
Locations of Texas hydrogen storage
Ref EU Underhy project
17
Hydrogen Storage
Ref httpprodsandiagovtechlibaccess-controlcgi2011114845pdf
18
Hydrogen Storage
Salt Cavern simplest and only commercially proven
Redundant Gas field will produce severe contamination of the hydrogen in early years
Aquifer may have significant technical problems with hydrogen loss
Unfortunately truly low cost hydrogen storage is
currently driven by geological chance and is strongly
dependent upon scale
19
Upper Lower
Methane Cap Cost $ $ 2500000000 $ 1000000000
Depreciation 20 yrs $ 125000000 $ 50000000
OampM 4 $ 100000000 $ 40000000
Return 8 $ 200000000 $ 80000000
Annual cost $ 425000000 $ 170000000
Annual storage kWh 278000000 278000000
Annual $kWh $ 0015 $ 0006
poundkWh pound 0010 pound 0004
Hydrogen BY 4 pound 0042 pound 0017
Indicative costs of storage
This is about 14 to 110 the lsquovaluersquo arising from the
intermittent use of biomass generation (ie
017pkWh)
The surest route to reducing energy production cost
is to increase operating hours of the producer andor
not restrict output
20
Siemens gasifier
HP electrolyser
CO2
Biomass gasifier
Underground
H2 store
Rutland plastics
Domestic Commercial Transport
Industry
Existing PE network
DC
H2
Hydrogen Supply and Use Chain
21
Ref for all but Germany httpwwwroads2hycom European Hydrogen Infrastructure Atlas J Perrin July 2007
Ref for Germany Germany - Taking the Fast Lane to Hydrogen Infrastructure Development P Schmidt August 2008
Ref Argonne National Laboratory
In summary the long distance transportation of
hydrogen is well proven and cost competitive
Hydrogen Analysis Resource Center
European Hydrogen Pipeline Miles by Country
Country Miles
Belgium 381
France 188
Germany 242
Italy 5
Netherlands 147
Sweden 11
Switzerland 1
United Kingdom 25
Total 1001
Hydrogen Transport
22
Hydrogen
Hurdles to the current widespread development of
hydrogen infrastructure with integral storage
No overt method of valuing stored energy
Currently natural gas producers do not charge
additionally for intermittent demand Hence the
poverty of Natural Gas storage scheme coming
forward
Price of carbon too low and renewables too small a
percentage of energy use to create a market for
storage
BUT the UK will require energy storage and hydrogen
(next to pumped storage) the only proven technology
23
Hydrogen how to proceed
Large schemes of co-production of hydrogen for
power generation and statictransport use avoids any
storage issues in the short term
Produce low carbon hydrogen principally for power
generation either from SMR +CCS
Waste derived hydrogen
Distribute swing production locally to establishing a
local market for hydrogen in the static and transport sectors (Cars buses etc)
boilers fuel cells gas fires and cookers
Thus proving hydrogenrsquos credentials as a low carbon
vector
24
Hydrogen how to proceed
Subsequently start to investigate time shifting of
local networks by both their interconnection and
inclusion of storage via Re-purposed natural gas or other hydrocarbon lines
New HP hydrogen lines
To existing redundant gas fields eg Cousland Scotlandrsquos first natural
gas field
redundant off shore
newly washed out salt caverns
25
Hydrogen how to proceed
In summary hydrogen is ideal for local connections Identify an enthusiastic LOCAL community (without gas)
Build LOCAL hydrogen production on the back of power
generation but with construction of local infrastructure for
domestic (1000 houses) commercial and transport use
Interconnect LOCAL networks to each other and storage to
provide a very level of community de-carbonisation with hydrogen
production operational either continuously (if nuclear or fossil
plus CCS) or following the vagaries of renewable power
26
This presentation was complied specifically for delivery to a private audience ndash it is strictly copyrighted to Kiwa Ltd
All of the information is or has been derived from freely available public domain sources
however specific permission has not been gained in all instances
27

Any reproduction of this presentations form or
content in part or in whole without the written
consent of the owner Kiwa GASTEC at CRE is
strictly prohibited and would be in breach of
copyright
Copyright 2013 Kiwa GASTEC at CRE
2
Assertions
The world is not short of renewable energy 6200 km2 of Sahara desert would produce all UK final energy
needs
The world does require an energy vector Reliable and modestly priced to move this energy from its point of
productioncapture and transfer it to the consumer when it is
required
Historically storage has enabled transparent markets The separation of production from use improves the efficiency of
both
Ideally the vector should not be poisonous or of
short life
Ideally no greenhouse gas emissions at point of use
3
Sahara
Red square shows
land area required
for UK final energy
needs at 300
kWhm2y
4
Options for energy vectors include
Electricity - a good vector but no storage
Hot watersteam - expensive and complex to store
Methane with a biologically derived carbon atom
(always risks food competition the market moves in
complex ways)
Ammonia etc - technologically complex
Hydrogen
5
Hydrogen
Flammable colourless biologically inert gas
burns to water
Very light gas density ~008kgm3
(about 18 methane ~067kgm3)
Low calorific value of about 12750kJm3
(about 13 methane ~39000kJm3)
Good safety record with ~60million tonnes per year
produced transported and used in industry
A long record as Towns Gas (50-65 hydrogen) both
in the UK and still in the Far East
Can be conveyed through repurposed existing MP
and LP gas networks with change of appliance
6
Average annual gas consumption
UK property kWh 18750
Average daily gas demand kW 214
Typical peak daily winter demand kW 1000
Typical daily summer demand kW 033
Hydrogen
The need for storage is encapsulated in the following
numbers
Even at a national scale there is large swing between
summer and winter energy (gas) demand
7
0
10
20
30
40
50
60
70Jan-9
6
Jul-9
6
Jan-9
7
Jul-9
7
Jan-9
8
Jul-9
8
Jan-9
9
Jul-9
9
Jan-0
0
Jul-0
0
Jan-0
1
Jul-0
1
Jan-0
2
Jul-0
2
Jan-0
3
Jul-0
3
Jan-0
4
Jul-0
4
Jan-0
5
Jul-0
5
Jan-0
6
Jul-0
6
Jan-0
7
Jul-0
7
Jan-0
8
Jul-0
8
Jan-0
9
Gas
Ele
ctri
city
use
pe
r d
ay p
er
pe
rso
n in
th
e U
K
kWh
day
GAS
ELEC
UK inter-seasonal variation in energy demand
14 years energy demand
8
UK requirements for energy storage
9
Ref httpwwwenergyresearchpartnershiporguktiki-download_filephpfileId=291|Energy20Storage20Full20Reportpdf
UK requirements for energy storage
Typical UK average wind intermittency
0
10
20
30
40
50
60
70
80
90
100
30062012 0000 31072012 0000 31082012 0000 30092012 0000
10
Relative space for 90 days of energy
11
Annual demand
per property kWh 18750
Mean load kW 214
Turbine yield 29
Size of turbine kW 738
Days storage 90
Required store kWh 4623
Options Mass of
Hydrogen kg 119
Hot water
Upper temp degC 75
Lower temp degC 60
Delta T degK 15 Mass of hot water
storage Tonnes 265
UK requirements for energy storage
Hydrogen is particularly suitable for inter-seasonal
down to daily load swings
This indicates monthly mismatch between central
heating demand and monthly wind production
Sized to meet annual demand
Month
20 year
average
degree days
Degree
hours Demand Production Balance
Oct-10 174 4176 7 11 3
Nov-10 258 6192 11 11 3
Dec-10 360 8640 15 11 -2
Jan-11 345 8280 14 9 -7
Feb-11 300 7200 13 9 -11
Mar-11 291 6984 12 9 -14
Apr-11 219 5256 9 6 -17
May-11 158 3792 7 6 -17
Jun-11 87 2088 4 6 -14
Jul-11 52 1248 2 7 -9
Aug-11 54 1296 2 7 -4
Sep-11 91 2184 4 7 0
Total 2389 57336
12
Biomass plant pound 2600 poundkW
Cost of biomass pound 0020 poundkW
Electric efficiency 45
Cost of fuel to electric pound 0044 poundkW
Depreciation 20 years
OampM 4
Investor return 8
Annual cost pound 442 poundkW
Cost of electricity
7500hoursy Note 1 pound 010 poundkWh
2000hoursy Note 2 pound 027 poundkWh
Note 1 Approximate base-load design
Note 2 Upper end of hours to provide electric space heating + DHW
Effect of annual production on cost
The higher the capital cost (eg nuclear power) the
greater the effect
Value of storage in this instance 017pkWh
13
By Electrolysis
By electrolysis from renewable sources eg this
electrolyser operates at an efficiency of around 80
(including ancillary power consumption)
14
1 Energy storage cavern in Texas =
50 Cruachan pumped storage schemes
Hydrogen Storage
15
Refs httpwwwpbworldcomcapabilities_proj
ectspower_energyunderground_storage
aspx
httpwwwscotsrenewablescomblogw
p-contentuploads201102cruachangif
httpwwwobanorguklistingCruachan-
Power-Station
Hydrogen Storage
Compressed underground hydrogen storage is
entirely proven and new sites are under-construction
today eg PRAXAIR in Texas
This last facility has the capacity of up to 65000toe
or gt50 Cruachan pumped storage stations
16
Hydrogen Storage
Locations of Texas hydrogen storage
Ref EU Underhy project
17
Hydrogen Storage
Ref httpprodsandiagovtechlibaccess-controlcgi2011114845pdf
18
Hydrogen Storage
Salt Cavern simplest and only commercially proven
Redundant Gas field will produce severe contamination of the hydrogen in early years
Aquifer may have significant technical problems with hydrogen loss
Unfortunately truly low cost hydrogen storage is
currently driven by geological chance and is strongly
dependent upon scale
19
Upper Lower
Methane Cap Cost $ $ 2500000000 $ 1000000000
Depreciation 20 yrs $ 125000000 $ 50000000
OampM 4 $ 100000000 $ 40000000
Return 8 $ 200000000 $ 80000000
Annual cost $ 425000000 $ 170000000
Annual storage kWh 278000000 278000000
Annual $kWh $ 0015 $ 0006
poundkWh pound 0010 pound 0004
Hydrogen BY 4 pound 0042 pound 0017
Indicative costs of storage
This is about 14 to 110 the lsquovaluersquo arising from the
intermittent use of biomass generation (ie
017pkWh)
The surest route to reducing energy production cost
is to increase operating hours of the producer andor
not restrict output
20
Siemens gasifier
HP electrolyser
CO2
Biomass gasifier
Underground
H2 store
Rutland plastics
Domestic Commercial Transport
Industry
Existing PE network
DC
H2
Hydrogen Supply and Use Chain
21
Ref for all but Germany httpwwwroads2hycom European Hydrogen Infrastructure Atlas J Perrin July 2007
Ref for Germany Germany - Taking the Fast Lane to Hydrogen Infrastructure Development P Schmidt August 2008
Ref Argonne National Laboratory
In summary the long distance transportation of
hydrogen is well proven and cost competitive
Hydrogen Analysis Resource Center
European Hydrogen Pipeline Miles by Country
Country Miles
Belgium 381
France 188
Germany 242
Italy 5
Netherlands 147
Sweden 11
Switzerland 1
United Kingdom 25
Total 1001
Hydrogen Transport
22
Hydrogen
Hurdles to the current widespread development of
hydrogen infrastructure with integral storage
No overt method of valuing stored energy
Currently natural gas producers do not charge
additionally for intermittent demand Hence the
poverty of Natural Gas storage scheme coming
forward
Price of carbon too low and renewables too small a
percentage of energy use to create a market for
storage
BUT the UK will require energy storage and hydrogen
(next to pumped storage) the only proven technology
23
Hydrogen how to proceed
Large schemes of co-production of hydrogen for
power generation and statictransport use avoids any
storage issues in the short term
Produce low carbon hydrogen principally for power
generation either from SMR +CCS
Waste derived hydrogen
Distribute swing production locally to establishing a
local market for hydrogen in the static and transport sectors (Cars buses etc)
boilers fuel cells gas fires and cookers
Thus proving hydrogenrsquos credentials as a low carbon
vector
24
Hydrogen how to proceed
Subsequently start to investigate time shifting of
local networks by both their interconnection and
inclusion of storage via Re-purposed natural gas or other hydrocarbon lines
New HP hydrogen lines
To existing redundant gas fields eg Cousland Scotlandrsquos first natural
gas field
redundant off shore
newly washed out salt caverns
25
Hydrogen how to proceed
In summary hydrogen is ideal for local connections Identify an enthusiastic LOCAL community (without gas)
Build LOCAL hydrogen production on the back of power
generation but with construction of local infrastructure for
domestic (1000 houses) commercial and transport use
Interconnect LOCAL networks to each other and storage to
provide a very level of community de-carbonisation with hydrogen
production operational either continuously (if nuclear or fossil
plus CCS) or following the vagaries of renewable power
26
This presentation was complied specifically for delivery to a private audience ndash it is strictly copyrighted to Kiwa Ltd
All of the information is or has been derived from freely available public domain sources
however specific permission has not been gained in all instances
27

Hydrogen
Flammable colourless biologically inert gas
burns to water
Very light gas density ~008kgm3
(about 18 methane ~067kgm3)
Low calorific value of about 12750kJm3
(about 13 methane ~39000kJm3)
Good safety record with ~60million tonnes per year
produced transported and used in industry
A long record as Towns Gas (50-65 hydrogen) both
in the UK and still in the Far East
Can be conveyed through repurposed existing MP
and LP gas networks with change of appliance
6
Average annual gas consumption
UK property kWh 18750
Average daily gas demand kW 214
Typical peak daily winter demand kW 1000
Typical daily summer demand kW 033
Hydrogen
The need for storage is encapsulated in the following
numbers
Even at a national scale there is large swing between
summer and winter energy (gas) demand
7
0
10
20
30
40
50
60
70Jan-9
6
Jul-9
6
Jan-9
7
Jul-9
7
Jan-9
8
Jul-9
8
Jan-9
9
Jul-9
9
Jan-0
0
Jul-0
0
Jan-0
1
Jul-0
1
Jan-0
2
Jul-0
2
Jan-0
3
Jul-0
3
Jan-0
4
Jul-0
4
Jan-0
5
Jul-0
5
Jan-0
6
Jul-0
6
Jan-0
7
Jul-0
7
Jan-0
8
Jul-0
8
Jan-0
9
Gas
Ele
ctri
city
use
pe
r d
ay p
er
pe
rso
n in
th
e U
K
kWh
day
GAS
ELEC
UK inter-seasonal variation in energy demand
14 years energy demand
8
UK requirements for energy storage
9
Ref httpwwwenergyresearchpartnershiporguktiki-download_filephpfileId=291|Energy20Storage20Full20Reportpdf
UK requirements for energy storage
Typical UK average wind intermittency
0
10
20
30
40
50
60
70
80
90
100
30062012 0000 31072012 0000 31082012 0000 30092012 0000
10
Relative space for 90 days of energy
11
Annual demand
per property kWh 18750
Mean load kW 214
Turbine yield 29
Size of turbine kW 738
Days storage 90
Required store kWh 4623
Options Mass of
Hydrogen kg 119
Hot water
Upper temp degC 75
Lower temp degC 60
Delta T degK 15 Mass of hot water
storage Tonnes 265
UK requirements for energy storage
Hydrogen is particularly suitable for inter-seasonal
down to daily load swings
This indicates monthly mismatch between central
heating demand and monthly wind production
Sized to meet annual demand
Month
20 year
average
degree days
Degree
hours Demand Production Balance
Oct-10 174 4176 7 11 3
Nov-10 258 6192 11 11 3
Dec-10 360 8640 15 11 -2
Jan-11 345 8280 14 9 -7
Feb-11 300 7200 13 9 -11
Mar-11 291 6984 12 9 -14
Apr-11 219 5256 9 6 -17
May-11 158 3792 7 6 -17
Jun-11 87 2088 4 6 -14
Jul-11 52 1248 2 7 -9
Aug-11 54 1296 2 7 -4
Sep-11 91 2184 4 7 0
Total 2389 57336
12
Biomass plant pound 2600 poundkW
Cost of biomass pound 0020 poundkW
Electric efficiency 45
Cost of fuel to electric pound 0044 poundkW
Depreciation 20 years
OampM 4
Investor return 8
Annual cost pound 442 poundkW
Cost of electricity
7500hoursy Note 1 pound 010 poundkWh
2000hoursy Note 2 pound 027 poundkWh
Note 1 Approximate base-load design
Note 2 Upper end of hours to provide electric space heating + DHW
Effect of annual production on cost
The higher the capital cost (eg nuclear power) the
greater the effect
Value of storage in this instance 017pkWh
13
By Electrolysis
By electrolysis from renewable sources eg this
electrolyser operates at an efficiency of around 80
(including ancillary power consumption)
14
1 Energy storage cavern in Texas =
50 Cruachan pumped storage schemes
Hydrogen Storage
15
Refs httpwwwpbworldcomcapabilities_proj
ectspower_energyunderground_storage
aspx
httpwwwscotsrenewablescomblogw
p-contentuploads201102cruachangif
httpwwwobanorguklistingCruachan-
Power-Station
Hydrogen Storage
Compressed underground hydrogen storage is
entirely proven and new sites are under-construction
today eg PRAXAIR in Texas
This last facility has the capacity of up to 65000toe
or gt50 Cruachan pumped storage stations
16
Hydrogen Storage
Locations of Texas hydrogen storage
Ref EU Underhy project
17
Hydrogen Storage
Ref httpprodsandiagovtechlibaccess-controlcgi2011114845pdf
18
Hydrogen Storage
Salt Cavern simplest and only commercially proven
Redundant Gas field will produce severe contamination of the hydrogen in early years
Aquifer may have significant technical problems with hydrogen loss
Unfortunately truly low cost hydrogen storage is
currently driven by geological chance and is strongly
dependent upon scale
19
Upper Lower
Methane Cap Cost $ $ 2500000000 $ 1000000000
Depreciation 20 yrs $ 125000000 $ 50000000
OampM 4 $ 100000000 $ 40000000
Return 8 $ 200000000 $ 80000000
Annual cost $ 425000000 $ 170000000
Annual storage kWh 278000000 278000000
Annual $kWh $ 0015 $ 0006
poundkWh pound 0010 pound 0004
Hydrogen BY 4 pound 0042 pound 0017
Indicative costs of storage
This is about 14 to 110 the lsquovaluersquo arising from the
intermittent use of biomass generation (ie
017pkWh)
The surest route to reducing energy production cost
is to increase operating hours of the producer andor
not restrict output
20
Siemens gasifier
HP electrolyser
CO2
Biomass gasifier
Underground
H2 store
Rutland plastics
Domestic Commercial Transport
Industry
Existing PE network
DC
H2
Hydrogen Supply and Use Chain
21
Ref for all but Germany httpwwwroads2hycom European Hydrogen Infrastructure Atlas J Perrin July 2007
Ref for Germany Germany - Taking the Fast Lane to Hydrogen Infrastructure Development P Schmidt August 2008
Ref Argonne National Laboratory
In summary the long distance transportation of
hydrogen is well proven and cost competitive
Hydrogen Analysis Resource Center
European Hydrogen Pipeline Miles by Country
Country Miles
Belgium 381
France 188
Germany 242
Italy 5
Netherlands 147
Sweden 11
Switzerland 1
United Kingdom 25
Total 1001
Hydrogen Transport
22
Hydrogen
Hurdles to the current widespread development of
hydrogen infrastructure with integral storage
No overt method of valuing stored energy
Currently natural gas producers do not charge
additionally for intermittent demand Hence the
poverty of Natural Gas storage scheme coming
forward
Price of carbon too low and renewables too small a
percentage of energy use to create a market for
storage
BUT the UK will require energy storage and hydrogen
(next to pumped storage) the only proven technology
23
Hydrogen how to proceed
Large schemes of co-production of hydrogen for
power generation and statictransport use avoids any
storage issues in the short term
Produce low carbon hydrogen principally for power
generation either from SMR +CCS
Waste derived hydrogen
Distribute swing production locally to establishing a
local market for hydrogen in the static and transport sectors (Cars buses etc)
boilers fuel cells gas fires and cookers
Thus proving hydrogenrsquos credentials as a low carbon
vector
24
Hydrogen how to proceed
Subsequently start to investigate time shifting of
local networks by both their interconnection and
inclusion of storage via Re-purposed natural gas or other hydrocarbon lines
New HP hydrogen lines
To existing redundant gas fields eg Cousland Scotlandrsquos first natural
gas field
redundant off shore
newly washed out salt caverns
25
Hydrogen how to proceed
In summary hydrogen is ideal for local connections Identify an enthusiastic LOCAL community (without gas)
Build LOCAL hydrogen production on the back of power
generation but with construction of local infrastructure for
domestic (1000 houses) commercial and transport use
Interconnect LOCAL networks to each other and storage to
provide a very level of community de-carbonisation with hydrogen
production operational either continuously (if nuclear or fossil
plus CCS) or following the vagaries of renewable power
26
This presentation was complied specifically for delivery to a private audience ndash it is strictly copyrighted to Kiwa Ltd
All of the information is or has been derived from freely available public domain sources
however specific permission has not been gained in all instances
27

0
10
20
30
40
50
60
70Jan-9
6
Jul-9
6
Jan-9
7
Jul-9
7
Jan-9
8
Jul-9
8
Jan-9
9
Jul-9
9
Jan-0
0
Jul-0
0
Jan-0
1
Jul-0
1
Jan-0
2
Jul-0
2
Jan-0
3
Jul-0
3
Jan-0
4
Jul-0
4
Jan-0
5
Jul-0
5
Jan-0
6
Jul-0
6
Jan-0
7
Jul-0
7
Jan-0
8
Jul-0
8
Jan-0
9
Gas
Ele
ctri
city
use
pe
r d
ay p
er
pe
rso
n in
th
e U
K
kWh
day
GAS
ELEC
UK inter-seasonal variation in energy demand
14 years energy demand
8
UK requirements for energy storage
9
Ref httpwwwenergyresearchpartnershiporguktiki-download_filephpfileId=291|Energy20Storage20Full20Reportpdf
UK requirements for energy storage
Typical UK average wind intermittency
0
10
20
30
40
50
60
70
80
90
100
30062012 0000 31072012 0000 31082012 0000 30092012 0000
10
Relative space for 90 days of energy
11
Annual demand
per property kWh 18750
Mean load kW 214
Turbine yield 29
Size of turbine kW 738
Days storage 90
Required store kWh 4623
Options Mass of
Hydrogen kg 119
Hot water
Upper temp degC 75
Lower temp degC 60
Delta T degK 15 Mass of hot water
storage Tonnes 265
UK requirements for energy storage
Hydrogen is particularly suitable for inter-seasonal
down to daily load swings
This indicates monthly mismatch between central
heating demand and monthly wind production
Sized to meet annual demand
Month
20 year
average
degree days
Degree
hours Demand Production Balance
Oct-10 174 4176 7 11 3
Nov-10 258 6192 11 11 3
Dec-10 360 8640 15 11 -2
Jan-11 345 8280 14 9 -7
Feb-11 300 7200 13 9 -11
Mar-11 291 6984 12 9 -14
Apr-11 219 5256 9 6 -17
May-11 158 3792 7 6 -17
Jun-11 87 2088 4 6 -14
Jul-11 52 1248 2 7 -9
Aug-11 54 1296 2 7 -4
Sep-11 91 2184 4 7 0
Total 2389 57336
12
Biomass plant pound 2600 poundkW
Cost of biomass pound 0020 poundkW
Electric efficiency 45
Cost of fuel to electric pound 0044 poundkW
Depreciation 20 years
OampM 4
Investor return 8
Annual cost pound 442 poundkW
Cost of electricity
7500hoursy Note 1 pound 010 poundkWh
2000hoursy Note 2 pound 027 poundkWh
Note 1 Approximate base-load design
Note 2 Upper end of hours to provide electric space heating + DHW
Effect of annual production on cost
The higher the capital cost (eg nuclear power) the
greater the effect
Value of storage in this instance 017pkWh
13
By Electrolysis
By electrolysis from renewable sources eg this
electrolyser operates at an efficiency of around 80
(including ancillary power consumption)
14
1 Energy storage cavern in Texas =
50 Cruachan pumped storage schemes
Hydrogen Storage
15
Refs httpwwwpbworldcomcapabilities_proj
ectspower_energyunderground_storage
aspx
httpwwwscotsrenewablescomblogw
p-contentuploads201102cruachangif
httpwwwobanorguklistingCruachan-
Power-Station
Hydrogen Storage
Compressed underground hydrogen storage is
entirely proven and new sites are under-construction
today eg PRAXAIR in Texas
This last facility has the capacity of up to 65000toe
or gt50 Cruachan pumped storage stations
16
Hydrogen Storage
Locations of Texas hydrogen storage
Ref EU Underhy project
17
Hydrogen Storage
Ref httpprodsandiagovtechlibaccess-controlcgi2011114845pdf
18
Hydrogen Storage
Salt Cavern simplest and only commercially proven
Redundant Gas field will produce severe contamination of the hydrogen in early years
Aquifer may have significant technical problems with hydrogen loss
Unfortunately truly low cost hydrogen storage is
currently driven by geological chance and is strongly
dependent upon scale
19
Upper Lower
Methane Cap Cost $ $ 2500000000 $ 1000000000
Depreciation 20 yrs $ 125000000 $ 50000000
OampM 4 $ 100000000 $ 40000000
Return 8 $ 200000000 $ 80000000
Annual cost $ 425000000 $ 170000000
Annual storage kWh 278000000 278000000
Annual $kWh $ 0015 $ 0006
poundkWh pound 0010 pound 0004
Hydrogen BY 4 pound 0042 pound 0017
Indicative costs of storage
This is about 14 to 110 the lsquovaluersquo arising from the
intermittent use of biomass generation (ie
017pkWh)
The surest route to reducing energy production cost
is to increase operating hours of the producer andor
not restrict output
20
Siemens gasifier
HP electrolyser
CO2
Biomass gasifier
Underground
H2 store
Rutland plastics
Domestic Commercial Transport
Industry
Existing PE network
DC
H2
Hydrogen Supply and Use Chain
21
Ref for all but Germany httpwwwroads2hycom European Hydrogen Infrastructure Atlas J Perrin July 2007
Ref for Germany Germany - Taking the Fast Lane to Hydrogen Infrastructure Development P Schmidt August 2008
Ref Argonne National Laboratory
In summary the long distance transportation of
hydrogen is well proven and cost competitive
Hydrogen Analysis Resource Center
European Hydrogen Pipeline Miles by Country
Country Miles
Belgium 381
France 188
Germany 242
Italy 5
Netherlands 147
Sweden 11
Switzerland 1
United Kingdom 25
Total 1001
Hydrogen Transport
22
Hydrogen
Hurdles to the current widespread development of
hydrogen infrastructure with integral storage
No overt method of valuing stored energy
Currently natural gas producers do not charge
additionally for intermittent demand Hence the
poverty of Natural Gas storage scheme coming
forward
Price of carbon too low and renewables too small a
percentage of energy use to create a market for
storage
BUT the UK will require energy storage and hydrogen
(next to pumped storage) the only proven technology
23
Hydrogen how to proceed
Large schemes of co-production of hydrogen for
power generation and statictransport use avoids any
storage issues in the short term
Produce low carbon hydrogen principally for power
generation either from SMR +CCS
Waste derived hydrogen
Distribute swing production locally to establishing a
local market for hydrogen in the static and transport sectors (Cars buses etc)
boilers fuel cells gas fires and cookers
Thus proving hydrogenrsquos credentials as a low carbon
vector
24
Hydrogen how to proceed
Subsequently start to investigate time shifting of
local networks by both their interconnection and
inclusion of storage via Re-purposed natural gas or other hydrocarbon lines
New HP hydrogen lines
To existing redundant gas fields eg Cousland Scotlandrsquos first natural
gas field
redundant off shore
newly washed out salt caverns
25
Hydrogen how to proceed
In summary hydrogen is ideal for local connections Identify an enthusiastic LOCAL community (without gas)
Build LOCAL hydrogen production on the back of power
generation but with construction of local infrastructure for
domestic (1000 houses) commercial and transport use
Interconnect LOCAL networks to each other and storage to
provide a very level of community de-carbonisation with hydrogen
production operational either continuously (if nuclear or fossil
plus CCS) or following the vagaries of renewable power
26
This presentation was complied specifically for delivery to a private audience ndash it is strictly copyrighted to Kiwa Ltd
All of the information is or has been derived from freely available public domain sources
however specific permission has not been gained in all instances
27
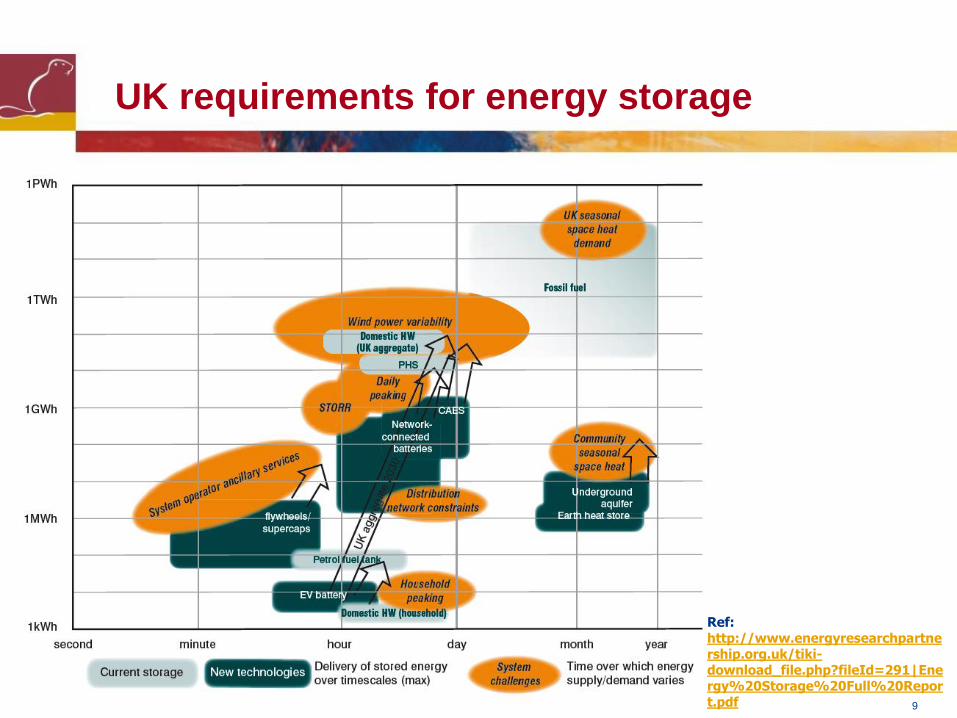
UK requirements for energy storage
9
Ref httpwwwenergyresearchpartnershiporguktiki-download_filephpfileId=291|Energy20Storage20Full20Reportpdf
UK requirements for energy storage
Typical UK average wind intermittency
0
10
20
30
40
50
60
70
80
90
100
30062012 0000 31072012 0000 31082012 0000 30092012 0000
10
Relative space for 90 days of energy
11
Annual demand
per property kWh 18750
Mean load kW 214
Turbine yield 29
Size of turbine kW 738
Days storage 90
Required store kWh 4623
Options Mass of
Hydrogen kg 119
Hot water
Upper temp degC 75
Lower temp degC 60
Delta T degK 15 Mass of hot water
storage Tonnes 265
UK requirements for energy storage
Hydrogen is particularly suitable for inter-seasonal
down to daily load swings
This indicates monthly mismatch between central
heating demand and monthly wind production
Sized to meet annual demand
Month
20 year
average
degree days
Degree
hours Demand Production Balance
Oct-10 174 4176 7 11 3
Nov-10 258 6192 11 11 3
Dec-10 360 8640 15 11 -2
Jan-11 345 8280 14 9 -7
Feb-11 300 7200 13 9 -11
Mar-11 291 6984 12 9 -14
Apr-11 219 5256 9 6 -17
May-11 158 3792 7 6 -17
Jun-11 87 2088 4 6 -14
Jul-11 52 1248 2 7 -9
Aug-11 54 1296 2 7 -4
Sep-11 91 2184 4 7 0
Total 2389 57336
12
Biomass plant pound 2600 poundkW
Cost of biomass pound 0020 poundkW
Electric efficiency 45
Cost of fuel to electric pound 0044 poundkW
Depreciation 20 years
OampM 4
Investor return 8
Annual cost pound 442 poundkW
Cost of electricity
7500hoursy Note 1 pound 010 poundkWh
2000hoursy Note 2 pound 027 poundkWh
Note 1 Approximate base-load design
Note 2 Upper end of hours to provide electric space heating + DHW
Effect of annual production on cost
The higher the capital cost (eg nuclear power) the
greater the effect
Value of storage in this instance 017pkWh
13
By Electrolysis
By electrolysis from renewable sources eg this
electrolyser operates at an efficiency of around 80
(including ancillary power consumption)
14
1 Energy storage cavern in Texas =
50 Cruachan pumped storage schemes
Hydrogen Storage
15
Refs httpwwwpbworldcomcapabilities_proj
ectspower_energyunderground_storage
aspx
httpwwwscotsrenewablescomblogw
p-contentuploads201102cruachangif
httpwwwobanorguklistingCruachan-
Power-Station
Hydrogen Storage
Compressed underground hydrogen storage is
entirely proven and new sites are under-construction
today eg PRAXAIR in Texas
This last facility has the capacity of up to 65000toe
or gt50 Cruachan pumped storage stations
16
Hydrogen Storage
Locations of Texas hydrogen storage
Ref EU Underhy project
17
Hydrogen Storage
Ref httpprodsandiagovtechlibaccess-controlcgi2011114845pdf
18
Hydrogen Storage
Salt Cavern simplest and only commercially proven
Redundant Gas field will produce severe contamination of the hydrogen in early years
Aquifer may have significant technical problems with hydrogen loss
Unfortunately truly low cost hydrogen storage is
currently driven by geological chance and is strongly
dependent upon scale
19
Upper Lower
Methane Cap Cost $ $ 2500000000 $ 1000000000
Depreciation 20 yrs $ 125000000 $ 50000000
OampM 4 $ 100000000 $ 40000000
Return 8 $ 200000000 $ 80000000
Annual cost $ 425000000 $ 170000000
Annual storage kWh 278000000 278000000
Annual $kWh $ 0015 $ 0006
poundkWh pound 0010 pound 0004
Hydrogen BY 4 pound 0042 pound 0017
Indicative costs of storage
This is about 14 to 110 the lsquovaluersquo arising from the
intermittent use of biomass generation (ie
017pkWh)
The surest route to reducing energy production cost
is to increase operating hours of the producer andor
not restrict output
20
Siemens gasifier
HP electrolyser
CO2
Biomass gasifier
Underground
H2 store
Rutland plastics
Domestic Commercial Transport
Industry
Existing PE network
DC
H2
Hydrogen Supply and Use Chain
21
Ref for all but Germany httpwwwroads2hycom European Hydrogen Infrastructure Atlas J Perrin July 2007
Ref for Germany Germany - Taking the Fast Lane to Hydrogen Infrastructure Development P Schmidt August 2008
Ref Argonne National Laboratory
In summary the long distance transportation of
hydrogen is well proven and cost competitive
Hydrogen Analysis Resource Center
European Hydrogen Pipeline Miles by Country
Country Miles
Belgium 381
France 188
Germany 242
Italy 5
Netherlands 147
Sweden 11
Switzerland 1
United Kingdom 25
Total 1001
Hydrogen Transport
22
Hydrogen
Hurdles to the current widespread development of
hydrogen infrastructure with integral storage
No overt method of valuing stored energy
Currently natural gas producers do not charge
additionally for intermittent demand Hence the
poverty of Natural Gas storage scheme coming
forward
Price of carbon too low and renewables too small a
percentage of energy use to create a market for
storage
BUT the UK will require energy storage and hydrogen
(next to pumped storage) the only proven technology
23
Hydrogen how to proceed
Large schemes of co-production of hydrogen for
power generation and statictransport use avoids any
storage issues in the short term
Produce low carbon hydrogen principally for power
generation either from SMR +CCS
Waste derived hydrogen
Distribute swing production locally to establishing a
local market for hydrogen in the static and transport sectors (Cars buses etc)
boilers fuel cells gas fires and cookers
Thus proving hydrogenrsquos credentials as a low carbon
vector
24
Hydrogen how to proceed
Subsequently start to investigate time shifting of
local networks by both their interconnection and
inclusion of storage via Re-purposed natural gas or other hydrocarbon lines
New HP hydrogen lines
To existing redundant gas fields eg Cousland Scotlandrsquos first natural
gas field
redundant off shore
newly washed out salt caverns
25
Hydrogen how to proceed
In summary hydrogen is ideal for local connections Identify an enthusiastic LOCAL community (without gas)
Build LOCAL hydrogen production on the back of power
generation but with construction of local infrastructure for
domestic (1000 houses) commercial and transport use
Interconnect LOCAL networks to each other and storage to
provide a very level of community de-carbonisation with hydrogen
production operational either continuously (if nuclear or fossil
plus CCS) or following the vagaries of renewable power
26
This presentation was complied specifically for delivery to a private audience ndash it is strictly copyrighted to Kiwa Ltd
All of the information is or has been derived from freely available public domain sources
however specific permission has not been gained in all instances
27
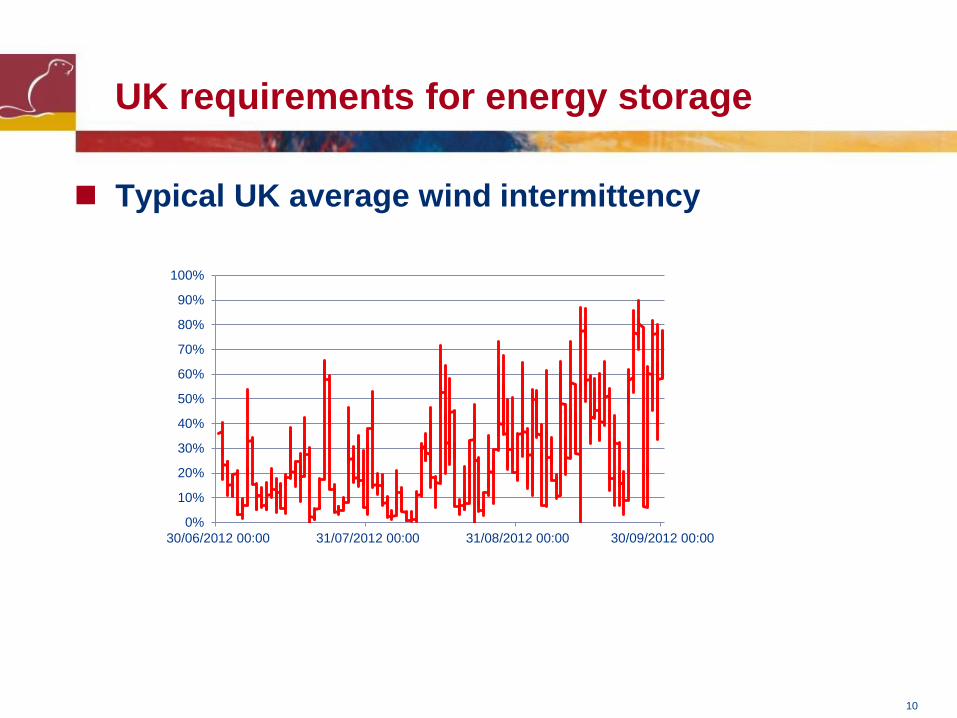
UK requirements for energy storage
Typical UK average wind intermittency
0
10
20
30
40
50
60
70
80
90
100
30062012 0000 31072012 0000 31082012 0000 30092012 0000
10
Relative space for 90 days of energy
11
Annual demand
per property kWh 18750
Mean load kW 214
Turbine yield 29
Size of turbine kW 738
Days storage 90
Required store kWh 4623
Options Mass of
Hydrogen kg 119
Hot water
Upper temp degC 75
Lower temp degC 60
Delta T degK 15 Mass of hot water
storage Tonnes 265
UK requirements for energy storage
Hydrogen is particularly suitable for inter-seasonal
down to daily load swings
This indicates monthly mismatch between central
heating demand and monthly wind production
Sized to meet annual demand
Month
20 year
average
degree days
Degree
hours Demand Production Balance
Oct-10 174 4176 7 11 3
Nov-10 258 6192 11 11 3
Dec-10 360 8640 15 11 -2
Jan-11 345 8280 14 9 -7
Feb-11 300 7200 13 9 -11
Mar-11 291 6984 12 9 -14
Apr-11 219 5256 9 6 -17
May-11 158 3792 7 6 -17
Jun-11 87 2088 4 6 -14
Jul-11 52 1248 2 7 -9
Aug-11 54 1296 2 7 -4
Sep-11 91 2184 4 7 0
Total 2389 57336
12
Biomass plant pound 2600 poundkW
Cost of biomass pound 0020 poundkW
Electric efficiency 45
Cost of fuel to electric pound 0044 poundkW
Depreciation 20 years
OampM 4
Investor return 8
Annual cost pound 442 poundkW
Cost of electricity
7500hoursy Note 1 pound 010 poundkWh
2000hoursy Note 2 pound 027 poundkWh
Note 1 Approximate base-load design
Note 2 Upper end of hours to provide electric space heating + DHW
Effect of annual production on cost
The higher the capital cost (eg nuclear power) the
greater the effect
Value of storage in this instance 017pkWh
13
By Electrolysis
By electrolysis from renewable sources eg this
electrolyser operates at an efficiency of around 80
(including ancillary power consumption)
14
1 Energy storage cavern in Texas =
50 Cruachan pumped storage schemes
Hydrogen Storage
15
Refs httpwwwpbworldcomcapabilities_proj
ectspower_energyunderground_storage
aspx
httpwwwscotsrenewablescomblogw
p-contentuploads201102cruachangif
httpwwwobanorguklistingCruachan-
Power-Station
Hydrogen Storage
Compressed underground hydrogen storage is
entirely proven and new sites are under-construction
today eg PRAXAIR in Texas
This last facility has the capacity of up to 65000toe
or gt50 Cruachan pumped storage stations
16
Hydrogen Storage
Locations of Texas hydrogen storage
Ref EU Underhy project
17
Hydrogen Storage
Ref httpprodsandiagovtechlibaccess-controlcgi2011114845pdf
18
Hydrogen Storage
Salt Cavern simplest and only commercially proven
Redundant Gas field will produce severe contamination of the hydrogen in early years
Aquifer may have significant technical problems with hydrogen loss
Unfortunately truly low cost hydrogen storage is
currently driven by geological chance and is strongly
dependent upon scale
19
Upper Lower
Methane Cap Cost $ $ 2500000000 $ 1000000000
Depreciation 20 yrs $ 125000000 $ 50000000
OampM 4 $ 100000000 $ 40000000
Return 8 $ 200000000 $ 80000000
Annual cost $ 425000000 $ 170000000
Annual storage kWh 278000000 278000000
Annual $kWh $ 0015 $ 0006
poundkWh pound 0010 pound 0004
Hydrogen BY 4 pound 0042 pound 0017
Indicative costs of storage
This is about 14 to 110 the lsquovaluersquo arising from the
intermittent use of biomass generation (ie
017pkWh)
The surest route to reducing energy production cost
is to increase operating hours of the producer andor
not restrict output
20
Siemens gasifier
HP electrolyser
CO2
Biomass gasifier
Underground
H2 store
Rutland plastics
Domestic Commercial Transport
Industry
Existing PE network
DC
H2
Hydrogen Supply and Use Chain
21
Ref for all but Germany httpwwwroads2hycom European Hydrogen Infrastructure Atlas J Perrin July 2007
Ref for Germany Germany - Taking the Fast Lane to Hydrogen Infrastructure Development P Schmidt August 2008
Ref Argonne National Laboratory
In summary the long distance transportation of
hydrogen is well proven and cost competitive
Hydrogen Analysis Resource Center
European Hydrogen Pipeline Miles by Country
Country Miles
Belgium 381
France 188
Germany 242
Italy 5
Netherlands 147
Sweden 11
Switzerland 1
United Kingdom 25
Total 1001
Hydrogen Transport
22
Hydrogen
Hurdles to the current widespread development of
hydrogen infrastructure with integral storage
No overt method of valuing stored energy
Currently natural gas producers do not charge
additionally for intermittent demand Hence the
poverty of Natural Gas storage scheme coming
forward
Price of carbon too low and renewables too small a
percentage of energy use to create a market for
storage
BUT the UK will require energy storage and hydrogen
(next to pumped storage) the only proven technology
23
Hydrogen how to proceed
Large schemes of co-production of hydrogen for
power generation and statictransport use avoids any
storage issues in the short term
Produce low carbon hydrogen principally for power
generation either from SMR +CCS
Waste derived hydrogen
Distribute swing production locally to establishing a
local market for hydrogen in the static and transport sectors (Cars buses etc)
boilers fuel cells gas fires and cookers
Thus proving hydrogenrsquos credentials as a low carbon
vector
24
Hydrogen how to proceed
Subsequently start to investigate time shifting of
local networks by both their interconnection and
inclusion of storage via Re-purposed natural gas or other hydrocarbon lines
New HP hydrogen lines
To existing redundant gas fields eg Cousland Scotlandrsquos first natural
gas field
redundant off shore
newly washed out salt caverns
25
Hydrogen how to proceed
In summary hydrogen is ideal for local connections Identify an enthusiastic LOCAL community (without gas)
Build LOCAL hydrogen production on the back of power
generation but with construction of local infrastructure for
domestic (1000 houses) commercial and transport use
Interconnect LOCAL networks to each other and storage to
provide a very level of community de-carbonisation with hydrogen
production operational either continuously (if nuclear or fossil
plus CCS) or following the vagaries of renewable power
26
This presentation was complied specifically for delivery to a private audience ndash it is strictly copyrighted to Kiwa Ltd
All of the information is or has been derived from freely available public domain sources
however specific permission has not been gained in all instances
27

Hydrogen Storage
Compressed underground hydrogen storage is
entirely proven and new sites are under-construction
today eg PRAXAIR in Texas
This last facility has the capacity of up to 65000toe
or gt50 Cruachan pumped storage stations
16
Hydrogen Storage
Locations of Texas hydrogen storage
Ref EU Underhy project
17
Hydrogen Storage
Ref httpprodsandiagovtechlibaccess-controlcgi2011114845pdf
18
Hydrogen Storage
Salt Cavern simplest and only commercially proven
Redundant Gas field will produce severe contamination of the hydrogen in early years
Aquifer may have significant technical problems with hydrogen loss
Unfortunately truly low cost hydrogen storage is
currently driven by geological chance and is strongly
dependent upon scale
19
Upper Lower
Methane Cap Cost $ $ 2500000000 $ 1000000000
Depreciation 20 yrs $ 125000000 $ 50000000
OampM 4 $ 100000000 $ 40000000
Return 8 $ 200000000 $ 80000000
Annual cost $ 425000000 $ 170000000
Annual storage kWh 278000000 278000000
Annual $kWh $ 0015 $ 0006
poundkWh pound 0010 pound 0004
Hydrogen BY 4 pound 0042 pound 0017
Indicative costs of storage
This is about 14 to 110 the lsquovaluersquo arising from the
intermittent use of biomass generation (ie
017pkWh)
The surest route to reducing energy production cost
is to increase operating hours of the producer andor
not restrict output
20
Siemens gasifier
HP electrolyser
CO2
Biomass gasifier
Underground
H2 store
Rutland plastics
Domestic Commercial Transport
Industry
Existing PE network
DC
H2
Hydrogen Supply and Use Chain
21
Ref for all but Germany httpwwwroads2hycom European Hydrogen Infrastructure Atlas J Perrin July 2007
Ref for Germany Germany - Taking the Fast Lane to Hydrogen Infrastructure Development P Schmidt August 2008
Ref Argonne National Laboratory
In summary the long distance transportation of
hydrogen is well proven and cost competitive
Hydrogen Analysis Resource Center
European Hydrogen Pipeline Miles by Country
Country Miles
Belgium 381
France 188
Germany 242
Italy 5
Netherlands 147
Sweden 11
Switzerland 1
United Kingdom 25
Total 1001
Hydrogen Transport
22
Hydrogen
Hurdles to the current widespread development of
hydrogen infrastructure with integral storage
No overt method of valuing stored energy
Currently natural gas producers do not charge
additionally for intermittent demand Hence the
poverty of Natural Gas storage scheme coming
forward
Price of carbon too low and renewables too small a
percentage of energy use to create a market for
storage
BUT the UK will require energy storage and hydrogen
(next to pumped storage) the only proven technology
23
Hydrogen how to proceed
Large schemes of co-production of hydrogen for
power generation and statictransport use avoids any
storage issues in the short term
Produce low carbon hydrogen principally for power
generation either from SMR +CCS
Waste derived hydrogen
Distribute swing production locally to establishing a
local market for hydrogen in the static and transport sectors (Cars buses etc)
boilers fuel cells gas fires and cookers
Thus proving hydrogenrsquos credentials as a low carbon
vector
24
Hydrogen how to proceed
Subsequently start to investigate time shifting of
local networks by both their interconnection and
inclusion of storage via Re-purposed natural gas or other hydrocarbon lines
New HP hydrogen lines
To existing redundant gas fields eg Cousland Scotlandrsquos first natural
gas field
redundant off shore
newly washed out salt caverns
25
Hydrogen how to proceed
In summary hydrogen is ideal for local connections Identify an enthusiastic LOCAL community (without gas)
Build LOCAL hydrogen production on the back of power
generation but with construction of local infrastructure for
domestic (1000 houses) commercial and transport use
Interconnect LOCAL networks to each other and storage to
provide a very level of community de-carbonisation with hydrogen
production operational either continuously (if nuclear or fossil
plus CCS) or following the vagaries of renewable power
26
This presentation was complied specifically for delivery to a private audience ndash it is strictly copyrighted to Kiwa Ltd
All of the information is or has been derived from freely available public domain sources
however specific permission has not been gained in all instances
27
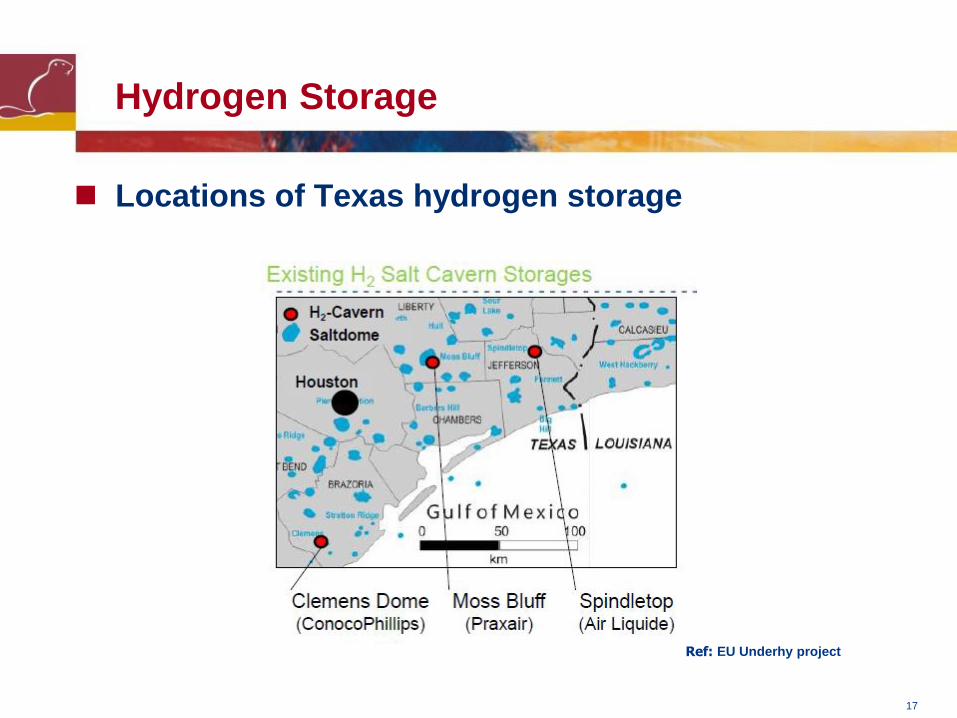
Hydrogen Storage
Locations of Texas hydrogen storage
Ref EU Underhy project
17
Hydrogen Storage
Ref httpprodsandiagovtechlibaccess-controlcgi2011114845pdf
18
Hydrogen Storage
Salt Cavern simplest and only commercially proven
Redundant Gas field will produce severe contamination of the hydrogen in early years
Aquifer may have significant technical problems with hydrogen loss
Unfortunately truly low cost hydrogen storage is
currently driven by geological chance and is strongly
dependent upon scale
19
Upper Lower
Methane Cap Cost $ $ 2500000000 $ 1000000000
Depreciation 20 yrs $ 125000000 $ 50000000
OampM 4 $ 100000000 $ 40000000
Return 8 $ 200000000 $ 80000000
Annual cost $ 425000000 $ 170000000
Annual storage kWh 278000000 278000000
Annual $kWh $ 0015 $ 0006
poundkWh pound 0010 pound 0004
Hydrogen BY 4 pound 0042 pound 0017
Indicative costs of storage
This is about 14 to 110 the lsquovaluersquo arising from the
intermittent use of biomass generation (ie
017pkWh)
The surest route to reducing energy production cost
is to increase operating hours of the producer andor
not restrict output
20
Siemens gasifier
HP electrolyser
CO2
Biomass gasifier
Underground
H2 store
Rutland plastics
Domestic Commercial Transport
Industry
Existing PE network
DC
H2
Hydrogen Supply and Use Chain
21
Ref for all but Germany httpwwwroads2hycom European Hydrogen Infrastructure Atlas J Perrin July 2007
Ref for Germany Germany - Taking the Fast Lane to Hydrogen Infrastructure Development P Schmidt August 2008
Ref Argonne National Laboratory
In summary the long distance transportation of
hydrogen is well proven and cost competitive
Hydrogen Analysis Resource Center
European Hydrogen Pipeline Miles by Country
Country Miles
Belgium 381
France 188
Germany 242
Italy 5
Netherlands 147
Sweden 11
Switzerland 1
United Kingdom 25
Total 1001
Hydrogen Transport
22
Hydrogen
Hurdles to the current widespread development of
hydrogen infrastructure with integral storage
No overt method of valuing stored energy
Currently natural gas producers do not charge
additionally for intermittent demand Hence the
poverty of Natural Gas storage scheme coming
forward
Price of carbon too low and renewables too small a
percentage of energy use to create a market for
storage
BUT the UK will require energy storage and hydrogen
(next to pumped storage) the only proven technology
23
Hydrogen how to proceed
Large schemes of co-production of hydrogen for
power generation and statictransport use avoids any
storage issues in the short term
Produce low carbon hydrogen principally for power
generation either from SMR +CCS
Waste derived hydrogen
Distribute swing production locally to establishing a
local market for hydrogen in the static and transport sectors (Cars buses etc)
boilers fuel cells gas fires and cookers
Thus proving hydrogenrsquos credentials as a low carbon
vector
24
Hydrogen how to proceed
Subsequently start to investigate time shifting of
local networks by both their interconnection and
inclusion of storage via Re-purposed natural gas or other hydrocarbon lines
New HP hydrogen lines
To existing redundant gas fields eg Cousland Scotlandrsquos first natural
gas field
redundant off shore
newly washed out salt caverns
25
Hydrogen how to proceed
In summary hydrogen is ideal for local connections Identify an enthusiastic LOCAL community (without gas)
Build LOCAL hydrogen production on the back of power
generation but with construction of local infrastructure for
domestic (1000 houses) commercial and transport use
Interconnect LOCAL networks to each other and storage to
provide a very level of community de-carbonisation with hydrogen
production operational either continuously (if nuclear or fossil
plus CCS) or following the vagaries of renewable power
26
This presentation was complied specifically for delivery to a private audience ndash it is strictly copyrighted to Kiwa Ltd
All of the information is or has been derived from freely available public domain sources
however specific permission has not been gained in all instances
27
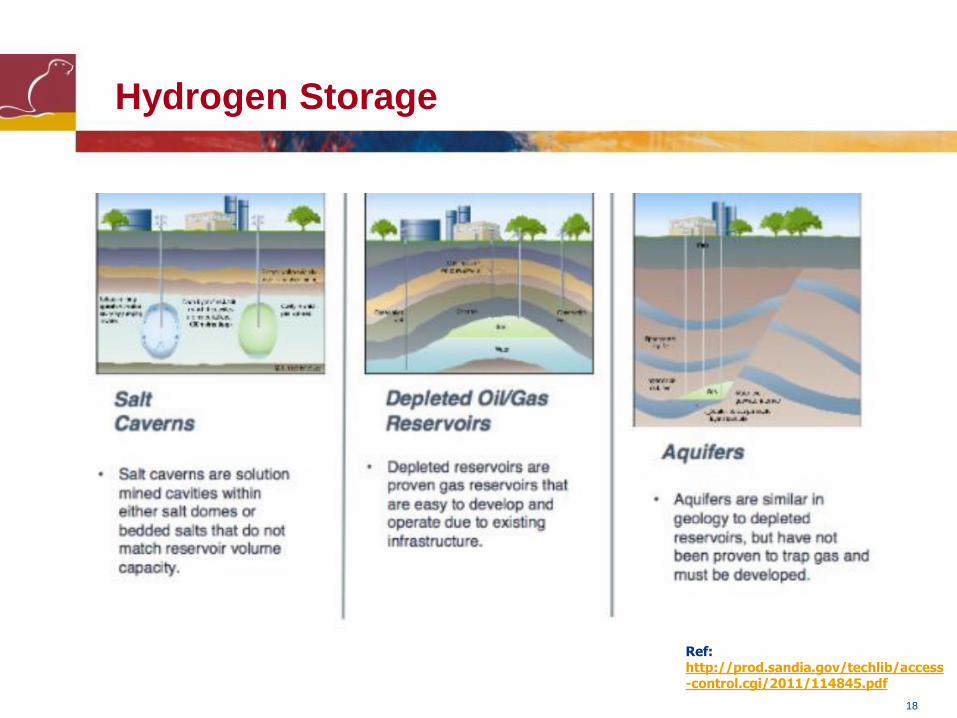
Hydrogen Storage
Ref httpprodsandiagovtechlibaccess-controlcgi2011114845pdf
18
Hydrogen Storage
Salt Cavern simplest and only commercially proven
Redundant Gas field will produce severe contamination of the hydrogen in early years
Aquifer may have significant technical problems with hydrogen loss
Unfortunately truly low cost hydrogen storage is
currently driven by geological chance and is strongly
dependent upon scale
19
Upper Lower
Methane Cap Cost $ $ 2500000000 $ 1000000000
Depreciation 20 yrs $ 125000000 $ 50000000
OampM 4 $ 100000000 $ 40000000
Return 8 $ 200000000 $ 80000000
Annual cost $ 425000000 $ 170000000
Annual storage kWh 278000000 278000000
Annual $kWh $ 0015 $ 0006
poundkWh pound 0010 pound 0004
Hydrogen BY 4 pound 0042 pound 0017
Indicative costs of storage
This is about 14 to 110 the lsquovaluersquo arising from the
intermittent use of biomass generation (ie
017pkWh)
The surest route to reducing energy production cost
is to increase operating hours of the producer andor
not restrict output
20
Siemens gasifier
HP electrolyser
CO2
Biomass gasifier
Underground
H2 store
Rutland plastics
Domestic Commercial Transport
Industry
Existing PE network
DC
H2
Hydrogen Supply and Use Chain
21
Ref for all but Germany httpwwwroads2hycom European Hydrogen Infrastructure Atlas J Perrin July 2007
Ref for Germany Germany - Taking the Fast Lane to Hydrogen Infrastructure Development P Schmidt August 2008
Ref Argonne National Laboratory
In summary the long distance transportation of
hydrogen is well proven and cost competitive
Hydrogen Analysis Resource Center
European Hydrogen Pipeline Miles by Country
Country Miles
Belgium 381
France 188
Germany 242
Italy 5
Netherlands 147
Sweden 11
Switzerland 1
United Kingdom 25
Total 1001
Hydrogen Transport
22
Hydrogen
Hurdles to the current widespread development of
hydrogen infrastructure with integral storage
No overt method of valuing stored energy
Currently natural gas producers do not charge
additionally for intermittent demand Hence the
poverty of Natural Gas storage scheme coming
forward
Price of carbon too low and renewables too small a
percentage of energy use to create a market for
storage
BUT the UK will require energy storage and hydrogen
(next to pumped storage) the only proven technology
23
Hydrogen how to proceed
Large schemes of co-production of hydrogen for
power generation and statictransport use avoids any
storage issues in the short term
Produce low carbon hydrogen principally for power
generation either from SMR +CCS
Waste derived hydrogen
Distribute swing production locally to establishing a
local market for hydrogen in the static and transport sectors (Cars buses etc)
boilers fuel cells gas fires and cookers
Thus proving hydrogenrsquos credentials as a low carbon
vector
24
Hydrogen how to proceed
Subsequently start to investigate time shifting of
local networks by both their interconnection and
inclusion of storage via Re-purposed natural gas or other hydrocarbon lines
New HP hydrogen lines
To existing redundant gas fields eg Cousland Scotlandrsquos first natural
gas field
redundant off shore
newly washed out salt caverns
25
Hydrogen how to proceed
In summary hydrogen is ideal for local connections Identify an enthusiastic LOCAL community (without gas)
Build LOCAL hydrogen production on the back of power
generation but with construction of local infrastructure for
domestic (1000 houses) commercial and transport use
Interconnect LOCAL networks to each other and storage to
provide a very level of community de-carbonisation with hydrogen
production operational either continuously (if nuclear or fossil
plus CCS) or following the vagaries of renewable power
26
This presentation was complied specifically for delivery to a private audience ndash it is strictly copyrighted to Kiwa Ltd
All of the information is or has been derived from freely available public domain sources
however specific permission has not been gained in all instances
27
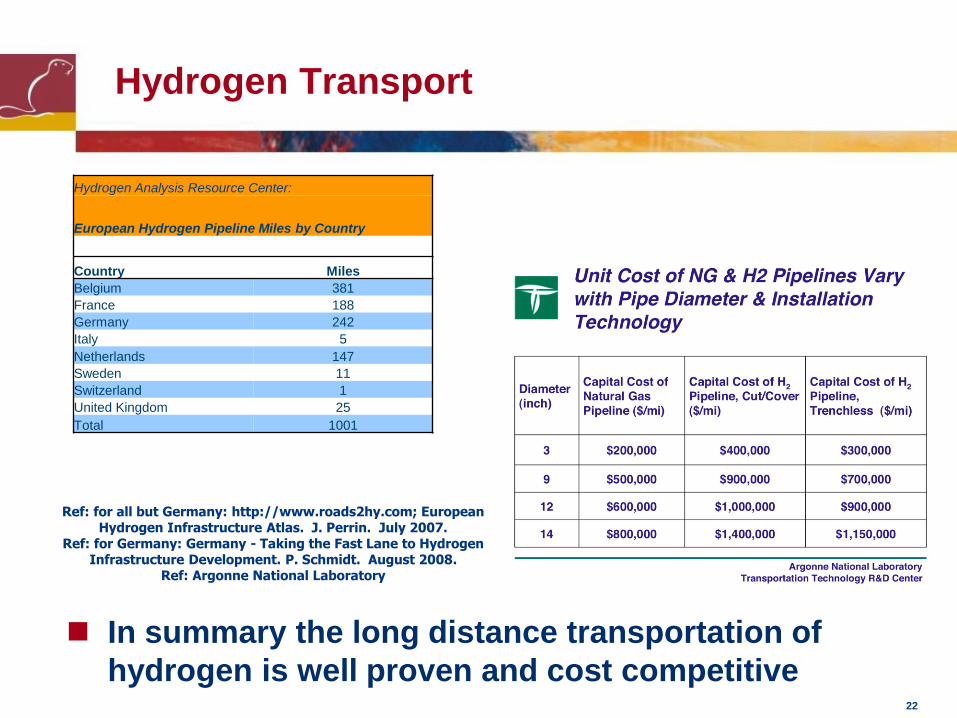

Hydrogen how to proceed
In summary hydrogen is ideal for local connections Identify an enthusiastic LOCAL community (without gas)
Build LOCAL hydrogen production on the back of power
generation but with construction of local infrastructure for
domestic (1000 houses) commercial and transport use
Interconnect LOCAL networks to each other and storage to
provide a very level of community de-carbonisation with hydrogen
production operational either continuously (if nuclear or fossil
plus CCS) or following the vagaries of renewable power
26
This presentation was complied specifically for delivery to a private audience ndash it is strictly copyrighted to Kiwa Ltd
All of the information is or has been derived from freely available public domain sources
however specific permission has not been gained in all instances
27

This presentation was complied specifically for delivery to a private audience ndash it is strictly copyrighted to Kiwa Ltd
All of the information is or has been derived from freely available public domain sources
however specific permission has not been gained in all instances
27