hydrogen stations for urban sites
TRANSCRIPT

Hydrogen Stations for Urban Sites
This presentation does not contain any proprietary, confidential, or otherwise restricted information
Sandia National Laboratories is a multi-mission laboratory managed and operated by National Technology and Engineering Solutions of
Sandia, LLC., a wholly owned subsidiary of Honeywell International, Inc., for the U.S. Department of Energy’s National Nuclear Security
Administration under contract DE-NA0003525.
Brian Ehrhart
Gabriela Bran-Anleu, Dongmei Ye, Ethan Hecht, Alice Muna, Ethan Sena, Chris LaFleur, Carl Rivkin (NREL)
Sandia National Laboratories
2019 DOE Hydrogen and Fuel Cells Program Annual Merit Review and Peer Evaluation Meeting
May 1, 2019SAND2019-2422 PE Project ID TA023

Overview
Barriers (Delivery)A. Lack of Hydrogen/Carrier and
Infrastructure Options AnalysisI. Other Fueling Site/Terminal OperationsK. Safety, Codes and Standards, Permitting
Timeline• Task start date: March 2017• Task end date: June 2019
Budget• FY19 DOE Funding: $125k
(carryover)• SNL: $100k• NREL: $25k
Partners• NREL
2

Relevance: Hydrogen Vehicle Fueling Infrastructure
• FCTO Target: Reduce footprint of liquid stations by 40% by 2022, relative to 2016 baseline
• Objective:
• Create compact gaseous and liquid hydrogen reference station designs appropriate for urban locations, enabled by design changes and near-term technology and fire code changes
Barrier from Delivery MYRDD Impact
A. Lack of Hydrogen/Carrier and Infrastructure Options Analysis
Provide assessment of station footprint possibilities using current technologies and show possibilities for urban siting
I. Other Fueling Site/Terminal Operations
Show how to reduce station footprint within or equivalent to current requirements
K. Safety, Codes and Standards, Permitting
Identify main drivers of station footprint and requirements that do not contribute to reduced risk
3
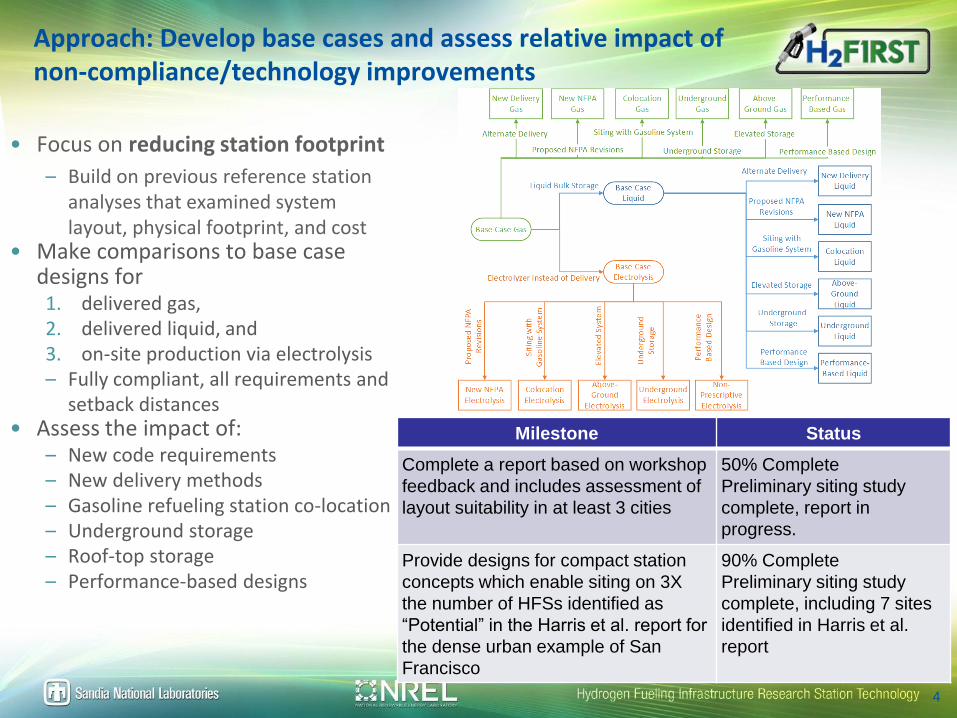
Approach: Develop base cases and assess relative impact of non-compliance/technology improvements
• Focus on reducing station footprint
– Build on previous reference station analyses that examined system layout, physical footprint, and cost
• Make comparisons to base case designs for1. delivered gas, 2. delivered liquid, and 3. on-site production via electrolysis– Fully compliant, all requirements and
setback distances• Assess the impact of:
– New code requirements– New delivery methods– Gasoline refueling station co-location – Underground storage– Roof-top storage– Performance-based designs
4
Milestone Status
Complete a report based on workshop
feedback and includes assessment of
layout suitability in at least 3 cities
50% Complete
Preliminary siting study
complete, report in
progress.
Provide designs for compact station
concepts which enable siting on 3X
the number of HFSs identified as
“Potential” in the Harris et al. report for
the dense urban example of San
Francisco
90% Complete
Preliminary siting study
complete, including 7 sites
identified in Harris et al.
report

Accomplishment: Specified components needed for three methods of hydrogen supply
• Compressor
– 25 kg/hr flow rate (constant 600 kg/day)
– Outlet pressure of 94.4 MPa (13,688 psi)
• Chillers
– 25.2 kW (7.2 tons) of refrigeration needed for each chiller
– Aluminum cooling block of 1,330 kg (0.49 m3) needed for each
• Cascade
– 10 cascade units, each containing 5 (1:1:3) pressure vessels
– Outlet flow rate 60 kg/hr to each dispenser
• Dispensing
– 4 fueling positions, 70 MPa, -40°C
Compressed Hydrogen
Liquid Hydrogen
On-site Hydrogen Production
PEM Electrolysis
Gas
Hydrogen Delivery Trucks
Liquid
Compressor1
Cascade System
Dispenser
AC Power
Water
Evaporator
5
1. Fueling stations supplied by LH2 may utilize cryopumps in the long-term. Compressors were assumed for simplicity of modeling, as the footprint associated with a pump is likely to be comparable.

Accomplishment: Delivery truck path (rather than setback distances) extends lot in two dimensions for base case gas
• Lot Size: 126 x 140 ft
• Total Area: 17,640 ft2
(Slightly larger than median of [small sample of] existing urban gas stations)
6

Accomplishment: Without delivery, on-site electrolysis base case has a small footprint
• PEM electrolyzer (nominal 2 MW)
– Approximate footprint 40 ft + 20 ft container
– Supplies 25 kg of GH2 at 20 bar to compressor
– Sized for 24 hour/day use
• GH2 low pressure buffer (gas reservoir)
– Used to smooth the flow from the electrolyzer to the compressor.
– 90 kg of usable hydrogen at full capacity (50 bar)
• No delivery truck
– Greatly reduces footprint
– Could reduce resiliency
• No direct way to delivery emergency hydrogen if electrolyzer is down
• Lot Size: 117 x 103 ft
• Total Area: 12,051 ft2
7

Accomplishment: Base case liquid footprint is large due to delivery truck and non-reducible 75 ft. air intakes setback
• Bulk liquid storage
– 800 kg, 11,299 L (2,985 gal)
• Lot size: 170 x 125 ft
• Total Area: 21,250 ft2
8

Accomplishment: Identified challenges in interpretation and implementation of NFPA 2 leading to code updates
Liquid setback distances
• Hybrid system (liquid-to-gas) analyzed as all-liquid system
– Recently changed in 2020 Ed. of NFPA 55
• Setback distances are different for most exposures, only a few able to be reduced
Gaseous setback distances
– Large system can have “bulk storage” before and after compressor
• Complexity of system makes selection of single pressure and diameter challenging
– Single system could take worst-case: maximum pressure from one area and maximum ID from other area
– Could also calculate setback distances for each system section and select largest
• This is specified in Appendix I, but nowhere else
Calculations for larger system may lead to unintended setback distances
9
Group Exposure Reducible Distance
1
1 Lot lines Yes 15 m (50 ft)
2 Air intakes 23 m (75 ft)
3 Operable openings in buildings 23 m (75 ft)
4 Ignition sources 15 m (50 ft)
25 Places of public assembly 23 m (75 ft)
6 Parked cars 1.7 m (25 ft)
3
7(a)(1) Sprinklered non-combustible building Yes 1.5 m (5 ft)
7(a)(2)(i) Unsprinklered, without fire-rated wall Yes 15 m (50 ft)
7(a)(2)(ii) Unsprinklered, with fire-rated wall Yes 1.5 m (5 ft)
7(b)(1) Sprinklered combustible building Yes 15 m (50 ft)
7(b)(2) Unsprinklered combustible building Yes 23 m (75 ft)
8 Flammable gas systems (other than H2) Yes 23 m (75 ft)
9 Between stationary LH2 containers 1.5 m (5 ft)
10 All classes of flammable and combustible liquids Yes 23 m (75 ft)
11 Hazardous material storage including LO2 Yes 23 m (75 ft)
12 Heavy timber, coal Yes 23 m (75 ft)
13 Wall openings 15 m (50 ft)
14 Inlet to underground sewers 1.5 m (5 ft)
15a Utilities overhead: public transit electric wire 15 m (50 ft)
15b Utilities overhead: other overhead electric wire 7.5 m(25 ft)
15c Utilities overhead: hazardous material piping 4.6 m (15 ft)
16 Flammable gas metering and regulating stations 4.6 m (15 ft)
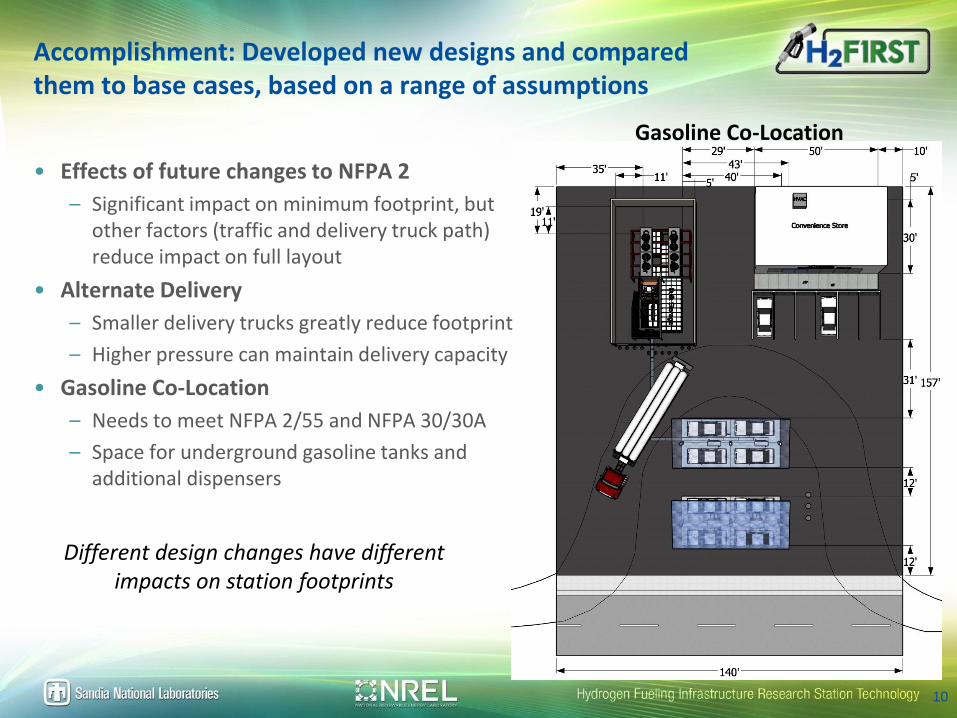
Accomplishment: Developed new designs and compared them to base cases, based on a range of assumptions
10
Gasoline Co-Location
• Effects of future changes to NFPA 2
– Significant impact on minimum footprint, but other factors (traffic and delivery truck path) reduce impact on full layout
• Alternate Delivery
– Smaller delivery trucks greatly reduce footprint
– Higher pressure can maintain delivery capacity
• Gasoline Co-Location
– Needs to meet NFPA 2/55 and NFPA 30/30A
– Space for underground gasoline tanks and additional dispensers
Different design changes have different impacts on station footprints

Accomplishment: Created elevated and underground storage station designs that reduce footprint
Underground Storage
• Direct burial
• Vault
Elevated Storage
• Setback distances still apply to line-of-sight
• Storage/equipment on building (e.g., convenience store) induce many new and difficult requirements
• Storage and equipment could be ~140 tons
• Seismic loading and aesthetics are issues
11
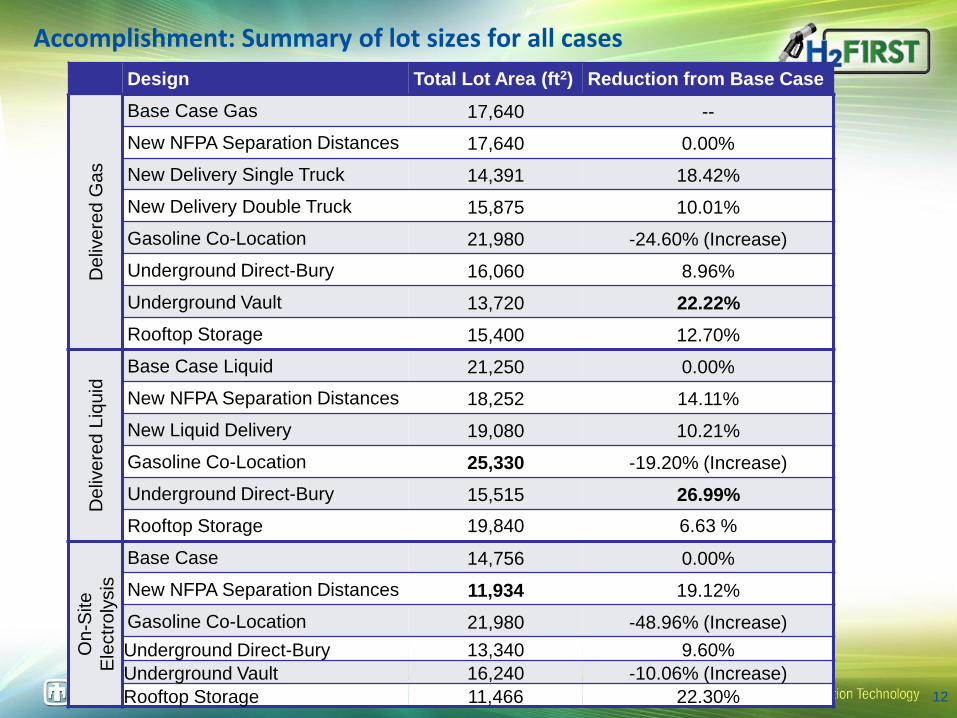
Accomplishment: Summary of lot sizes for all cases
Design Total Lot Area (ft2) Reduction from Base CaseD
eliv
ere
d G
as
Base Case Gas 17,640 --
New NFPA Separation Distances 17,640 0.00%
New Delivery Single Truck 14,391 18.42%
New Delivery Double Truck 15,875 10.01%
Gasoline Co-Location 21,980 -24.60% (Increase)
Underground Direct-Bury 16,060 8.96%
Underground Vault 13,720 22.22%
Rooftop Storage 15,400 12.70%
De
live
red
Liq
uid
Base Case Liquid 21,250 0.00%
New NFPA Separation Distances 18,252 14.11%
New Liquid Delivery 19,080 10.21%
Gasoline Co-Location 25,330 -19.20% (Increase)
Underground Direct-Bury 15,515 26.99%
Rooftop Storage 19,840 6.63 %
On-S
ite
Ele
ctr
oly
sis
Base Case 14,756 0.00%
New NFPA Separation Distances 11,934 19.12%
Gasoline Co-Location 21,980 -48.96% (Increase)
Underground Direct-Bury 13,340 9.60%
Underground Vault 16,240 -10.06% (Increase)
Rooftop Storage 11,466 22.30% 12

Progress: Approximated potential to site stations in dense urban areas
• Cities in five states (CA, CT, MD, MA, NY) were selected
• Total of 40 gasoline stations in these cities were analyzed
– Located using Google Maps
• The lot size (ft2) of each station was obtained from county property tax records
• The lot size was compared to generic station designs
• The number of available stations that can be converted into hydrogen stations were identified
13
Lot Area
(ft2)
Reduction
from Base
Case
Lot available
(out of 40)
[%]
Base Case Gas 17,640 -- 12 [30%]
New NFPA
Separation
Distances17,640 0.00% 12 [30%]
New Delivery
Single Truck14,391 18.42% 16 [40%]
New Delivery
Double Truck15,875 10.01% 16 [40%]
Gasoline Co-
Location21,980
-24.60%
(increase)8 [20%]
Underground
Direct-Bury16,060 8.96% 16 [40%]
Underground Vault 13,720 22.22% 18 [45%]
Rooftop Storage 15,400 12.70% 16 [40%]
Siting results on delivered gas designs
Illustrates potential effect of reduction in lot sizes
0 2 0 4 0 6 0 8 0 1 0 0
0
5 0
1 0 0
1 5 0
2 0 0
2 5 0
3 0 0
3 5 0
Y = 2 .5 0 6 *X
B u r ia l c o s t ($ /ft2
)
La
nd
un
it p
ric
e (
$/f
t2)
C a lifo rn ia
C o n n e c t ic u t
M a ry la n d
M a s s a ch u se tts
N e w Y o rk
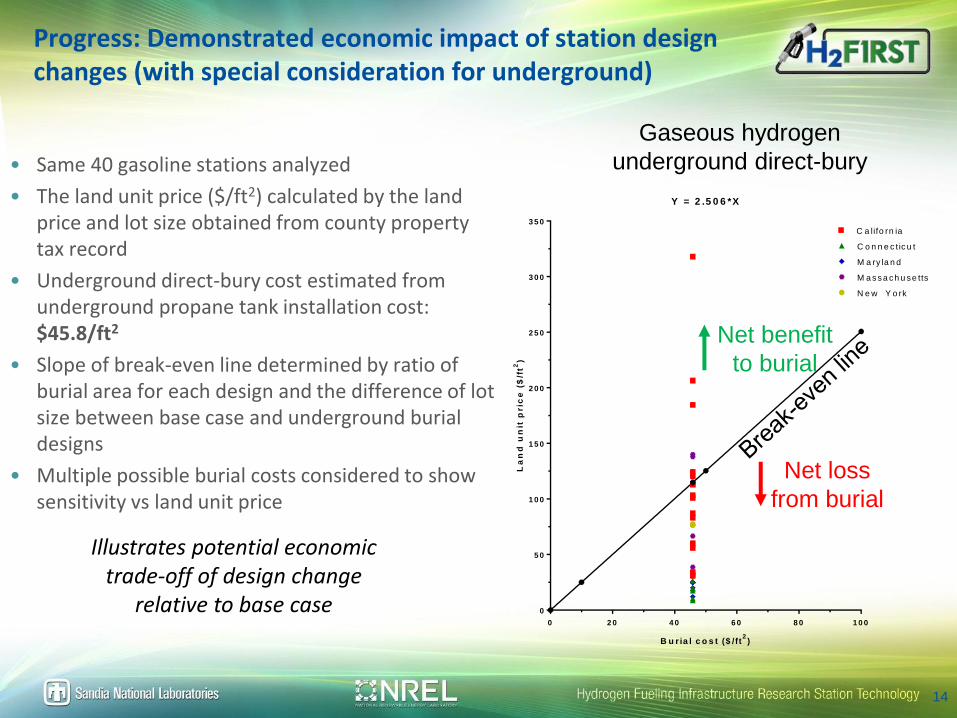
Progress: Demonstrated economic impact of station design changes (with special consideration for underground)
• Same 40 gasoline stations analyzed
• The land unit price ($/ft2) calculated by the land price and lot size obtained from county property tax record
• Underground direct-bury cost estimated from underground propane tank installation cost: $45.8/ft2
• Slope of break-even line determined by ratio of burial area for each design and the difference of lot size between base case and underground burial designs
• Multiple possible burial costs considered to show sensitivity vs land unit price
14
Gaseous hydrogen
underground direct-bury
Net benefit
to burial
Net loss
from burial
Illustrates potential economic trade-off of design change
relative to base case

Accomplishment: Performed real station co-location case study to show impact of site-specific features
15
• San Francisco station on a corner– Delivery truck path is simplified
• One vehicle entry/exit blocked by hydrogen system
– Still has 3 remaining
• Electrical cabinet was moved
• Air intakes on roof of convenience store would have to be moved
– Must be 38 feet from hydrogen system
Dispenser islandConvenience
store
Parking spaces
3 Entry/Exit path
Air pump and vacuum
Electrical cabinet
Delivery truck path
SF Site
Colocation
Generic
Co-location
Lot Size 18,000 ft2 21,000 ft2
Convenience
store size3,256 ft2 1,500 ft2
Dispenser island 2,668 ft2 1,600 ft2
Real-world locations will differ from generic designs

Remaining Barriers and Challenges
• Project challenge: Station design choices are based on code requirements for general hazards applicable to all stations
– Choice of basis affects resulting requirements
– Difference between alternative means and performance-based design
• Industry challenge: Current setback distances only take credit for fire-rated wall
– Other active or passive prevention or mitigation measures considered only on a case-by-case basis
– Project challenge: no way to incorporate these credits into generic station designs
• Project challenge: Siting and economics are specific to each particular location
– Illustrative comparisons are useful for showing trends
16

Future Work
• Remainder of FY19
– Finalize siting study, and economic comparisons
– Make reduced footprint designs based on alternate means
– Prepare final report
• Potential Future Work
– Incorporation of standardized alternative means into safety codes and standards
– Exploration of underground burial safety code requirements and justifications
17
Any proposed future work is subject to change based on funding levels

Response to Reviewer Comments
AMR 2018 Comment Response
The project team should consider starting with
a base case that focuses on what needs to be
done to build a hydrogen station on a greenfield
site and achieve the same footprint as a
gasoline station.
This is the approach taken by the project;
different design changes are compared to a
base case, and all of the resulting lot sizes are
compared to actual gasoline station sizes in the
siting study.
The level of impact would change very
significantly (in a positive direction) if the team
took an actual gasoline or greenfield site and
went through the same exercise.
Case study of San Francisco co-location station
shows how generic station designs will differ
from real-world designs, and how the same
hydrogen system could fit into a real-world co-
location station.
Instead of a national impact study, it is
suggested that the team focus specifically on
California and one state in the Northeast (the
most challenging one) – this may help narrow
efforts.
The siting study focused on cities in California,
New York, Massachusetts, Connecticut, and
Maryland; all of these states have large urban
populations and have signed an MOU to
promote hydrogen use.
The project team may want to consider
eliminating rooftop storage as an option and
focus all future efforts on underground storage.
Rooftop storage was retained as a cursory
comparison for completeness, but the potential
issues with this design are significant. Much
more effort was put into different underground
scenarios.
18
Collaborations
• H2FIRST itself is a SNL-NREL co-led, collaborative project and members of both labs contributed heavily to this project.
• To be as relevant and useful as possible, the project integrates input and feedback from many stakeholders, such as:
• H2USA’s Hydrogen Fueling Station Working Group
• California Fuel Cell Partnership
• California Energy Commission
• California Air Resources Board
• UC Berkeley
• Argonne National Lab
• H2 Logic
• Hydrogenics
• ITM Power
• Linde
• Nuvera
• PDC Machines
• Proton OnSite
• Siemens AG
• FirstElement
19

Summary
• Relevance and Impact
– Reduction of refueling station footprint identified by FCTO and H2USA as high priority
• Approach
– Comparison of different design changes to base cases quantifies impact
– Changes include NFPA 2 code changes, gasoline co-location, alternate delivery truck, underground storage, and risk-informed designs
• Accomplishments
– 600 kg/day stations completed for delivered gas, delivered liquid, and on-site electrolysis
– Footprints quantified for base cases, alternate delivery, upcoming fire code changes, underground and elevated storage, and gasoline co-location
– Real-world co-location case study on San Francisco gas station
• Progress
– Siting study in US cities in California and Northeast shows impact of station lot size changes
– Economic comparison shows trade-off trends for design changes over wide range of sensitivity
• Future Work
– Finalizing siting study and economic comparison
– Reduced footprint designs using alternate means
– Final report preparation
20
TECHNICAL BACK-UP SLIDES
21

Non-hydrogen station components have large impact on footprint
Texas DOT Road Design Manual
Assumptions and considerations:
• Delivery truck path
– Trucks must be capable of turning without reversing
– Corner lot not considered (entry and exit only on single lot side)
• Convenience store
– 50 x 30 ft
• Parking/Traffic Flow
– Convenience store parking
– Fueling positions
– UT Parking Lot Design Manual
• Kept consistent between designs
• System was idealized for comparison
– Other location-specific factors will also have large impact on footprint
22

Stakeholder feedback solicited from:
23
Name Representation
Kyle McKeown Linde
Amgad Elgowainy Argonne National Laboratory
Michael Ciotti Linde
Jonathan Zimmerman Sandia National Laboratories
Patricia Gharagozloo Sandia National Laboratories
Bikram Roy Chowdhury Sandia National Laboratories
David Farese Air Products
Jennifer Hamilton Frontier Energy/CaFCP
Jay Keller Zero Carbon Energy Solutions
Lucas White Air Products and Chemicals, Inc
Gerald Hayes Air Liquide
Lynne Kilpatrick Sunnyvale Public Safety
James Petrecky PDC Machines
Reid Larson Chart Industries
Kevin Harris Hexagon
Xuefang Li Shandong University, China
Matt Bray CARB
Sujin Wren Hydrogenics Corporation
Sebastian Serrato California Energy Commission
William Buttner NREL
Cory Kreutzer NREL
Lesley Stern CARB
Edgar Wolff-Klammer Underwriters Laboratories
Samuel Trompezinski Air Liquide
Michael Kashuba GoBiz

Alternative means
• Determine what performance criteria is applicable to each exposure.
– NFPA 2 Annex I Table I.2(c) and (d) were used to determine the performance criteria and the hazardous material scenario
• Get numerical values that can be use to determine the separation distances for each exposure
– Heat flux
– Hydrogen flammable concentrations
– Frequency of fatalities
Exposure Heat flux Notes
Personnel 1,577 W/m2 Threshold to which personnel with
appropriate clothing can be
continuously exposed. Used as the
“no harm” value.
Personnel 4,732 W/m2 Threshold for exposure to employees
for a maximum of 3 minutes.
Combustible
materials
20,000 W/m2 Minimum heat flux for the nonpiloted
ignition of combustible materials,
such as wood.
Non-
combustible
materials
25,237 W/m2 Threshold heat flux imposed by the
International Fire Code for
noncombustible materials.

Accomplishment: Minimum footprint determined from outdoor bulk gas setback distances
Different Exposures Have Very Different Setback Distances
Grp Description
1
a Lot lines
b Air intakes (HVAC, compressors, other)
c Operable openings in buildings and structures
d Ignition sources such as open flames and welding
2a Exposed persons other than those servicing the system
b Parked cars
3
a Buildings of noncombustible non-fire-rated construction
b Buildings of combustible construction
c Flammable gas storage systems above or below ground
d Hazardous materials storage systems above or below ground
e Heavy timber, coal, or other slow-burning combustible solids
fOrdinary combustibles, including fast-burning solids such as ordinary lumber, excelsior, paper, or combustible waste and vegetation other than that found in maintained landscaped areas
g Unopenable openings in building and structures
hEncroachment by overhead utilities (horizontal distance from the vertical plane below the nearest overhead electrical wire of building service)
i Piping containing other hazardous materials
jFlammable gas metering and regulating stations such as natural gas or propane
• Minimum Footprint– Hydrogen system only
• Based on pressure and ID of connecting piping
25

Accomplishment: Minimum footprint for outdoor bulk liquid differs significantly from gas
• Based on total amount of bulk liquid hydrogen
– Not pressure or diameter of piping
• Groups 1, 2, and 3 still exist, but setback distances are not grouped
Exposure Distance
1 Lot lines * 15 m (50 ft)
2 Air intakes 23 m (75 ft)
3 Operable openings in buildings 23 m (75 ft)
4 Ignition sources 15 m (50 ft)
5 Places of public assembly 23 m (75 ft)
6 Parked cars 1.7 m (25 ft)
7(a)(1) Sprinklered non-combustible building* 1.5 m (5 ft)
7(a)(2)(i) Unsprinklered, without fire-rated wall* 15 m (50 ft)
7(a)(2)(ii) Unsprinklered, with fire-rated wall* 1.5 m (5 ft)
7(b)(1) Sprinklered combustible building* 15 m (50 ft)
7(b)(2) Unsprinklered combustible building* 23 m (75 ft)
8 Flammable gas systems (other than H2)* 23 m (75 ft)
9 Between stationary LH2 containers 1.5 m (5 ft)
10 All classes of flammable and combustible liquids* 23 m (75 ft)
11 Hazardous material storage including LO2* 23 m (75 ft)
12 Heavy timber, coal* 23 m (75 ft)
13 Wall openings 15 m (50 ft)
14 Inlet to underground sewers 1.5 m (5 ft)
15a Utilities overhead: public transit electric wire 15 m (50 ft)
15b Utilities overhead: other overhead electric wire 7.5 m (25 ft)
15c Utilities overhead: hazardous material piping 4.6 m (15 ft)
16 Flammable gas metering and regulating stations 4.6 m (15 ft)
26