hydrogen solubility in amorphous silica at pressures up to 75 kbar
TRANSCRIPT
Hydrogen Solubility in Amorphous Silica at Pressures up to 75 kbarVadim S. Efimchenko,*,† Vladimir K. Fedotov,† Mikhail A. Kuzovnikov,† Andrey S. Zhuravlev,†
and Boris M. Bulychev‡
†Institute of Solid State Physics RAS, 142432 Chernogolovka, Moscow District, Russia‡Moscow State University, Vorob’evy gory, Moscow 119992, Russia
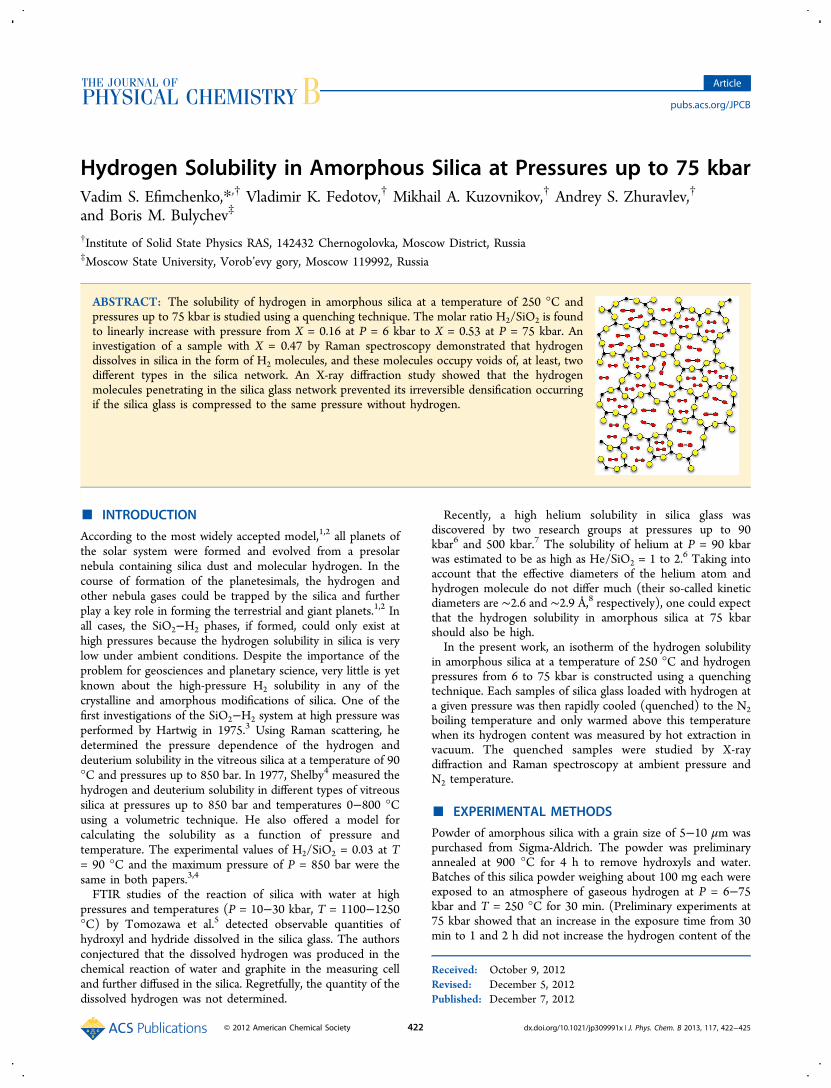
ABSTRACT: The solubility of hydrogen in amorphous silica at a temperature of 250 °C andpressures up to 75 kbar is studied using a quenching technique. The molar ratio H2/SiO2 is foundto linearly increase with pressure from X = 0.16 at P = 6 kbar to X = 0.53 at P = 75 kbar. Aninvestigation of a sample with X = 0.47 by Raman spectroscopy demonstrated that hydrogendissolves in silica in the form of H2 molecules, and these molecules occupy voids of, at least, twodifferent types in the silica network. An X-ray diffraction study showed that the hydrogenmolecules penetrating in the silica glass network prevented its irreversible densification occurringif the silica glass is compressed to the same pressure without hydrogen.
■ INTRODUCTION
According to the most widely accepted model,1,2 all planets ofthe solar system were formed and evolved from a presolarnebula containing silica dust and molecular hydrogen. In thecourse of formation of the planetesimals, the hydrogen andother nebula gases could be trapped by the silica and furtherplay a key role in forming the terrestrial and giant planets.1,2 Inall cases, the SiO2−H2 phases, if formed, could only exist athigh pressures because the hydrogen solubility in silica is verylow under ambient conditions. Despite the importance of theproblem for geosciences and planetary science, very little is yetknown about the high-pressure H2 solubility in any of thecrystalline and amorphous modifications of silica. One of thefirst investigations of the SiO2−H2 system at high pressure wasperformed by Hartwig in 1975.3 Using Raman scattering, hedetermined the pressure dependence of the hydrogen anddeuterium solubility in the vitreous silica at a temperature of 90°C and pressures up to 850 bar. In 1977, Shelby4 measured thehydrogen and deuterium solubility in different types of vitreoussilica at pressures up to 850 bar and temperatures 0−800 °Cusing a volumetric technique. He also offered a model forcalculating the solubility as a function of pressure andtemperature. The experimental values of H2/SiO2 = 0.03 at T= 90 °C and the maximum pressure of P = 850 bar were thesame in both papers.3,4
FTIR studies of the reaction of silica with water at highpressures and temperatures (P = 10−30 kbar, T = 1100−1250°C) by Tomozawa et al.5 detected observable quantities ofhydroxyl and hydride dissolved in the silica glass. The authorsconjectured that the dissolved hydrogen was produced in thechemical reaction of water and graphite in the measuring celland further diffused in the silica. Regretfully, the quantity of thedissolved hydrogen was not determined.
Recently, a high helium solubility in silica glass wasdiscovered by two research groups at pressures up to 90kbar6 and 500 kbar.7 The solubility of helium at P = 90 kbarwas estimated to be as high as He/SiO2 = 1 to 2.6 Taking intoaccount that the effective diameters of the helium atom andhydrogen molecule do not differ much (their so-called kineticdiameters are ∼2.6 and ∼2.9 Å,8 respectively), one could expectthat the hydrogen solubility in amorphous silica at 75 kbarshould also be high.In the present work, an isotherm of the hydrogen solubility
in amorphous silica at a temperature of 250 °C and hydrogenpressures from 6 to 75 kbar is constructed using a quenchingtechnique. Each samples of silica glass loaded with hydrogen ata given pressure was then rapidly cooled (quenched) to the N2boiling temperature and only warmed above this temperaturewhen its hydrogen content was measured by hot extraction invacuum. The quenched samples were studied by X-raydiffraction and Raman spectroscopy at ambient pressure andN2 temperature.
■ EXPERIMENTAL METHODS
Powder of amorphous silica with a grain size of 5−10 μm waspurchased from Sigma-Aldrich. The powder was preliminaryannealed at 900 °C for 4 h to remove hydroxyls and water.Batches of this silica powder weighing about 100 mg each wereexposed to an atmosphere of gaseous hydrogen at P = 6−75kbar and T = 250 °C for 30 min. (Preliminary experiments at75 kbar showed that an increase in the exposure time from 30min to 1 and 2 h did not increase the hydrogen content of the
Received: October 9, 2012Revised: December 5, 2012Published: December 7, 2012
Article
pubs.acs.org/JPCB
© 2012 American Chemical Society 422 dx.doi.org/10.1021/jp309991x | J. Phys. Chem. B 2013, 117, 422−425

samples.) The hydrogen was produced by thermal decom-position of aminoborane (NH3BH3) used as an internal H2source in the high-pressure cell. After the hydrogenation wascomplete, the batch was cooled to −196 °C to prevent thehydrogen losses in the course of further pressure release. Whennot in use, the samples thus prepared were stored in liquidnitrogen.The hydrogen content of the SiO2−H2 samples was
determined by hot extraction into a pre-evacuated volume inthe course of heating to 500 °C at a rate of 20 °C/min. Ramanscattering studies of the initial silica and the SiO2−H2 samplewith an H2/SiO2 ratio of X = 0.47 were performed with anEnSpectr Raman microscope. The microscope collects thespectra in a wide range of Raman shifts from 485 to 4770 cm−1
with a resolution of 6 cm−1, and therefore it is a convenient toolfor detecting all known molecules, with a high vibrationfrequency, which can be dissolved in silica. The light source wasa DPSS laser operated at 532 nm. The beam with a nominalpower of 8 mW was polarized and directed normal to the faceof the sample submerged in liquid nitrogen. The scattered lightwas collected with the same lens in backscattering geometryand resolved by an EnSpectr 532 spectrometer (EnSpectrmicroscope).The obtained SiO2−H2 samples were also studied by powder
X-ray diffraction at ambient pressure and 80 K using a SiemensD500 diffractometer equipped with a home-designed nitrogencryostat that permitted loading the powder samples withouttheir intermediate warming.
■ RESULTS AND DISCUSSIONHydrogen Solubility in Amorphous Silica. Figure 1
depicts thermal desorption curves of SiO2−H2 samples
quenched from different synthesis pressures. The samplessynthesized at minimal pressures (6 and 14 kbar) start evolvinghydrogen at T = −174 °C. The desorption curves of thesesamples have a stepwise shape demonstrating the most intensehydrogen release at temperature from T = −116 to −83 °C to+25 °C. The hydrogen release from the samples synthesized atmaximal pressures (56 and 75 kbar) begins on heating above T= −187 °C and also ceases at room temperature. In whole, thecurves in Figure 1 demonstrate a gradual decrease in thethermal stability of the SiO2−H2 solid solutions with increasing
hydrogen concentration. Such an effect is typical of all metalhydrides and hydrogen clathrates.9,10
The open circles in Figure 2 show the hydrogen content X ofthe quenched SiO2−H2 samples vs the pressure of synthesis. As
seen from Figure 2, the hydrogen content of the samplesapproximately linearly increases with pressure from X = 0.16 atP = 6 kbar to X = 0.53 at P = 75 kbar. To meet the requirementthat X = 0 at P = 0, the red solid straight line fitting theexperimental dependence at pressures from 6 to 75 kbar issmoothly turned downward at lower pressures. The solubility X= 0.05 at a pressure of 0.85 kbar read from this line is consistentwith the maximal molar ratio X = 0.03 at P = 0.85 kbar and T =90 °C obtained by Hartwig3 and shown by the solid circle.The solid blue curves in Figure 2 represent the pressure
dependences of the upper and lower limits on the heliumsolubility in silica glass estimated in ref 6 (the solubility was notmeasured experimentally). As one can see, the He/SiO2 ratiocan reach as much as 0.8 to 2.2 at a helium pressure of 75 kbar.The conventional model of void-size distribution11 predicts thatin silica glass there are only about 0.1 voids per SiO2 formulaunit accessible for He atoms with the kinetic diameter of ∼2.6Å.12 According to ref 6, a much larger number of He atoms canbe “...continuously stacked in three-dimensionally connectedvoids, because voids in SiO2 glass may not be isolated...”. Thekinetic diameter of a H2 molecule equals ∼2.9 Å.8 It is largerthan the diameter of a He atom, and the hydrogen moleculescan occupy a smaller number of about 0.05 voids per SiO2 unit(these are the voids inside the six-membered rings of silica).4
Similar to the He atoms, most H2 molecules dissolved in silicaglass under high pressure should therefore occupy the“connected voids” proposed in ref 6. This suggests that theH2 molecules in our SiO2−H2 samples should have occupiedthe sites of, at least, two different types.
Raman Spectroscopy. A Raman spectrum collected fromthe sample synthesized at P = 56 kbar and T = 250 °C andhaving a molar ratio of H2/SiO2 = 0.47 is shown in Figure 3. Inthe range of Raman shifts below ∼4000 cm−1, this spectrumvirtually coincides with the spectrum of the initial silica glass:
• The peak at ∼600 cm−1 labeled D2 is due to thebreathing modes of the three-membered SiO2 rings;
Figure 1. Thermal desorption curves of SiO2−H2 samples quenchedfrom different synthesis pressures. The curves a labeled by thepressures of the sample synthesis.
Figure 2. Pressure dependence of the hydrogen and helium solubilityin silica glass. The red solid line fits the experimental points ofhydrogen solubility (open circles) at a temperature of 250 °C. Thesolid black circle indicates the hydrogen solubility at 90 °C determinedin ref 3. The solid blue lines show the upper and low boundaries of thehelium solubility in silica glass estimated in ref 6.
The Journal of Physical Chemistry B Article
dx.doi.org/10.1021/jp309991x | J. Phys. Chem. B 2013, 117, 422−425423

other vibrational bands of SiO2 are not seen because ofthe strong background luminescence arising at the lowmeasuring temperature of −196 °C.
• The strong peak at 2329 cm−1 is due to the stretchingmodes of N2 molecules in the ∼50 μm layer of liquidnitrogen adjacent to the sample surface and locatedinside the focal spot of the laser beam.
• The weak peak at 3442 cm−1 results from the OHstretching vibration modes. Such a peak was alsoobserved in the Raman spectra of the initial SiO2powder. The presence of this peak in the Raman spectraof the hydrogenated sample is therefore due to theincomplete removal of the hydroxyls and water from theinitial silica glass by its preliminary annealing at 650 °C inair.
The peaks at 4168 and 4374 cm−1 are only intrinsic to thespectrum of the hydrogenated silica. The peak at 4168 cm−1 isclose to the Q1(0) peak at 4161 cm−1 of the stretching modesof H2 molecules in a hydrogen gas.13 A peak at a slightly lowerfrequency of 4142 cm−1 was earlier observed in the Ramanspectrum of hydrogenated amorphous silica with H2/SiO2 =0.03, and it was ascribed to the vibrational modes of H2molecules3 occupying voids in the silica glass network andbind only weakly to the silica. At the same time, as was noticedin ref 3, the weak interactions of the H2 molecules with thewalls of the voids restricted the rotational freedom of themolecules, so that no hydrogen rotational modes were seen inthe Raman spectra. No peaks that could be attributed to H2rotational modes are seen in the spectrum of our SiO2−H2sample with a much higher hydrogen content as well (Figure3).The strongest peak in Figure 3 is the peak at 4374 cm−1.
Such a peak was not present in the Raman spectra of thesamples of hydrogenated silica glass with H2/SiO2 ≤ 0.03studied earlier,3 and its frequency much exceeds the highestobserved stretching frequency ∼4280 cm−1 of the hydrogenmolecule in solid hydrogen compressed to a pressure of 350kbar at T = 5 K.14 On the other hand, substances withresonance vibrations at 4374 cm−1 are not known; therefore, wecan only conjecture that the 4374 cm−1 peak is due to thestretching vibrations of the H2 molecules occupying the voidsother than those occupied by the molecules vibrating at 4168cm−1. Presumably, these are the “connected voids” proposed inref 6 in order to explain the large solubility of He in amorphoussilica. The locations and shapes of the “connected voids” are
not yet identified, but they should obviously be smaller, at least,in some directions, than the largest individual voids that canonly give room to the H2 molecules according to the standardmodel.4 Consequently, the H2 molecules stacked in the“connected voids” should interact stronger with their wallsthat manifests itself in the increase in the H2 vibrationalfrequency.On the basis of the said above, it is reasonable to assume that
the peak at 4168 cm−1 in Figure 3 corresponds to Xv ≈ 0.05 ofthe H2 molecules occupying the largest individual voids (mostlythose inside the six-membered rings of silica),4 while the peakat 4374 cm−1 stems from the remaining Xcv molecules locatedin the “connected voids”. From the intensity ratio I4374/I4168 ≈8 of these peaks, one can roughly estimate that Xcv ≈ 8Xv ≈ 0.4.The value of Xv + Xcv ≈ 0.45 thus estimated agrees with theexperimental value of the total hydrogen content X = 0.47(3) ofthe SiO2−H2 sample studied by Raman spectroscopy.As seen from Figure 3, the width of the 4168 and 4374 cm−1
peaks is much less than the distance between them. Thissuggests that most voids in amorphous silica incorporating H2molecules under high pressure can roughly be divided into twodifferent groups, and the scatter in the shapes, sizes, and otherdeterminative properties of the voids within each group is muchsmaller than the difference in these properties of the voids fromdifferent groups.
X-ray Diffraction. Figure 4 compares the structure factorsS(Q) of the initial silica glass, the silica glass loaded with
hydrogen to X = 0.53 at a hydrogen pressure of 75 kbar and T= 250 °C, and also the silica glass exposed to the same pressureand temperature without hydrogen (in Teflon as the pressuretransmitting medium) and quenched to the N2 temperature. Asseen from Figure 4, the positions of the first sharp diffractionpeak (FSDP) for the initial and hydrogenated samples coincideat Q = 1.55 Å−1. The FSDP position of the sample exposed to P= 75 kbar and T = 250 °C without hydrogen is Q = 1.78 Å−1.The observed shift of the FSDP by ΔQ = 0.23 Å−1 in the silicaglass subjected to high pressure stems from the pressure-induced reduction of the ring sizes and a collapse of void spacesin the silica network.15 The absence of such a shift in thesample exposed to the same pressure and temperature in ahydrogen atmosphere suggests that the hydrogen penetrated in
Figure 3. Raman spectra of the SiO2−H2 sample synthesized at P = 56kbar and T = 250 °C.
Figure 4. Structure factor, S(Q), of the SiO2−H2 sample synthesized atP = 75 kbar and T = 250 °C (red solid line) in comparison with S(Q)of the sample of silica glass exposed to the same pressure andtemperature without hydrogen (blue dashed line) and the initial silicaglass (black dotted line). Cu Kα radiation, ambient pressure, T = 85 K.
The Journal of Physical Chemistry B Article
dx.doi.org/10.1021/jp309991x | J. Phys. Chem. B 2013, 117, 422−425424

the voids should have protected them from contracting. Asimilar effect of preventing the voids in amorphous silica fromcontracting at high helium pressures due to their filling with Heatoms was earlier observed and thoroughly discussed in refs 6and 7.The behavior of silica glass compressed in diamond anvil
cells up to ∼190 kbar at room temperature was studied in ref 7by in-situ X-ray diffraction and Raman spectroscopy usinghelium and hydrogen as the pressure-transmitting medium andalso without such a medium. In agreement with earlier results,6
the FSDP position in the X-ray patterns of the silica glass inhelium was nearly pressure-independent, thus demonstratingthat the helium atoms were likely to enter the voids in the glass.Compressing silica glass in hydrogen resulted in approximatelythe same strong shift of FSDP to higher frequencies as in thecase of using no pressure-transmitting medium. On the basis ofthis result, the authors of ref 7 concluded that, in contrast tohelium, hydrogen cannot dissolve in silica glass in a largeamount because of the larger kinetic diameter of H2 molecules(2.9 Å8) compared to that of He atoms (2.6 Å12).This conclusion actually predicts that concentrated hydrogen
solutions in silica glass cannot be formed at any pressure andtemperature and therefore contradicts our experimental resultsdemonstrating that at a pressure of 75 kbar the H2 solubility insilica glass reaches a value of H2/SO2 ≈ 0.5, which is similar tothe estimated He solubility He/SO2 ≈ 0.8−26 (see Figure 2). Itcan also be added that the He solubility in silica glass at highpressures has never been measured experimentally, so thedifference between the He and H2 solubilities can even appearsmaller. We think that the absence of any detectable H2solubility in silica glass in the high-pressure experiments ofref 7 was a result of the low diffusion rate of hydrogen at roomtemperature. In fact, the diffusion coefficient for H2 moleculesin silica glass at room temperature is D = 1 × 10⁻¹¹ cm2/s,16
which is by 3 orders of magnitude lower than D = 2.4 × 10⁻⁸
cm2/s for He atoms.17 At the temperature of 250 °C used inthe present work, the H2 diffusion coefficient in silica glass risesto a value of D = 1.9 × 10⁻⁸ cm2/s,16 close to that for the Hecoefficient at room temperature, and the concentrated SiO2−H2 solid solutions are easily formed.
■ CONCLUSIONSThe hydrogen solubility in amorphous silica at pressures up to75 kbar and temperature 250 °C has been investigated for thefirst time. The composition study of the samples, hydrogenatedunder pressure and quenched to the liquid nitrogen temper-ature, revealed a linear dependence of the molar ratio H2/SiO2versus synthesis pressure, from X = 0.16 at P = 6 kbar to X =0.53 at P = 75 kbar. A Raman study of the sample with X = 0.47showed that the hydrogen is dissolved in the form of H2molecules, which occupy at least two different types of voids inthe amorphous silica network. The H2 molecules occupying thevoids of the first type (most likely, inside the six-memberedrings of silica) and of the second type (not identified yet) havethe vibration stretching bands at 4168 and 4374 cm−1,respectively. Judging by the ratio of integral intensities ofthese bands, the great majority (∼90%) of the dissolvedhydrogen molecules are located in the voids of the second, yetunidentified type. Also, our X-ray diffraction studies showedthat the hydrogen molecules penetrated in the silica glassnetwork at a hydrogen pressure of 75 kbar prevented thesample from the significant irreversible densification occurringin the case of compressing the silica glass to the same pressure
without hydrogen. A similar effect was earlier observed in situ athelium penetrations in the silica glass.6,7
■ AUTHOR INFORMATIONCorresponding Author*Phone +7 906 495 24027; Fax +7(496) 522 8160; [email protected] ContributionsThe manuscript was written through contributions of allauthors. All authors have given approval to the final version ofthe manuscript. All authors contributed equally.NotesThe authors declare no competing financial interest.
■ ACKNOWLEDGMENTSThe authors thank Dr. Vladimir S. Balitsky for his commentsand useful discussions. The work was supported by Grant No.12-02-00871 from the Russian Foundation for Basic Researchand by the Program “Elementary Particle Physics, FundamentalNuclear Physics and Nuclear Technologies” of the RussianAcademy of Sciences.
■ REFERENCES(1) Montmerle, T.; Augereau, J. C.; Chaussidon, M.; et al. Earth,Moon, Planets 2006, 98, 39−95.(2) Safronov, V. S. Evolution of the Protoplanetary Cloud andFormation of the Earth and the Planets; Nauka Press: Moscow, USSR,1969; Trans. NASA TTF 677, 1972.(3) Hartwig, C. M. J. Appl. Phys. 1976, 47, 956−959.(4) Shelby, J. E. J. Appl. Phys. 1977, 48, 3387−3394.(5) Li, C. Y.; Price, J.; Tomozawa, M.; Watson, E. B. J. Non-Cryst.Solids 2011, 357, 2081−2085.(6) Sato, T.; Funamori, N.; Yagi, T. Nat. Commun. 2011, 2, 345−350.(7) Shen, G.; Meia, Q.; Prakapenka, V. B.; et al. Proc. Natl. Acad. Sci.U. S. A. 2011, 108, 6004−6007.(8) Breck, D. W. Zeolite Molecular Sieves: Structure, Chemistry andUse; Wiley: NewYork, 1974.(9) Kirchheim, R. Acta Metall. 1982, 30, 1069−1078.(10) Efimchenko, V. S.; Kuzovnikov, M. A.; Fedotov, V. K.; et al. J.Alloys Compd. 2011, 509S, S860−S863.(11) Shackelford, J. F.; Masaryk, J. S. J. Non-Cryst. Solids 1978, 30,127−139.(12) Shelby, J. E. J. Appl. Phys. 1976, 47, 135−139.(13) Herzberg, G. Infrared and Raman Spectra; Van Nostrand:Princeton, NJ, 1945.(14) Wijngaarden, R. J.; Lagendijk, A.; Silvera, I. F. Phys. Rev. B 1982,26, 4957−4962.(15) Inamura, Y.; Katayama, Y.; Utsumi, W.; Funakoshi, K. Phys. Rev.Lett. 2004, 93, 015501−015504.(16) Shang, L.; Chou, I.; Lu, W.; Burruss, R. C.; Zhang, Y. Geochim.Cosmochim. Acta 2009, 73, 5435−5443.(17) Barrer, R. M.; Vaughan, D. E. W. Trans. Faraday Soc. 1967, 63,2275−2290.
The Journal of Physical Chemistry B Article
dx.doi.org/10.1021/jp309991x | J. Phys. Chem. B 2013, 117, 422−425425