hydrogen production from irradiated aluminum hydroxide and
TRANSCRIPT
HAL Id: tel-01531842https://tel.archives-ouvertes.fr/tel-01531842
Submitted on 2 Jun 2017
HAL is a multi-disciplinary open accessarchive for the deposit and dissemination of sci-entific research documents, whether they are pub-lished or not. The documents may come fromteaching and research institutions in France orabroad, or from public or private research centers.
L’archive ouverte pluridisciplinaire HAL, estdestinée au dépôt et à la diffusion de documentsscientifiques de niveau recherche, publiés ou non,émanant des établissements d’enseignement et derecherche français ou étrangers, des laboratoirespublics ou privés.
Hydrogen production from irradiated aluminumhydroxide and oxyhydroxide
Josiane Kaddissy
To cite this version:Josiane Kaddissy. Hydrogen production from irradiated aluminum hydroxide and oxyhydroxide. Ma-terial chemistry. Université Paris Saclay (COmUE), 2016. English. �NNT : 2016SACLS253�. �tel-01531842�

NNT : 2016SACLS253
Thèse de doctorat
de
L’Université Paris-Saclay
préparée au
“CEA SACLAY ”
ECOLE DOCTORALE N° 571
2MIB
Spécialité de doctorat Chimie
Par
Josiane Kaddissy
Titre de la thèse
Hydrogen production from irradiated aluminum hydroxide and oxyhydroxide
Thèse présentée et soutenue à «Saclay», le «03 Octobre 2016»:
Composition du Jury:
M, Mostafavi, Mehran Professeur, LCP, Orsay Président
M, Laverne, Jay Professeur, Université de Notre Dame, USA Rapporteur
M, Balanzat, Emmanuel Directeur de recherche, CIMAP, Caen Rapporteur
M, Saffré, Dimitri Docteur Ingénieur, AREVA Examinateur
M, Renault, Jean-Philippe Chercheur CEA, CEA, Saclay Directeur de thèse
M, Esnouf, Stéphane Chercheur CEA, CEA, Saclay Encadrant de thèse


Acknowledgment
As I was doing my thesis the Parable of the Talents always inspired me to go further
and further with my work and never give up and I would like to share it with you:
14 “For it will be like a man going on a journey, who called his
servants and entrusted to them his property. 15 To one he gave
five talents, to another two, to another one, to each according to
his ability. Then he went away. 16 He who had received the five
talents went at once and traded with them, and he made five
talents more. 17 So also he who had the two talents made two
talents more. 18 But he who had received the one talent went
and dug in the ground and hid his master's money.19 Now after a
long time the master of those servants came and settled accounts
with them. 20 And he who had received the five talents came
forward, bringing five talents more, saying, ‘Master, you
delivered to me five talents; here, I have made five talents
more.’ 21 His master said to him, ‘Well done, good and faithful
servant.[c] You have been faithful over a little; I will set you over
much. Enter into the joy of your master.’22 And he also who had
the two talents came forward, saying, ‘Master, you delivered to
me two talents; here, I have made two talents more.’23 His master
said to him, ‘Well done, good and faithful servant. You have been
faithful over a little; I will set you over much. Enter into the joy
of your master.’ 24 He also who had received the one talent came
forward, saying, ‘Master, I knew you to be a hard man,
reaping where you did not sow, and gathering where you
scattered no seed, 25 so I was afraid, and I went and hid your talent
in the ground. Here, you have what is yours.’26 But his master

answered him, ‘You wicked and slothful servant! You knew that I
reap where I have not sown and gather where I scattered no
seed? 27 Then you ought to have invested my money with the
bankers, and at my coming I should have received what was my
own with interest. 28 So take the talent from him and give it to him
who has the ten talents. 29 For to everyone who has will more be
given, and he will have an abundance. But from the one who has
not, even what he has will be taken away. 30 And cast the
worthless servant into the outer darkness. In that place there will
be weeping and gnashing of teeth.’ Matthew 25:14-30
God gave each of us different talents and abilities. He expects us to develop them.
These talents have to be used so others will be able to see them and benefit from them
and glorify the heavenly father.
First and above all, I would like to thank God, the first and the last, whose blessings
gave me the strength and patient to go all the length of this road. Thank you for being
the light that shines in every darkest moment.
I would like to express my sincere gratitude to my director Jean-Philippe Renault for
his scientific advises and fruitful discussions along with his supervision through the
three years. As well as my supervisor Stephane Esnouf who taught me the first glances
of defects created inside the solids and tried to transfer all his precious knowledge on
electron paramagnetic resonance. I would like to thank them both for accepting me to
do this thesis and for their guidance and help especially when I was writing the
manuscript and preparing my defense. Thank you for your patience.
Besides my advisors, I would like to thank the rest of my thesis committee: Prof.
Mehran Mostafavi, Prof. Jay laVerne, and Dr. Emanuel Balanzat, for their insightful
comments and encouragements, but also for the hard questions which incented me to
widen my research from various perspectives. Thank you for appreciating my work and
giving me back my self-confidence. I could not have imagined having a better
committee for my Ph.D defense, thank you for accepting to judge this work.
I would like to thank AREVA, for the financial support and also for all the technical
help. I am so grateful to Dimitri Saffre who was always present to answer any question
and who shared all his practical knowledge with me. It was a pleasure to work with

you. Toby Fares also helped us with fruitful discussions in the first year and I am so
grateful.
My sincere thanks also go to Delphine Durand for training me on many gas
spectroscopies and for trusting me to conduct all my analysis from the very beginning,
thank you Delphine! I am also grateful to Vincent Dauvois for his pertinent discussions
and for the organization he put inside LRMO laboratory to keep a perfect work
environment. Thank you for waiting for me sometimes at night in order to finish my
analysis without keeping me alone in the lab. I would like to thank Jean-Luc for his
technical help sometimes and also for sharing his sense of humor I would like to thank
all the LRMO especially Muriel who was always ready to answer any question and had
a smile always drawn on her face. Thank you all for receiving me in your laboratory
and allowing me to use research facilities, please consider all my deepest thanks.
Without the precious support of Eddy Foy at the LAPA in XRD analysis, it would not
be possible to conduct this research. Thank you for always being here for help, for your
clear explanation, your time and your kindness. I would like to thank Mickael Bouhier
for Raman tests and for his gentleness and friendship and for Enrique Vega for SEM
analysis that were also performed at the LAPA. I would like to express my gratitude to
Michel Tabarant at SEARS for his ICP-AES analysis and for his efficiency and
kindness. I should like to extend my special thanks to Romain Dagneli at SECR for
BET measurements and support. My thanks also to Florence Porcher at the LLB for the
neutron diffraction tests and for initiating me on Rietveld structure refinement. I am so
grateful to Jocelyne Leroy at LICSEN for XPS analysis and for the time spent together
discussing and trying to understand the alteration induced after irradiation. I would like
to thank Marie-Noelle Amiot for receiving us to conduct EPR analysis at CEA. My
deepest thanks go for Bruno Boizot who let us have enough time to analyze our samples
in LSI- polytechnique. Thank you so much!
My deepest gratitude to my sister in law. Sahar Mouawad Kaddissy who helped me
explain my set up and vessels by keeping nice Autocad and 3ds Max drawings in
chapter 3.
In my daily work I have been blessed with a friendly and cheerful group. I would like
to thank them all starting with Serge Pin that was always here for help and wise advices,
Sophie le Caer, that had always encouraging words and pertinent scientific advices,
Aurelie my special colleague and dear friend, I can’t imagine the thesis passing without
you, thank you for always being here and listening to me and for making me laugh
when needed louzzzz, you have a special place in my heart! Maxime thank you for your

friendship and for your jokes that always helped when I was stressed, I would like to
thank you also for your open spirit and nice collaboration, we never fought on apparatus
can you imagine? Laurent and your special humour, I appreciate your friendship, as
well as David, Raj, Sandrine, Mickael, Gerarld, Fanny, Guangze, Imene, Imane, Dorra,
Elodie, Eleonora, Daniel, Alexy, Anthoine, Yun Yun and Paul.
CEA was not only the site where I perfomed my PhD but also where I met amazing
people I will never forget in my life especially Abed el Karim el Omar and Ibtihel
Denden. Karim, thank you for initiating me to the basics of radiation chemistry and
helping me with my irradiation experiments and also with OriginLab, thank you for
your patience and for being a true brother, I am blessed and lucky to have a peaceful
friend like you. Ibtihel, thank you for being a true sister in France, always careful and
helpful and thank you for all your scientific advices and wise discussions you and
Karim will always be not only dear friends but also trustworthy scientists.
Other past and present friends contributed both consciously and unconsciously to the
achievement of the PhD especially my transition phase at Poitiers and the precious
friends I met there and were always supporting me, El mekhtar Dya who was always
helpful and supportive, Nissrine who showed with time what a true friend is, Joseph,
Zeinab, Mohammad, Nancy, Jocelyne, Odissa, Soumaya, Haidar, and Claude Thank
you! I would like to thank some true friends that were supporting me even when the
wi-fi was week, thank you Nayla Tarabay and Mazloum for all your advices and love
and Eliane for your belief and encouragement. Roua, Marc, Habib,Joelle, Sarah, Laure,
Tarek and Stephane thank you!
Finally, I would like to thank my parents, thank you for your faith in me and for always
supporting me throughout all my studies and giving me good ear even after midnight
and even when you were so tired. Gisele, querida hermanita you’ve always been my
advisor since my childhood, I am so proud of you and lucky to have you, thank you for
all the effort you’ve done to make me be a better person. Gracias hermanita! I would
like to thank my two brothers Gerard and Bernard and my sisters in law Sahar and
Monie for always being here for me, checking on me, visiting me and believing in me!
I love you my dear family and you have to know that without you I would not have
done what I did until today.
I am especially grateful for Johnny Nawfal who was not only my boyfriend but also
my best friend who watched over me and guided my choses all over these years. Thank
you for listening to all my problems and trying to solve them even when yours were

bigger! You were always supporting me and your motivation and ambitions were
contaminants, I am so lucky to have you and proud for all what I’ve learnt from you
throughout the years. Thank you for your eternal love. Gracias amorcito por todo!

Résumé
Production de dihydrogène par irradiation d’hydroxyde et
d’oxyhydroxide d’aluminium
Les travaux de cette thèse porte sur la compréhension des mécanismes de production
d’hydrogène par radiolyse de l’hydroxyde et de l’oxohydroxide d’aluminium (Al(OH)3
et AlOOH respectivement). Cette connaissance est fondamentale pour la détermination
des sources de dihydrogène provenant des phases hydratées présentes à la fois dans les
emballages de transport des combustibles usés et les colis de stockage.
Dans l’industrie électronucléaire l’usage de l’aluminium est fréquent. En particulier,
AREVA a développé des emballages spécifiques, TN®12 ou TN®13, pour le transport
terrestre et maritime des assemblages de combustible. La corrosion aqueuse (eau
liquide ou vapeur) des surfaces d’aluminium conduit à la formation d’hydroxydes
d’aluminium. Les hydroxydes d'aluminium présentent un polymorphisme assez riche.
Dans cette thèse on s’est intéressé à la Bayerite (Al(OH)3) et à la Boehmite (AlOOH)
sous la forme de poudres nanométriques fournies par Sasol, Allemagne. En aval, cette
thèse s’ancre dans la problématique de la sureté lors du stockage/entreposage et lors du
transport de matériels irradiants, à base d’aluminium, présentant en surface des
hydroxydes d’aluminium. Le risque identifié ici est celui du dihydrogène (explosivité),
potentiellement émis lors de la radiolyse des hydroxydes d’aluminium.
La problématique aval s’insère dans une thématique bien plus vaste que celle stricte
des hydroxydes d’aluminium abordée, parce que le risque de produire du dihydrogène
se trouve très souvent dans le contexte du stockage/entreposage/transport (matériaux
organiques, ciments, boues). En amont, c'est-à-dire sur le plan fondamental, cette thèse
s’attaque au problème de la radiolyse de « l’eau » dite ici « solide », en comparaison à
la radiolyse (bien mieux connue) de l’eau liquide. On retrouve des points communs, et
bien sûr aussi des différences majeures, avec d’autres situations qui ont été étudiées
récemment sous irradiation comme la radiolyse de l’eau nanoconfinée (zéolithes,
géopolymères, bétons, argiles ou encore les verres de silice mésoporeux). L’étude de
la radiolyse de cette « eau solide » est indissociable celle des défauts d’irradiation dans
les hydrates d’alumine et donc on a étudié en parallèle la formation/émission de
dihydrogène et la création de défauts d’irradiation dans le solide tout en abordant une
characterisation multi-technique avant et après irradiations a fait appel à une dizaine de

techniques de caractérisation (DRX, FTIR/ATR, RAMAN, MEB, BET, ATG, RPE,
ICP, XPS, analyse de gaz par chromatographie et spectrométrie de masse). et en
étudiant l’effet de plusieurs paramètres sur la création de ces défaut tels que l’effet de
taille, l’effet d’hydratation, d’impureté etc… Une étude préliminaire sur la brucite
Mg(OH)2) est présentée à la fin du manuscrit pour essayer de voir l’effet de taille et
d’impureté et généraliser les résultats sur un plus grand nombre d’hydroxides. Ce
manuscrit présente l’étude de deux polymorphes, des tailles de grains différentes,
l’effet de l’hydratation, des impuretés, l’effet du pouvoir d’arrêt électronique (ou TEL
pour Transfert d’Energie Linéaire), de la dose et des recuits. Cela permet de brosser un
panorama général sur l’émission radioinduite de dihydrogène par les hydroxydes
d’aluminium
Dans le premier chapitre, la littérature est présente. Dans les hydrates d’alumine, stricto
sensu, on ne retrouve qu’un seul article très récent (2015) traitant du sujet, émanant du
SRNL-USA. On trouve aussi deux autres articles plus anciens concernant l’étude des
centres paramagnétiques par une équipe moscovite et une slovaque. C’est tout.
Mentionnons aussi des études récentes sur la radiolyse de l’eau en surface d’oxydes
provenant de l’Université de Notre Dame, USA.
Le plan est structuré en six chapitres, plus une introduction, une conclusion et deux
courtes annexes. Les chapitres 4 et 5 présentent l’essentiel des résultats, ils concernent
respectivement les matériaux secs et hydratés. Le noyau central des chapitres 4, 5 est
précédé par un chapitre sur la caractérisation des matériaux non irradiés. Le chapitre 1
regroupe les rappels essentiels sur l’interaction particule matière et sur l’état de l’art en
ce qui concerne la radiolyse de l’eau et les effets d’irradiation dans les hydroxydes.
Considérant le contexte de ce travail, on présente, à juste titre, les deux mécanismes
permettant la modification sous irradiation, les chocs balistiques (ou collisions
élastiques) et l’excitation électronique (ou radiolyse). La radiolyse de l’eau est résumée
en considérant l’eau dans tous ses états : eau liquide, eau gelée (glace) et eau liée
(confinée et physi ou chimisorbée). Le chapitre fait aussi le point sur la création de
défauts ponctuels, ici appelés centres colorés, dans les oxydes et les hydroxydes. Enfin
le chapitre rappelle les quelques résultats publiés sur l’émission de dihydrogène par les
hydroxydes irradiés. Le chapitre 2 se structure en trois parties. La première partie
concerne les matériaux utilisés et détaille les protocoles choisis pour le de séchage et
l’hydratation. La synthèse maison de grains de brucite de très petite taille (3 nm) est
également présentée dans cette partie. La deuxième partie décrit les dispositifs et
conditions d’irradiation ainsi que les protocoles de dosimétrie. Le chapitre se clôt par
la description des techniques de caractérisation. Le chapitre 3 présente la
caractérisation des échantillons non irradiés. Les hydroxydes d’aluminium étant des
matériaux complexes, il est était essentiel de partir sur des échantillons bien définis. Le
chapitre se termine sur quelques résultats après des irradiations à fort TEL, supposées
créer plus de modifications. En fait, on explore ici le potentiel de différentes techniques
(FTIR, XRD et XPS). Aucune de ces techniques ne s’est révélée assez sensible pour
étudier les modifications dans le domaine de dose de ce travail. Le chapitre quatre
présente les résultats obtenus dans des échantillons « séchés » c'est-à-dire ne contenant
a priori que des hydroxyles liées à l’aluminium. On s’attache donc à évaluer la
contribution de « l’eau de structure » à la production de H2. Trois matériaux différents
ont été considérés : deux à « gros » grains (20 nm), bayerite et bohenite, et une bayerite
à petit grains (5 nm). Les mesures de G(H2) non pas été seulement mesuré après
irradiation, mais aussi lors de recuits conduits jusqu’à la température de transition de
phase (les hydrates d’aluminium se décomposent alors complètement en alumine et
eau). Une des questions que posent les résultats de G(H2) après irradiation et recuit est
la rétention de dihydrogène et/ou de H° dans le matériau. Une des raisons évoquée est
la diffusion.
La diffusion de H° devrait être encore plus rapide, mais paradoxalement la RPE montre
que H° est bien présent après irradiation, au moins dans la bohemite. Une autre raison
avancée pour la rétention est le piégeage de H2 et ou H°. Ceci est séduisant mais les
mécanismes et les sites de piégeage restent flous. Concernant l’effet de taille, qui est
un autre point intéressant de cette thèse, on propose, pour expliquer les très faibles
G(H2) dans le cas des petits grains, une hypothèse séduisante : on aurait tout au plus un
H° par grain, ce qui limiterait les recombinaisons H°+H°. Le chapitre cinq présente les
résultats obtenus dans des échantillons hydratés afin d’évaluer la contribution à la
production de H2 de l’eau (H2O) adsorbée. Un des résultats marquants de cette thèse
est la mise en évidence d’un fort effet d’interaction : G(H2) est bien supérieur à la valeur
calculée par additivité (matériau sec + eau « libre »).
La thèse se termine par le chapitre six qui concerne une étude exploratoire sur des
brucites synthétisées maison. Inévitablement, la synthèse à façon ouvre des
perspectives que n’offre pas tout travail faisant appel à des matériaux commerciaux.

List of contents
Acknowledgment ........................................................................................................... 3
List of contents ............................................................................................................. 11
Introduction .................................................................................................................. 25
1. Chapter 1: Literature review ................................................................................ 31
1.1 Absorption of radiation energy ...................................................................... 31
1.1.1 Electron ................................................................................................. 32
1.1.2 Swift heavy ion ....................................................................................... 33
1.1.3 Electromagnetic radiations X and gamma rays ...................................... 33
1.2 Creation of defects ......................................................................................... 34
1.2.1 Elastic collisions ..................................................................................... 34
1.2.2 Electronic excitation ............................................................................... 35
1.2.3 Absorbed dose ........................................................................................ 36
1.2.4 Radiolytic yield ...................................................................................... 36
1.2.5 Elastic or Inelastic collisions .................................................................. 36
1.3 Radiolysis of water ........................................................................................ 37
1.3.1 Different types of water .......................................................................... 37
1.3.2 Liquid water ........................................................................................... 38
1.3.3 Adsorbed water ...................................................................................... 40
1.4 Water in a solid state ..................................................................................... 43
1.5 Irradiated Hydroxides .................................................................................... 44
1.5.1 Definition of color centers ...................................................................... 45
1.5.2 Colors centers in oxides ......................................................................... 47
1.5.3 F-center in hydroxides ............................................................................ 49
1.5.4 Hole centers in hydroxides ..................................................................... 50
12
1.5.5 H radicals in hydroxides ......................................................................... 53
1.5.6 Hydrogen production in hydroxides ....................................................... 55
1.6 Conclusion ..................................................................................................... 56
2. Chapter 2: Facilities, equipment and techniques .................................................. 59
2.1 Al(OH)3 and AlOOH ..................................................................................... 59
2.1.1 Drying optimization ............................................................................... 59
2.1.2 Hydration ................................................................................................ 60
2.2 Mg(OH)2 ........................................................................................................ 61
2.2.1 Sample preparation ................................................................................. 61
2.3 Irradiation Experiments ................................................................................. 62
2.3.1 Radiation sources ................................................................................... 62
2.3.2 Gamma source Cesium-137 ................................................................... 62
2.3.3 Heavy ion irradiation .............................................................................. 63
2.3.4 Dosimetry ............................................................................................... 64
2.3.5 Radiation vessels .................................................................................... 67
2.4 Characterization before and after irradiation ................................................. 73
2.4.1 X-ray Crystallography (XRD) ................................................................ 73
2.4.2 Infrared spectroscopy (IR) ..................................................................... 74
2.4.3 Raman spectroscopy ............................................................................... 74
2.4.4 Scanning electron microscopy (SEM) .................................................... 75
2.4.5 Brunauer, Emmett and Teller analysis (BET) ........................................ 75
2.4.6 Thermogravimetric analysis (TGA) ....................................................... 75
2.4.7 Electron paramagnetic resonance magnetometer (EPR) ........................ 76
2.4.8 Inductively coupled plasma atomic emission spectrometry (ICP AES) 78
2.4.9 X-ray photoelectron spectroscopy ( ) ..................................................... 78
2.5 Gas analysis ................................................................................................... 78
2.5.1 Gas chromatography µ-GC .................................................................... 79

13
2.5.2 Trace gas chromatography ..................................................................... 80
2.5.3 Gas mass spectrometer MAT 271 .......................................................... 81
2.6 Summary ........................................................................................................ 82
3. Chapter 3 Sample characterization ....................................................................... 83
3.1 Atomic organization of the nanoparticles ...................................................... 83
3.1.1 X-ray Crystallography (XRD) ................................................................ 83
3.2 Bonding inside Nanoparticles ........................................................................ 87
3.2.1 Infrared spectroscopy (IR) ..................................................................... 87
3.2.2 Raman spectroscopy ............................................................................... 88
3.2.3 X-ray photoelectron spectroscopy (XPS) ............................................... 90
3.3 Impurities ....................................................................................................... 93
3.3.1 Inductively coupled plasma atomic emission spectrometry (ICP-AES) 93
3.3.2 Electron paramagnetic resonance magnetometer (EPR) ........................ 95
3.4 Particle shape and surface .............................................................................. 95
3.4.1 Scanning electron microscopy (SEM) .................................................... 95
3.4.2 Brunauer-Emmett and Teller analysis (BET) ......................................... 96
3.4.3 Water sorption ........................................................................................ 97
3.4.4 Thermogravimetric analysis (TGA) ....................................................... 97
3.4.5 Drying ..................................................................................................... 98
3.4.6 Hydration ................................................................................................ 98
3.5 Effect of irradiation ..................................................................................... 102
3.5.1 FTIR ..................................................................................................... 102
3.5.2 XRD ..................................................................................................... 102
3.5.3 XPS ....................................................................................................... 103
3.5.4 EPR ....................................................................................................... 105
3.6 Summary ...................................................................................................... 105
14
4. Chapter 4. Molecular hydrogen production from dry aluminum hydroxide and
oxyhydroxide .............................................................................................................. 107
4.1 Hydrogen production ................................................................................... 107
4.1.1 Gamma rays .......................................................................................... 107
4.1.2 Electron beam irradiation ..................................................................... 107
4.1.3 Swift heavy ion irradiations ................................................................. 114
4.2 Radiation induced defects ............................................................................ 116
4.2.1 Bohemite AlOOH ................................................................................. 117
4.2.2 Bayerite Al(OH)3 .................................................................................. 126
4.2.3 Defects localization .............................................................................. 130
4.3 Identification of RID ................................................................................... 132
4.3.1 H radicals .............................................................................................. 132
4.3.2 RID I ..................................................................................................... 132
4.3.3 RID I’ ................................................................................................... 133
4.3.4 RID II ................................................................................................... 134
4.3.5 RID III and RID III’ ............................................................................. 135
4.3.6 RID IV .................................................................................................. 136
4.3.7 RID V’ .................................................................................................. 136
4.3.8 RID VI’ ................................................................................................ 136
4.4 Discussion .................................................................................................... 136
5. Chapter 5: Molecular hydrogen production from hydrated aluminum hydroxide and
oxyhydroxide .............................................................................................................. 141
5.1.1 H2 production ....................................................................................... 141
5.1.2 Gamma rays .......................................................................................... 141
5.1.3 Electron beam irradiation ..................................................................... 142
5.1.4 Swift heavy ion irradiations ................................................................. 146
5.2 Radiation induced defects ............................................................................ 147

15
5.2.1 Bohemite AlOOH ................................................................................. 147
5.2.2 Bayerite Al(OH)3 .................................................................................. 154
5.3 Discussion .................................................................................................... 157
6. Chapter 6: Molecular hydrogen production from Brucites ................................ 161
6.1 Characterization ........................................................................................... 161
6.2 H2 production from different particle sized samples ................................... 164
6.3 H2 production from different impurity rates ................................................ 164
6.4 Summary ...................................................................................................... 166
7. Conclusion .......................................................................................................... 169
Reference .................................................................................................................... 173
8. Appendix ............................................................................................................ 181
Appendix A: TN 12 casks ...................................................................................... 181
Appendix B: EPR spectra of hydrated AlOOH and Al(OH)3 ................................ 182

16
List of figures
Figure 1.1. Variation of LET for different types of radiations and particles (from
0.2 keV/μm to above 50 keV/μm).13 ............................................................................ 32
Figure 1.2. Radioactive decay of the γ-emitting isotopes: 60Co and 137 Cs.13 .............. 34
Figure 1.3. Surface states of alumina showing water in its four forms. ....................... 38
Figure 1.4. Main reactions arising from the radiolysis of liquid water and associated time
scales.23 ......................................................................................................................... 39
Figure 1.5. Crystalline ice film deposited at 150 K and cooled at 20 K before irradiation
(dashed line) and after irradiation at saturation (full line). The arrows indicate the
spectral fingerprints of each photolysis product, except for the peak labeled H2O (4a1) ,
which is the 4a1 state of condensed water.33 ................................................................ 43
Figure 1.6. Illustration of radiation-induced color centers. .......................................... 46
Figure 2.1. Scheme of a Gammacell 3000 in irradiation position. The Cs-137 radioactive
source is in the vicinity of samples contained in a canister. ........................................ 63
Figure 2.2. Used geometry to calculate the received dose. The diameter of the bottom of
the ampule was 4 mm and 0.38 mm the glass thickness. ............................................. 64
Figure 2.3. Fricke dosimetry curve showing the variation of absorbance with respect to
pulse number delivered by the LINAC. ....................................................................... 66
Figure 2.4. Pyrex ampule equipped with a valve used to analyze hydrated samples
irradiated using electron beams and that used for annealing. Longneck ampules were
used in order to keep the rubber seal attached to the valve clean and maintain the vessel
leak proof. ..................................................................................................................... 68
Figure 2.5. Pyrex ampules equipped with a pigtail used to analyze dry electron beam
irradiated samples and all Gamma irradiated samples. The aperture from one side
facilitates the introduction of the sample and gas (left). Ampules are then sealed, powder
is irradiated and gas is analyzed by breaking the pigtail (right). .................................. 69
Figure 2.6. Pyrex ampules equipped with a pigtail used to analyze samples irradiated
using heavy ions. The aperture from one side facilitates the introduction of the sample
and gas (left). The bottom is 4 mm diameter tube. Ampules are then sealed, powder is
irradiated and gas is analyzed by breaking the pigtail (zoom on the right). ................ 70
Figure 2.7. EPR cold finger Dewar used to analyze irradiated pellets at low temperature.
The sample is introduced attached to a metallic wire (left) and is then irradiated at the
17
top of the thin quartz tube. After irradiation the pellet is released to the bottom of the
Dewar in order to be analyzed by EPR. ....................................................................... 71
Figure 2.8. Conic-like Pyrex ampules equipped with a J Young valve that resists to acidic
and basic attack used to analyze gas released from dissolved irradiated samples. ...... 72
Figure 2.9. Annealing system consisting of the evacuated irradiated ampule (left) heated
with a tube furnace until transition temperature is attended and connected to another
ampule under vacuum (right). This latter is cooled using liquid nitrogen in order to trap
water and adsorb it on the glass beads inside. .............................................................. 73
Figure 2.10. SRA µ-GC standard calibration curve ranging from 10 to 1000 ppm. .... 80
Figure 2.11. GC-Traces standard calibration curve ranging from 0.5 to 100 ppm. ..... 81
Figure 3.1. X-ray diffraction pattern of AlOOH L, AlOOH S and Al(OH)3. .............. 84
Figure 3.2. DRX of AlOOH and Al(OH)3 comparing pristine and dry samples. ........ 85
Figure 3.3. Modeled AlOOH showing 3 layers where each Al is linked to one O and OH.
...................................................................................................................................... 86
Figure 3.4. Modeled Al(OH)3 showing 3 layers where each Al is linked to three OH.86
Figure 3.5. IR spectra of AlOOH and Al(OH)3 comparing pristine and dry samples. 87
Figure 3.6. Raman spectra of Al(OH)3 and AlOOH. ................................................... 89
Figure 3.7. XPS survey spectra of pristine AlOOH L, AlOOH S and Al(OH)3 and high
resolution of Al 2p and O1s. ........................................................................................ 92
Figure 3.8. ICP-AES of AlOOH and Al(OH)3 showing chemical trace impurities in each
case. .............................................................................................................................. 94
Figure 3.9. EPR spectrum of pristine AlOOH L, AlOOH S and Al(OH)3 showing
paramagnetic impurities ............................................................................................... 95
Figure 3.10. Scanning electron microscopy: differences between pristine AlOOH S,
AlOOH L and Al(OH)3 (x 37 000). .............................................................................. 96
Figure 3.11. TGA and DTG of pristine AlOOH and Al(OH)3 under N2. ..................... 97
Figure 3.12. Water uptake isotherm using TGA with respect to relative humidity. Full
squares are attributed to adsorption and empty ones to desorption. ............................. 99
Figure 3.13. FTIR spectra of heavy ions irradiated at 500 kGy AlOOH L, AlOOH S and
Al(OH)3 compared to that of pristine ones. ................................................................ 102
Figure 3.14. XRD spectra of irradiated at 200 kGy using heavy ions AlOOH L, AlOOH
S and Al(OH)3 compared to that of pristine ones. ..................................................... 103

18
Figure 3.15. XPS spectra of irradiated AlOOH L, AlOOH S and Al(OH)3 compared to
that of pristine ones. ................................................................................................... 104
Figure 3.16. EPR spectra of irradiated AlOOH L, AlOOH S and Al(OH)3 compared to
that of pristine ones (dashed). .................................................................................... 105
Figure 4.1. Hydrogen production as a function of the dose from dry AlOOH L, AlOOH S
and Al(OH)3 irradiated using electron beams. Close squares: same sample irradiated at
different doses. Open squares: separated samples irradiated at 120 kGy. ................. 109
Figure 4.2. Effect of temperature (up to 250˚C) on hydrogen released from samples
irradiated using electron beams at 120 kGy. .............................................................. 112
Figure 4.3. Hydrogen production at RT from dry AlOOH L, S and Al(OH)3 irradiated
with Ar18+ as a function of the dose. ........................................................................... 115
Figure 4.4.Effect of temperature (up to 200˚C) on hydrogen released from samples
irradiated with heavy ions at 250 kGy (AlOOH L and Al(OH)3) and 520 kGy (AlOOH
S). ............................................................................................................................... 115
Figure 4.5. EPR Spectra of electron irradiated AlOOH L, S and Al(OH)3 at 120 kGy.
.................................................................................................................................... 117
Figure 4.6. EPR spectra of electron irradiated AlOOH S at various doses at RT. Orange:
6.5 kGy, violet: 13 kGy, black: 52 kGy and dark cyan: 130 kGy. The insert presents the
subtraction of the spectra recorded at 130 kGy and 52 kGy. ..................................... 118
Figure 4.7: Simulation of EPR spectra of electron irradiated AlOOH S at 6.5 kGy.
Orange: experimental line, violet: theoretical simulated line, blue line and black line
representing RID I and RID II, respectively. ............................................................. 119
Figure 4.8: EPR of AlOOH L electron irradiated at 6.5 kGy at room temperature. A new
defect RID III appears at high field with 𝒈 = 𝟏. 𝟗𝟗𝟖, ∆𝑯𝒑𝒑 = 𝟎. 𝟐 𝒎𝑻. ............... 119
Figure 4.9. Evolution of the concentration of H radicals in electron irradiated AlOOH L
as a function of the dose. ............................................................................................ 120
Figure 4.10.Evolution of the concentration of RID I (blue), and RID II (green) in electron
irradiated AlOOH L and S as a function of the dose. ................................................ 121
Figure 4.11. Evolution at RT of EPR spectra of electron irradiated AlOOH L at 120 kGy.
The evolution of H radicals (on the left) and RID (on the left) are shown as a function
of time from one hour until 24 hours. ........................................................................ 122
Figure 4.12. Evolution at RT of EPR spectra of electron irradiated AlOOH S at 120 kGy.
The evolution of RID is shown as a function of time from one hour until 25 hours. 122
19
Figure 4.13. EPR spectra (top right and left) and relative intensity (bottom) of electron
irradiated AlOOH S at 120 kGy after annealing at different temperatures. EPR are
represented as follows: Olive: RT, black: 40°C, orange: 80°C, purple: 120°C,
wine: 160°C and pink 200°C. ..................................................................................... 124
Figure 4.14. EPR spectra (top right and left) and relative intensity (bottom) of electron
irradiated AlOOH L at 120 kGy after annealing at different temperatures. EPR spectra
are represented as follows: Violet: RT, pink: 40°C, olive: 80°C, black: 120°C, orange:
160°C and purple 200°C. ........................................................................................... 125
Figure 4.15. Comparison of EPR spectra of AlOOH S (cyan blue) and AlOOH L (purple)
after one hour annealing at 300°C. The fit of the annealing spectra of irradiated AlOOH
S is shown in dotted cyan blue line. ........................................................................... 126
Figure 4.16: Evolution of EPR spectra of electron irradiated Al(OH)3 as a function of
the dose. Straight lines represent the experimental data and dotted ones the simulations.
Green, blue and pink colors are attributed to 7, 28 and 120 kGy. .............................. 127
Figure 4.17. Evolution of the concentration of RID I’ (right), and H radicals (black) in
irradiated Al(OH)3 as a function of the dose. ............................................................. 127
Figure 4.18. Evolution at RT of EPR spectra of radiation induced defects in electron
irradiated Al(OH)3 at 120 kGy. The evolution of H radicals (on the left) and RID (on the
left) are shown as a function of time from one hour until 25 hours. .......................... 128
Figure 4.19. EPR spectra (right) and relative intensity (left) of electron irradiated
Al(OH)3 at 120 kGy after annealing at different temperatures. EPR spectra are
represented as follows: Pink: RT, wine: 40°C, purple: 80°C, orange: 120°C, black:
160°C and olive 200°C. .............................................................................................. 129
Figure 4.20. EPR spectra of electron irradiated Al(OH)3 at 120 kGy and annealed one
hour at 225°C. Straight lines represent the experimental data and dotted ones the
simulations. RID I’ (black), RID II’ (green), and RID V’ (violet). ........................... 129
Figure 4.21. EPR spectra of electron irradiated AlOOH S (30 kGy), ALOOH L (30 kGy)
and Al(OH)3 (30 kGy) after exposition to air. Black lines represent the spectra under
vacuum while colorful lines represent the one exposed to air. .................................. 131
Figure 5.1. Dose dependence of H2 production for hydrated AlOOH S equilibrated in
different relative humidity at room temperature (11, 44 and 76 % RH). ................... 142
Figure 5.2. Hydrogen production from AlOOH L with respect to water loading. Blue
squares (electron irradiations of desiccator hydrated samples), orange dots (electron
20
irradiations of ampule hydrated samples), green squares (gamma irradiations of
desiccator hydrated samples). Black dotted line (primary radiolytic yield of liquid water)
and gray continuous line (additive law see text). ....................................................... 144
Figure 5.3. Hydrogen production from AlOOH S with respect to water loading. Purple
dots (electron irradiations of desiccator hydrated samples), orange dots (electron
irradiations of ampule hydrated samples), green dots (gamma irradiations of desiccator
hydrated samples). Black dotted line (primary radiolytic yield of liquid water) and gray
continuous line (additive law see text). ...................................................................... 145
Figure 5.4. Hydrogen production from Al(OH)3 with respect to water loading. Pink dots
(electron irradiations of desiccator hydrated samples), orange dots (electron irradiations
of ampule hydrated samples), green dots (gamma irradiations of desiccator hydrated
samples). Black dotted line (primary radiolytic yield of liquid water) and gray
continuous line (additive law see text). ...................................................................... 145
Figure 5.5. Hydrogen production from 76% hydrated Ar18+ irradiated aluminum
hydroxides and oxyhydroxides as a function of the dose. .......................................... 147
Figure 5.6. EPR spectra of electron irradiated AlOOH L (wine line) and AlOOH S
(orange line) at 77 K at 46 kGy. ................................................................................. 148
Figure 5.7. Evolution of the concentration of H radicals in hydrated at 76 % RH (blue
dots) and dry (red dots) AlOOH L (left) and AlOOH S (right) as a function of the dose.
.................................................................................................................................... 150
Figure 5.8. Evolution of the concentration of RID I in hydrated at 76 % RH (blue dots)
and dry (red dots) AlOOH L (left) and AlOOH S (right) as a function of the dose. . 151
Figure 5.9. Evolution of the concentration of RID II in hydrated at 76 % RH (blue dots)
and dry (red dots) AlOOH L (left) and AlOOH S (right) as a function of the dose. . 151
Figure 5.10. Evolution of the concentration of RID III in hydrated at 76 % RH (blue
dots) and dry (red dots) AlOOH L (left) and AlOOH S (right) with respect to dose. 151
Figure 5.11. Evolution at RT of EPR spectra of radiation induced defects in electron
irradiated AlOOH L at 30 kGy. The evolution of H radicals (on the left) and RID (on the
left) is shown as a function of time from one hour until 24 hours. ............................ 152
Figure 5.12. Evolution at RT of EPR spectra of radiation induced defects in electron
irradiated AlOOH S at 30 kGy. The evolution of RID is shown as a function of time
from one hour until 24 hours. ..................................................................................... 152

21
Figure 5.13. Evolution of H radicals and radiation induced defects as a function of
temperature in electron irradiated AlOOH L at 30 kGy. ............................................ 153
Figure 5.14. Evolution of H radicals and radiation induced defects as a function of
temperature in electron irradiated AlOOH S at 30 kGy. ............................................ 153
Figure 5.15. EPR spectra of electron irradiated Al(OH)3 at 77 K, at 46 kGy (orange) and
annealed at RT (olive) (76 % RH). ............................................................................ 154
Figure 5.16. Evolution of the concentration of H radicals in hydrated at 76 % RH (blue
dots) and dry (red dots) Al(OH)3 as a function of the dose ........................................ 155
Figure 5.17. Evolution at RT of EPR spectra of radiation induced defects in electron
irradiated Al(OH)3 at 30 kGy. The evolution of H radicals (on the left) and RID (on the
left) is shown as a function of time from one hour until 24 hours. ............................ 156
Figure 5.18. Al(OH)3 annealing showing radiation induced defect shapes a temperature
and the disappearance in intensity. Black dotted line represents H radicals while the two
pink dotted lines are used to show the disappearance of the square (RID I’) and the
appearance of two new defects symbolized with a close and an open triangle and which
are related to RID V’ and RID VI’ respectively. ....................................................... 156
Figure 6.1. X-ray spectra of two sized Mg(OH)2 . ..................................................... 162
Figure 6.2.TGA and DTG characterization of pristine Mg(OH)2 under N2. .............. 163
Figure 6.3. H2 production from 19 nm and 3 nm irradiated Mg(OH)2 (purity is 98% and
99% respectively). ...................................................................................................... 164
Figure 6.4. H2 production from 3 nm irradiated Mg(OH)2 with different impurity levels.
.................................................................................................................................... 165
Figure 8.1. TN 12/2 cask for nuclear waste transportation (AREVA TN). ............... 181
Figure 8.2. EPR spectra of electron irradiated AlOOH L, S and Al(OH)3 . RT indicated
in the first line significates irradiation and analyze at RT, 77K-77K significates
irradiation and analyze at 77K and 77K-RT significates irradiation at 77K and analyze
at RT ........................................................................................................................... 182
Figure 8.3. Evolution of RID I and RID II as a function of the dose in electron beam-
irradiated AlOOH L. Purple, orange and pink represents 7, 15 and 30 kGy respectively.
.................................................................................................................................... 183
Figure 8.4. Evolution radiation induced defects as a function of the dose in electron
beam-irradiated AlOOH S. At low doses (figure on the right) the EPR spectra is shown
in order to compare it with that at 30 kGy. ................................................................ 184

22
Figure 8.5. Evolution of H radicals and radiation induced defects as a function of the
dose in electron beam-irradiated Al(OH)3. ................................................................ 184

23
List of Tables
Table 1.1: Radiolytic yields of primary species formed during water radiolysis.23 ..... 40
Table 1.2. Evolution of molecular hydrogen yields G(H2) from dry Gamma and electron
irradiated CPG as a function of pore size. 7 The dose rate is 1.7 Gy/ns for pulsed electron
irradiation and 2 Gy/min for gamma irradiation. ......................................................... 42
Table 1.3. Hydrogen yields measured for irradiated ice. ............................................. 44
Table 1.4: Characteristic g-values, peak-to-peak ΔHpp width and aluminum hyperfine
constant a of paramagnetic centers in irradiated Al2O3. ............................................... 49
Table 1.5. Characteristic g-values, peak-to-peak width of F-centers in irradiated
hydroxides. ................................................................................................................... 50
Table 1.6. Characteristic g-values, peak-to-peak width and aluminum hyperfine constant
of hole centers in irradiated hydroxides. ...................................................................... 53
Table 1.7. Radical hydrogen radiolytic yields found in literature Irradiated with 60Co at
77 K.57 .......................................................................................................................... 55
Table 1.8. Molecular hydrogen radiolytic yields found in literature. Values in
parentheses represent the total hydrogen released after dissolution. ........................... 56
Table 3.1. Summary of the frequencies encountered in the IR spectra of AlOOH L,
AlOOH S and Al(OH)3. Attribution and comparison to the literature. ........................ 88
Table 3.2. Summary of the frequencies encountered in the Raman spectra of Al(OH)3,
AlOOH L and AlOOH S. Attribution and comparison to the literature are also shown.
...................................................................................................................................... 90
Table 3.3. XPS peak position and atomic concentration of each element before
irradiation. .................................................................................................................... 93
Table 3.4. Summary of water uptake with respect to relative humidity imposed in the
case of AlOOH L, AlOOH S and Al(OH)3. Water uptake from TGA imposed relative
humidity through isotherms, water uptake weighed in hydrated ampules and TGA
measurements for water uptake into dessicators are shown. ...................................... 101
Table 3.5. XPS peak position and atomic concentration of each element after irradiation.
.................................................................................................................................... 104
Table 3.6. Summary comparing the main characteristics after characterising each
sample. ........................................................................................................................ 106

24
Table 4.1. H2 radiolytic yields released at room temperature from AlOOH S, L and
Al(OH)3 and compared to the literature (Our results, resumed in this table were irradiated
using electron beams while other hydroxides from literature were irradiated using
Gamma rays). ............................................................................................................. 111
Table 4.2. Hydrogen yields at RT and after annealing at 250°C and above the phase
transition. The yields at RT represent the mean of different doses measurements while
high temperatures are conducted on 120 and 240 kGy. ............................................. 113
Table 4.3. Radiolytic yields of irradiated samples using heavy ions before and after
annealing .................................................................................................................... 116
Table 4.4. Spin parameters of RID II’ and RID V’ determined from the simulation of
irradiated Al(OH)3. ..................................................................................................... 130
Table 4.5. Comparison of g-factors and splitting 𝜟 in irradiated AlOOH and Al(OH)3.
.................................................................................................................................... 134
Table 4.6. Radiolytic yields of molecular hydrogen and radiation induced defects in
irradiated samples at low doses. Molecular yields of radicals are also presented and are
attributed to each radical introduced in the paragraph before. ................................... 140
Table 5.1. Hydrogen radiolytic yields released from Gamma irradiated samples hydrated
at 11, 44 and 76% at room temperature. .................................................................... 142
Table 5.2. Hydrogen radiolytic yields with respect to percent water loading from
hydrated AlOOH L, S and Al(OH)3 under electron irradiation. ................................ 143
Table 5.3. Radiolytic yields of radiation induced defects in electron irradiated samples
at 77 K. ....................................................................................................................... 148
Table 5.4. Radiolytic yields of radiation induced defects in Al(OH)3 irradiated using
electron beams at 77 K. .............................................................................................. 155
Table 5.5. Defect radiolytic yields from irradiated samples at 77 K, RT using electron
beams. ......................................................................................................................... 157
Table 5.6. Concentrations of H radicals from irradiated samples at 77 K, RT using
electron beams. ........................................................................................................... 157
Table 5.7. Radiolytic yield of H2 calculated with respect to the energy received by
adsorbed water. ........................................................................................................... 158
Table 6.1. Radiolytic yield of irradiated samples as a function of impurity and particle
size. ............................................................................................................................. 166
Table 7.1. Summary of RID with their spin characterizations and attribution. ......... 172

25
Introduction
During the storage or transportation of certain nuclear wastes, several gases are
generated. Hydrogen is the dominant flammable gas of concern and its potential threat
has drawn more and more attention.1 The release of radiolytic hydrogen is important to
quantify in order not to exceed the lower flammability limit (LFL). Usually safety
demonstrations have to prove that hydrogen concentration is always lower than half of
the LFL. This value corresponds to the minimum H2 concentration necessary to support
its combustion in air determined at room temperature and atmospheric pressure.2,3
Theoretically and practically speaking, this hazardous gas might originate from three
sources: metallic corrosion, radiolytic and chemical oxidation of organic compounds in
waste and radiolysis of liquid/vapor water.1, 4
However, a fourth source has been comparatively discounted: solid water. In fact, very
significant amounts of water can be trapped in the form of hydrates or hydroxides in
various materials used in the nuclear industry:
- Concretes are composed of different hydrated phases such as portlandite,
(3(CaO)·2(SiO2)·4(H2O)), Gibbsite…,
- Salts such as Mg(OH)2, Ti(OH)4, Co(OH)2 contained in co-precipitation sludges
resulting from the decontamination of liquid effluents,
- Corrosion phases, for example, on aluminum fuel assembly or on flasks used in
used fuel transportation.
The starting objective of our study is to gain a better understanding of hydrogen
production from hydroxides found in radioactive wastes and from corrosion phases
present in used fuel transportation flasks. These two themes are briefly presented below.
Used fuel transportation
Dry metal casks are concerned in our study, especially TN12 and TN 13 casks, designed
by AREVA TN and used for transportation of used fuel. For nearly 40 years, these types
of metal casks have been used to ship used nuclear fuel from Japan to Europe or within
europe without any incident.
More detailed description as well as a scheme of the TN12 are shown in section 8.
The TN12 is made of two parts, a body and a basket designed to receive the fuel
assemblies.

26
AREVA TN applied an anodizing film of aluminum oxide to the internal basket walls.
It is this film that is of interest for us.
Depending on the aluminum surface, numerous assemblies can show corrosion and
aluminum oxyhydroxides AlOOH or aluminum hydroxides Al(OH)3 can be formed.
This type of event can have an impact on transportation safety due to the risk of hydrogen
being produced through radiolysis or the risk of damage to transported materials
(e.g. fuel assemblies). 5
Radioactive waste management
In France, liquid effluents of Low Level Activity and Intermediate Level Activity are
decontaminated by using a process of insolubilisation of the radio-elements by chemical
co-precipitation. This treatment permits to concentrate and immobilize the radioactivity
in a solid matter. This mixture is named co-precipitation sludge and was intend to be
embedded in bitumen. Following the decision of the French nuclear safety authority,
some of the co-precipitation sludges could not be embedded in bitumen. Therefore
AREVA NC develops a new process that permits to store the mixture of the mineral co-
precipitation salts in the form of dry pellets
Therefore cementing is considered by the CEA. In this context it is important to know
the impact of different parameters on radiolytic hydrogen production in these salts such
as crystallite sizes, presence of impurities and relative humidity.
Recently, the radiolysis of Al(OH)3 and AlOOH under γ irradiation was studied and
hydrogen production from dry samples was quantified.6 We chose to study this type of
hydroxides because above all many structure variations exist such as Al(OH)3, AlOOH,
Al2O3. Therefore, molecular hydrogen production can be studied with respect to
different form of water.
The main goal of the project is to better understand the mechanisms involved in the
radiolysis of aluminum hydroxides and oxyhydroxides in particular chosen as a
prototype for other hydroxides encountered in the nuclear waste industry.
We tried to take into account the fact that i) the hydroxide could be formed with
different crystallite/particulate sizes, ii) the irradiation could occur in the presence or
absence of humidity iii) the irradiated hydroxide could be subject to temperature
elevation during transportation stage, for instance.

27
As a first step, the determination of molecular hydrogen production was evaluated with
respect to structure and particle size. Actually little information exists relating particle
size to hydrogen production.7-8
As a second step, the effect of adsorbed water and structural water on the molecular
hydrogen production was studied. Different radiation sources were used such as Gamma
radiation, electron beam radiations and heavy ions.
In the last part, preliminary results related to the impact of impurities on hydrogen
production are shown.
To complete, radiation induced defects were identified and characterized. The main
objective of these analyses is to identify the precursors of molecular hydrogen.
The novelty of this study resides in the quantification of molecular hydrogen not only at
room temperature as it is commonly done but also by annealing at high temperature.
Annealing was also used to study the thermal stability of the defects induced by
radiation.

28

29
« Ne vous découragez pas, c’est souvent la
dernière clef du trousseau qui ouvre la porte »
Le manuscrit retrouvé,Paulo Coehlo

30

31
1. Chapter 1: Literature review
This chapter sets the background to the thesis, introducing the basis of interaction of
radiation with matter and the classification of ionizing radiations. This is followed by
introducing water under its different forms and its behavior under irradiation. At the
end, a state-of-the-art on the radiolysis of adsorbed and confined water in oxides and
hydroxides is briefly explained followed by a general overview on their effects on
hydroxides.
1.1 Absorption of radiation energy
In order to initiate radiation-chemical reactions or create point defects in non- metallic
materials, ionizing radiations are used. These are composed of photons (gamma or X-
ray, bremsstrahlung), accelerated particles (electrons, light ions, swift heavy ions) and
particles ejected from radioactive emitters (α or β particles).
Electronic and nuclear energy loss can occur in irradiated materials.
Electronic energy loss is related to inelastic "collision", that is, ionization and excitation
of target materials, and the nuclear is responsible for elastic collision, that is,
displacement of atoms from the original sites. Electronic energy loss is predominant
over nuclear for high energy ion.9
The linear energy transfer, abbreviated LET is conventionally used to describe the
energy transfer per unit length of the track of the primary particle or secondary particle
in the case of radiation or neutrons. It can be written as -dE/dx, where E is the energy
deposited or lost and x is the depth.10-12 Classically we differentiate between high-LET
radiations that deposit energy densely along the path of the ionizing particle and low-
LET during which energy is discretely deposited in the path of the ionizing particle.
Figure 1.1 specifies the variation of the LET for different types of radiations. The
penetration of particles in matters is inversely related to their LET. For the same energy
the particle with lower LET has a better penetrating comparing to a higher LET.13

32
Figure 1.1. Variation of LET for different types of radiations and particles (from
0.2 keV/μm to above 50 keV/μm).13
Charged particles generally lose energy continuously through a large number of small
energy transfers as they pass through matter.
It is admitted that all types of high energy ionizing radiations induce similar chemical
changes in the irradiated material, although the relative proportions of the chemical
products formed may differ.
The following section briefly describes the process by which fast electrons, ions and
electromagnetic radiations interact with matter.
1.1.1 Electron
Elastic and inelastic scattering and emission of electromagnetic radiations are the most
important processes occurring by the interaction of electrons (and positrons) with
matter.
Radiation emission is favored when we have high electron energies and high atomic
number (Z) while at low energies elastic and inelastic scatterings are favored. 13
Electron accelerators are the most widely used machine sources, this is due to the
relatively high power available in electron beams, the extremely low probability of
inducing radioactivity in the irradiated products, and that the fact that the beams can be
turned on or off at will unlike gamma irradiation facilities.14 Electron beams generated
by accelerators are monoenergetic and they give a uniform distribution of adsorbed
dose in the irradiated matter. Electron beams are used for research purposes such as

33
pulse radiolysis or for processing applications, higher energy beams are utilized in
nuclear physics.
Mainly three types of electron accelerators exist:15
- Electrostatic accelerators that produce continuous electron beam between 0.1-
5 MeV (Van de Graff and Pelletron)
- Rhodotron ® accelerators based on recirculating a beam through successive
diameters of a single coaxial cavity resonating in metric waves (2-10 MeV)
- Linear accelerators (LINAC) which deliver accelerated electrons in pulses of
ns or micro second duration with a repetition of 1-500 Hz.
High energies are delivered between 10 and 30 MeV.
1.1.2 Swift heavy ion
Ion accelerators can be classified according to the beam energy delivered as three
categories:
- Low energy (1-102 MeV)
- Medium energy (102-104 MeV)
- High energy > 1 GeV
Interactions occurring with positive-ion radiations are the same as those with electrons.
However, radiation is important here only at a very high energies (1000 MeV), elastic
scattering is relatively unimportant and energy loss is principally by inelastic collisions
with the electrons of the stopping material.
Positive ions travel in very nearly straight paths and are slowed down gradually as a
result of a large number of small energy losses. Since each ion starts with the same
energy, all ions will have about the same range, although the random nature of
collisions gives rise to small variations in the range of individual ions. Compared to
gamma rays and electron beams, ion beam has potential advantages such as a large and
localized energy, production of a wider variety of secondary products and
transmutability of material including nuclear reactions. Positive ion beams are used in
radiation-physical technology in applications such as ion implantation and hardening
metal surfaces.13, 16
1.1.3 Electromagnetic radiations X and gamma rays
Photons constituting electromagnetic radiations tend to lose a relatively large amount
of energy whenever they interact with matter. They lose energy gradually through a
number of energy-transfer events like electrons and other charged particles but the

34
greater part of their energy is lost through a single interaction. This results in a complete
adsorption of the incident photon.17
High-energy photons interact with matter through:
- Photoelectric effects at low energies : 1-102 keV
- Compton scattering at higher energies : 102 - 104 keV
- Electron positron pair production for energy higher than 1.02 MeV and for
materials containing heavy atoms
This interaction induces the formation of secondary electrons that interact with the
target to produce transient species. Two artificial radioisotopes widely used as gamma
radiation sources are 60Co (activity 1.9-3.7 TBq/g) produced by exposing natural cobalt
59Co to neutrons in a nuclear reactors and 137Cs (activity 0.93 TBq/g) separated from
the mixed fission fragments present in spent nuclear fuel elements and the radioisotope
is available in the form of chloride. 60Co decays to give an excited state of 60Ni and 137
Cs which decays giving the ground state 137 Ba (Figure 1.2).13
Figure 1.2. Radioactive decay of the γ-emitting isotopes: 60Co and 137 Cs.13
1.2 Creation of defects
Defects can be created either by elastic collision or by electronic excitation.
1.2.1 Elastic collisions
Elastic collisions are direct mechanisms. For a given type of atom, the number of
displacements per atom (dpa) can be calculated by the equation
𝑑𝑝𝑎 = 𝜎𝑑𝜙 Where 𝜎𝑑 is the atomic displacement cross section by elastic collisions and 𝜙 is the
particle fluence.

35
The displacement cross section 𝜎𝑑 is directly determined by the threshold displacement
energy 𝐸𝑑:
(1)
𝜎𝑑(𝐸, 𝐸𝑑) = ∫ 𝑁(𝑇)𝑑𝜎
𝑑𝑇𝑑𝑇
𝐸𝑚𝑎𝑥
𝐸𝑑
where 𝐸 is the kinetic energy of the incident particle, 𝐸𝑚𝑎𝑥 is the maximal energy
transferred to the target atom, 𝑁(𝑇) is the number of primary and secondary displaced
atoms, and 𝑑𝜎 𝑑𝑇⁄ is the differential elastic collision cross section. In the case of
electron irradiation, the maximum energy 𝑇𝑚 transferred by an electron is given by the
following formula:
(2)
𝑇𝑚 ≈ (2𝑚𝑒 𝑀⁄ )[(𝐸 + 2𝑚𝑒𝑐2) 𝐸 𝑚𝑒𝑐
2⁄ ]
𝐸 is the kinetic energy of the electron, 𝑀 is the mass of target atoms and
𝑚𝑒𝑐2 = 511 𝑘𝑒𝑉.
The cross section for displacement damage 𝜎𝑑 can be evaluated using Darwin-
Rutherford formula:
(3)
𝜎𝑑(𝑏𝑎𝑟𝑛𝑠) = 0.2495(𝑍2
𝛽4𝛾2) [𝑇𝑚𝑇𝑑− 1]
With 𝛽 = 𝑣 𝑐⁄ and 𝛾 = 1 √1 − 𝛽2⁄ . 𝑍 is the atomic number of target atoms, 𝑣 is the
electron velocity and 𝑇𝑑 the threshold energy. It is supposed that below 𝑇𝑑 the
displacement probability is zero while for energy greater than 𝑇𝑑is unity.
The average threshold energies of O and Al in Al2O3 are comprised between 41-90 eV
and 18-24 eV, respectively.18
For polyatomic targets, 𝜎𝑑 is evaluated using the programs developed by Lesueur. 19
The calculations are based on the Kinchin–Pease model 20, they gave the displacement
cross section as a function of the electron energy in polyatomic solids for different
values of 𝑇𝑑.
1.2.2 Electronic excitation
In this case the projectile interacts with the electron of the target and transfers part of
its energy. This perturbation of the electronic structure of the target can modify the
local atomic structure and can induce defects formation. As the processes are often
complex and indirect it is impossible to calculate the number of atoms that are displaced
from their sites.

36
The concentration of defects results from the amount of energy absorbed by the
material and a creation yield that must be measured. Then two basic concepts have to
be defined: the dose and the radiolytic yield.
1.2.3 Absorbed dose
In insulator, the extent of modifications induced by inelastic collisions in a given
material depends on the absorbed dose, which corresponds to the energy deposited by
the radiation per unit mass of material. Its unit is the gray, Gy, and 1 Gy corresponds
to 1 Joule of energy deposited in 1 kg of material (1Gy = 1 J∙kg-1)1.
1.2.4 Radiolytic yield
Radiolytic yield concept, widely used today, was introduced in order to quantify the
effect of radiation.
In 1952, Milton Burton suggested the G-value as the radiolytic yield which represents
the number of molecules created or destroyed (M) per 100 eV of energy deposited in
the system.21
The International System of units expresses G yield in mol/J where 1 molecule (100 eV)
= 1.036 10-7 mol/J.
1.2.5 Elastic or Inelastic collisions
In practice, for some given irradiation conditions, it is important to determine what is
the main process do defects creation. Then the ratio of the number of defects created
by inelastic collisions 𝑁𝑖𝑛𝑒𝑙𝑎𝑠. to the number of atoms displaced by elastic collisions
𝑁𝑒𝑙𝑎𝑠. can be evaluated:
(4)
𝑁𝑖𝑛𝑒𝑙𝑎𝑠.𝑁𝑒𝑙𝑎𝑠.
=109 ∙ (−
𝑑𝐸𝑑𝑥)𝑖𝑛𝑒𝑙𝑎𝑠.
∙ 𝑒 ∙ 𝐺
𝑁0 ∙ 𝜎𝑑
Where (−𝑑𝐸
𝑑𝑥)𝑖𝑛𝑒𝑙𝑎𝑠.
is the stopping power for inelastic collisions (unity: MeV.cm2.g-
1), 𝐺 is the yield of formation of defects and 𝑁0 is the number of atoms/cm2 and 𝜎𝑑is
the surface area.
Using the lowest displacement threshold energy of Al determined for Al2O3, we
estimated that if electron energy exceeded 1 MeV and G exceeds 10-10 mol/J, the
1 In the earlier literature, doses were expressed in terms of Megarads: 1 Mrad = 10 kGy.

37
dominating process of defect creation is inelastic collisions (i.e radiolysis of the
material).
The radiolysis of water is well known today, the next section describes some
phenomena occurring in liquid water that may help us understand that of solid water.
The value of radiolytic yield of H2 formed in water would serve as a reference to
compare our results.
1.3 Radiolysis of water
1.3.1 Different types of water
Four types of water can be described in the samples studied in this thesis:
- Physically adsorbed water that can be expelled from the sample without altering
its structure
- Chemisorbed water strongly bound to the surface and is not expelled at low
temperatures as physisorbed water
- Structural water supposed as hydroxyl groups forming the sample such as OH
linked to Al in the structure Al(OH)3
- Water of crystallization that consists of the intermolecular water trapped inside
the structure and is not removed when heating and treating sample under
vacuum.
They are depicted in Figure 1.3.
A number of measurements are carried out in order to depict water in contact with
solids. Such measurements include TGA, IR, X-Ray, neutron diffraction, polarizing
microscopy and solid-state NMR.

38
Figure 1.3. Surface states of alumina showing water in its four forms.
In the studied systems, the more important type of water is structural water, but on
highly divided materials, chemisorbed and physisorbed water are important.
1.3.2 Liquid water
This section is briefly described and only basic knowledge on water radiolysis is given.
When exposed to radiation, the ionization of water molecules occurs leading to the
formation of various ion species, radicals and new molecules.7
Water radiolysis can be written as:
(5)
𝐻2𝑂 → 𝑒𝑎𝑞− , 𝐻𝑂•, 𝐻•, 𝐻𝑂2
• , 𝐻3𝑂+, 𝐻2𝑂2, 𝐻2
A few nanoseconds after irradiation in water, the following species are present:
HO•, H•, HO2•, H3O
+, OH-, H2O2, H2 of which the following are stable: H2O2, H2, H3O+,
and short-lived free radicals e-aq, HO•, H•, HO2
•.
Typically, water radiolysis flows in two main stages: the non-homogenous and
homogenous stages.22
This first consists of three main stages taking place on different typical time scales
(Figure 1.4): 13
- The physical stage, which is achieved fs after the initial matter-ionizing
radiation interaction, consists in energy followed by fast relaxation processes.
This leads to the formation of ionized water molecules (H2O+), excited water
molecules (H2O*) and sub-excitations electrons (e-).
- Physico-chemical stage, which takes about 10-12 s after the passage of ionizing
radiations, numerous processes occur including ion-molecule reaction,

39
dissociative reaction, auto ionization of excited states, thermalization of sub
excitation electrons (solvation of electrons), hole diffusion and so on.
- Chemical stage, starts at 10-12 s and is achieved at 200 ns after the passage of
ionizing radiations. It is the phase in which reactions occur between species
formed in previous steps: recombination between radicals, ions, molecules and
free electrons.
The homogenous stage is signed by the diffusion of species contained in the spurs that
are small zone where transient intermediates are created. It is achieved in 100 ns after
the passage of ionizing radiations.
Figure 1.4. Main reactions arising from the radiolysis of liquid water and associated time
scales.23
It is worth noting here that three types of radiolytic yields may exist depending on the
time species are measured. In our study only the global radiolytic yields are considered.
- Initial radiolytic yields 𝑮°(𝑿)
These yields are related to species produced at the end of the physichochemical
stage in the irradiated material, in other words at almost 10-12 s after the passage
of radiation ions. These yields are difficult to measure since they are formed at
a very short time.
- Primary radiolytic yields, 𝒈(𝑿)

40
These yields are related to radical and molecular species that escaped from the
ionization cluster at 1 microsecond after the passage of ionizing radiation. They
have an homogenous distribution in the system.
- Global or apparent radiolytic yields, 𝑮(𝑿)
These yields are attributed to that measured few minutes after the passage of
ionizing radiations. These are essentially attributed to radiolytic yields of
species formed from stationary radiolytic reactions.
Radiolytic yields of the primary species formed from the radiolysis of liquid water at
pH=7 are resumed at the bottom of Figure 1.4 and recalled in Table 1.1.
Table 1.1: Radiolytic yields of primary species formed during water radiolysis.23
𝐞𝐚𝐪− 𝐇° 𝐇𝐎° 𝐇𝟐𝐎 𝐇𝐎− 𝐇𝟑𝐎
+ 𝐇𝟐 𝑯𝟐𝑶𝟐
𝐆 (mol/J) x 10-7 2.57 0.53 2.58 -6.63 0.10 2.66 0.43 0.69
1.3.3 Adsorbed water
Since the pioneer work of Caffrey and al, the adsorption of molecules on minerals is
well known to enhance their degradation.24 This result is attributed to exciton energy
transfer between the solids and the adsorbed molecules.
1.3.3.1 Physisorbed and chemisorbed water
It has been shown that a small amount of physisorbed water may lead to a large yield
of H2 such as in the case of FeO and Fe2O3 and other oxides where H2 yields were
several orders of magnitude greater than that of bulk water.25 To conclude, there are
three types of oxide:
- Oxides with a 𝐺(𝐻2) < G(bulk water) such as MnO2, Cr2O3 and ZnO (0.001-
0.01 molecules/100eV),
- Oxides with a 𝐺(𝐻2) close to G(bulk water) such as TiO2, SiO2, V2O5, NiO and
CdO (0. 1-1 molecules/100eV),
- Oxides with a 𝐺(𝐻2) > G(bulk water) such as La2O3, ZrO2 and MgO (50-100
molecules/100eV).
The very high values measured for the latter categories can only be explained on the
assumption of a diffusion of energy from the oxide into the adsorbed water leading to
an apparent excess formation of H2.
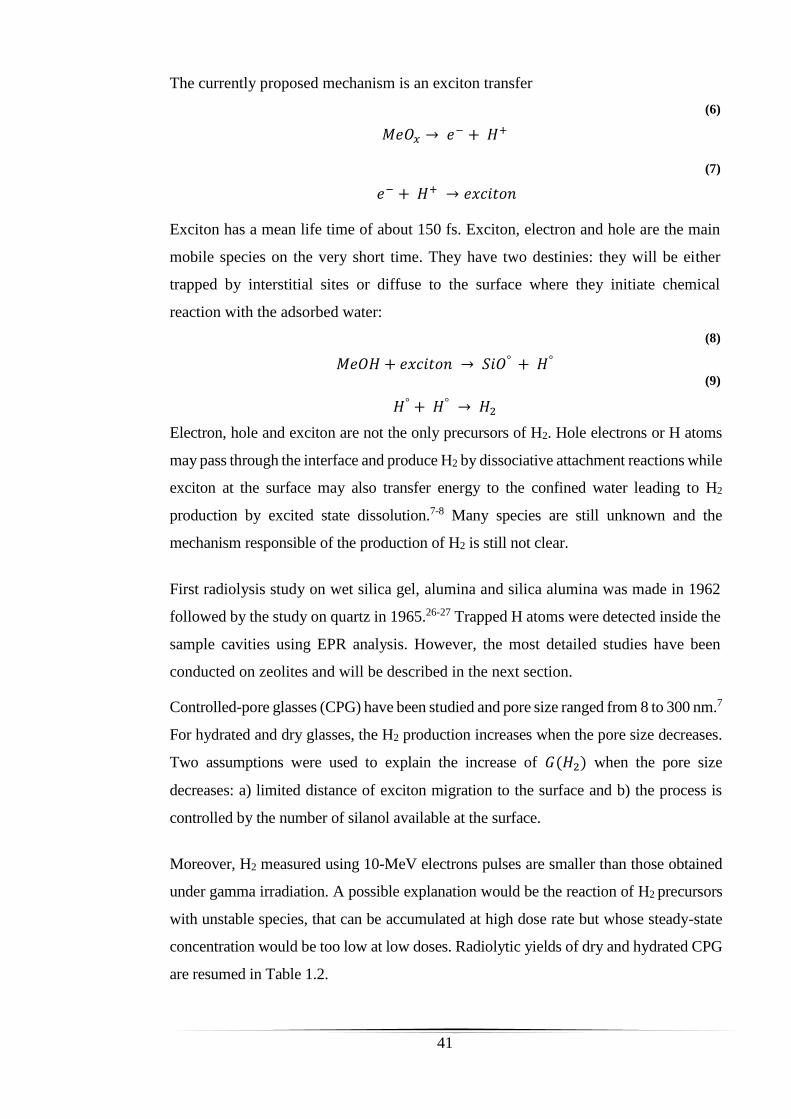
41
The currently proposed mechanism is an exciton transfer
(6)
𝑀𝑒𝑂𝑥 → 𝑒− + 𝐻+
(7)
𝑒− + 𝐻+ → 𝑒𝑥𝑐𝑖𝑡𝑜𝑛
Exciton has a mean life time of about 150 fs. Exciton, electron and hole are the main
mobile species on the very short time. They have two destinies: they will be either
trapped by interstitial sites or diffuse to the surface where they initiate chemical
reaction with the adsorbed water:
(8)
𝑀𝑒𝑂𝐻 + 𝑒𝑥𝑐𝑖𝑡𝑜𝑛 → 𝑆𝑖𝑂° + 𝐻° (9)
𝐻° + 𝐻° → 𝐻2
Electron, hole and exciton are not the only precursors of H2. Hole electrons or H atoms
may pass through the interface and produce H2 by dissociative attachment reactions while
exciton at the surface may also transfer energy to the confined water leading to H2
production by excited state dissolution.7-8 Many species are still unknown and the
mechanism responsible of the production of H2 is still not clear.
First radiolysis study on wet silica gel, alumina and silica alumina was made in 1962
followed by the study on quartz in 1965.26-27 Trapped H atoms were detected inside the
sample cavities using EPR analysis. However, the most detailed studies have been
conducted on zeolites and will be described in the next section.
Controlled-pore glasses (CPG) have been studied and pore size ranged from 8 to 300 nm.7
For hydrated and dry glasses, the H2 production increases when the pore size decreases.
Two assumptions were used to explain the increase of 𝐺(𝐻2) when the pore size
decreases: a) limited distance of exciton migration to the surface and b) the process is
controlled by the number of silanol available at the surface.
Moreover, H2 measured using 10-MeV electrons pulses are smaller than those obtained
under gamma irradiation. A possible explanation would be the reaction of H2 precursors
with unstable species, that can be accumulated at high dose rate but whose steady-state
concentration would be too low at low doses. Radiolytic yields of dry and hydrated CPG
are resumed in Table 1.2.

42
Table 1.2. Evolution of molecular hydrogen yields G(H2) from dry Gamma and electron
irradiated CPG as a function of pore size. 7 The dose rate is 1.7 Gy/ns for pulsed electron
irradiation and 2 Gy/min for gamma irradiation.
Pore diameter
of the glass
(nm)
Electron Gamma
8 (2.4±0.9)x10-9 (2.2±0.1)x10-7
25 (1.7±0.3)x10-9 Non determined
50 (1.3±0.1)x10-9 (3.2±0.4)x10-7
300 (5.1±0.4)x10-10 (2.1±0.1)x10-7
1.3.3.2 Water trapped in Zeolite
It has been shown that the nature of chemical interactions between water and the
absorbent differs when comparing porous materials such as silica gel to zeolites. In the
case of silica gel, water molecules are adsorbed on surface hydroxyls which act as
active sites in energy-transfer phenomena.28 In zeolite water systems, the cation is often
considered as the adsorption site of water but the anionic oxygen atoms are preferred
as active sites for energy transfer.29
Depending on the zeolite type, the behavior with respect to radiation may differ.
Molecular sieve zeolites 3A, 4A and 5A (representing pore size 3Å, 4Å and 5Å
respectively) were studied and showed different dependence of adsorbed water. 3Å
interestingly showed that framework oxygen atoms of zeolite structure are active sites
for energy transfer rather than cations contained in zeolite cavities.
The size of cation in zeolite cavity seems to affect the chemical interaction between
adsorbed water and active sites for energy transfer.30 A part from the A type zeolite, Y
type was investigated and dehydroxylated zeolite (NaY) containing different acidic
sites were conceived depending on the calcination temperature used to vary the acidic
strength. This Y type was compared to a decationated form (HY) characterized by its
structural hydroxyl groups. It has been showed that when no physisorbed water is
present, H atoms are formed from the decomposition of surface hydroxyl groups.
𝐺(𝐻2) and 𝐺(𝐻) are produced by, the contribution of Lewis sites formed during
dihydroxylation and Bronsted acidic nature of hydroxyl groups.29
It has been demonstrated that not only specific surface area is important in the
production of H2 but also the cavity size. In the case of zeolite, smaller sized cavities

43
released higher H2.31
Molecular hydrogen production has been enhanced compared
with bulk water due to energy transfer. The enhancement can be multiplied by three
and increased with increasing water quantity interacting with the zeolite and was
between 6.2x10⁻⁹ mol/J for 3.1 % of water and 1.7x10⁻⁸ mol/J for 19.1%. Increasing the
organization of water seems to decrease the hydrogen production. Compared to liquid
water, a modification of the migration properties of the intermediate species of
radiolysis may be implied in confined water and a perturbation of the recombination
mechanisms may occur resulting in the excessive production of hydrogen compared to
free liquid water.32
1.4 Water in a solid state
Ice radiolysis was also studied and would be interesting comparing to water of
crystallization. Chemical effects of ionizing radiation are harder to interpret on ice than
in liquid water. Many authors were interested by the irradiation of crystalline D2O and
H2O ice.33,34,35 NEXAFS spectroscopy was used to bring great information on the
structure of ice and its surface reactivity.36-37
Irradiation alters the structure of ice and produces H, H2, O2, H2O2 and HO2 as shown in
Figure 1.5.33
Figure 1.5. Crystalline ice film deposited at 150 K and cooled at 20 K before irradiation (dashed
line) and after irradiation at saturation (full line). The arrows indicate the spectral fingerprints

44
of each photolysis product, except for the peak labeled H2O (4a1) , which is the 4a1 state of
condensed water.33
After irradiation and at greater doses, a disorder could occur and crystallized water
becomes amorphous. In 1979, Gills 36 demonstrated that the irradiation of crystalline D2O
leans to the production of two types of localized excess electrons having different
behaviors related to dose per pulse, temperature and doping with certain additives: One
type has an absorption band in the visible and the other in the infrared.
Direct and simultaneous observation of the induced irradiation products is hard because
of the lack of techniques. O- were seen to be formed in Gamma irradiated D2O at 77 K.35
Table 1.3 resumes some H2 radiolytic yields deduced from the literature. In general,
radiolytic yields are lower than that of bulk water. Two explanations may be possible:
- Firstly, in solids free radicals are certainly less mobile
- Secondly, energy transfer by means of excitons may be important and promotes
recombination of electron and holes.
Table 1.3. Hydrogen yields measured for irradiated ice.
Temperature Irradiation
source
𝑮(𝑯𝟐)
(mol/J) x 10-7 Reference
-80°C and -196°C α-ray 0.7 38
-196°C self-irradiation 0.27 39
-15°C X-ray 0.25 34
-80°C α-ray 0.14 40
-100°C X-ray 0.1 34
-180°C X-ray 0 41
1.5 Irradiated Hydroxides
The main changes that occur in a hydroxide subjected to irradiation are creation of
color defects, H atoms and molecular hydrogen.
First some definitions about color centers will be presented. Some examples will be
given for Al2O3 because this material is interesting for our study.
45
1.5.1 Definition of color centers
When a semiconductor or an insulator is irradiated with high energy radiation, one of
the primary processes is the creation of electron-hole pairs. The pair-creation energy
𝜖 is approximatively 3 times the band gap 𝐸𝑔.42 Holes and electrons created by radiation
can be trapped by impurities (compensators in the case of doping) or lattice
imperfections. Point defects such as interstitials (lattice atom or ion displaced from its
normal site) or vacancy (lattice ion missing from its normal site) can be native defects
or created by elastic collisions. In ionic solids, point defects can be either anionic or
cationic. These defects can be detected by various techniques, especially electron
paramagnetic resonance and optical absorption. 43
In conclusion, a change of charge state of an impurity in an insulator is a common
product of ionizing radiation. Depending on the nature of the host lattice and the type
of impurity electrons or holes are captured. The temperature has a major role also in
the stability of the centers. In ionic crystals there is a wide variety of defects due to the
presence of both cation and anion sub-lattices, the multiplicity of charge states and
different type of impurities. Different nomenclatures of defects exist. Numerous
authors use Kroger-Vink notation. Hayes and Stoneham propose another nomenclature
that is resumed below: 22
- F centers: negative-ion vacancies containing the same number of electrons as
the charge of the normal lattice ion. F centers can be vacancies with one or two
electrons.
- V centers: positive-ion vacancies whose neighbors contain the same number of
holes as the charge of the normal lattice ion that is missing.
- H centers: negative-ion interstitial atoms that has combined with a lattice ion so
that a molecular ion shares a normal lattice site. It doesn’t have a net charge
compared to the perfect lattice.44
When the center is adjacent to an impurity, the nature is specified by subscripts, for
example, a F-center adjacent to a Na impurity is written 𝐹𝑁𝑎. The charge state is
referred to the normal charge state of the lattice site. The valence of the center is
represented by the superscript, for example, a V-center with a net negative charge is
written 𝑉−. These defects are schematized in Figure 1.6.

46
Figure 1.6. Illustration of radiation-induced color centers.
Substitutional impurities are designated by specifying the ion under brackets, for
example, in oxide the two common type of substitutional impurities are [𝑌−] or [𝑀𝑒3+]
where 𝑌 and 𝑀𝑒 denote anion and metal ion respectively.
In oxides the hole is trapped at a cationic defect (cation vacancy or charge deficient
cation) site and is localized on neighboring oxygen. It is trapped in the 2pz oxygen
orbital pointing towards the cationic defect. The resulting center is a O- ion, it has a
spin ½ and the g-factor anisotropy is determined by the axial component of the crystal
field and is given by: 45
(10)
𝑔𝑧 = 𝑔𝑒 (11)
𝑔𝑥 = 𝑔𝑦 = 𝑔𝑒 −2𝜆
𝛥
𝑔𝑒: free electron g-factor
𝜆 = −0.017 𝑒𝑉: spin-orbit coupling constant of the O- ion
Δ: energy splitting creating by the cationic defect
To sum up the ESR spectrum of a O- ion is an axial anisotropic line with 𝒈𝒙 = 𝒈𝒚 >
𝒈𝒛 ≈ 𝒈𝒆.
Another important defect identified in oxide is superoxide center 𝑂2−. In this case the
hole trapped in a 𝜋-type molecular orbital made of 2px, 2Py oxygen orbitals. When 𝑂2−
is trapped in a solid, the g-factor is given when 𝛿 ≫ 𝜆:
(12)
𝑔𝑦 = 𝑔𝑒
(13)
𝑔𝑥 = 𝑔𝑒 +2𝜆
Δ
47
(14)
𝑔𝑧 = 𝑔𝑒 +2𝜆
δ
𝜆 = 0.014 𝑒𝑉: spin-orbit coupling constant of the 𝑂2−
Δ: energy splitting between the ground state and the antibondong 𝜋𝑔∗ orbital containing
the unpaired electron
δ: energy splitting of the 𝜋𝑔∗ manifold
To sum up the ESR spectrum of a 𝑶𝟐− center is an anisotropic line with 𝒈𝒛 > 𝒈𝒙 >
𝒈𝒚 ≈ 𝒈𝒆.
1.5.2 Colors centers in oxides
Irradiation of oxides such as MgO, BaO, CaO, Al2O3 and so on by energetic particles
leads to the displacement of an atom into an interstitial position leaving a vacancy
behind, and forming what is commonly called a Frenkel defect. Interstitial and vacancy
can be neutral. Anionic vacancies can trap one or two electrons (so-called F centers)
and cationic vacancies can trap holes (so-called V-centers).18
V centers in alkaline earth oxides were shown to be intimately connected with
impurities such as Na+, Li+, F- and OH-.46 In insulator as the overall charge must be
conserved, it is easy to state that impurities play an important role in the stabilization
of defects. It has been also shown that the overall number of anion vacancies is
determined by a number of factors: 29
- The concentration of Mg2+ and other acceptor type impurities such as Ca2+, L+,
N3-…
- The concentration of the compensation donor type impurities such as Si4+, Ti4+,
F-, OH-…
Table 1.4 gives a summary of some results obtained in Al2O3.
Gamble et al studied gamma-irradiated single crystals of Al2O3 at 77 K.45 They
observed a single asymmetric, anisotropic line with 𝑔𝑧 = 2.012, 𝑔𝑥 = 𝑔𝑦 = 2.008 and
Δ𝐻𝑝𝑝~5 𝑚𝑇. This line was decomposed in three Gaussian components with isotropic
g values: 𝑔1 = 2.020, 𝑔2 = 2.006 and 𝑔3 = 2.006. The first two components are
attributed to a trapped hole localized on an anion adjacent to a charge deficient cation
site and the last one to a single electron trapped at an anion vacancy.
Cox using Al2O3 doped with Mg, Li and Ti, identified ESR parameters of one hole
centers [𝑂−𝑀𝑔2+], [𝑂−𝐿𝑖+]− and 𝑉2−.47 He also observed S=1 centers attributed to
the localization of two holes on two anions neighbors of the cation defect.

48
By comparing EPR spectra of pure and Fe-doped single crystals of Al2O3 irradiated
using gamma at 77 K, Bauer and Whitmore suggested that one center is created and
correspond to a trapped hole localized on an anion adjacent to a substitutional divalent
iron.20
Lee et al showed that 𝑉𝑜𝐻− centers are observed in gamma irradiated Al2O3 at 300 K.30
These centers disappears upon oxidation of Al2O3 at 1350°C in air. In oxidizing
samples, two holes centers 𝑉− are observed. They anneal out at 380 K and are replaced
by another hole center 𝑉2−.
Fe3+ and Cr3+ were found in pure Al2O3 located in substitutional cation sites. Cr3+ was
also detected in aluminum oxide. 48 Fe3+ impurities are presented by an EPR line at 𝑔 =
4.3.

49
Table 1.4: Characteristic g-values, peak-to-peak ΔHpp width and aluminum hyperfine constant a
of paramagnetic centers in irradiated Al2O3.
Center gx gy gz a
(mT)
ΔHpp
(mT) Reference
F 2.0045 1.0 49
F* 2.0060 1.8-3.0 45
O- 2.0155 4.3-5.0 49-50
O- 4.3 51, 50
O- 2.009 2.3 52
O- or VMe 2.0200 2.5-3.0 45
O- or VMe 2.0060 2.5-3.0 45
Al-O--Al 2.0036 1.0 49
Al2+ 2.0200 1.9850 ax,y=4.6
az=4.85 49
Al3+O- 2.0110 4.4 53
[𝑂−𝑀𝑔2+] 2.030 2.016 2.003 47
[𝑶−𝑳𝒊+]− 2.023 2.014 2.003 47
𝑉2− 2.020 2.013 2.003 47
𝑉𝑂𝐻− 2.0110 2.0180 4.5 17
𝑉2− 2.0130 2.0110 5.0 17
|𝑫|
(GHz) |𝑬| (GHz)
[𝑶−𝑳𝒊+] 3.05 0.8 47
𝑽− 3.44 0.86 47
* Single electron trapped at an anion vacancy
1.5.3 F-center in hydroxides
F centers were detected in different hydroxides irradiated using X-ray at room
temperature 50 and Gamma ray at 77 K.54-55 They can be located in the bulk as well as
on the surface. 50, 56 They have been identified in Al(OH)3 and Mg(OH)2 using EPR
spectroscopy as a narrow singlet with a g factor of 2.002-2.004.50, 54 In Mg(OH)2 and

50
Ca(OH)2 F centers can be formed due to localization of the electrons of the biographic
vacancies57 as well as in mechanically treated samples as demonstrated in Al(OH)3.54
Table 1.5 gives a summary of ESR parameters of F-centers identified in different
hydroxides.
Table 1.5. Characteristic g-values, peak-to-peak width of F-centers in irradiated
hydroxides.
gx gy gz ΔHpp (mT) Material Reference
1.9919 0.6 Sr(OH)2 58
2.0020 Al(OH)3* 54
0.14 Al(OH)3 50
1.999 Mg(OH)2 56
1.9998-
1.9992
Ca(OH)2 56
1.9807 2.0 Ba(OH)2.7.4H2O 59
1.9807 2.0 Ba(OH)2.1.7H2O 59
1.9807 2.0 Ba(OH)2 59
* Hydrargillite
1.5.4 Hole centers in hydroxides
Hole centers in hydroxide are identified as O-. Compared to oxide this center is unique
because it is neutral in charge and does not require a charge compensator such cationic
vacancy or impurities. Then it results in an unstrained lattice.
O- identified in gamma irradiated hydrargillite Al(OH)3 and Al2O3 at 77 K was shown
to be located in the subsurface. Attributed g factors were respectively,
gav=2.016 ± 0.001 (ΔH1/2 = 5.3 mT) and g = 2.0122 (ΔH = 3 mT). O- was also observed
in X-ray irradiated Al(OH)3 with a g factor of 2.0155 ± 0.001 (ΔH1/2 = 4.3- 5 mT).50
O3- with g = 2.012 was encountered in irradiated Al(OH)3. It was described to be formed
as an interaction between O2 adsorbed in vacancies with O- ion-radical and shown to
be stable up to 300 K.54 Blaginina also observed oxygen anion defects related to Al3+
(Al3+ O-) with a g factor of 2.011 (ΔH of 4.4 mT).53 Two types of O- were detected in
irradiated Al(OH)3 dried for 10 h at 433 K then sealed under vacuum in EPR tubes. The
first one was seen to be trapped and stabilized in Al(OH)3 and the second one exhibits
a 11 lines spectra characteristic of a hyperfine interaction with the magnetic moments

51
of two Al3+ ions (I=5/2).50 A third type can be described which is O2- formed by the
reaction between two O-.55
The effect of vacuum, air and temperature on O- ion-radicals was also studied and is
shown in the case of Hydrargillite Al(OH)3 irradiated at 77 K using γ-particles 54.
Different centers were formed depending on the atmosphere (air or vacuum) in which
samples are irradiated and on the treatment received before irradiation. On increasing the
dose and annealing, the nature of EPR spectra is difficult to be depicted since a
superposition of several singlets belonging to O- ion-radicals in various stabilized sites
(for example in Al2O3 and Al(OH)3) is observed.56, 60
Steinik and Barsova54 observed no difference in concentration of paramagnetic centers
between materials irradiated in vacuum and in air. They concluded that the centers are
probably located in the bulk or subsurface layer.
The study of the accumulation of paramagnetic centers with respect to the dose could
lead us to know whether intrinsic radiation centers are formed and the biographical
defects existing before irradiation are filled by electron holes or not.
Conducting a study on Mg and Ca hydroxides, Barsova 56 shows that 2 centers could be
formed after irradiation:
The first one formed at 77 K and 300 K and having a short spin lattice relaxation period
that could be assigned to O- ion-radical and that could be formed as following:
(15)
𝑂𝐻− → 𝑂𝐻 + 𝑒_
(16)
𝑂𝐻− + 𝑂𝐻 → 𝑂− + 𝐻2𝑂
(17)
𝑂𝐻− → 𝑂− + 𝐻
The second is not formed in samples irradiated at 77 K and exposed to air and has a long
spin-relaxation period (surface electron center).
Symons suggested that O- is formed by deprotonation of OH radicals:61
(18)
𝑂𝐻 + 𝐻2𝑂 = 𝐻3𝑂+ + 𝑂_

52
The formation of O-, O2- and O3
- is also reported in Sr(OH)2, Ba(OH)2 and
Mg(OH)2.7H2O.58, 66
Table 1.6 represents a summary of the major radiation induced defects explained above
in different irradiated samples. g values are given as encountered in the literature.
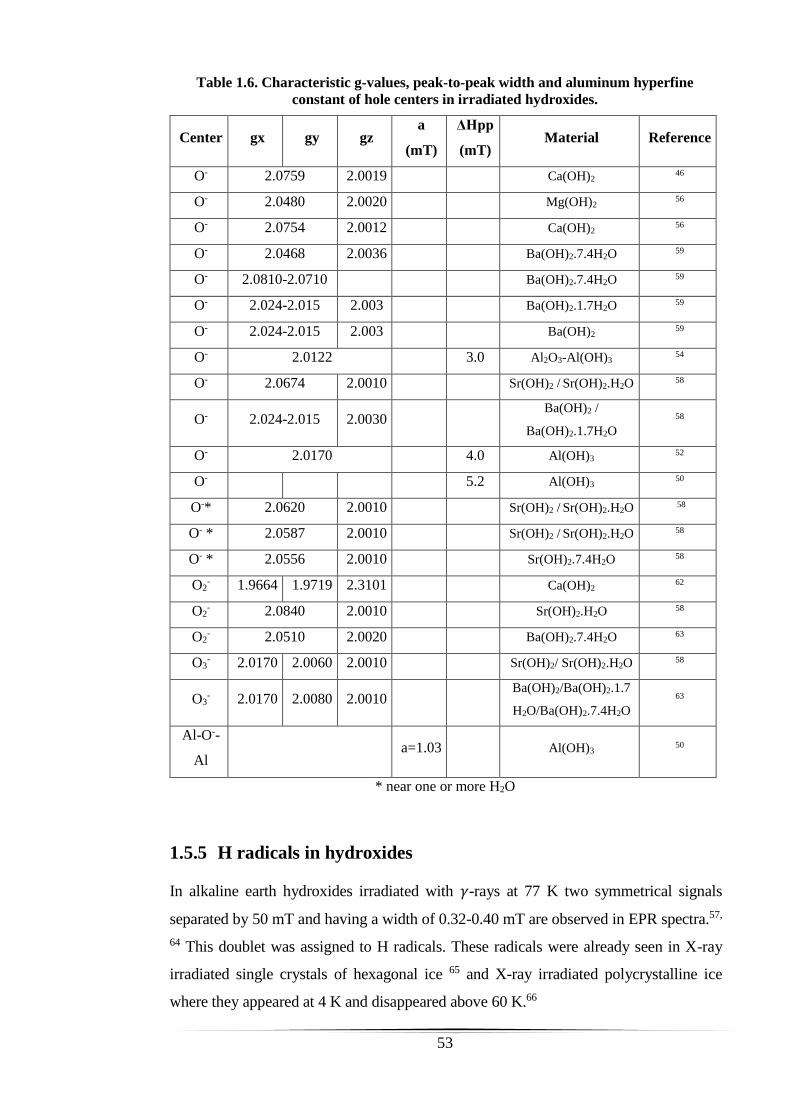
53
Table 1.6. Characteristic g-values, peak-to-peak width and aluminum hyperfine
constant of hole centers in irradiated hydroxides.
Center gx gy gz a
(mT)
ΔHpp
(mT) Material Reference
O- 2.0759 2.0019 Ca(OH)2 46
O- 2.0480 2.0020 Mg(OH)2 56
O- 2.0754 2.0012 Ca(OH)2 56
O- 2.0468 2.0036 Ba(OH)2.7.4H2O 59
O- 2.0810-2.0710 Ba(OH)2.7.4H2O 59
O- 2.024-2.015 2.003 Ba(OH)2.1.7H2O 59
O- 2.024-2.015 2.003 Ba(OH)2 59
O- 2.0122 3.0 Al2O3-Al(OH)3 54
O- 2.0674 2.0010 Sr(OH)2 / Sr(OH)2.H2O 58
O- 2.024-2.015 2.0030 Ba(OH)2 /
Ba(OH)2.1.7H2O
58
O- 2.0170 4.0 Al(OH)3 52
O- 5.2 Al(OH)3 50
O-* 2.0620 2.0010 Sr(OH)2 / Sr(OH)2.H2O 58
O- * 2.0587 2.0010 Sr(OH)2 / Sr(OH)2.H2O 58
O- * 2.0556 2.0010 Sr(OH)2.7.4H2O 58
O2- 1.9664 1.9719 2.3101 Ca(OH)2 62
O2- 2.0840 2.0010 Sr(OH)2.H2O 58
O2- 2.0510 2.0020 Ba(OH)2.7.4H2O 63
O3- 2.0170 2.0060 2.0010 Sr(OH)2/ Sr(OH)2.H2O 58
O3- 2.0170 2.0080 2.0010
Ba(OH)2/Ba(OH)2.1.7
H2O/Ba(OH)2.7.4H2O
63
Al-O--
Al a=1.03 Al(OH)3 50
* near one or more H2O
1.5.5 H radicals in hydroxides
In alkaline earth hydroxides irradiated with 𝛾-rays at 77 K two symmetrical signals
separated by 50 mT and having a width of 0.32-0.40 mT are observed in EPR spectra.57,
64 This doublet was assigned to H radicals. These radicals were already seen in X-ray
irradiated single crystals of hexagonal ice 65 and X-ray irradiated polycrystalline ice
where they appeared at 4 K and disappeared above 60 K.66

54
Two types of H atoms were resumed in the case of alkaline earth elements described by
Spitsyn et al.57
- A type formed by radiolysis of sorbed water (water crystallized) and are
stabilized in tetragonal cavities between OH- layers (A type has a hyperfine
structure of 50.4 mT and ΔH1/2 = 0.36 mT).
- B type that appeared in thermally treated samples (B type has a hyperfine
structure of 48.6 mT and ΔH1/2 = 0.34 mT).
ESR spectra of H radicals were also observed in γ-irradiated hydrargillite (Al(OH3) at 77
K 54 and in X-ray and γ -irradiated Bohemite, Gibbsite and Bayerite at 77 K.64 Vedrine
showed that disorder tends to reduce the thermal stability of H radicals.
Radiolytic yields of H radicals were resumed in Table 1.7. These yields were determined
using EPR and are not frequently quantified.
Unlike others hydroxides some aluminum hydroxides were described to stabilize
atomic hydrogen at room temperature and higher. For example, studying irradiated
AlF3:OH and AlOOH with different irradiation sources (60Co, X-ray, Hg-lamp and
sunlight), Scholz et al observed atomic hydrogen up to a maximum temperature of
280ºC in AlF3:OH and to 150ºC in Al(OH)3.67 They suggested that the stabilization of
H radicals requires the presence inside the matrix of symmetric host cages. As observed
in the case of low temperature irradiated Boehmite, the yield of observable H radicals
can be reduced by milling. It assumes that this treatment induces a cage deformation
that prevents the stabilization of the H radicals and promotes their chemical reactions.
Crystallographic shapes were shown to be important in the production of H2, this could
be due to the symmetry and several types of stabilization sites of atomic H.57, 68
To sum up, in order to form trapped H radicals, suitable precursors have to be present in
the irradiated environment:69
- Impurities should be the minimum possible,
- Symmetrical local environment has to exist in order to prevent H atoms from
leaving the cage-like structural units where H radicals are stabilized and prevent
them from participating in chemical reactions.

55
Table 1.7. Radical hydrogen radiolytic yields found in literature Irradiated with 60Co at
77 K.57
Material G(H°) (10-7 mol/J)
Mg (OH)2 0.14
Ca(OH)2 0.22
Sr(OH)2.8H2O 0.10
Sr(OH)2 0.083
Ba(OH)2.8H2O 0.21
Ba(OH)2 0.10
1.5.6 Hydrogen production in hydroxides
As seen before, the radiolytic yield of molecular hydrogen depends on the form of
water. Table 1.8 summarizes 𝐺(𝐻2) in different hydroxides, some hydroxides may
have a substantial contribution to H2 formation. Moreover the type of anionic metal
forming hydroxide affects the production of H2.
Westbrook and al studied the molecular hydrogen production from Boehmite AlOOH
and Bayerite and Gibbsite Al(OH)3 under Gamma irradiation. Interestingly, they
noticed no molecular hydrogen production from Al(OH)3 containing more radiolysable
sites. In order to interprete their result, they used density functional theory (DFT) and
explained that the removal of a hydrogen atom is energetically more favorable from
Boehmite than from Gibbsite (Estimated energy barrier for H atom loss from Boehmite
was supposed to be 7.3 eV and for Gibbsite 7.9 eV). Also the estimated energy for
molecular hydrogen removal was higher in the case of Gibbsite (6.46 eV) than in
Boehmite (4.2 eV) which can explain the higher radiolytic yield in the latter case.

56
Table 1.8. Molecular hydrogen radiolytic yields found in literature. Values in parentheses
represent the total hydrogen released after dissolution.
*Baked at 100°C for 24 hours. Specific surface area not specified.
** 1.3310-8 bar 200°C (Ba(OH)2) 130°C (Sr(OH)2). Specific surface area: 0.5-1.5 m2/g
*** Baked at 60°C for 24 hours. Particle size 45-63 µm.
Material Irradiation G(H2) (10-7 mol/J) Reference
Ca(OH)2* 60Co 0.21
70
Ca(OH)2* He 5 MeV 0.051
Mg(OH)2* 60Co 0.053
Mg(OH)2* He 5 MeV 0.038
Sr(OH)2**
60Co
0.13 (0.20)
58
Sr(OH)2 H
2O** 0.042 (0.10)
Sr(OH)2 7.4 H
2O** 0.031 (0.05)
Ba(OH)2** 0.073 (0.083)
Ba(OH)2 H2
O** 0.093 (0.21)
Ba(OH)2 7.4 H
2O** 0.052 (0.072)
AlO(OH)*** 60Co
0.057-0.13 6
Al(OH)3*** 0
1.6 Conclusion
A general overview of radiation interaction with matter was presented. In insulators
such as oxide and hydroxide, many point defects and color centers are created either
by elastic collision or electronic excitation. The presence of water at the surface or
inside the structure induces the production of molecular hydrogen. The radiolysis of
water depends on the solid and on the bonding between water molecules and solids or
on the bonding of water molecules themselves.

57
In solids unlike the radiolysis of liquid water, energy transfers via exciton or charge
carriers play a major role in the modification induced by radiation. These processes are
complex, therefore they were only relatively well documented for a limited number of
materials. As seen in the literature review above, radiolytic yields of molecular
hydrogen are available for some hydroxides but the effect of many factors encountered
in practice (as nuclear waste assemblies, for example) such as specific surface area,
nanometric particle size, impurities, temperature, structural and adsorbed water has not
been specifically studied.
The aim of the work presented in the following sections is to contribute toward
clarification of the impact of particle size and impurity on the production of molecular
hydrogen in aluminum and magnesium hydroxide and in aluminum oxyhydroxide. We
also payed special attention to study the contribution of structural and adsorbed water.
The primary ambition of this study was to clarify the mechanism of formation of
hydrogen from structural water encountered in hydroxide. Since many questions
remain unanswered, we tried to discuss the following ones:
What are the precursors of molecular hydrogen in hydroxides and oxyhydroxides?
Are hydrogen atoms the only precursors?
What are the main transformations related to the production of H2 and how do defects
interfere in the production of molecular H2?
Molecular hydrogen production with respect to many physical parameters will be
presented. Detailed EPR studies will be exposed in order to try to characterize the
defects associated with molecular hydrogen. A simulation to other hydroxides could be
done using conclusions drawn from AlOOH and Al(OH)3

58

59
2. Chapter 2: Facilities, equipment and techniques
In this chapter, chemicals, radiation sources and analytical techniques employed in this
project are described. Drying optimization as well as hydration of AlOOH L and
Al(OH)3 and Mg(OH)2 synthesis are represented.
Structure and radiation induced defects characterization are listed as well as gas
analysis.
2.1 Al(OH)3 and AlOOH
The main investigation was led on granular powders of oxyhydroxides AlOOH
(Boehmite) and hydroxides Al(OH)3 (Bayerite). In order to ensure reproducibility all
samples were taken from the same batch procured from Sasol, Germany.
AlOOH was studied in two different crystallite sizes, while one particle size was
investigated in the case of Al(OH)3. Large particle size and small particle size will be
denoted AlOOH L and AlOOH S respectively.
2.1.1 Drying optimization
Samples placed in glass ampules were dried by heating the powder using a Carbolite
tube furnace under high vacuum conditions (10-4 mbar). Before defining the suitable
temperature adopted, temperature and heating duration were determined. Drying was
optimized using the thermogravimetric analysis (TGA) in order to determine the
amount of water present in the samples and to be sure that structural water was not
affected by heat treatment.
Drying conditions were optimized considering the weight loss between 20˚C and the
temperature of the first Derivative thermogravimetric curve (DTG) peak due to the loss
of non-chemically bound water (physisorbed water). Care was taken not to exceed the
temperatures higher than that of the DTG peak due to complete dehydration of the
structure corresponding to Al2O3 formation. Related transition temperatures are 350°C
for Al(OH)3 and 450°C for AlOOH,71 though it was proved that thermal decomposition
could occur at 200°C under secondary vacuum,72 therefore this limit was not exceeded
while preparing our samples.
The optimum conditions adopted were 170°C during 5 hours for AlOOH and 130°C
during 4 hours for Al(OH)3.

60
AlOOH S has to be evacuated very slowly before starting heat treatment. Two hours
were needed to evacuate the sample by gradually diminishing the pressure without
letting the powder spread all over the ampule and joints.
2.1.2 Hydration
In this study, samples were placed into desiccators, which contain various saturated salt
solutions to generate desired levels of relative humidity, denoted as RH, Water uptake
was evaluated by weighing each sample periodically.
Lithium chloride purchased from Sigma Aldrich with a reference number 746460-
100G, Potassium carbonate purchased from Sigma Aldrich with a reference number
791776-100G and Sodium chloride purchased from Sigma Aldrich with a reference
number S9625-500G were used in order to obtain a RH of 11, 44 and 74 % at room
temperature consequently.73-74 The weight of each sample was determined periodically.
Each saturated salt solution was prepared by adding salt to warm (about 40°C) distilled
water and stirring until having a supersaturated solution. The last-mentioned element
is then cooled to ambient temperature and allowed to set for at least 24 hours before
use. All salt crystals should be covered by the solution.
In order to avoid the exposition of samples to air and avoid the rebalance of water
uptake, some materials were placed in Pyrex ampules connected to another ampules
containing a salt solution. These experiments will serve to give an error bar range.
Water layers
In order to understand how much water is adsorbed on each sample surface when
applying a certain relative humidity, we introduced water layers, this is important to
understand if molecular hydrogen produced comes only from adsorbed water.
In PuO2 oxide, it was supposed that the average area of a water molecule is 0.22 mg/m2
and the number of water layers can be determined as explained below. 75
For instance, at 11% imposed relative humidity, AlOOH L adsorbs 0.6 g of water/100 g
AlOOH L. Having a specific surface area of 40 m2/g, this sample adsorbs a fraction of
0.66 water layer:
(19)
𝟎.𝟔𝐠𝐇𝟐𝐎
𝟏𝟎𝟎𝐠𝐀𝐥𝐎𝐎𝐇 𝐱 𝟒𝟏𝐦𝟐
𝐠𝐀𝐥𝐎𝐎𝐇 𝐱 𝟎.𝟎𝟎𝟎𝟐𝟐
𝐠
𝐦𝟐 𝐇𝟐𝐎

61
In our calculations, the value supposed by Livingston as the average area of a water
molecule is 0.28 mg/m2 is going to be used deduced from the cross-sectional areas of
water on over twenty non porous adsorbate systems similar to that used in our study.
The previous equation resumes water layers formed in each hydrated case and is needed
to deduce the radiolytic yield of the adsorbed water deduced by energy received by the
fraction of water only and not by all the system. The amount of water is difficult to be
measured accurately. Error bars were introduced (10, 4 and 3% for AlOOH L, AlOOH
S and Al(OH)3 consequently) by considering the minimum and maximum value in each
case.
2.2 Mg(OH)2
2.2.1 Sample preparation
In order to study the effect of impurity and smaller particle-size (3 nm) on molecular
hydrogen production, Mg(OH)2 was prepared using a simple one-step synthesis
following Sutto method.76 Nanoparticles of Mg(OH)2 were prepared using potassium
superoxide (KO2) purchased from Sigma Aldrich with a reference number 278904 50G,
magnesium sulfate (MgSO4) from Sigma Aldrich with a reference number
63136 1KG F and methanol purchased from Sigma Aldrich with a reference number
34860-1L-R. In order to vary the impurity, magnesium nitrate hexahydrate
(Mg(NO3)2.6H2O) was used instead of MgSO4 and was bought from Suprapur Merck
Gemany with a reference number 5855.
Among the different syntheses performed only 3 will be chosen to study the molecular
H2 production with respect to impurity. The difference between the three chosen
syntheses is clarified as follows:
- The first synthesis (represented by violet color henceforth) is prepared by
adding MgSO4, KO2 and methanol and waiting for complete dissolution in
order to minimize particle size, the suspension was centrifuged at 10 000 min-1
and washed with distilled water (8 times, 30 min/centrifugation at 20°C).
Before use, this test was oven-dried at 60°C for a weekend. This sample has
18% K2SO4 as impurity amount.
- The second synthesis (represented by orange color henceforth) was conducted
in the same way as the first synthesis but suspension was washed 11 times and
freeze-dried for one night. This sample has 1% K2SO4 as impurity amount.

62
- The third synthesis (represented by olive color henceforth) where
(Mg(NO3)2.6H2O) was added instead of MgSO4 and suspension was oven-dried
at 60°C after 7 rinses with distilled water and 2 rinses with methanol. This
sample has 7% KNO3 as impurity amount.
Synthesized tests will be compared to a commercial Mg(OH)2 purchased from
Nanostructured and Amorphous Materials, Los Alamos pure at 98%. This reference
sample has a 19 nm particle size.
2.3 Irradiation Experiments
2.3.1 Radiation sources
2.3.1.1 The linear accelerator LINAC
Irradiations were performed using the electron pulses of a Titan Beta, Inc. linear
accelerator (Laboratoire Interdisciplinaire sur l'Organisation Nanométrique et
Supramoléculaire LIONS, CEA Saclay, France). Electrons of 10 MeV with a pulse
length of 10 ns were used. All experiments were done at a pulse frequency of 5 Hz.
Only one test at 1 Hz was done in order to verify that samples were not heated during
irradiation.
Glass ampules containing the materials were directly placed in front of the window
from where electron beam goes out.
2.3.2 Gamma source Cesium-137
In this study, Gamma irradiations were carried out by gamma-rays from Cs-137 source
(Nordion Gammacell®, LIONS, CEA Saclay, France). The Gammacell is well shielded
and encased in welded steel. The cesium-137 source material is in the form of 137CsCI,
its activity is 50 TBq approximatively. It is contained in a stainless steel tube as seen
in Figure 2.1. This tube is placed next to the irradiation chamber that contains a canister
in which 6 10 cc-ampules can be placed in cylindrical holder. The canister is placed on
a rotating plate, once irradiation starts, the samples turn around the source in order to
ensure dose uniformity.

63
Figure 2.1. Scheme of a Gammacell 3000 in irradiation position. The Cs-137 radioactive source is
in the vicinity of samples contained in a canister.
2.3.3 Heavy ion irradiation
Samples placed in thin wall Pyrex ampules (4 mm diameter and 0.38 mm thickness)
were irradiated using heavy ions at GANIL (Grand Accélérateur National d’Ions
Lourds, Caen, France) in the IRRABAT chamber. During irradiation the chamber was
under vacuum and the temperature of the samples was comprised between 20 and 25°C.
The ions used in these experiments were 36Ar18+ at 95 MeV/nucleon (i.e. 3 GeV) The
samples were irradiated at two fluences: 1.25-1.30 1012 and 2.6-2.63 1012 ions.cm-2and
the flux was 3-4 108 ions.cm-2.s-1. The approximate water equivalent doses
corresponding to these fluences are 500 and 1000 kGy respectively. The deposited
energy in the materials and mean LET values were evaluated using SRIM program.10
The calculation considers the thickness of the irradiation window and a cylindrical
geometry (see Figure 2.2). The LET values were estimated to 709-762 eV/nm for
Al(OH)3, 837-864 eV/nm for AlOOH L and 864-894 eV/nm for AlOOH S.

64
Figure 2.2. Used geometry to calculate the received dose. The diameter of the bottom of
the ampule was 4 mm and 0.38 mm the glass thickness.
2.3.4 Dosimetry
Fricke dosimeter,77-78 was used to determine the dose rate delivered by the Gammacell
and was around 5.3 Gy/min.
The same dosimeter was used to measure the dose delivered per pulse from the LINAC.
It was comprised between 20 and 30 Gy/pulse.
The difference between water and the irradiated materials are expected to be minimal.
The Fricke solution was prepared using chemicals of high purity, including ammonium
iron (II) sulfate hexahydrate ((NH4)2 Fe(SO4)2·6H2O) purchased from Labosi-Analypur
with a reference number A 3045, sodium chloride (NaCl) purchased from Sigma
Aldrich with a reference number S9625-500G, and sulfuric acid (H2SO4) purchased
from Sigma Aldrich with a reference number 258105-2.5L, using a 1 L volumetric
flask. First, 22 ml of sulfuric acid [H2SO4] (95.0–99.0%) was diluted with 250 ml of
Milli-Q water, and then 0.06 g sodium chloride, and 0.392 g of ferrous sulfate were
added. The solution was added to the volumetric flask and diluted to the final volume
of 1 L with Milli-Q water. The flask containing the Fricke solution was sealed and
stored away from natural and artificial light sources for 24 h before use. Sodium
chloride should be used in order to suppress the effect of organic impurities in the
solutions.
When irradiated, ferrous sulfate solutions first give water decomposition to give free
radicals (H, OH) and molecular products (H2, H2O2):
(20)
𝑯𝟐𝑶+ 𝒓𝒂𝒅𝒊𝒂𝒕𝒊𝒐𝒏 → 𝑯,𝑶𝑯,𝑯𝟐, 𝑯𝟐𝑶𝟐

65
Then the following series of reactions occur: 79-80
(21)
𝐻 + 𝑂2 → 𝐻𝑂2
(22)
𝑂𝐻 + 𝐹𝑒2+ → 𝐹𝑒3+ + 𝑂𝐻−
(23)
𝐻𝑂2 + 𝐹𝑒2+ → 𝐹𝑒3+ +𝐻𝑂2
−
(24)
𝐻𝑂2− + 𝐻+ → 𝐻2𝑂2
(25)
𝐻2𝑂2 + 𝐹𝑒2+ → 𝐹𝑒3+ + 𝑂𝐻 + 𝑂𝐻−
(26)
𝐻 + 𝐹𝑒2+𝐻+→ 𝐹𝑒3+ + 𝐻2
According to the reactions represented above
𝐺(𝐹𝑒3+) = 2𝐺(𝐻2𝑂2) + 3𝐺(𝐻°) + 𝐺(𝐻𝑂) = 15.6𝑚𝑜𝑙𝑒𝑐𝑢𝑙𝑒𝑠 100 eV⁄ around 25˚C.
As seen below, ionizing radiation converts ferrous ions, Fe2+, into ferric ions, Fe3+, with
a known radiation yield. The production of the Ferric ions (Fe3+) was followed using a
UV-Vis spectrometer Shimadzu UV-2550 located in the LIONS, CEA-Saclay, France.
Then the absorbed dose to the Fricke solution, DF, is:
𝐷𝐹 = 𝑂𝐷
휀𝐺(𝐹𝑒3+)𝜌𝑙
Where 𝑂𝐷 is the increase in optical density at 303 nm and ε is the extinction coefficient
of Fe3+ at 303 nm minus the extinction coefficient of Fe2+ at the same wavelength. We
use a value of 20205 M−1 cm−1 for ε. 𝐺(𝐹𝑒3+) is the radiation yield of Fe3+, 𝜌 is the
density of the Fricke solution and 𝑙 is the length of the light path of the cell.78, 81 Hence,
a correction for fading was not considered. The colorimetric dose response is linear up
to 400 Gy.82 Figure 2.3 presents an example of Fricke dosimetry curve. Error bars are
considered as 15%.

66
Figure 2.3. Fricke dosimetry curve showing the variation of absorbance with respect to
pulse number delivered by the LINAC.
Fricke dosimetry was verified by using thiocyanate dosimetry.
The 𝑆𝐶𝑁− ions contained in a solution of potassium thiocyanate (KSCN) react with
𝑂𝐻 radicals and produce (SCN)2- ions:
(27)
𝑂𝐻 + 𝑆𝐶𝑁− → 𝑂𝐻− + 𝑆𝐶𝑁°
(28)
𝑆𝐶𝑁° + 𝑆𝐶𝑁− → (𝑆𝐶𝑁)2−
The (SCN)2- ions are quantified using optical adsorption at 475 nm.
The dosimetry is usually made in 0.01 mol dm-3 air or oxygen-saturated solution. The
dose is calculated from 𝐷 = 𝐺휀𝑙𝜌 using absorbance at 475 nm and 𝐺휀= 2.6x10⁻⁴ m2J-1
where ε is the extinction coefficient at 475 nm, 𝑙 is the light path in the optical cell and
𝜌 is the density.83
L-α–alanine EPR dosimetry was used in order to determine the dose delivered in the
EPR tubes and Dewars irradiated with electron beams (see section 2.3.5.1). Alanine
pellets bought from Sigma Aldrich were placed in the EPR tubes and the height of
alanine column was enough to cover the whole active region of the microwave cavity
in the EPR spectrometer. After irradiation, L-α–alanine amino acid (CH3-CH(NH2)-
COOH) is deaminated and produces a stable alkyl free radical, CH3C•HCOO. The
concentration of these radicals is proportional to the absorbed dose over a wide range

67
of doses (1–105 Gy) and can be estimated quantitatively using the EPR
spectrometry.84, 85-86
2.3.5 Radiation vessels
2.3.5.1 Vessels used to measure H2 production
Sample vessels dedicated to evaluate molecular hydrogen produced and radiation
induced defects are described in this section. For a better comprehension these vessels
were drawn and shown below.
Most of the samples irradiated using electron beam dedicated to analyze molecular H2
were placed in 10 mL Pyrex ampules with valves as seen in Figure 2.4. It was easy to
use the same ampule for many irradiations by removing the valve and introducing the
powder. Only the bottom of the ampule was irradiated and was conceived to have a
spherical homogeneous shape. The preliminary washing of the ampules was optimized
in order to reduce as far as possible the hydrogen production of the empty ampules.
Ampules washing procedure:
A solution of nitric acid 2M was prepared. Small magnetic stir-bars made of Teflon
were used in each ampule containing nitric acid in order to stir all night long at 70°C.
The next day, ampules were rinsed with acidic solutions by gradually decreasing their
concentrations in order to avoid any glass attack. Ampules were then rinsed and filled
with distilled water and left at 70°C for one night. In the morning, they were oven-dried
at 120°C. The ampules were then placed in the oven at 350°C in order to regenerate the
glass. By using this protocol, H2 produced from empty irradiated ampules greatly
improved from 40 ppm to 4-5 ppm for the same dose using electron beam irradiation.

68
Figure 2.4. Pyrex ampule equipped with a valve used to analyze hydrated samples irradiated
using electron beams and that used for annealing. Longneck ampules were used in order to keep
the rubber seal attached to the valve clean and maintain the vessel leak proof.
These ampules with a valve were especially dedicated for hydrated samples and for
annealing experiments since many analyses were needed and it is possible to open the
valve and insert samples as many times as we want.
Though, dry samples were irradiated in ampules able to be sealed to maintain airtight
integrity since low quantities of H2 are released and sometimes gas could not directly
be analyzed after irradiation (see Figure 2.5). These ampules having a volume of 20 ml
were used for Gamma analyses where irradiation is homogenous and only glass and
powder were irradiated. Ampules used in Figure 2.5 were also used for dry samples
irradiated with electron beams since low H2 quantities were released. These ampules
have an aperture side where we can introduce the sample and gas (pure Helium) and
another sealed one that permits the gas analysis. This side looks like a pig tail (Figure
2.5, right), it was connected to the chromatography and once the desired vacuum is
achieved, the tail was broken and released gas was analyzed.

69
Figure 2.5. Pyrex ampules equipped with a pigtail used to analyze dry electron beam
irradiated samples and all Gamma irradiated samples. The aperture from one side
facilitates the introduction of the sample and gas (left). Ampules are then sealed,
powder is irradiated and gas is analyzed by breaking the pigtail (right).
Ampules used for heavy ions irradiations were conceived to be airtight, as seen in
Figure 2.6. They were sealed and have a volume of 6 cm3 after sealing. These sealed
ampules, as seen in the previous ampule, have a pigtail that needs to be broken in order
to analyze the gas that is released after irradiation. This ampule was conceived for
heavy ions with a bottom diameter of 4 mm and a glass thickness of 0.5 mm. Only the
bottom containing the powder was irradiated and was conceived thinner in order to
avoid important beam attenuation caused by the glass. Helium gas was used as a pure
gas to fill the ampules before sealing.

70
Figure 2.6. Pyrex ampules equipped with a pigtail used to analyze samples irradiated using
heavy ions. The aperture from one side facilitates the introduction of the sample and gas (left).
The bottom is 4 mm diameter tube. Ampules are then sealed, powder is irradiated and gas is
analyzed by breaking the pigtail (zoom on the right).
2.3.5.2 Vessels used for EPR analysis
Concerning samples dedicated to EPR analysis, Room temperature EPR sample cells
were standard NMR tubes evacuated and flame-sealed. Though, samples dedicated to
low temperature EPR, also irradiated at low temperature were irradiated in EPR cold
finger quartz Dewar Figure 2.7. Samples irradiated for low temperature EPR were
made into pellets. It was essential in order to irradiate in the same vessel and analyze
by EPR without creating irradiation defects in the zone analyzed by the EPR. The pellet
is irradiated while it is hanged to the wire and once irradiated it is released to the bottom
of the where it is supposed to be analyzed by EPR.
Dewars are filled with liquid nitrogen in order to keep the samples irradiated at 77 K.

71
Figure 2.7. EPR cold finger Dewar used to analyze irradiated pellets at low
temperature. The sample is introduced attached to a metallic wire (left) and is then
irradiated at the top of the thin quartz tube. After irradiation the pellet is released to
the bottom of the Dewar in order to be analyzed by EPR.
2.3.5.3 Annealing experiments vessels
In order to quantify the release of molecular hydrogen trapped after irradiation,
detrapping experiments were conducted using dissolution or annealing. A scheme of
the ampule used is described in Figure 2.8.
Dissolution ampules were made conic-like from the bottom in order to irradiate the
minimum possible quantity and to be able to dissolve it without wasting many days
since dissolution was hard even when finding the suitable dissolvent.

72
Figure 2.8. Conic-like Pyrex ampules equipped with a J Young valve that resists to acidic and
basic attack used to analyze gas released from dissolved irradiated samples.
Annealing experiments serving for the quantification of molecular hydrogen released
from the structure were done at different temperatures using the same ampules
described in Figure 2.4.
As seen in Figure 2.9, a first ampule containing irradiated powder was attached to
another one that serves as a water trap. Glass balls are inserted in the water trap ampule
in order to increase the specific surface of water adsorption. The ampules are connected
with a glass connection under vacuum. Annealing was done from 40°C to 250°C
(40°C/hour) and at 500°C for 120 minutes in the case of AlOOH L and S and at 400°C
for 90 minutes in the case of Al(OH)3. Annealing experiments were conducted until
complete dehydration of the materials that leads to the formation of Al2O3 in order to
release all the gas that may be trapped inside the structure.

73
Figure 2.9. Annealing system consisting of the evacuated irradiated ampule (left) heated with a
tube furnace until transition temperature is attended and connected to another ampule under
vacuum (right). This latter is cooled using liquid nitrogen in order to trap water and adsorb it on
the glass beads inside.
2.4 Characterization before and after irradiation
2.4.1 X-ray Crystallography (XRD)
X-Ray diffraction (XRD) was used for three main purposes: phase identification,
crystallite size estimation and comparison before and after irradiation.
X-Ray Diffraction was performed at the Laboratoire Archéomatériaux et Prévision de
l'Altération (LAPA) CEA-Saclay, France. Material structures were investigated using
a photon microprobe, built on a Rigaku RU 200 rotating anode X-ray generator running
at 55 kV and 21 mA. The beam delivered by a molybdenum anode (Kα ~ 17.45 keV -
0.070 nm) was monochromatized by a toroidal multilayer mirror and then focused on
a surface of 100 100 µm2 with an average flux of 20.106 ph/s. Diffraction patterns were
collected in transmission mode with an image plate (GE Healthcare), and then
circularly integrated with FIT2D (ESRF). Data processing was carried out with the
EVA software (Bruker AXS) and the ICDD-JCPDS database.
74
In order to estimate the crystallite size D (Å), Scherrer equation was used:87
(29)
𝑫 = 𝑲𝝀
𝜷𝒄𝒐𝒔𝜽
Where 𝐾 is the Scherrer constant, 𝜆 is the wavelength of X-radiation (𝜆𝑀𝑜= 0.707 cm),
𝜃 the diffraction angle (degree), 𝛽 is the X-ray diffraction broadening (radian).
In order to determine the X-ray diffraction broadening (𝛽) that is the width of a powder
diffraction considering the broadening due to the experimental equipment, a 5 microns
alumina is used to determine the instrumental broadening. β is then determined from
Warren’s formula:
(30)
𝛽 = √𝐵𝑚2 + 𝐵𝑆2
Where 𝐵𝑚 is the measured peak width at half peak height (radian) and 𝐵𝑆 the one of the
standard material used which is alumina here.
Crystallite size is inversely related to the full width at half maximum of an individual
peak: the narrower the peak, the larger the crystallite size. This is due to the periodicity
of the individual crystallite domains, in phase, reinforcing the diffraction of the X-ray
beam, resulting in a tall narrow peak. If the crystals are defect free and periodically
arranged, the X-ray beam is diffracted to the same angle even through multiple layers
of the specimen. If the crystals are randomly arranged, or have low degrees of
periodicity, the result is a broader peak.
2.4.2 Infrared spectroscopy (IR)
In order to determine disorder and functional groups, Fourier transform infrared
spectroscopy (FTIR) was performed on a Bruker Tensor 27 FTIR spectrophotometer
using the ATR (attenuated total reflectance) technique with a Golden Gate accessory
at LIONS, CEA-Saclay, France. Spectra were collected over the range of 4000-500
cm−1 at a 4 cm−1 resolution from 100 scans. Data were analyzed using OPUS software.
2.4.3 Raman spectroscopy
The Raman spectrometer was done at LAPA, CEA-Saclay, France. It is an Invia reflex
from the Renishaw Company equipped with a frequency-doubled Nd: YAG laser
emitting at 532 nm and a solid state laser emitting at 473 nm. The laser beam is focused

75
on the sample through an optical microscope with a 50X LEICA objective, the spectral
resolution achievable by the CCD detector is around 2 cm −1. Laser spot size on the
samples is less than 2 µm. Spectra were recorded between 200 and 4000 cm-1 with a
2400 l/mm grating. Thanks to a motorized stage mapping, acquisitions can be collected.
The hyper spectral images obtained provide fruitful information on the localization of
various crystalline phases constituting the observed systems.
2.4.4 Scanning electron microscopy (SEM)
The morphology and topography of nanoparticles were recorded using a scanning
electron microscopy (SEM) at LAPA, CEA-Saclay, France equipped with a Field
Emission Gun (FEG) type JEOL (JSM‐7001F). Power and voltage were adjusted in
order to attend a spatial resolution of a few nm. Powders were placed in aluminum
support that we engraved in order to keep the powder stuck in the engraved holes. This
step was essential in order to avoid using carbon support films where we noticed a
disturbing charge accumulation on the surface of the powder. Samples were therefore
metallized with a carbon coater before observation in the scanning electron microscope.
2.4.5 Brunauer, Emmett and Teller analysis (BET)
The specific surface areas, noted BET-SSA, were calculated using Brunauer Emmett
Teller (BET) method where adsorption point P/P0 ranged between 0.06 and 0.2. This
analysis was done in collaboration with Romain Dagneli.
Adsorption-desorption isotherms with nitrogen were collected on a Micrometrics
(ASAP 2010 Instrument) apparatus at 77 K at the Laboratoire de Mesures et
Modélisation de la Migration des Radionucléides (L3MR), CEA-Saclay, France.
Samples were prepared by drying 1 g of each material under vacuum at 90°C for 1 h
followed at 105°C for 2 h to ensure a complete moisture desorption before analysis.
Pore size distribution was obtained using a Barrett Joyner Halenda (BJH) model on the
desorption isotherm.
2.4.6 Thermogravimetric analysis (TGA)
Thermogravimetric measurements were performed with a Mettler-Toledo TGA/DSC
at LIONS, CEA-Saclay, France. The samples (approximately 30 mg) were placed in
alumina crucibles and heated from 20 to 1000 °C (at 10 °C/min) under a nitrogen flux
of 50 mL/min. The data was analyzed using STARe software.
76
Sorption and desorption under conditions of defined relative humidity were also
conducted using a humidity generator HumiSys (low flow) (InstruQuest, Boca Raton,
FL, USA) coupled to the TGA. This RH generator is designed to inject humidity into
the sample chamber by means of a heated transfer line, with a maximum flow rate of
5 L/min. The RH is controlled inside the sample chamber using temperature and
humidity sensors placed inside the chamber, a few centimeters from the sample.
The relative humidity is measured using a RH sensor (Vaisala HMT337) with an
accuracy, including hysteresis, non-linearity and repeatability, of ±1% RH on the range
1–100% RH and for a temperature between 15 and 25 °C. Each 10% RH step was
imposed for 1 hour.
2.4.7 Electron paramagnetic resonance magnetometer (EPR)
In order to detect the defects induced after irradiation, Electron paramagnetic resonance
(EPR) was conducted at Laboratoire National Henri Becquerel (LNHB), CEA-Saclay,
France and Laboratoire des solides irradies (LSI), Ecole Polytechnique, France. Spectra
were acquired on an X-Band EMX Bruker spectrometer (X-Band) with a 100 kHz field
modulation. In most case microwave power and amplitude modulation were 10 mW, a
1 Gauss, respectively. The microwave frequency was measured with a frequency
counter. Quantification was estimated using a hydroxyl-TEMPO sample as a standard.
The error on the conversion factor is estimated at 25%. A cold finger Dewar was used
for measurements at 77 K.
The principle of EPR spectroscopy is presented briefly in the following.88
As a result of the Zeeman Effect, the state energy difference of an electron with S=1/2
in magnetic field H0 is:
(31)
𝛥𝐸 = 𝑔𝜇𝐵𝐻0
Where 𝜇𝐵 is the Bohr magneton and 𝑔 the gyromagnetic factor which is 2.0023 for free
electron and 𝐻0 the magnetic field. To induce transition between the energy levels, the
electron should absorb a quanta of energy ℎ𝜐 (ℎ is Planck’s constant). Then, the
preceding equation is expressed as:
(32)
ℎ𝜐 = g𝜇𝐵𝐻0
77
Then 𝑔 value is given below:
(33)
𝒈 = 𝟕𝟏. 𝟒𝟒𝟖𝟒 ∙ 𝝊 (𝑮𝑯𝒛)
𝑯𝟎 (𝒎𝑻)
The g-factor of the paramagnetic center is sensitive to its constituting atoms due to
spin-orbit coupling. In most cases, it is a tensor that mirrors the electronic structure of
the paramagnetic center resulting from the interaction of crystal field with orbitals.
In the general case, if we suppose that axes 𝑥, 𝑦 and 𝑧 are the principal directions of
the g-tensor and the corresponding g-factor principal values are 𝑔𝑥, 𝑔𝑦 and 𝑔𝑧, g can
be written as followed:
(34)
𝒈𝟐 = 𝒈𝒙𝟐𝒔𝒊𝒏𝟐𝜽𝒄𝒐𝒔𝟐𝝋+ 𝒈𝒚
𝟐𝒔𝒊𝒏𝟐𝜽𝒄𝒐𝒔𝟐𝝋+ 𝒈𝒛𝟐𝒔𝒊𝒏𝟐𝜽𝒄𝒐𝒔𝟐𝝋
𝜃 and 𝜙 are the polar angles of the field direction with respect to the coordinate system
of theprincipal directions of the g-tensor principal values.
Single crystals analyses are often needed to determine the relation between g-factor
principal values and the crystallographic or molecular axes.
In randomly oriented samples numerical simulations of EPR spectra are needed to
determine the g-factor principal values.
Another source of information on paramagnetic center can be the hyperfine structure
that results from the magnetic interaction between the unpaired electron and the nuclear
spins.
Two kinds of hyperfine interactions exist:
- Fermi-contact interaction when the electron density is non-zero at the
nucleus 𝑋. This magnetic interaction gives rise to a isotropic hyperfine coupling
𝑎𝑋 that is proportional to the unpaired electron density at the nucleus,
- Dipolar hyperfine interaction which represents the interaction between the
magnetic moments of the electron and of the nucleus. The corresponding
hyperfine coupling is a strongly anisotropic traceless tensor. In practice this
interaction is weak and rarely resolved except in single crystals.
Each nucleus 𝑋 with a nuclear spin 𝐼 splits the line into equidistant 2𝐼 + 1 lines. 𝑛 non-
equivalent nuclei give rise to (2𝐼 + 1)𝑛 lines while 𝑛 equivalent nuclei give rise to
2𝑛𝐼 + 1 lines whose intensities distribution is calculated using Pascal’s triangle.

78
2.4.8 Inductively coupled plasma atomic emission spectrometry
(ICP AES)
Inductively coupled plasma atomic emission spectroscopy (ICP-AES) also referred to
as inductively coupled plasma optical emission spectrometry (ICP-OES), was used for
the detection of trace metals.
ICP-AES (Perkin Elmer Optima 2000 DV) at Laboratoire d'Intégration de Systèmes et
des technologies (LISL), CEA-Saclay, France, served to determine the elementary
composition of studied samples. Argon gas was used to create the plasma, and SPEX
solutions were used for calibration.
Al(OH)3 was analyzed after dissolution in sodium chloride (4 molar concentration of
NaCl):89 The dissolution of 0.12 g of Bayerite in 20 ml NaCl (4M) was achieved in a
day at 150°C with continuous agitation.
AlOOH was analyzed after dissolution in sodium hydroxide (4 molar concentration of
NaOH)90;0.02g of AlOOH were dissolved in 20 ml sodium hydroxide (4 molar
concentration of NaOH) during 5 days at 160°C with continuous agitation to be
dissolved.
The content of traces in our samples was calculated by determining the number of
nanomoles per million of cells.
2.4.9 X-ray photoelectron spectroscopy ( )
X-ray photoelectron spectroscopy (XPS) consists of measuring the photoelectrons
emitted from top 10 nm of the material being irradiated by monochromatic X-rays.
Owing to the particle size of our materials, these experiments let us identify their
elemental composition, and the bonding of the atoms. A Kratos Analytical Axis Ultra
DLD, using an Al K𝛼 source monochromatized at 1486.6 eV was used NIMBE, CEA-
Saclay, France. We used a hemispheric analyzer working at pass energy of 160 eV for
the global spectrum, and 20 eV when focusing on the sole core levels. Energy
calibration was realized using C1s = 285 eV.
2.5 Gas analysis
According to hydrogen concentration; the ampules containing irradiated samples were
analyzed using two different techniques: micro-Gas chromatography and Trace-gas
chromatography. Gas analysis were conducted in the Laboratoire de radiolyse et de la
matière organique (LRMO) and LIONS, CEA-Saclay, France.

79
The concentration (mol/kg) of molecular hydrogen produced is deduced from the
following equation:
(35)
[𝑯𝟐 ] = 𝑷𝒇 ∙ % 𝑯𝟐 ∙ 𝑽𝒂
𝑹 ∙ 𝑻 ∙ 𝒎𝒔
Where 𝑃𝑓 is the final pressure, % 𝐻2 is the percentage of hydrogen measured by the
chromatography, 𝑉𝑎 is the volume of the irradiated ampule and 𝑚𝑠 is the mass of the
irradiated sample.
Radiolytic yields (G (H2)) are calculated using the total energy deposited in the
material.
(36)
𝑮(𝑯𝟐) = [𝑯𝟐]
𝑫
This radiolytic yield can be deduced from the slope of the linear regression deduced
from the graph of the production of H2 as a function of the absorbed dose (Gy in D).
2.5.1 Gas chromatography µ-GC
Hydrated samples irradiated with electron beams and annealed samples were analyzed
by µ-GC (μGC-R3000 SRA instrument) (LIONS) and Agilent 450 (LRMO) using
ultrahigh purity argon (argon 6.0) as the carrier gas. Gas chromatographs were
equipped with a Pomp turbo HiCube 80Eco (Pfeiffer) that provides a secondary
vacuum. Irradiated gas is expanded in the chromatography line evacuated under
vacuum. An automatic injection is performed after expanding the gas (0.3-0.4 bar) and
mixing it with 1.2 bar of argon for 5 minutes in order to have a pressure greater than
the atmospheric one before injecting.
The estimated error in the gas measurement is less than 10%. In this separation
technique, gas phases are separated in three minutes. It is carried out in a capillary
column (20 m MS 5Å, temperature 45°C, pressure 180 kPa). In the injector all the
components in the sample will be vaporized (Injection time: 100 ms). The carrier gas
was pure argon. Thermal conductivity detector was used. Soprane 3.5 software was
used to control the µ-GC and data processing A calibration curve is obtained using
standard gas mixture with various concentrations of H2 (from 100 to 1000 ppm).
Figure 2.10 presents the calibration curve obtained for the SRA µ-GC.
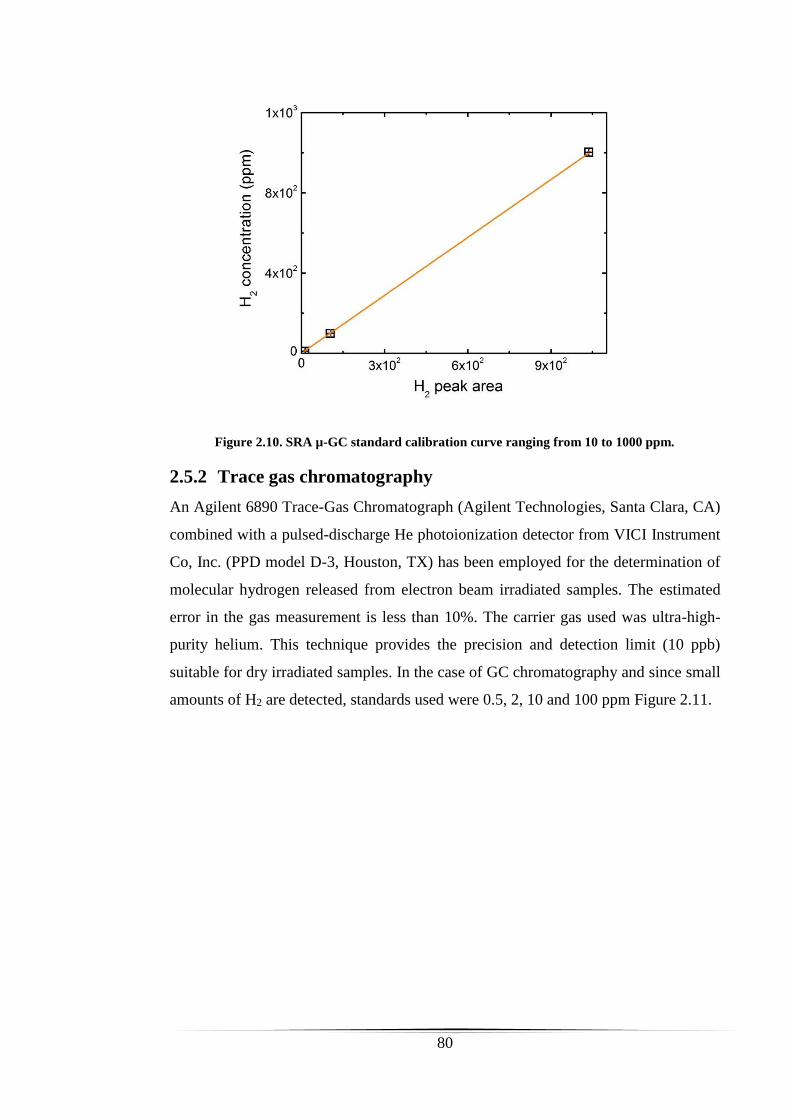
80
Figure 2.10. SRA µ-GC standard calibration curve ranging from 10 to 1000 ppm.
2.5.2 Trace gas chromatography
An Agilent 6890 Trace-Gas Chromatograph (Agilent Technologies, Santa Clara, CA)
combined with a pulsed-discharge He photoionization detector from VICI Instrument
Co, Inc. (PPD model D-3, Houston, TX) has been employed for the determination of
molecular hydrogen released from electron beam irradiated samples. The estimated
error in the gas measurement is less than 10%. The carrier gas used was ultra-high-
purity helium. This technique provides the precision and detection limit (10 ppb)
suitable for dry irradiated samples. In the case of GC chromatography and since small
amounts of H2 are detected, standards used were 0.5, 2, 10 and 100 ppm Figure 2.11.

81
Figure 2.11. GC-Traces standard calibration curve ranging from 0.5 to 100 ppm.
Theoretical concentration of standard H2 in ppb is plotted to the peak area. Peak area is
divided by each initial expansion pressure so all samples are normalized to the same
value. As for µ-GC, calibration curve was obtained using standard gas mixture.
2.5.3 Gas mass spectrometer MAT 271
Molecular hydrogen released from hydrated samples irradiated using Gamma rays and
dry and hydrated samples irradiated using heavy ions was analyzed using a high
resolution quantitative gas mass spectrometer with direct inlet for chemical and isotopic
analysis (Thermo Fischer Scientific MAT-271) at LRMO, CEA-Saclay, France.
Ionization occurred by electron impact, mass separation was performed with a
magnetic sector, and ion detection by Faraday cup and electron multiplier. The
detection limit was about 10 ppm depending on the gas matrix and mass interference.91
After irradiation the gas mixture was admitted to the mass spectrometer via a
“molecular” leak which means that the gas flow at the leak is in the molecular flow
regime. Gas composition could be determined accurately because there is no mass
discrimination and the leak rate of each gas is known using Graham’s law (inversely
proportional to the square root of the gas molar mass).

82
2.6 Summary
The chemicals and a variety of characterization methods used for surface and structure
characterization before and after irradiation have been described in this chapter.
Irradiation sources used for studying H atom formation in the radiolysis of AlOOH
and Al(OH)3 as well as chromatographs used to detect molecular hydrogen released
and radiation induced defects have been detailed.

83
3. Chapter 3 Sample characterization
In this chapter, the atomic organization and bonding inside nanoparticles are detailed.
The results of optimizing hydration and drying are shown. Impurities and specific
surface area are presented. After comparing pristine and dry samples, the effect of
hydration on samples is also shown. The characterization of irradiated samples is also
presented. The content of this chapter is essential in order to understand in the next
chapters the effect of structure, particle size, water sorption, particle size and irradiation
on the production of molecular hydrogen.
3.1 Atomic organization of the nanoparticles
3.1.1 X-ray Crystallography (XRD)
The XRD pattern of the aluminum hydroxide and oxyhydroxides and the attributed
crystallographic planes are shown in Figure 3.1.

84
Figure 3.1. X-ray diffraction pattern of AlOOH L, AlOOH S and Al(OH)3.
Boehmite was the only phase present in AlOOH L and S but Al(OH)3 contains Bayerite
and Nordstrandite (polymorph of Boehmite).
Concerning AlOOH L, the higher diffraction peak observed corresponds to the
crystallographic plane (020). On the other hand, AlOOH S diffractorgram shows the
lowest diffraction peaks. Concerning, Al(OH)3 we observe a relatively higher intensity
peak for the (001) and other crystallographic phases were seen such as (020) and (201).
Spectra obtained were comparable to others in the literature.92-93.
The XRD patterns of AlOOH S showing broader peaks confirm the smaller crystallite
size. The peaks were narrower in the other AlOOH L and Al(OH)3.
In order to see if any phase transformation occurred after heat treatment XRD was
conducted on heated samples.

85
Figure 3.2. DRX of AlOOH and Al(OH)3 comparing pristine and dry samples.
From DRX, we concluded that AlOOH L and S have an orthorhombic structure while
Al(OH)3 has an monoclinic one (Figure 3.3 and Figure 3.4).

86
Figure 3.3. Modeled AlOOH showing 3 layers where each Al is linked to one O and OH.
Figure 3.4. Modeled Al(OH)3 showing 3 layers where each Al is linked to three OH.

87
3.2 Bonding inside Nanoparticles
3.2.1 Infrared spectroscopy (IR)
FTIR spectra obtained on the Boehmite and Bayerite samples are presented in Figure
3.5. It’s worth noting here that all spectra’s intensities were normalized based on the
most intense peak in each case. The attributions of the main IR bands are presented in
Table 3.1 along with the literature data.
Figure 3.5. IR spectra of AlOOH and Al(OH)3 comparing pristine and dry samples.
Al(OH)3 spectra show sharp bands at 3548 and 3454 cm-1. These bands attributed to ʋ
OH were seen in Bayerite and Gibbsite samples described in many papers.71, 94-97 The
peak at 973 cm-1 seen in our Al(OH)3 was also described as δ OH found in Gibbsite.71,
94
AlOOH S spectra show broad bands at 3295 cm-1 and 3093 cm-1. They are in agreement
with other literatures where they are attributed to OH stretching in other Boehmites.71, 98
At 1066 cm-1 we have a δ OH bending.99
AlOOH L spectra show sharp and redshifted by 5 wavenumbers bands at 3281 cm-1 and
3088 cm-1. These bands corresponding to Al-OH stretching groups were found in other

88
Boehmite samples described by Kloprogge et al.71 The band found at 1071 cm-1
attributed to ʋ Al-OH symmetric bending was in agreement with other studies done on
Boehmite and diaspore which is an α-AlOOH.77,100 71, 101
Comparing AlOOH L and S one can see the difference in the peak width. This can lead
us to deduce that the number and strength of interactions between neighboring molecules
or intermolecular interactions vary a lot and cause the bands to be relatively broad. As
summarized by Brian Smith, the width of the IR peaks in a solid is determined by the
number of chemical environments in a sample that is related in its turn to the strength of
molecular interactions.
Table 3.1. Summary of the frequencies encountered in the IR spectra of AlOOH L,
AlOOH S and Al(OH)3. Attribution and comparison to the literature.
3.2.2 Raman spectroscopy
Raman spectroscopy was led in order to see if any H-H bonding could be seen after
irradiation in the zone of 4161.13 cm.1 103 This was not identified and maybe the
sensitivity was not enough to detect small amounts of H2 created in the irradiated
samples. Therefore Raman spectra will be especially used as a complementary method
to IR and to determine the low-wavenumber region (200-1200 cm-1) (Figure 3.6).
Frequency (cm-1) Attribution Reference
AOOH L and S 1066-1071 δ OH 106899 1070101 107171
1077102
3088-3093 ʋ OH 309098 309299 309671
3281-3295 ʋ OH 328371 329599 329798
Al(OH)3 973 δ OH 96971 98094
3421 ʋ OH 342896-97 341795
3454 ʋ OH 345271 345395 346894
3548 ʋ OH 3547 95 361794

89
Figure 3.6. Raman spectra of Al(OH)3 and AlOOH.

90
Table 3.2. Summary of the frequencies encountered in the Raman spectra of Al(OH)3, AlOOH L
and AlOOH S. Attribution and comparison to the literature are also shown.
Frequency (cm-1) Attribution Reference
AOOHL and S 356-358 Al-O 360104
480-488 Al-O 495104
675-677 γ OH 674104
3073-3077 ʋ OH 3085104
3217-3223 ʋ OH 3220 3226104
Al(OH)3 246 Al-O 250104-105
325 Al-O 322104-105
439 Al-O 435 446 104
545 γ OH 545104-105
537 γ OH 538104-105
910 δ OH 918104-105
995 δ OH 995105
3415 ʋ OH 3420104
3651 ʋ OH 3652104
3545 ʋ OH 3532 104
Ruan et al and Huang et al published some works on Gibbsite, Bayerite Diaspore and
Boehmite and their results were compared to ours in Table 3.2.104-105
Table 3.2 summarizes the major peaks. Raman spectra of Bayerite, Gibbsite and
Diaspore were more complex than that of the Boehmite in the low-wavenumber region
that are assigned to deformation and translational mode of the alumina phase. To sum
up the region between 2800 and 3700 cm-1 is associated with hydroxyl groups in
aluminum oxyhydroxides and hydroxides while between 700 and 2000 cm-1 the bands
are assigned to Al-O bond. 104, 106
3.2.3 X-ray photoelectron spectroscopy (XPS)
For all minerals XPS survey spectra and high resolution core line spectra (O 1s and
Al 2p) were obtained. Figure 3.7 shows details of each survey and the fits conducted on
each sample.

91
Al(OH)3 , AlOOH L and S show Al 2p transition at 74.10, 74.08 and 74.09 eV
respectively with a FWHM of 1.4 eV already observed in similar Bauxite samples.107
For all samples the doublet Al 2p 3/2 and 1/2 are in the same fit.
In the case of Al(OH)3 one strong peak was observed at 531.70 eV and a weaker one at
533 eV. The first peak is attributed to the hydroxyl group Al-OH and the second is
assigned to organic oxygen coming from the carbon substrate.
Two major peaks related to O 1s were seen in the case of AlOOH L and S at 530.7 eV
and at 531.9-532 eV Figure 3.7. A third broader peak was also seen at 532.9-533.5 eV.
By comparison with the XPS spectra of Al(OH)3, the peak centered at 531.9-532 eV is
attributed to hydroxyl group and the peak at 530.7 eV to O2-.
For Al(OH)3 the ratio O to Al was equal to 3 to 1 and that was expected based on the
composition of Al(OH)3. For AlOOH the ration O to Al was 2 to 1.
Table 3.3 resumes peak attribution, position and concentration in the case of AlOOH L,
S and Al(OH)3.

92
Figure 3.7. XPS survey spectra of pristine AlOOH L, AlOOH S and Al(OH)3 and high
resolution of Al 2p and O1s.

93
Table 3.3. XPS peak position and atomic concentration of each element before irradiation.
Before
Irradiation
Name Position
(eV)
FWHM Area Concentrati
on (%)
AlOOH L O 1s-1 530.65 1.459 18193.67 17.50
O 1s-2 531.89 1.459 21507.14 20.68
O 1s-3 533.07 1.840 8697.20 8.36
Al 2p 74.08 1.431 5002.34 19.48
AlOOH S O 1s-1 530.69 1.516 24293.33 29.07
O 1s-2 531.97 1.516 23378.69 27.98
O 1s-3 532.90 1.729 6903.76 8.26
Al 2p 74.09 1.433 5760.98 27.92
Al(OH)3 O 1s-1 531.70 1.643 52829.17 62.49
O 1s-2 533.39 1.741 2355.53 2.79
Al 2p 74.10 1.424 4411.00 21.12
Our studies are comparable to similar ones done by Rotole and Sherwood on a variety
of aluminum hydroxide phases.108-112 The differences in energy among the aluminum
hydroxide and oxyhydroxides are very small and are in the same order of magnitude as
the experimental precision of XPS, moreover the differences in energy between
irradiated and pristine samples are due to the precision of XPS and are not to be
considered.
3.3 Impurities
3.3.1 Inductively coupled plasma atomic emission spectrometry (ICP-
AES)
As seen from Figure 3.8, samples bought with the highest purity available were not free
of trace impurities.

94
Figure 3.8. ICP-AES of AlOOH and Al(OH)3 showing chemical trace impurities in each
case.
Iron seems to be the most important being at 85, 65 and 50 μg/g in AlOOH S, AlOOH
L and Al(OH)3 respectively. Na was only detected in Al(OH)3. Na is known to be present
in Zeolite solid systems and to capture electron. It was only detected in Al(OH)3. The
presence of chromium impurities in aluminum oxides is a known fact; it can penetrate
into the nanopowder in the course of production as well as Fe 3+ that has been described
in many other systems.48

95
3.3.2 Electron paramagnetic resonance magnetometer (EPR)
Figure 3.9 shows EPR spectra of the pristine materials at room temperature.
Figure 3.9. EPR spectrum of pristine AlOOH L, AlOOH S and Al(OH)3 showing
paramagnetic impurities
No impurities are shown in non-irradiated Al(OH)3, Non-irradiated AlOOH shows three
signals: one intense peak at g = 4.25 characteristic of Fe3+, another broad one at 267 mT
(width 113 mT) and a third small peak is seen g = 1.99 attributed to Cr3+.48, 113-115 No
Mn2+ detected in the three samples.
The morphology of our samples will be discussed in the next section.
3.4 Particle shape and surface
3.4.1 Scanning electron microscopy (SEM)
The SEM images of pristine samples presented in Figure 3.10 show that the materials
consisted of particles with irregular shapes, a few nanometers in size.

96
Figure 3.10. Scanning electron microscopy: differences between pristine AlOOH S,
AlOOH L and Al(OH)3 (x 37 000).
Not much information could be extracted from these images since the imaging of
individual nanoparticles with SEM was difficult. Nevertheless, some conclusions on the
size and shape could be drawn, a clear difference was seen between AlOOH S and L
where S has more spaces between particles. Al(OH)3 has spherical to irregular forms,
while AlOOH S and AlOOH L have undefined particle shapes.
3.4.2 Brunauer-Emmett and Teller analysis (BET)
Specific surface areas, noted BET-SSA, were calculated using Brunauer-Emmett-Teller
(BET) where relative pressure P/P0 method between 0 and 0.2.116-117 Pore size
distribution was obtained using a Barrett-Joyener-Halenda (BJH) model on the
desorption isotherm. AlOOH L has the lowest specific surface area which is 41 m2/g.
Al(OH)3 and AlOOH L specific areas were 268 and 111 m2/g respectively.

97
3.4.3 Water sorption
3.4.4 Thermogravimetric analysis (TGA)
In order to explore the dehydratation behavior of AlOOH L, AlOOH S and Al(OH)3, we
carried out the thermogravimetric analysis (TGA) measurement. Figure 3.11 indicates
the weight loss of the three samples as a function of temperature.
Figure 3.11. TGA and DTG of pristine AlOOH and Al(OH)3 under N2.
First Derivative thermogravimetric curve (DTG) peak that is due to loss of water that is
not chemically bound (physisorbed water) is clearly observed for AlOOH S before
250°C. The total mass loss is 35 ± 3 % (450°C).
In AlOOH L case, the adsorbed water eliminated in the temperature range less than
250°C is difficult to observe in Figure 3.11 since water loss was only 1.2 ± 0.1 %) of the
total mass and phase transformation occurs between 250°C and 600°C. After 600°C,
Al2O3 is formed and the total mass loss is 18.5 ± 1.5 %.
As one can notice, the mass loss of AlOOH S after dehydroxylation was higher than that
of AlOOH L and this is due to the higher content in adsorbed.
As for Al(OH)3, two different mass losses occurs: in the temperature range less than
200°C which is weakly bound water, this was only 0.4 ± 0.1 % and is not clear from the

98
given graphs and the second mass loss between 250°C and 350°C assigned to the
dehydroxylation of Al(OH)3. The total mass loss is about 30 ± 5 %.
3.4.5 Drying
The drying conditions were determined in order to remove only adsorbed water. No
weight loss until 150°C The elimination of the first derivative peak attributed to
adsorbed water (between 20˚C and 150˚C) is not so clear in the case of AlOOH L and
Al(OH)3 since it was close to the detection limit. Dry AlOOH L was prepared by
evacuating 1.2± 0.1 percent of water from its initial mass. Dry AlOOH S lost 6.8 ± 0.5
% and Al(OH)3 0.4 ± 0.1 %. As a first step, adsorbed water was verified to be removed
by considering the weight loss between 20˚C and the temperature of the first Derivative
thermogravimetric curve (DTG) peak that is due to loss of water that is not chemically
bound (physisorbed water). Care was taken to not exceed the temperatures higher than
that of the first DTG peak, where water loss is due to dehydration of the structure.
We verified that the thermal treatment did not change the structure and crystallites size
of the materials.
3.4.6 Hydration
As mentioned in chapter 2, hydrated samples were prepared using desiccators and
ampules. TGA was used for adsorption and desorption isotherm in order to predict water
uptake for each imposed relative humidity Figure 3.12.

99
Figure 3.12. Water uptake isotherm using TGA with respect to relative humidity. Full
squares are attributed to adsorption and empty ones to desorption.
From Figure 3.12, one can see that 0.5% is the maximum water uptake in the case of
Al(OH)3 and 0.05% is the minimum at 11%. As for AlOOH L, 0.9% was the minimum
and 1.7 % the maximum. Water uptake was the highest in the case of AlOOH S where
18.4 % of water can be adsorbed at 76 % imposed relative humidity (RH).
Hydrated samples placed into desiccators or ampules were not dried before hydration.
In the case of Al(OH)3, a hysteresis is seen, this could be due to the resolution since we
are talking about a maximum water uptake of 0.6%.
The use of ampules containing salt solutions was intended in the first place to avoid
exposing our conditioned samples to air, but, when weighing ampules we noticed that
water uptake was not the maximum in the ampules. For AlOOH L and Al(OH)3
differences between water uptake in ampules and desiccators are not important but in
the case of AlOOH S, water uptake at 76% was of 17% while it was 14% in ampules.
Desiccator values were closer to that of the isotherm. It’s true that the use of ampules
avoids us from exposing samples to air but the hydration process was probably less
efficient in this constrained environment.

100
Table 3.4 resumes water uptake comparing TGA isotherms, mass weighed from
hydrated samples in ampules, and percentage deduced from dessicator samples using
TGA. All in all, water uptake was so similar between 11%, 44% and 76% in the case of
Al(OH)3 and AlOOH L but in the case of AlOOH S bigger differences were observed.
Thermal analysis can vary from a Boehmite to a Gibbsite or Diaspore and even for the
same chemical formula different thermogram can be obtained this depends on the origin
of the sample, its content in impurities, amorphous phases and particle-size.71, 118-120

101
Table 3.4. Summary of water uptake with respect to relative humidity imposed in the case of AlOOH L, AlOOH S and Al(OH)3. Water uptake from TGA imposed relative
humidity through isotherms, water uptake weighed in hydrated ampules and TGA measurements for water uptake into dessicators are shown.
Sample RH imposed
(%)
Water uptake from TGA
isotherm
(%)
Water uptake weighed
from hydrated ampules
(%)
Water uptake from TGA
of desiccator hydrated
samples
(%)
AlOOH L 11 0.30 ± 0.02 0.05 ± 0.00 0.60 ± 0.05
44 1.08 ± 0.08 0.38 ± 0.03 1.30 ± 0.10
76 1.58 ± 0.01 1.58 ± 0.01 1.10 ± 0.08
AlOOH S 11 3.86 ± 0.35 1.30 ± 0.11 3.80 ± 0.34
44 8.70 ± 0.78 4.50 ± 0.40 7.40 ± 0.66
76 18.45 ± 1.66 14.16 ± 1.27 17.42 ± 1.56
Al(OH)3 11 0.14 ± 0.02 0.17 ± 0.02 0.34 ± 0.05
44 0.31 ± 0.05 0.36 ± 0.05 0.42 ± 0.06
76 0.50 ± 0.07 0.78 ± 0.11 0.50 ± 0.07

102
3.5 Effect of irradiation
In this section irradiated samples presented are only those conducted using heavy ions.
We suppose that these ions create more defects in the samples and if no changes are
observed under these irradiations than no alterations would occur in electron beams
used for the study of defects in the next section.
3.5.1 FTIR
FTIR was also conducted on irradiated samples. Red spectra in each of Figure 3.13
show the IR peaks of irradiated samples conducted at 500 kGy. The dose choice was
based on having a significant dose and to see if any alterations occurred in the samples.
Figure 3.13. FTIR spectra of heavy ions irradiated at 500 kGy AlOOH L, AlOOH S and
Al(OH)3 compared to that of pristine ones.
No difference was seen between pristine and irradiated Al(OH)3. Though, an
asymmetric narrowing is noticed in the case of irradiated AlOOH L , this could be seen
as a relatively weak OH bonding.
3.5.2 XRD
In order to check if any changes in phases occurred after irradiation, an XRD test was
done on 200 kGy irradiated samples, Figure 3.14 .

103
Figure 3.14. XRD spectra of irradiated at 200 kGy using heavy ions AlOOH L, AlOOH S and
Al(OH)3 compared to that of pristine ones.
No differences in phases were seen when comparing pristine and irradiated samples.
3.5.3 XPS
In order to insure if irradiation occurred any alteration to functional groups on the
surface, XPS on irradiated samples was conducted at 120 kGy using electron beams
and was compared to that of pristine ones Figure 3.15. No difference was seen between
pristine and irradiated samples. (Table 3.5).

104
Figure 3.15. XPS spectra of irradiated AlOOH L, AlOOH S and Al(OH)3 compared to that of
pristine ones.
Table 3.5. XPS peak position and atomic concentration of each element after irradiation.
After
Irradiatio
n
Name Position
(eV)
FWHM Area Concentr
ation (%)
AlOOH L O 1s-1 530.69 1.420 21308.29 22.44
O 1s-2 531.92 1.420 21320.62 22.46
O 1s-3 532.90 1.916 8512.20 8.97
Al 2p 74.11 1.374 5367.21 22.89
AlOOH S O 1s-1 530.66 1.481 23357.70 28.69
O 1s-2 531.98 1.481 23521.65 28.89
O 1s-3 533.00 1.730 5488.91 6.74
Al 2p 74.06 1.398 5523.98 27.47
Al(OH)3 O 1s-1 531.70 1.620 39875.76 57.09
O 1s-2 533.52 1.973 1830.42 2.62
Al 2p 74.11 1.387 3455.63 20.03

105
3.5.4 EPR
To see if the intensity of impurities changed especially to detect if any reduction of Fe3+
occurred due to irradiation EPR spectrum was deduced from irradiated samples at
120 kGy using electron beams and was compared to that of pristine ones (Figure 3.16).
No difference in intensity was seen between pristine and irradiated samples.
Figure 3.16. EPR spectra of irradiated AlOOH L, AlOOH S and Al(OH)3 compared to that of
pristine ones (dashed).
3.6 Summary
This section was dedicated to resume the differences and similarities between samples.
No significant changes were induced in irradiation samples at 500 kG from heavy ions
or at 120 kGy using electron beams which leads us to conclude that the reference dose
used to study the defects and analyze gas did not alter the samples.

106
Table 3.6. Summary comparing the main characteristics after characterising each
sample.
Structure AlOOH L AlOOH S Al(OH)3
Particle size
(nm)
18 5 20
Particle shape Irregular
aggregated
Irregular separated
by spaces
Irregular to spherical
Specific surface
area (m2/g)
41 268 111
Phase purity
(%)
94 95 90
Chemical
impurities
Fe>Cr>K>Zn Fe>Ca>Mg>Ti>Cr> Fe>Ca>Si>Na>Zn>Mg
Paramagnetic
impurities
Fe3+ and Cr3+ Fe3+ (less than
AlOOH L)
0
Transition
temperature
(°C)
450 450 350
Water uptake
at 76% RH (%)
1.60 ± 0.01 18.45 ± 1.66 0.50 ± 0.07
Physisorbed
water at RT
(%)
1.2 ± 0.1 6.8 ± 0.5 0.4 ± 0.1

107
4. Chapter 4. Molecular hydrogen production from dry
aluminum hydroxide and oxyhydroxide
The objective of this chapter is to determine the molecular hydrogen yield for dry
materials and its variation with the structure and particle size. In the first part, molecular
hydrogen production from dry AlOOH L is compared to that of AlOOH S (Large and
small-particle sizes respectively) and Al(OH)3 Gamma irradiations were also
conducted and are briefly described. Electron beam irradiation is treated in details. In
the second part the study of Radiation induced defects (RID) by EPR spectroscopy is
developed.
4.1 Hydrogen production
4.1.1 Gamma rays
Dry samples were irradiated by Gamma rays for 70 hours (22 kGy). Sealed ampules
were used and gas released from irradiated samples was directly analyzed using GC-
traces (see Chapter 2). Many tests were done on AlOOH L and Al(OH)3 and it was
impossible to obtain reproducible results.
As the production of hydrogen is very low, the measurements of the final H2
concentration were highly dispersed. Even if Pyrex ampules were used, one may think
about ampules contribution when seeing these dispersions. Values differed from more
than one order of magnitude for the same sample mass and dose. It was concluded that
higher doses are necessary to obtain reliable data. Moreover we cannot exclude back
reactions leading to the consumption of H2 released owing to long irradiation time.
In this chapter only the results obtained from electron irradiations are represented for
dry materials.
4.1.2 Electron beam irradiation
4.1.2.1 Molecular hydrogen production at room temperature
In Figure 4.1, the production of molecular hydrogen as a function of the dose is shown
using two types of experiments:

108
- The first one concerns the same sample irradiated at different doses
(close squares).
- The second one concerns different samples irradiated at 120 kGy (open
squares).
AlOOH L and Al(OH)3 samples were irradiated from 7 kGy until 120 kGy.
Dry AlOOH S did not release significant quantities of H2 between 6 kGy and
91 kGy therefore a higher dose was applied, 390 kGy in order to determine the
hydrogen produced. Even at this dose AlOOH S. H2 concentration was very low
and close to the detection limit.

109
Figure 4.1. Hydrogen production as a function of the dose from dry AlOOH L, AlOOH S and
Al(OH)3 irradiated using electron beams. Close squares: same sample irradiated at different
doses. Open squares: separated samples irradiated at 120 kGy.

110
In most cases, when the dose is cumulated on the same sample, H2 production is
proportional to the dose. Then H2 radiolytic yields can be deduced from the slopes of
the different curves. This is seen in the type of experiment applied on the same sample
irradiated at different doses (close squares). Though, radiolytic yield given in Table 4.1
is the average of all the results obtained from both type of experiment since it is clear
that these samples are really sensitive and results changed from an experiment to
another despite all the care considered while preparing samples and irradiating in order
to reproduce the same experimental conditions.
The results were relatively dispersed especially for AlOOH L.
The dispersion of the results can be attributed to the drying efficiency, or material aging
in storage. In the next chapter it will be seen that H2 production is very sensitive to
adsorbed water. As the materials come from the same batch, we suppose that there is no
difference in chemical composition, structure and particle size. Variations of the LINAC
characteristics were tentatively corrected by dosimetry measurements.
Molecular hydrogen yields totally differ between AlOOH L and AlOOH S. Having the
same chemical formula, these samples released different H2 quantities. AlOOH L
having the large particle-size released (5 ± 2) x 10-9 mol/J while the maximal G value
of AlOOH S was tentatively estimated to be 4 x 10-11mol/J.
G (H2) value obtained from irradiated Al(OH)3 was (2.1 ± 0.5) x 10-9 mol/J.
Two points emerge from these results:
- First, one can notice the important effect of particle size on hydrogen production:
large-particle size of AlOOH samples produced more hydrogen than smaller
ones. This result seems contradictory because one can imagine that hydrogen
release should be easier in small particle size. Surface reactions are promoted in
small particle size materials and H radicals were closer in the same particle
which facilitates their recombination. 7 This was not the case of our samples
where large particle size released more molecular hydrogen.
- Second, structure can affect molecular hydrogen production even if the
constitutive atoms are the same. Moreover, in the case of the largest particle size
AlOOH L even if it is less hydrogenated than Al(OH)3 produces more H2.

111
Concerning aluminum hydroxide and oxyhydroxide there is some discrepancy between
Al(OH)3 results and those obtained by Westbrook et al Table 4.1. 6 The difference can
be attributed to particle size, sample purity, type of irradiations used and the efficiency
of drying treatments. In their article the authors did not detail the characterization of
the materials and the heat treatment conditions.
Table 4.1. H2 radiolytic yields released at room temperature from AlOOH S, L and Al(OH)3 and
compared to the literature (Our results, resumed in this table were irradiated using electron
beams while other hydroxides from literature were irradiated using Gamma rays).
Material G(H2) (mol/J) x 10-8 Reference
AlOOH L 0.57-1.3 6
AlOOH L 0.5 ± 0.2 Our results
Al(OH)3 0.21 ± 0.05 Our results
AlOOH S 0.04 ± 0.02 Our results
Al(OH)3 0 6
The mechanism of hydrogen production will be discussed later. At this time the formation
of hydrogen in the solid is probable. Then its release can be limited by diffusion and a
part of the hydrogen can be occluded in the structure of the materials. Dissolution and
annealing experiments were conducted in order to see if any molecular hydrogen is
trapped inside the structure after irradiation. A series of isochrones annealing till 250°C
were also performed to accelerate hydrogen diffusion. In order to be sure if all molecular
hydrogen potentially formed under irradiation was released, annealing experiments were
conducted above the phase transition temperature (400˚C and 500˚C for Al(OH)3 and
AlOOH respectively) until total transformation into Al2O3 occurred. Results are detailed
in section 4.1.2.3 and 4.1.2.4.
4.1.2.2 Trapped Molecular hydrogen
Barsova et al showed that a significant concentration of molecular hydrogen can be
trapped inside strontium and barium hydroxides after gamma-irradiation. The fraction
of hydrogen occluded varies between 10 to 60% of the total H2 production.
In order to verify if the materials can store some hydrogen, dissolution tests have been
conducted on Al(OH)3 electron irradiated at 171 kGy (see section 2.3.5.1). Degassing

112
operation was repeated three times. The mix was heated for 2 hours at 130 ͦ C until
complete dissolution.
After dissolution, H2 concentration in the ampule was analyzed by mass spectrometry.
It appears that this concentration is below the analytical detection limit (~5 ppm). Trace
GC cannot be used since acidic conditions were used. Then it was concluded that the
concentration of trapped hydrogen for Al(OH)3 was inferior to 1.1 x 10⁻¹¹ mol/kg.
4.1.2.3 Hydrogen production after annealing up to 250°C
Post irradiation annealing experiments were performed on electron-irradiated dry
samples at 120 kGy or 240 kGy.
- The same sample was heated from 40˚C up to 250°C in 40°C steps. The duration
of the thermal treatment was one hour for each 40°C steps. At each step the
molecular hydrogen released was measured.
- Hydrogen production was measured also directly after annealing at 250°C
during one hour.
Figure 4.2. Effect of temperature (up to 250˚C) on hydrogen released from samples irradiated
using electron beams at 120 kGy.
Erreur ! Source du renvoi introuvable. shows the variation of the released hydrogen
yield as a function of the annealing temperature. It reveals that significant amounts of
hydrogen or hydrogen precursors were trapped in the irradiated materials.

113
Below 200°C, the quantities of released hydrogen from Al(OH)3 and AlOOH L are
small while AlOOH S releases no hydrogen. The process accelerates at 250°C. This
temperature seems to be the threshold temperature for hydrogen diffusion or
detrapping. The cumulative released maximum hydrogen yields measured at 250°C are
resumed in Table 4.2. Room temperature radiolytic yields are also recalled. In order to
see if any hydrogen still trapped inside the structure we tended to continue sample
annealing until phase transition temperature.
4.1.2.4 Hydrogen production above transition phase temperature
As explained in chapter 2, in order to analyze gas released after the transition
temperature, measurements were conducted using a water trap.
This thermal treatment was applied either directly without any previous annealing at
lower temperatures or after a series of annealing at temperature inferior to 250°C. The
cumulative hydrogen production measured after annealing for one hour at 400°C and
500°C for Al(OH)3 and AlOOH respectively are resumed in Table 4.2. Like RT
measurements the dispersion is important for AlOOH L. Despite this dispersion it is
clear that a significant H2 quantities release at elevated temperatures and that molecular
hydrogen quantified before annealing represents only a small part of the total hydrogen
formed under irradiation.
After annealing at the transition temperature, roughly similar amounts of H2 were
released from AlOOH L and Al(OH)3. Although the quantities of trapped hydrogen is
still inferior for AlOOH S compared to AlOOH L, the difference is far less pronounced
than that observed at RT.
Table 4.2. Hydrogen yields at RT and after annealing at 250°C and above the phase transition.
The yields at RT represent the mean of different doses measurements while high temperatures
are conducted on 120 and 240 kGy.
G(H2) (mol/J)
x 10-8
H2 released at RT H2 occluded at 250°C H2 Total
occluded
250°C + 500°C
AlOOH L 0.51 ± 0.2 0.2 ± 0.05 1.2 ± 0.9
AlOOH S (0-0.04) ± 0.02 0.08 ± 0.03 0.4 ± 0.1
Al(OH)3 0.2 ± 0.05 0.3 ± 0.06 0.7 ± 0.1
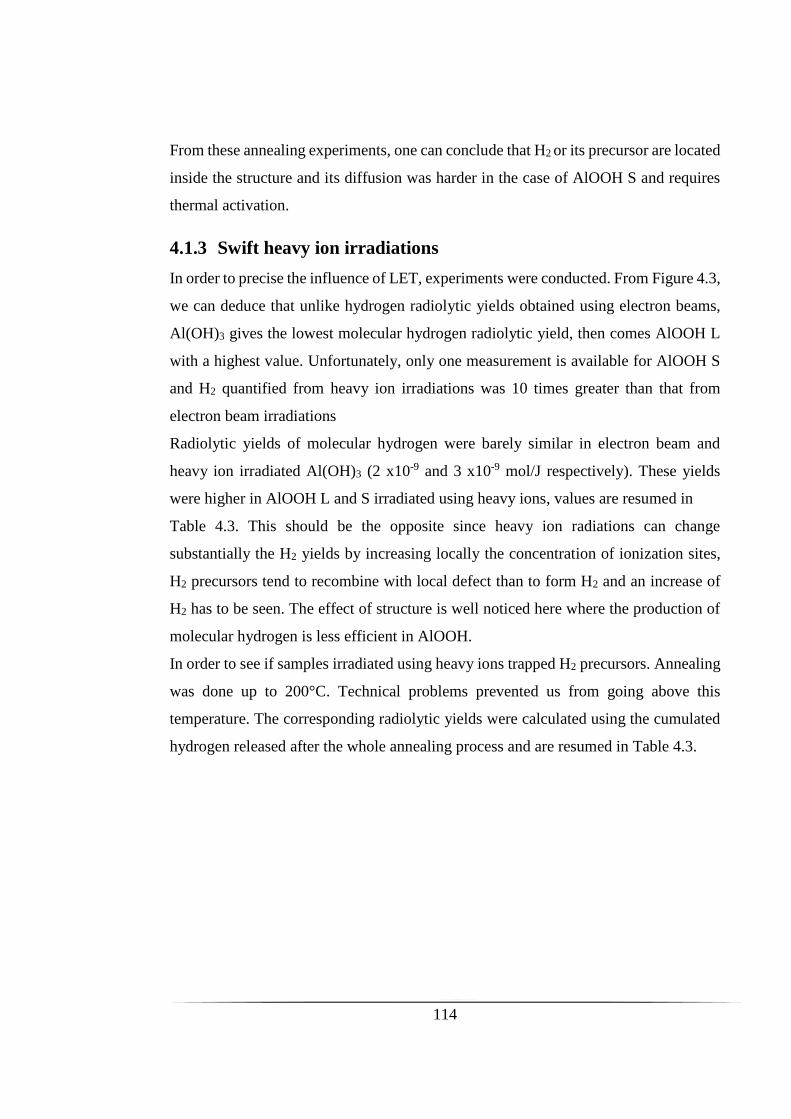
114
From these annealing experiments, one can conclude that H2 or its precursor are located
inside the structure and its diffusion was harder in the case of AlOOH S and requires
thermal activation.
4.1.3 Swift heavy ion irradiations
In order to precise the influence of LET, experiments were conducted. From Figure 4.3,
we can deduce that unlike hydrogen radiolytic yields obtained using electron beams,
Al(OH)3 gives the lowest molecular hydrogen radiolytic yield, then comes AlOOH L
with a highest value. Unfortunately, only one measurement is available for AlOOH S
and H2 quantified from heavy ion irradiations was 10 times greater than that from
electron beam irradiations
Radiolytic yields of molecular hydrogen were barely similar in electron beam and
heavy ion irradiated Al(OH)3 (2 x10⁻⁹ and 3 x10⁻⁹ mol/J respectively). These yields
were higher in AlOOH L and S irradiated using heavy ions, values are resumed in
Table 4.3. This should be the opposite since heavy ion radiations can change
substantially the H2 yields by increasing locally the concentration of ionization sites,
H2 precursors tend to recombine with local defect than to form H2 and an increase of
H2 has to be seen. The effect of structure is well noticed here where the production of
molecular hydrogen is less efficient in AlOOH.
In order to see if samples irradiated using heavy ions trapped H2 precursors. Annealing
was done up to 200°C. Technical problems prevented us from going above this
temperature. The corresponding radiolytic yields were calculated using the cumulated
hydrogen released after the whole annealing process and are resumed in Table 4.3.

115
Figure 4.3. Hydrogen production at RT from dry AlOOH L, S and Al(OH)3 irradiated
with Ar18+ as a function of the dose.
Figure 4.4.Effect of temperature (up to 200˚C) on hydrogen released from samples irradiated
with heavy ions at 250 kGy (AlOOH L and Al(OH)3) and 520 kGy (AlOOH S).
After annealing, results obtained from samples irradiated using heavy ions are not so
significant comparing to that at room temperature, it was crucial to continue to the
phase transition temperature to release all the molecular hydrogen. A significant

116
quantity may be occluded and didn’t release before 250°C as seen in the annealed
samples irradiated using electron beams.
AlOOH S released H2 at 200°C under heavy ion irradiations while it didn’t from
electron beams. Further experiments should be done on irradiated samples using heavy
ions in order to understand their different behavior.
Table 4.3. Radiolytic yields of irradiated samples using heavy ions before and after
annealing
G(H2) (mol/J)
x 10-8
H2 released at RT H2 occluded at 250°C
AlOOH L 0.8 0.03
AlOOH S 0.4 0.02
Al(OH)3 0.3 0.07
In order to understand the process responsible of hydrogen production and release,
radiation induced defects were studied using EPR spectroscopy. The aim of the work
presented in the next part is to identify the defects and precise their thermal stability.
4.2 Radiation induced defects
EPR spectra of paramagnetic centers originating from electron beam irradiation of
Al(OH)3 and AlOOH S and L have been measured and will be discussed in this section.
In order to give a general idea of paramagnetic centers formed at room temperature,
EPR spectra of irradiated hydrates at 120 kGy, are shown in Figure 4.5. The spectra
were normalized by the sample weight.
From Figure 4.5, an intense doublet separated by 50 mT identified in AlOOH L was
assigned to H radicals (see Chapter 1). The stability of H radicals will be discussed in the
next section. They were barely seen in the case of Al(OH)3 and does not exist in the case
of AlOOH S.
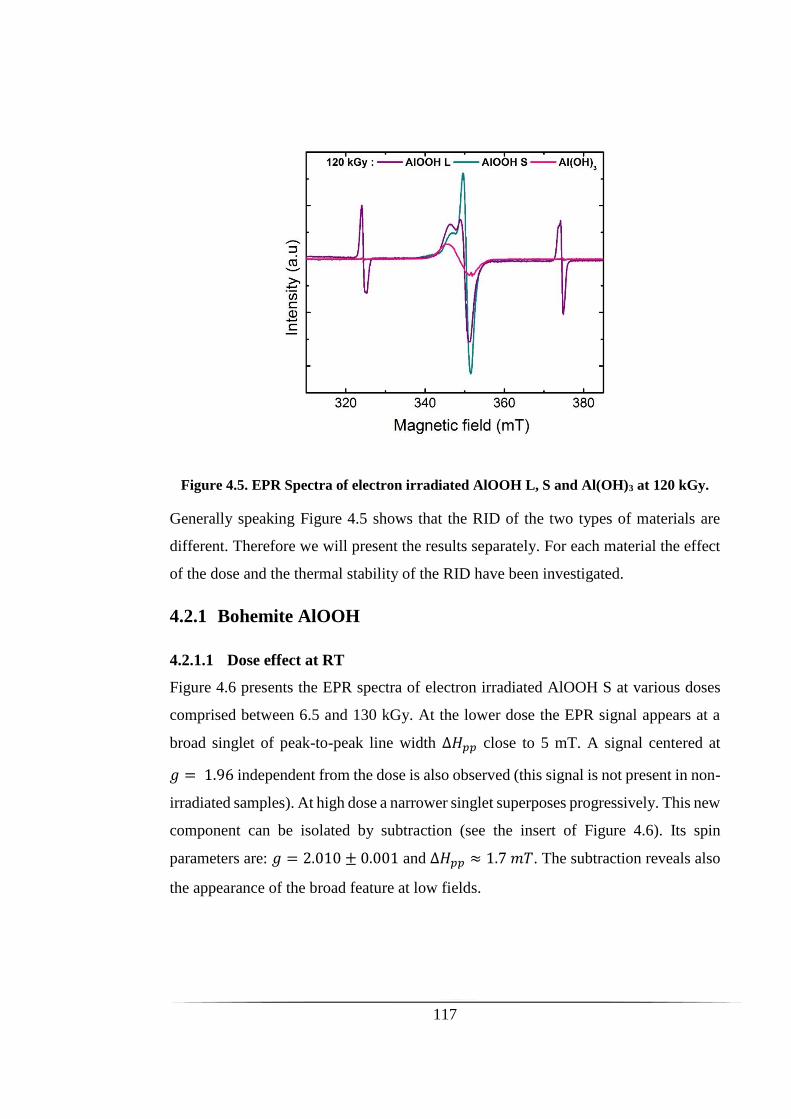
117
Figure 4.5. EPR Spectra of electron irradiated AlOOH L, S and Al(OH)3 at 120 kGy.
Generally speaking Figure 4.5 shows that the RID of the two types of materials are
different. Therefore we will present the results separately. For each material the effect
of the dose and the thermal stability of the RID have been investigated.
4.2.1 Bohemite AlOOH
4.2.1.1 Dose effect at RT
Figure 4.6 presents the EPR spectra of electron irradiated AlOOH S at various doses
comprised between 6.5 and 130 kGy. At the lower dose the EPR signal appears at a
broad singlet of peak-to-peak line width ∆𝐻𝑝𝑝 close to 5 mT. A signal centered at
𝑔 = 1.96 independent from the dose is also observed (this signal is not present in non-
irradiated samples). At high dose a narrower singlet superposes progressively. This new
component can be isolated by subtraction (see the insert of Figure 4.6). Its spin
parameters are: 𝑔 = 2.010 ± 0.001 and ∆𝐻𝑝𝑝 ≈ 1.7 𝑚𝑇. The subtraction reveals also
the appearance of the broad feature at low fields.

118
Figure 4.6. EPR spectra of electron irradiated AlOOH S at various doses at RT.
Orange: 6.5 kGy, violet: 13 kGy, black: 52 kGy and dark cyan: 130 kGy. The insert
presents the subtraction of the spectra recorded at 130 kGy and 52 kGy.
The simulation of the EPR spectra corresponding to the lower dose is presented in
Figure 4.7. The characteristics of the broad component are: 𝑔𝑥 = 𝑔𝑦 = 2.024, 𝑔𝑧 =
2.0034 and ∆𝐻𝑝𝑝𝑥 = ∆𝐻𝑝𝑝
𝑦= 4.8 𝑚𝑇, ∆𝐻𝑝𝑝
𝑧 = 3.09 𝑚𝑇. In the following the broad
component is called RID I and the narrow RID II.
Concerning AlOOH L the observations are qualitatively the same except two
differences:
- An intense doublet assigned to The EPR spectra of H radicals whose intensity
remains almost constant. The concentration of H radicals does not depend on
the dose and is estimated to be 3.3 10-4 mol/kg approximately,
- A new singlet (𝑔 = 1.998, ∆𝐻𝑝𝑝 = 0.2 𝑚𝑇) is observed at high field (see
Figure 4.8). This new signal is called RID III in the following.
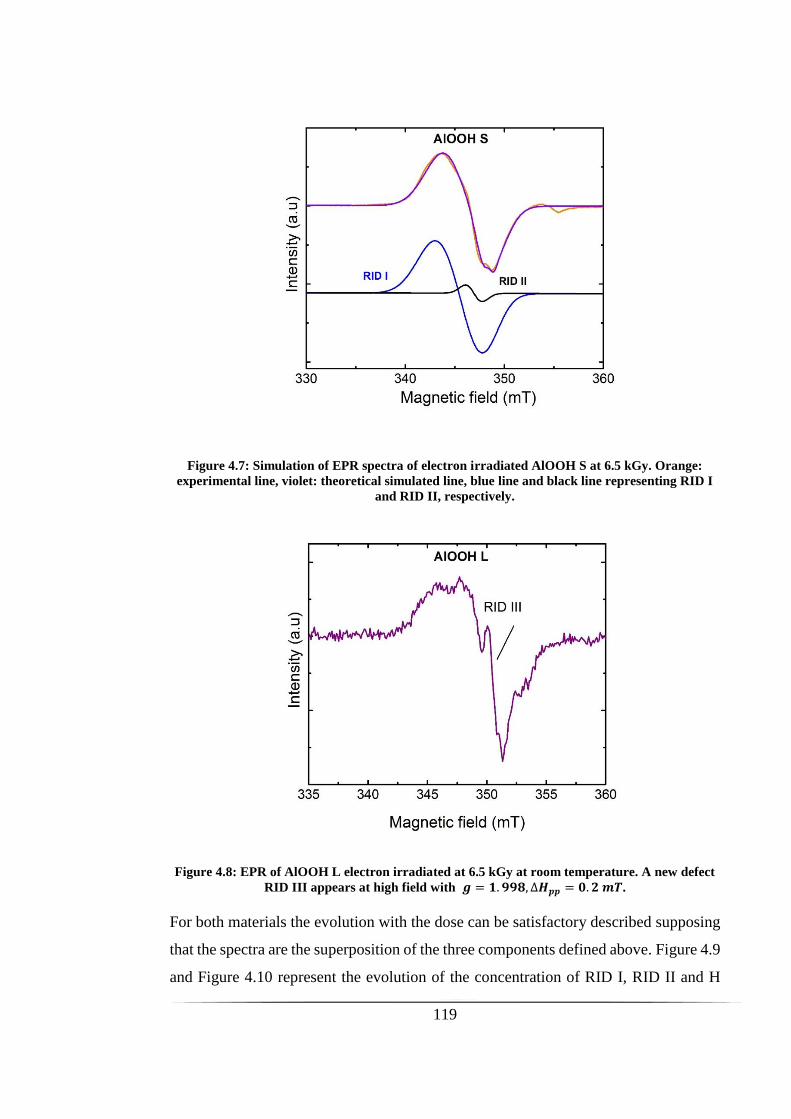
119
Figure 4.7: Simulation of EPR spectra of electron irradiated AlOOH S at 6.5 kGy. Orange:
experimental line, violet: theoretical simulated line, blue line and black line representing RID I
and RID II, respectively.
Figure 4.8: EPR of AlOOH L electron irradiated at 6.5 kGy at room temperature. A new defect
RID III appears at high field with 𝒈 = 𝟏. 𝟗𝟗𝟖, ∆𝑯𝒑𝒑 = 𝟎. 𝟐 𝒎𝑻.
For both materials the evolution with the dose can be satisfactory described supposing
that the spectra are the superposition of the three components defined above. Figure 4.9
and Figure 4.10 represent the evolution of the concentration of RID I, RID II and H

120
radicals as a function of the dose. A clear difference between these two types of defects
is observed: RID I saturates quickly with the dose when RID II accumulates.
The yields of formation of these defects are estimated using the slope at the origin or
the data obtained at the lowest dose:
- AlOOH L: 𝐺(𝑅𝐼𝐷 𝐼) = 2.3 x 10⁻⁷ 𝑚𝑜𝑙/𝐽 and 𝐺(𝑅𝐼𝐷 𝐼𝐼) =
(7 0.5) x 10−9 𝑚𝑜𝑙 𝐽
- AlOOH S: 𝐺(𝑅𝐼𝐷 𝐼) = 1.3 x 10⁻⁷ 𝑚𝑜𝑙/𝐽 and 𝐺(𝑅𝐼𝐷 𝐼𝐼) = 4 x 10⁻⁹ 𝑚𝑜𝑙/𝐽
In AlOOH L the concentration of RID III is almost constant and equal to
1.7 10−4 mol.kg-1.
Figure 4.9. Evolution of the concentration of H radicals in electron irradiated AlOOH L as a
function of the dose.

121
Figure 4.10.Evolution of the concentration of RID I (blue), and RID II (green) in electron
irradiated AlOOH L and S as a function of the dose.
4.2.1.2 Room temperature stability
Kinetics were conducted under vacuum in order to study the stability of H radicals and
other induced defects as a function of the time. The results are represented in Figure
4.11 and Figure 4.12 for AlOOH L and AlOOH S, respectively. The main difference
between these two materials is the stability of H radicals. AlOOH L can stabilize an
important concentration of H radicals, after 24 hours the initial H radical concentration
decreased by only 22.5% while as mentioned before, no H radicals are seen in the case
of irradiated AlOOH S above 10 kGy. View their reactivity, the stability at room
temperature of H radicals in AlOOH L are remarkable.
Although all components decreased as a function of time, radiation induced defects
were seen to be stable at room temperature.
In Figure 4.11 (left) the spectra of low field H radicals appear to be asymmetric. The high
field spectrum is the symmetric point of the low field one. This result suggests either the
presence of different components or a hyperfine anisotropy. The hyperfine structure
constant is close to that of free H atom, this indicates that the interaction of H with the
cation is weak. This result is in accordance with the model proposed by Yurik and al
which supposes that H is stabilized near the cation and the hyperfine interaction is
determined by the polarizability of the cation. 56

122
Figure 4.11. Evolution at RT of EPR spectra of electron irradiated AlOOH L at
120 kGy. The evolution of H radicals (on the left) and RID (on the left) are shown as a
function of time from one hour until 24 hours.
RID I (broad peak) decreased by 38% after 24 hours at RT in the case of AlOOH L and
by 30% in AlOOH S. RID II (narrow peak) was more stable and diminishes by 9.5 %
in AlOOH L and by 20 % in AlOOH S.
Figure 4.12. Evolution at RT of EPR spectra of electron irradiated AlOOH S at 120 kGy. The
evolution of RID is shown as a function of time from one hour until 25 hours.

123
4.2.1.3 Annealing of defects
Annealing of EPR defects originating from electron irradiated AlOOH S and L at
120 kGy, is shown and discussed in this section.
The evolution of EPR spectra of AlOOH S as a function of temperature is presented in
Figure 4.13. On the right, Y scale has been magnified in order to highlight the evolution
at the highest temperature. Both defects RID I and RID II decrease in a similar way
with temperature. At 200°C, RID II is still observed and disappears above this
temperature. RID IV is stable as a function of temperature. Annealing at 200°C and
above reveals the presence of an anisotropic signal with 𝑔𝑧 = 2.063. It is likely that
this signal is not created upon annealing. but is only observable when the intensity of
other signals has decreased.
Concerning AlOOH L (see Figure 4.14) some differences can be observed: RID I
disappeared above 120°C while RID II is more stable. Finally the defect RID III is
more difficult to detect at 200°C.
Figure 4.15 shows the EPR spectra of electron irradiated AlOOH S and AlOOH L at
120 kGy after annealing for 1 hour at 300°C. This plot shows the appearance of a new
defect (called RID IV) which intensity is close for both materials. The simulation gives
the following spin parameters for this new signal: 𝑔𝑥 = 𝑔𝑦 = 2.0043, 𝑔𝑧 = 2.064 and
∆𝐻𝑝𝑝𝑥 = ∆𝐻𝑝𝑝
𝑦= 2.06 𝑚𝑇, ∆𝐻𝑝𝑝
𝑧 = 4.63 𝑚𝑇.
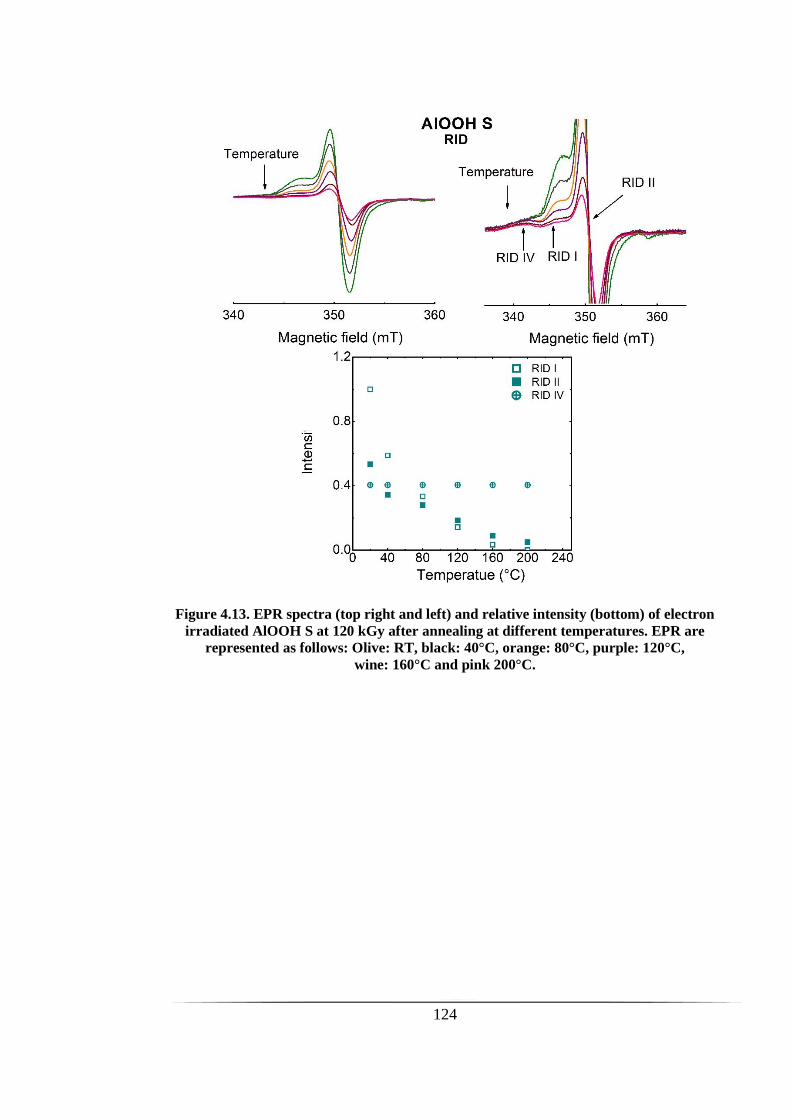
124
Figure 4.13. EPR spectra (top right and left) and relative intensity (bottom) of electron
irradiated AlOOH S at 120 kGy after annealing at different temperatures. EPR are
represented as follows: Olive: RT, black: 40°C, orange: 80°C, purple: 120°C,
wine: 160°C and pink 200°C.

125
Figure 4.14. EPR spectra (top right and left) and relative intensity (bottom) of electron
irradiated AlOOH L at 120 kGy after annealing at different temperatures. EPR spectra
are represented as follows: Violet: RT, pink: 40°C, olive: 80°C, black: 120°C, orange:
160°C and purple 200°C.
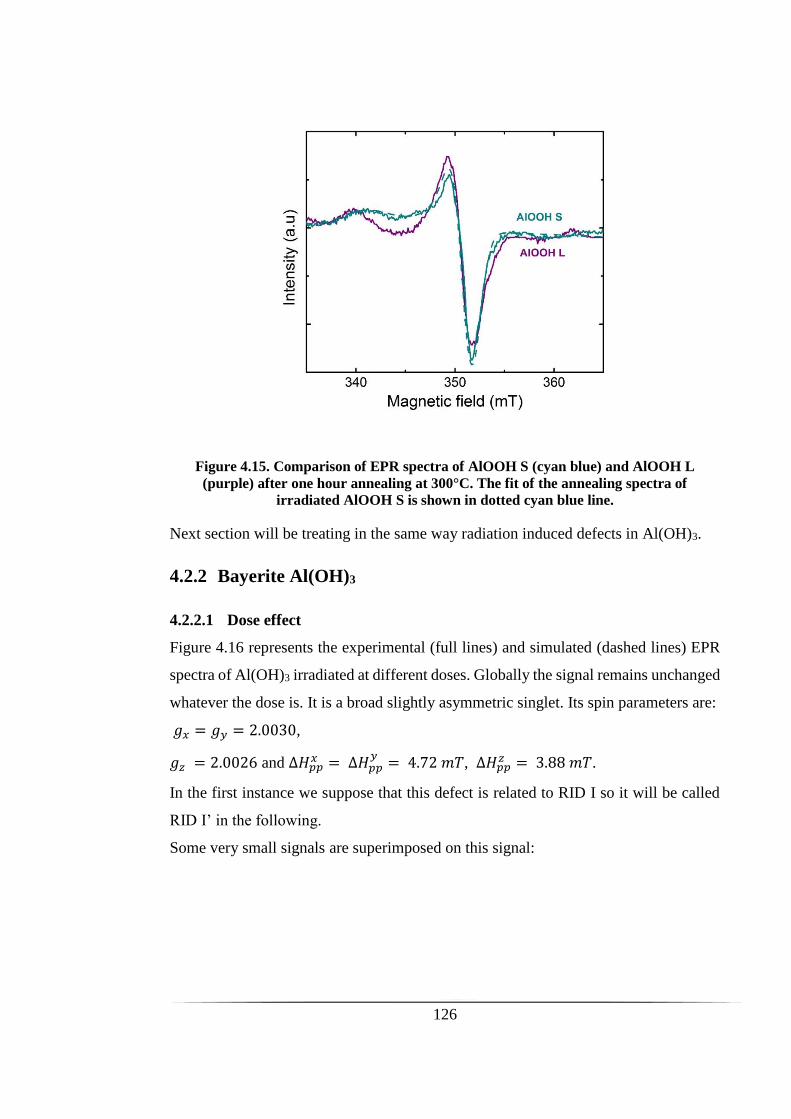
126
Figure 4.15. Comparison of EPR spectra of AlOOH S (cyan blue) and AlOOH L
(purple) after one hour annealing at 300°C. The fit of the annealing spectra of
irradiated AlOOH S is shown in dotted cyan blue line.
Next section will be treating in the same way radiation induced defects in Al(OH)3.
4.2.2 Bayerite Al(OH)3
4.2.2.1 Dose effect
Figure 4.16 represents the experimental (full lines) and simulated (dashed lines) EPR
spectra of Al(OH)3 irradiated at different doses. Globally the signal remains unchanged
whatever the dose is. It is a broad slightly asymmetric singlet. Its spin parameters are:
𝑔𝑥 = 𝑔𝑦 = 2.0030,
𝑔𝑧 = 2.0026 and ∆𝐻𝑝𝑝𝑥 = ∆𝐻𝑝𝑝
𝑦= 4.72 𝑚𝑇, ∆𝐻𝑝𝑝
𝑧 = 3.88 𝑚𝑇.
In the first instance we suppose that this defect is related to RID I so it will be called
RID I’ in the following.
Some very small signals are superimposed on this signal:

127
- A narrow peak (called RID III’) visible only at the lowest dose (7 kGy) has
characteristics close to those of RID III: 𝑔 factor of 1.998 and a width of 0.2 mT,
- Above 28 kGy, a signal with a hyperfine interaction called RID VI’.
Figure 4.16: Evolution of EPR spectra of electron irradiated Al(OH)3 as a function of
the dose. Straight lines represent the experimental data and dotted ones the simulations.
Green, blue and pink colors are attributed to 7, 28 and 120 kGy.
Figure 4.17 represents the evolution of the concentration of RID I’ and H radicals as a
function of the dose in irradiated Al(OH)3. RID I’ accumulates with the dose, the
estimated radiolytic yield is 3.1 10-7 mol.kg-1.
Figure 4.17. Evolution of the concentration of RID I’ (right), and H radicals (black) in irradiated
Al(OH)3 as a function of the dose.

128
4.2.2.2 Room temperature stability
The evolution of the EPR spectra as a function of time at room temperature is presented
in Figure 4.18.
In Al(OH)3 H radicals are clearly less stable compared to AlOOH L. After 12 hours the
signal is hardly detectable. RID I’ lost 28.2 % of its initial concentration after 25 hours
at room temperature, this value is comparable to that of signal RID I in AlOOH S and
AlOOH L. The decrease of the signal is attended by an increase of the hyperfine signal
(RID VI’).
Figure 4.18. Evolution at RT of EPR spectra of radiation induced defects in electron
irradiated Al(OH)3 at 120 kGy. The evolution of H radicals (on the left) and RID (on the
left) are shown as a function of time from one hour until 25 hours.
4.2.2.3 Annealing of defects
Annealing of EPR defects originating from electron irradiated Al(OH)3 at 120 kGy, is
shown and discussed in this section.
Unlike AlOOH, the progressive disappearance of the EPR spectrum assigned to RID is
not observed. Above 80°C the signal of RID I’ is converted to an axially anisotropic
signal (RID V’) (Figure 4.19). The conversion is total above 100°C. The hyperfine signal
(RID VI’) increases until 120°C then it decreases and almost disappears above 200°C.
RID I’ and the sum of RID II’ and V’ are plotted as a function of temperature.

129
Figure 4.19. EPR spectra (right) and relative intensity (left) of electron irradiated
Al(OH)3 at 120 kGy after annealing at different temperatures. EPR spectra are
represented as follows: Pink: RT, wine: 40°C, purple: 80°C, orange: 120°C, black:
160°C and olive 200°C.
Figure 4.20 presents the EPR spectrum of electron irradiated Al(OH)3 annealing at
250°C. The simulation reveals besides the signal assigned to RID VI’ the presence of
narrow singlet with spin parameters close to RID II (see Figure 4.20).
Figure 4.20. EPR spectra of electron irradiated Al(OH)3 at 120 kGy and annealed one
hour at 225°C. Straight lines represent the experimental data and dotted ones the
simulations. RID I’ (black), RID II’ (green), and RID V’ (violet).

130
It is noted RID II’ in the following. A broad signal was added to fit the wings of the
spectrum. This contribution could be attributed to a remaining fraction of RID I’.
Table 4.4 gives the spin parameters of the different components determined by the
simulation.
At 300°C, no more defects exist, they were all annealed.
Table 4.4. Spin parameters of RID II’ and RID V’ determined from the simulation of
irradiated Al(OH)3.
𝒈𝒙 𝒈𝒛 𝚫𝐇𝒑𝒑𝒙 (mT) 𝚫𝐇𝒑𝒑
𝒛 (mT)
RID II’ 2.009 2.07
RID V’ 2.0037 2.036 1.84 1.66
4.2.3 Defects localization
All the preceding experiments were performed in vacuum. The samples were placed
and stored in glass sealed EPR tubes. In order to determine if the defects are located on
the surface or not, EPR spectra were recorded after irradiation in controlled atmosphere
and after opening the ampules and exposing them to the air. Oxygen can have two
effects, firstly it can react with the paramagnetic centers, and secondly it can modify
the spin relaxation of nearby paramagnetic centers through a cross relaxation process.
The presence of oxygen is generally characterized by an increase of the signal
broadening.

131
Figure 4.21. EPR spectra of electron irradiated AlOOH S (30 kGy), ALOOH L (30 kGy)
and Al(OH)3 (30 kGy) after exposition to air. Black lines represent the spectra under
vacuum while colorful lines represent the one exposed to air.
Figure 4.21 compares the stability of H radicals and other radiations induced defects
after exposition to air for one hour. The concentration of H radicals remains unchanged
when samples were exposed to air. This result leads us to suppose that H radicals reside
in the bulk. This was in agreement with the findings of Vedrine and al, where oxygen
was introduced over Boehmite, Bayerite and Gibbsite, before and after irradiation and
no variation in shape, intensity or behavior of H atoms signals was observed. D2O
exchange experiments were led by this group and no exchange was seen.64 H atoms
were stabilized in the bulk rather in a superficial layer and were inaccessible to any
molecules.

132
Concerning RID, in the case of AlOOH S and Al(OH)3 a slight decrease of the
intensities of RID I and RID I’ can be observed. One can conclude that the majority of
the RID are located in the bulk. The major evolution is the disappearance of RID III in
AlOOH L which proves that this center is located at the surface.
4.3 Identification of RID
In this section we discuss the identification of RID on the basis of the spin parameters
and thermal stability.
4.3.1 H radicals
The stability of H radicals was distinct from one material to another. In the case of
AlOOH S, H radicals were not observed at room temperature. Whereas an important
quantity of H radicals remains trapped in AlOOH L after irradiation. In this material H
radicals are stable up to 80°C. For Al(OH)3, a much smaller quantity of H radicals is
detected and its annealing occurs slightly above room temperature (40°C).
Scholz and Stösser show that the stability of H radicals depends on the existence of
symmetrical cages. 67 Moreover trapped species decrease when the disorder increases.
Therefore, we conclude that the disorder in AlOOH S (see chapter 2.4.2) explains its
lower stabilization of H atom.
4.3.2 RID I
The spin parameters of RID I spectrum are in the range found for oxygen centers
observed in irradiated Al2O3 or Al(OH)3 (see Chapter 1). It corresponds to O- ions.
In hydroxides, O- centers can be formed from the homolytic dissociation of the O-H
bond:
(37)
𝐴𝑙 ⋯𝑂𝐻− → 𝐴𝑙⋯𝑂− + 𝐻
It could also be produced by reaction of 𝑂𝐻 :
(38)
𝑂𝐻_ → 𝑂𝐻 + 𝑒_

133
(39)
𝑂𝐻_ + 𝑂𝐻 → 𝑂_ + 𝐻2𝑂
We don’t have an evidence of the presence of 𝑂𝐻 since it is not observable by EPR.
In Boehmite O- center can also be associated to O2-. The proposed formation
mechanisms are:
(40)
𝐴𝑙 ⋯𝑂2−⋯𝐴𝑙 + ℎ𝑜𝑙𝑒 → 𝐴𝑙⋯𝑂−
In this case the defect needs a cationic defect (vacancy or impurity) as a charge
compensator (to maintain a charge balance in the lattice). Iron impurity can be a good
candidate. Using Kröger-Vink notation, the possible reactions can be written as:
(41)
𝐹𝑒𝐴𝑙𝑥 + 𝑂𝑂
𝑥 → (𝐹𝑒𝐴𝑙𝑂𝑂 )𝑥
The defect (𝐹𝑒𝐴𝑙𝑂𝑂 )𝑥can be also written [O- Fe2+] following Stoneham notation.
This hypothesis could appliy to AlOOH L. Actually, in this material, the maximal
concentration of RID I centers (2 x 10⁻³ mol/kg) is close to the iron concentration
measured by ICP-MS (section 3.3.1) which has been estimated to be 1.2 x 10⁻³ mol/kg.
Moreover EPR spectrum of pristine AlOOH L demonstrates an intense signal of Fe3+
ions.
This attribution is ruled out by different observations:
- Iron concentration is lower in AlOOH S while the maximum concentration of
RID I centers is close to those measured in AlOOH L,
- The concentration of Fe3+ ions is much weaker in AlOOH S,
- The disappearance of the Fe3+ EPR signal at high dose in AlOOH was not
observed, with only a 30% loss for a dose of 140 kGy for AlOOH L is observed.
In summary, it is concluded that RID I corresponds to O- centers resulting from
the homolytic dissociation of OH- ion.
4.3.3 RID I’
The spin parameters of RID I’ are close to those found for RID I. The anisotropy is
slightly more important for RID I’. Table 4.5 compares the g-factor and the splitting Δ
for both centers. The spin-orbit coupling 𝜆 of O- is supposed to be equal to -0.017 eV.

134
Table 4.5. Comparison of g-factors and splitting 𝜟 in irradiated AlOOH and Al(OH)3.
𝒈𝒛 𝒈𝒙 𝚫 (eV)
AlOOH 2.0034 2.024 1.57
Al(OH)3 2.0026 2.030 1.23
In Al(OH)3, the concentration of O- center at room temperature is almost one order of
magnitude higher than in AlOOH. This difference suggests that defects are more stable
in the hydroxide.
The formation yield of defects in Al(OH)3 is surprisingly high (>2.10-7 mol/J) which
proves that the cleavage of the O-H bond is the major radiolytic event.
4.3.4 RID II
It is tempting to assign RID II to another O- center in another site of stabilization. Then
it could be attributed to a hole center stabilized on an oxygen O2- adjacent to an
impurity. As the RID II concentration is much weaker than the RID I concentration,
the preceding arguments used to demonstrate that RID I center is not associated with
an iron impurity, no longer apply.
Nevertheless the characteristic of the signal seems incompatible with an O- center.
Indeed the signal should have an axially symmetry g factor (see Chapter 1). An
isotropic signal is not excluded if ∆≫ 𝜆. But in this case, the average g factor should
be close to 2.0023. Then it is concluded that RID II is not an O- center.
Steinike and al. reported the formation of a singlet with 𝑔 = 2.012 in mechanical
treated hydrargilite, a polymorph of Al(OH)3.54 Although the poor quality of the
Figures, some similarities can be founnd between RID II signal and the signal reported
by Steinike et al. The authors assigned this center to ozonide radical O3- formed by
reaction of O2 with O-:
(42)
𝑂2 + 𝑂− →𝑂3
−
Ozonide radical was also observed in Barium hydroxides59 and in different oxides such
as quartz.121

135
The following reactions have been also proposed:
(43)
𝑂2− + 𝑂− →𝑂3
− + 𝑒
(44)
𝑂22− + 𝑂2
− →𝑂3− + 𝑂2−
This radical can be produced by dissociation of O2:
(45)
𝑂2→𝑂 + 𝑂
(46)
𝑂 + 𝑂2 →𝑂3
(47)
𝑂3 + 𝑒 → 𝑂3−
The attribution of RID II to an ozonide radical, is questionable because the spin
parameters of the radicals depend little on the host matrix (see Chapter1). Then the
signal should appears as asymmetric singlet with 𝑔𝑧 = 2,015 − 2,017. The isotropic
character and the narrowness of the signal seem incompatible with the attended
anisotropic g-factor for O3- except if we suppose an averaging by motion, for example,
a rapid rotation inside a cage. This hypothesis should be investigated, for example, by
comparing EPR spectrum at 77 K or at 4.2 K with the spectrum recorded at room
temperature.
4.3.5 RID III and RID III’
Classically, 𝑔 factors smaller than that of the free electron are attributed to electrons
centers 122-123,124. The adsorption of O2 from air leads to the decrease of RID III signal.
These observations enable us to attribute the spectra to electrons captured by surface
anionic vacancies (an FS center).
There is a major difference between AlOOH L and the others materials. The
concentration of RID III centers in AlOOH L is almost constant whatever the dose is
while they are only observed at the lowest dose as a very weak singlet in the case of
Al(OH)3 and AlOOH S. The lack of FS centers in these materials can be attributed either

136
to a low concentration of anionic vacancies or to the presence of efficient electron
scavengers.
4.3.6 RID IV
This signal is observed after the thermal decay of RID I and RID II centers ion AlOOH.
In the case of AlOOH S where RID IV is clearly visible from 80°C. The large
anisotropy of the RID IV signal permits to assign this signal to O2- centers which is
generally associated with the recombination of O- centers followed by hole trapping:
(48)
𝐴𝑙 ⋯𝑂− + 𝐴𝑙 ⋯𝑂− → 𝐴𝑙⋯𝑂22−⋯𝐴𝑙
(49)
𝐴𝑙⋯𝑂22−⋯𝐴𝑙 + ℎ𝑜𝑙𝑒 → 𝐴𝑙 ⋯𝑂2
−⋯𝐴𝑙
The observation of O2- centers supports the formation of ozonide radicals because it is
a precursor of this radical (see section 4.3.4).
4.3.7 RID V’
RID V’ replaces RID I’ above 80°C. Although the anisotropy is different from those of
RID IV it is compatible with an O2- center. The decrease of its anisotropy demonstrates
an increase of the splitting 𝛿 and as a consequence an increase of the crystalline field
(see Chapter 1).
4.3.8 RID VI’
RID VI’ is characterized by its 11 lines resulting from a hyperfine structure from two
Al3+ nuclei and is supposed to be 𝐴𝑙 …𝑂−…𝐴𝑙 described by Kuruc et al in aluminum
hydroxide samples described in section 1.5.4.
4.4 Discussion
On the basis of the previous results, the mechanisms of hydrogen production are
discussed in this section. The main results are summarized in Table 4.6

137
In situ FTIR were conducted from 25°C to 220°C, the last temperature we could attend
using our annealing system. No differences in peak widths were seen so we can assume
that no significant structural evolution could be detected.
From the discussion above, 𝑂− radical ions with a different immediate environement
and atomic hydrogen are pronominally formed from the radiolysis of AlOOH and
Al(OH)3.
As seen in this chapter, two types of H2 were quantified: H2 released at room
temperature will be called 𝐻2 𝑟𝑒𝑙𝑒𝑎𝑠𝑒𝑑 and H2 quantified above RT after annealing will
be called 𝐻2 𝑑𝑒𝑡𝑟𝑎𝑝𝑝𝑒𝑑.
The ratio of 𝐻2 𝑑𝑒𝑡𝑟𝑎𝑝𝑝𝑒𝑑 to 𝐻2 𝑟𝑒𝑙𝑒𝑎𝑠𝑒𝑑 and the quasi absence of hydrogen production
at RT for AlOOH S points out that the diffusion of H2 cannot explain our results. This
led us to think that the two types of H2 don’t have the same formation site or pathway.
The yields of formation of O- centers suggest that the H2 (RT) can be formed from the
general mechanism of homolytic dissociation of OH considered as the dominant
radiolytic event:
(50)
𝐴𝑙 …𝑂𝐻− → 𝐴𝑙 …𝑂− + 𝐻
Then 𝐻° is certainly the precursor of H2. This radical can react with 𝐴𝑙 …𝑂−,
recombines with another H radical or be trapped at the structure:
(51)
𝐴𝑙 …𝑂− + 𝐻 → 𝐴𝑙 …𝑂𝐻−
(52)
𝐻 +𝐻 → 𝐻2
(53)
𝐻 → H𝑡𝑟𝑎𝑝𝑝𝑒𝑑
Even in AlOOH L where the trapping is efficient, only a small fraction of the primary
H radicals are trapped. Taking into account the relative high concentration of O- center
measured at RT, we suppose the recombination with 𝐴𝑙 …𝑂− is limited.
Molecular H2 released at room temperature may be the result of the recombination of
unstable H radicals that are formed and recombined during the irradiation or directly
before.
(54)
𝐻 + 𝐻 → 𝐻2 𝑟𝑒𝑙𝑒𝑎𝑠𝑒𝑑

138
This molecular hydrogen shows a dependence on particle size: in the small sized
sample almost no H2 was released at RT and one can suppose that in this case H radicals
are formed in separate particles or crystals and can’t encounter.
We suppose also that 𝐻2 𝑟𝑒𝑙𝑒𝑎𝑠𝑒𝑑 is formed near the surface. Mobile H° are produced
in the bulk and diffuse to the surface where they react to produce hydrogen which enters
in the gas phase.
Though not all the 𝐻° formed recombine and are quantified as 𝐻2 𝑟𝑒𝑙𝑒𝑎𝑠𝑒𝑑. Some H
radicals may be also trapped in the system and needs thermal activation to recombine
with other species or to diffuse to the surface. Therefore one can suppose this
mechanism:
(55)
2𝐻𝑡𝑟𝑎𝑝𝑝𝑒𝑑ℎ𝑒𝑎𝑡→ 𝐻2 𝑑𝑒𝑡𝑟𝑎𝑝𝑝𝑒𝑑
This mechanism could not be the only one producing 𝐻2 𝑑𝑒𝑡𝑟𝑎𝑝𝑝𝑒𝑑 in AlOOH S and
Al(OH)3 because the concentration of trapped H radicals in these materials is zero or
close to zero while the quantity of hydrogen released is significant. Even in the case of
AlOOH L, this mechanism is not efficient. Indeed by comparing the quantity of H2
occluded and H radicals (see Table 4.6) it is clear that trapped H radicals can’t be
the only precursor of 𝑯𝟐 𝒅𝒆𝒕𝒓𝒂𝒑𝒑𝒆𝒅.
A third reaction may be occurring analogous to the recombination of hydrated electron
in liquid water:
(56)
𝐹𝑆 + 𝐹𝑆 → 𝐻2
The concentration of FS centers (RID III and RID III’) is not sufficient to take account
of the production of 𝐻2 𝑑𝑒𝑡𝑟𝑎𝑝𝑝𝑒𝑑.
Finally we suppose that hydrogen is trapped in its molecular form. Schematically we
can propose the following reaction:
(57)
𝐻 + 𝐻 → 𝐻2 𝑡𝑟𝑎𝑝𝑝𝑒𝑑ℎ𝑒𝑎𝑡→ 𝐻2 𝑑𝑒𝑡𝑟𝑎𝑝𝑝𝑒𝑑
It has to be considered also that not all species formed were detectable using EPR,
unfortunately no direct proof of 𝐻2 𝑡𝑟𝑎𝑝𝑝𝑒𝑑 inside the material has been determined
since it has a low concentration (we tried to conduct RAMAN spectroscopy and

139
dissolution)as well as neutron diffraction (this latter was not achieved until the end and
it may give interesting information).
Previously the absence of 𝐻2 𝑟𝑒𝑙𝑒𝑎𝑠𝑒𝑑 for AlOOH S was attributed to crystallites size
that is too small and hinders the recombination of H radicals created in different
crystallites. Finally this leads us to suppose that another mechanism exists:
(58)
𝐻 + 𝐴𝑙 ⋯𝑂𝐻− → 𝐴𝑙⋯𝑂− + 𝐻2 𝑡𝑟𝑎𝑝𝑝𝑒𝑑
(59)
𝐻2 𝑡𝑟𝑎𝑝𝑝𝑒𝑑ℎ𝑒𝑎𝑡→ 𝐻2 𝑑𝑒𝑡𝑟𝑎𝑝𝑝𝑒𝑑
This mechanism is seen in organic systems where H radical attacks the organic
molecule and forms 𝐻2 :125
In liquid water, this reaction was not described to occur at room temperature, though it
has been described in gas phases and in water at high temperature.
The next interrogation is to understand if the quantity of 𝐻2 𝑑𝑒𝑡𝑟𝑎𝑝𝑝𝑒𝑑 + 𝐻2 𝑡𝑟𝑎𝑝𝑝𝑒𝑑
represent the totality of the hydrogen formed by irradiation.
Our overall observations lead us to propose that hydrogen comes mainly from the
dissociation of OH-:
(60)
2 𝑂𝐻− = 2 𝑂− + 𝐻2 𝑡𝑟𝑎𝑝𝑝𝑒𝑑
The balance of the reaction suggests that 𝐺(𝑂−) should be close to
𝐺(𝐻2 𝑑𝑒𝑡𝑟𝑎𝑝𝑝𝑒𝑑) 𝐺(𝐻2 𝑡𝑟𝑎𝑝𝑝𝑒𝑑). This is far from being the case. Then we suppose that
the above reaction is reversible. Thus upon heating O- centers can react with H2 trapped.
Then H2 detrapped represents the fraction of trapped H2 that did not react with O- centers.
If we suppose that 1 molecule of H2 if formed for 2 O- centers, then the detrapped
hydrogen accounts only for 5 or 10% of the trapped hydrogen. Moreover, the release
of H2 visible above 200°C proves that H2 resulted from the fractions that didn’t react
reversibly with O- dince above this temperature these O- have disappeared.
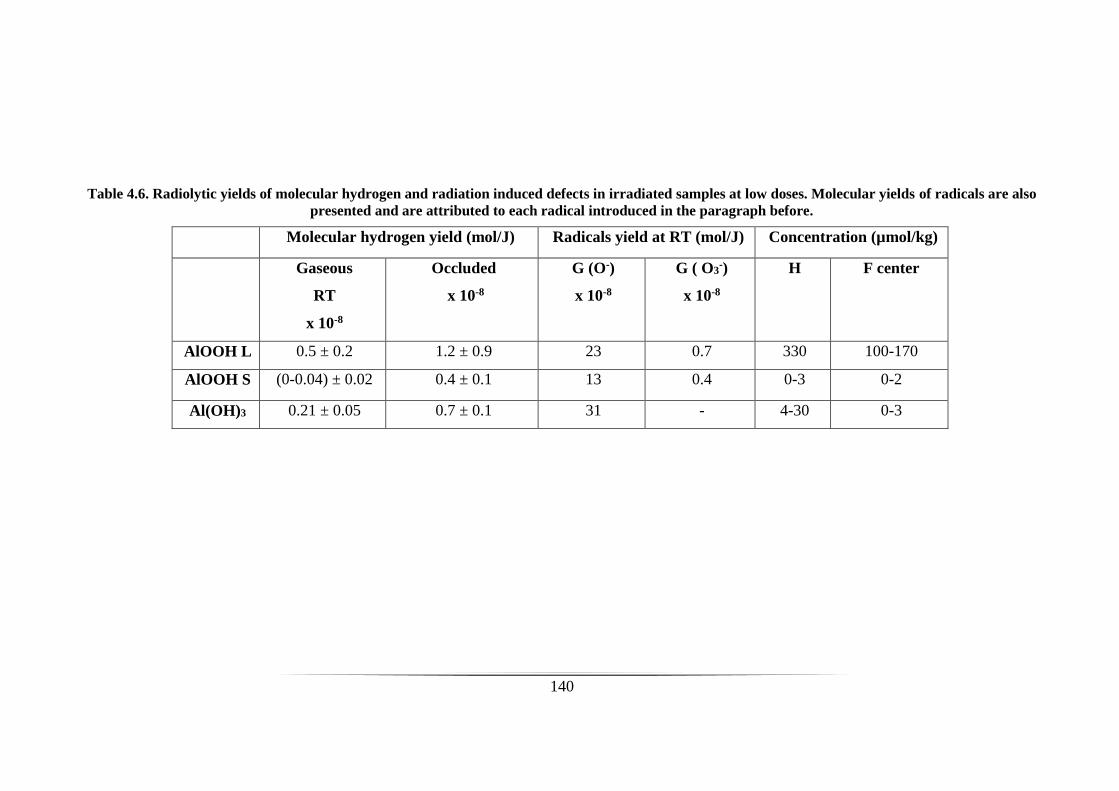
140
Table 4.6. Radiolytic yields of molecular hydrogen and radiation induced defects in irradiated samples at low doses. Molecular yields of radicals are also
presented and are attributed to each radical introduced in the paragraph before.
Molecular hydrogen yield (mol/J) Radicals yield at RT (mol/J) Concentration (µmol/kg)
Gaseous
RT
x 10-8
Occluded
x 10-8
G (O-)
x 10-8
G ( O3-)
x 10-8
H F center
AlOOH L 0.5 ± 0.2 1.2 ± 0.9 23 0.7 330 100-170
AlOOH S (0-0.04) ± 0.02 0.4 ± 0.1 13 0.4 0-3 0-2
Al(OH)3 0.21 ± 0.05 0.7 ± 0.1 31 - 4-30 0-3

141
5. Chapter 5: Molecular hydrogen production from
hydrated aluminum hydroxide and oxyhydroxide
This chapter aims to clarify the effect of adsorbed water on molecular hydrogen
production. Similarly to what have been done in the previous chapter, this section takes
into consideration the effect of structure and particle size on the molecular hydrogen
production. Radiolytic yields as a function of water uptake (see hydration section 2.1.2)
are determined. The study of electron paramagnetic defects by EPR spectroscopy will
be detailed in section 5.2.
5.1.1 H2 production
As explained in Chapter 2 (Chapter 2), samples of AlOOH and Al(OH)3 were hydrated
into desiccators where relative humidities of 11, 44 and 76% at room temperature were
maintained using saturated salt solutions. Ampules were also used to hydrate samples
without exposing them to air. The samples have been irradiated using gamma rays at
low dose rate and high energy electron at high rate. The results will be presented and
discussed with respect to the amount of sorbed water.
5.1.2 Gamma rays
The production of H2 from samples hydrated at 11, 44 and 76% RH and irradiated using
gamma rays at a dose ranging between 6 and 26 kGy is proportional to the dose except
for Al(OH)3 at 44% RH. New experiments are in progress to verify this specific point
meanwhile the data have been ignored. The radiolytic yields deduced from the slope of
the different curves are resumed in Table 5.1. Each gamma test was done on a separate
sample, no cumulated H2 was measured here, and the uncertainties considered are that
related to experimental errors.
At 76% RH hydrogen production increases in the order:
AlOOH S > AlOOH L > Al(OH)3.
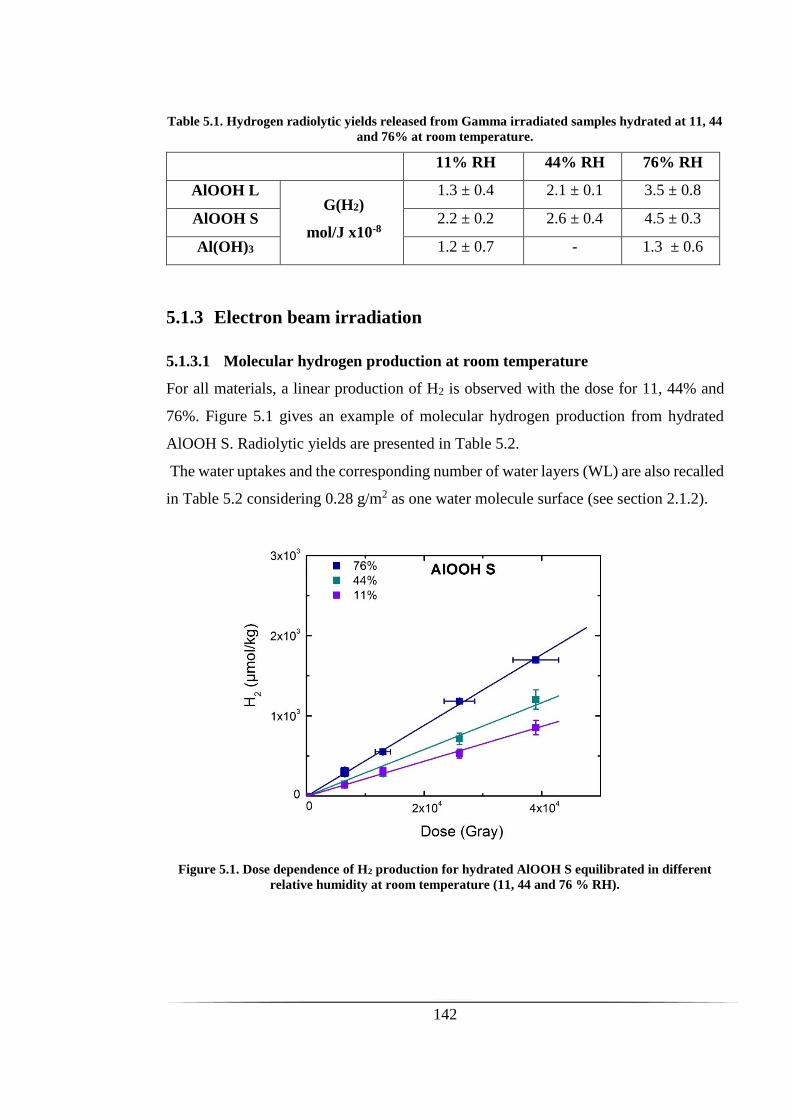
142
Table 5.1. Hydrogen radiolytic yields released from Gamma irradiated samples hydrated at 11, 44
and 76% at room temperature.
11% RH 44% RH 76% RH
AlOOH L G(H2)
mol/J x10-8
1.3 ± 0.4 2.1 ± 0.1 3.5 ± 0.8
AlOOH S 2.2 ± 0.2 2.6 ± 0.4 4.5 ± 0.3
Al(OH)3 1.2 ± 0.7 - 1.3 ± 0.6
5.1.3 Electron beam irradiation
5.1.3.1 Molecular hydrogen production at room temperature
For all materials, a linear production of H2 is observed with the dose for 11, 44% and
76%. Figure 5.1 gives an example of molecular hydrogen production from hydrated
AlOOH S. Radiolytic yields are presented in Table 5.2.
The water uptakes and the corresponding number of water layers (WL) are also recalled
in Table 5.2 considering 0.28 g/m2 as one water molecule surface (see section 2.1.2).
Figure 5.1. Dose dependence of H2 production for hydrated AlOOH S equilibrated in different
relative humidity at room temperature (11, 44 and 76 % RH).

143
Table 5.2. Hydrogen radiolytic yields with respect to percent water loading from hydrated AlOOH L, S and Al(OH)3 under electron irradiation.
Error bars on water uptake ranged between 8% for AlOOH L, 9% for AlOOH S and 15% for Al(OH)3.
Desiccator
Ampules
11% RH 44% RH 76% RH 11% RH 44% RH 76% RH
AlOOH L
Water uptake
(%)
0.60 ± 0.05 1.30 ± 0.10 1.10 ± 0.08 0.050 ± 0.004 0.38 ± 0.03 1.58 ± 0.13
WL 0.52 1.13 0.96 0.04 0.33 1.38
G(H2)
mol/J x 10-8
8 ± 1.0 8.2 ± 1.0 7.6 ± 0.2 5.9 ± 0.06 7.2 ± 0.4 7.0 ± 0.6
AlOOH S
Water uptake
(%)
3.80 ± 0.34 7.40 ± 0.66 17.42 ± 1.56 1.3 ± 0.1 4.5 ± 0.4 14.2 ± 1.3
WL 0.51 0.99 2.32 0.17 0.60 1.90
G(H2)
mol/J x 10-8
2.2 ± 0.1 2.6 ± 0.4 4.5 ± 0.3 2.7 ± 0.1 3.6 ± 0.2 6.7 ± 1.2
Al(OH)3
Water uptake
(%)
0.34 ± 0.05 0.42 ± 0.06 0.50 ± 0.07 0.17 ± 0.02 0.36 ± 0.05 0.78 ± 0.12
WL 0.11 0.14 0.16 0.05 0.11 0.25
G(H2)
mol/J x 10-8 1.0 ± 0.1 1.1 ± 0.8 2.6 ± 0.8 0.51 ± 0.09 0.41 ± 0.01 0.55 ± 0.02

144
Concerning hydrogen production, no big differences were seen between the three
hydrated AlOOH L.
The variation of G(H2) as a function of the water loading is presented in Figure 5.2,
Figure 5.3 and Figure 5.4 for the different materials. For comparison, the primary yield
for liquid water 𝐺𝑤𝑎𝑡𝑒𝑟(𝐻2)(= 4.5 10−8 𝑚𝑜𝑙/𝐽) is indicated as well as the expected
variation of G(H2) following the additive law if there was no interaction between water
and the material. The additive law is given by the relation:
𝐺ℎ𝑦𝑑𝑟𝑎𝑡𝑒𝑑 = (1 − 𝜔𝑤𝑎𝑡𝑒𝑟). 𝐺𝑑𝑟𝑦 + 𝜔𝑤𝑎𝑡𝑒𝑟 . 𝐺
𝑤𝑎𝑡𝑒𝑟(𝐻2) 𝜔𝑤𝑎𝑡𝑒𝑟 is the weight fraction of water and 𝐺𝑑𝑟𝑦 is the yield of the dry material.
Figure 5.2. Hydrogen production from AlOOH L with respect to water loading. Blue squares
(electron irradiations of desiccator hydrated samples), orange dots (electron irradiations of
ampule hydrated samples), green squares (gamma irradiations of desiccator hydrated samples).
Black dotted line (primary radiolytic yield of liquid water) and gray continuous line (additive
law see text).

145
Figure 5.3. Hydrogen production from AlOOH S with respect to water loading. Purple dots
(electron irradiations of desiccator hydrated samples), orange dots (electron irradiations of
ampule hydrated samples), green dots (gamma irradiations of desiccator hydrated samples).
Black dotted line (primary radiolytic yield of liquid water) and gray continuous line (additive
law see text).
Figure 5.4. Hydrogen production from Al(OH)3 with respect to water loading. Pink dots
(electron irradiations of desiccator hydrated samples), orange dots (electron irradiations of
ampule hydrated samples), green dots (gamma irradiations of desiccator hydrated samples).
Black dotted line (primary radiolytic yield of liquid water) and gray continuous line (additive
law see text).
From Figure 5.2, it is noticeable that for AlOOH L, G(H2) is constant whatever the
water uptake is and that a big difference exists between results obtained from electron
and gamma irradiations. This latter irradiation type shows lower values by a factor
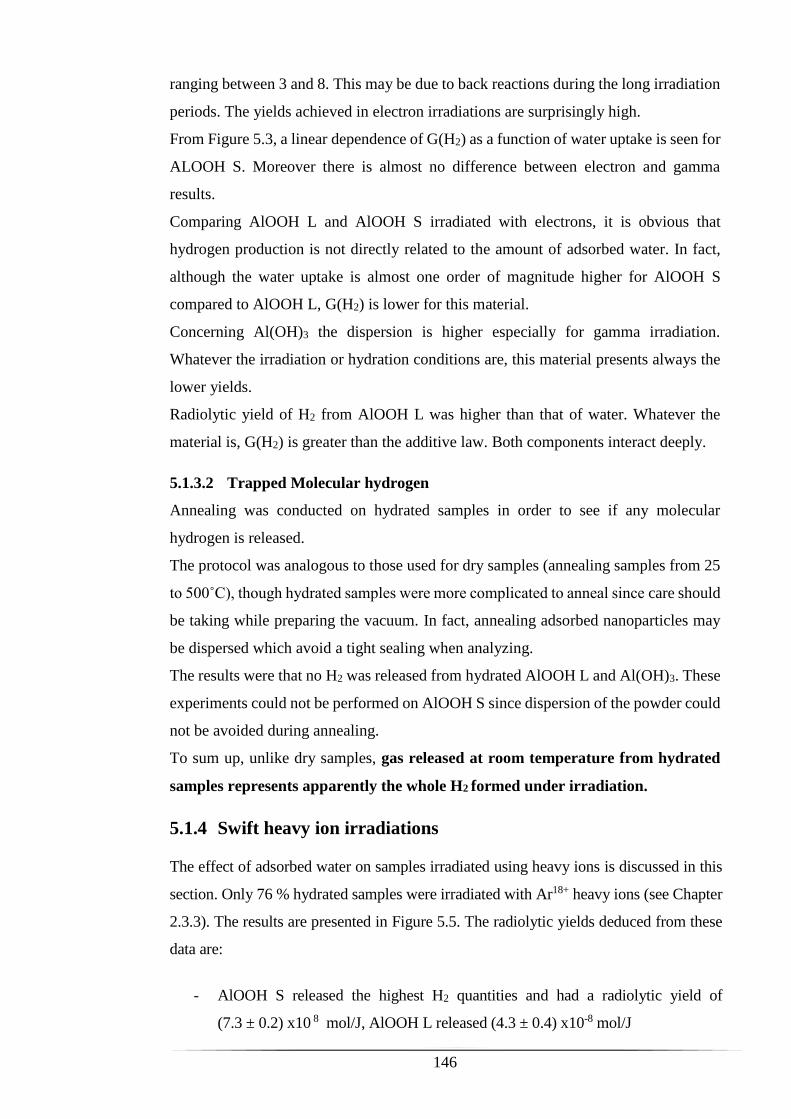
146
ranging between 3 and 8. This may be due to back reactions during the long irradiation
periods. The yields achieved in electron irradiations are surprisingly high.
From Figure 5.3, a linear dependence of G(H2) as a function of water uptake is seen for
ALOOH S. Moreover there is almost no difference between electron and gamma
results.
Comparing AlOOH L and AlOOH S irradiated with electrons, it is obvious that
hydrogen production is not directly related to the amount of adsorbed water. In fact,
although the water uptake is almost one order of magnitude higher for AlOOH S
compared to AlOOH L, G(H2) is lower for this material.
Concerning Al(OH)3 the dispersion is higher especially for gamma irradiation.
Whatever the irradiation or hydration conditions are, this material presents always the
lower yields.
Radiolytic yield of H2 from AlOOH L was higher than that of water. Whatever the
material is, G(H2) is greater than the additive law. Both components interact deeply.
5.1.3.2 Trapped Molecular hydrogen
Annealing was conducted on hydrated samples in order to see if any molecular
hydrogen is released.
The protocol was analogous to those used for dry samples (annealing samples from 25
to 500˚C), though hydrated samples were more complicated to anneal since care should
be taking while preparing the vacuum. In fact, annealing adsorbed nanoparticles may
be dispersed which avoid a tight sealing when analyzing.
The results were that no H2 was released from hydrated AlOOH L and Al(OH)3. These
experiments could not be performed on AlOOH S since dispersion of the powder could
not be avoided during annealing.
To sum up, unlike dry samples, gas released at room temperature from hydrated
samples represents apparently the whole H2 formed under irradiation.
5.1.4 Swift heavy ion irradiations
The effect of adsorbed water on samples irradiated using heavy ions is discussed in this
section. Only 76 % hydrated samples were irradiated with Ar18+ heavy ions (see Chapter
2.3.3). The results are presented in Figure 5.5. The radiolytic yields deduced from these
data are:
- AlOOH S released the highest H2 quantities and had a radiolytic yield of
(7.3 ± 0.2) x10 8 mol/J, AlOOH L released (4.3 ± 0.4) x10-8 mol/J

147
- Al(OH)3 released the lowest quantities (0.80 ± 0.04) x10-8 mol/J. Care should be
taken to all the molecular hydrogen quantified under heavy ions irradiations.
Samples were held few months before being analyzed in order to be deactivated.
Figure 5.5. Hydrogen production from 76% hydrated Ar18+ irradiated aluminum hydroxides and
oxyhydroxides as a function of the dose.
At 76% RH, AlOOH L released 5 times more hydrogen and Al(OH)3 three times than
dry samples, these quantities were due to energy transfer between the solid and
adsorbed water.
These experiments have to be repeated in order to verify these values but time was not
enough to book another irradiation session.
A study as a function of time is essential as well as a function of the dose to understand
the mechanism of hydrogen production under heavy ions from our samples.
In the next section, radiation induced defects are studied.
5.2 Radiation induced defects
5.2.1 Bohemite AlOOH
5.2.1.1 Trapped defects in Boehmite at 77 K
In order to reduce the reactions of recombination of defects created by irradiation, the
materials were irradiated at 77 K. The EPR spectra of irradiated AlOOH S and AlOOH
L using electron beams at 46 kGy are given in Figure 5.6. For both material RID I,
RID II and H radicals are identified.

148
In order to reduce the reactions of recombination of defects created by irradiation the
materials were irradiated at 77 K. The EPR spectrum of AlOOH S and AlOOH L
electron irradiated at 46kGy are given in Figure 5.6. For both materials RID I, RID II
and H radicals are identified. Only the relative intensities of the signals are different.
We must also notice that No F centers were observable in both samples.
RID signals are proportional to the dose within experimental uncertainties whereas the
concentration of H radicals is stationary. This result shows that H radicals are not stable
and react even at 77 K. The yields of defects formation are resumed in Table 5.3. As
the yields of defects creation are very close in both materials, we can conclude that
particle size and impurities have little impact on primary defects production. The RID
yields are also very high close to the maximum yield of electron-hole pair formation
(see Chapter 2).
No F centers were seen at 77 K. Check Appendix B.
Figure 5.6. EPR spectra of electron irradiated AlOOH L (wine line) and AlOOH S (orange line)
at 77 K at 46 kGy.
Table 5.3. Radiolytic yields of radiation induced defects in electron irradiated samples
at 77 K.
RID yield at 77 K
G (O-)
mol/J x 10-8
G ( O3-)
mol/J x 10-8
H
µmol/kg
AlOOH L 70 ± 10 17 ± 4 1000 ± 100
AlOOH S 80 ± 20 18 ± 5 68-220

149
The annealing at room temperature of irradiated samples at 77 K reveals an important
decrease of the RID signals by a factor comprised between 5 and 10. A major difference
is observed between the materials concerning H radicals: in AlOOH L their
concentration remains unchanged while in AlOOH S almost no H radicals can be
detected at RT.
To conclude, low temperature irradiation confirms that the primary creation of
defects does not depend on the particle size. Differences between the materials
with different crystallite sizes are only observed at room temperature where
remaining centers represent only 10 or 20% of the initial transient defects
particles. We conclude that the particle size or the specific surface influence only
secondary reactions once the migration of the defects is efficient.
5.2.1.2 Dose effect in Boehmite at RT
Qualitatively EPR spectra of hydrated and dry materials at room temperature are
similar. Some EPR spectra are presented in Appendix 8. The evolutions with the dose
of different defects from irradiated samples hydrated at 76% RH and dry samples are
shown in Figure 5.7, Figure 5.8, Figure 5.9 and Figure 5.10. In order to compare, results
obtained from dry materials are also plotted.
In the case of AlOOH L, there is no big difference between hydrated and dry samples
except a slight decrease of H radical concentration in presence of sorbed water. The
remarkable difference is the quasi absence of FS centers in hydrated materials (RID III).
These electron centers are located on the surface and can react with sorbed water
molecules. Therefore one may wonder if these centers are an evidence of the energy
transfer between the solid and the surface. In Chapter 4, the minimal yield of formation
of FS centers was estimated to be close to 2 x 10⁻⁸ mol/J. Although this value is lower
than G(H2) measured for hydrated AlOOH L, the order of magnitude may allow us to
think that a fraction of the electron transfer to the surface formed transient FS centers
that react with water molecules present at the surface.
To confirm this hypothesis experiments at lower dose on dry samples are needed.
Likewise, the potential effect of drying treatment on trapping properties of electron
centers has to be analyzed.
Concerning AlOOH S it should be emphasized that in hydrated materials a significant
concentration of H radicals and RID III’ is observed even at 300 kGy while these
paramagnetic centers were only detectable at the lowest doses in dry samples.

150
It is tempting to assign these differences to the important fraction of water present in
AlOOH S (14- 18 % by weight). Electron and H radicals can come from the radiolysis
of water. Experiments using D2O are proposed to clarify this point.
Figure 5.7. Evolution of the concentration of H radicals in hydrated at 76 % RH (blue dots) and
dry (red dots) AlOOH L (left) and AlOOH S (right) as a function of the dose.

151
Figure 5.8. Evolution of the concentration of RID I in hydrated at 76 % RH (blue dots) and dry
(red dots) AlOOH L (left) and AlOOH S (right) as a function of the dose.
Figure 5.9. Evolution of the concentration of RID II in hydrated at 76 % RH (blue dots) and dry
(red dots) AlOOH L (left) and AlOOH S (right) as a function of the dose.
Figure 5.10. Evolution of the concentration of RID III in hydrated at 76 % RH (blue dots) and
dry (red dots) AlOOH L (left) and AlOOH S (right) with respect to dose.
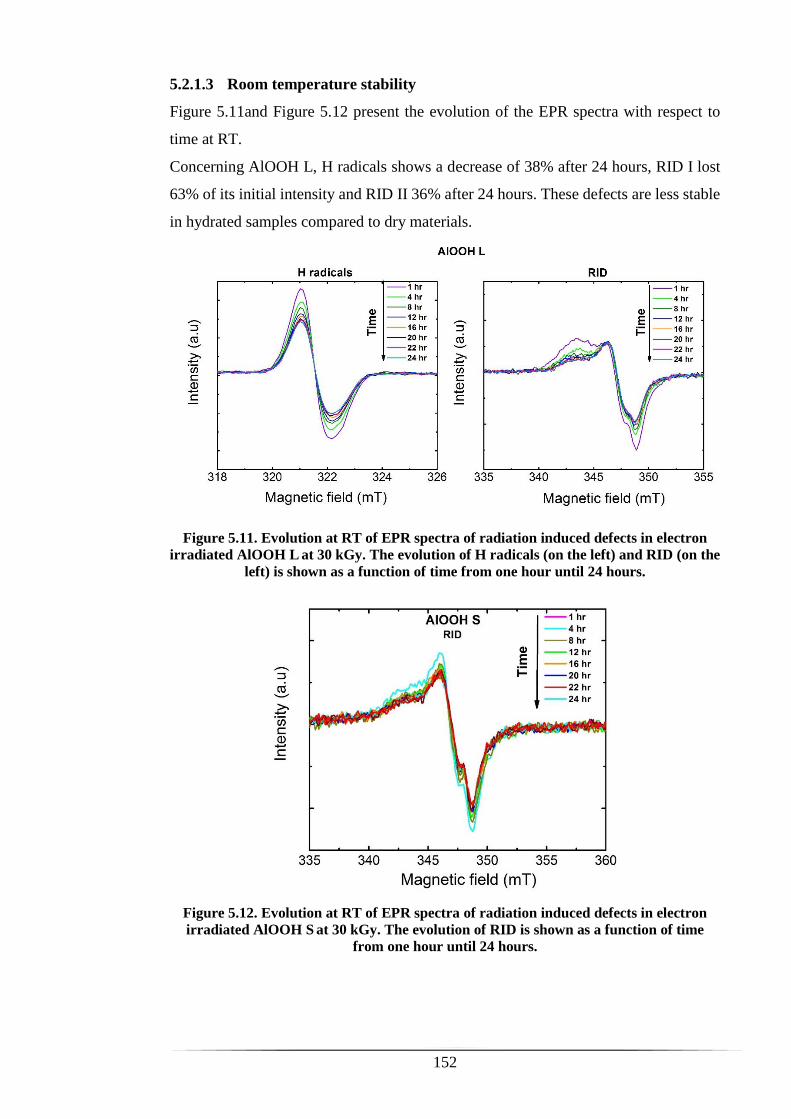
152
5.2.1.3 Room temperature stability
Figure 5.11and Figure 5.12 present the evolution of the EPR spectra with respect to
time at RT.
Concerning AlOOH L, H radicals shows a decrease of 38% after 24 hours, RID I lost
63% of its initial intensity and RID II 36% after 24 hours. These defects are less stable
in hydrated samples compared to dry materials.
Figure 5.11. Evolution at RT of EPR spectra of radiation induced defects in electron
irradiated AlOOH L at 30 kGy. The evolution of H radicals (on the left) and RID (on the
left) is shown as a function of time from one hour until 24 hours.
Figure 5.12. Evolution at RT of EPR spectra of radiation induced defects in electron
irradiated AlOOH S at 30 kGy. The evolution of RID is shown as a function of time
from one hour until 24 hours.

153
5.2.1.4 Annealing above room temperature
Annealing of EPR defects originating from electron irradiation of AlOOH S and L at 30
kGy, is shown in Figure 5.13 and Figure 5.14.
In AlOOH L, H radicals lost 61% of the initial intensity at 74°C and disappears at
110°C. At 74°C, RID I has 30% of its initial intensity and RID II has 77%. RID I
disappears at 140°C while RID II is at 45% at 185°C.
At 74°C, for AlOOH S the RID I attends 31% approximately and disappears at 185°C.
RID II is at 60 % of the initial intensity at 74°C and at 33% at 185°C.
Figure 5.13. Evolution of H radicals and radiation induced defects as a function of
temperature in electron irradiated AlOOH L at 30 kGy.
Figure 5.14. Evolution of H radicals and radiation induced defects as a function of
temperature in electron irradiated AlOOH S at 30 kGy.
In order to study the effect of structure, the same analyses were conducted on Al(OH)3
and are presented in the next section.

154
5.2.2 Bayerite Al(OH)3
5.2.2.1 Trapped defects in Bayerite at 77 K
Figure 5.15 presents the EPR spectrum of hydrated Al(OH)3 electron-irradiated at 77
K at 46 kGy. It is very close to that observed for AlOOH. In particular it reveals the
presence of a singlet which has spin parameters close to those of RID II’. This signal
was not observed in dry Al(OH)3 at room temperature. Annealing at room temperature
causes the disappearance of both H radicals and RID II’, the intensity of RID I’
increases and the signal assigned to RID VI’ emerges.
The loss of RID II’ attributed to ozonide radicals can be due to the formation of 𝑂3:
By a reaction with O- for example:
(61)
𝑂3− + 𝐴𝑙⋯𝑂− →𝑂3 + 𝐴𝑙⋯𝑂
2−⋯𝐴𝑙
The formation of oxide in interaction with two aluminums is highly probable and is
evidenced by the formation of RID VI’.
Another mechanism is the reverse reaction of ozonide radicals:
(62)
𝑂3− →𝑂2 + 𝑂
−
The increase of the concentration of O- centers after annealing at RT supports this
mechanism.
Figure 5.15. EPR spectra of electron irradiated Al(OH)3 at 77 K, at 46 kGy (orange) and
annealed at RT (olive) (76 % RH).

155
Table 5.4. Radiolytic yields of radiation induced defects in Al(OH)3 irradiated using electron
beams at 77 K.
RID yield at 77 K Concentration
G (O-)
mol/J x 10-8
G ( O3-)
mol/J x 10-8
H
µmol/kg
43 ± 6 54 ± 9 725
5.2.2.2 Dose effect at room temperature
Figure 5.16 shows the evolution of the concentration of radiation induced defect RID
I’ and H radicals with respect to the dose received in Al(OH)3. EPR spectra are
presented in Appendix 8. The comparison with the results obtained for dry Al(OH)3
shows that unlike AlOOH L and S, the behavior of defects with respect to the dose is
cery close in hydrated and dry Al(OH)3.
RID III’ was formed at 7, 15 and 30 kGy Appendix 8.
Figure 5.16. Evolution of the concentration of H radicals in hydrated at 76 % RH (blue dots) and
dry (red dots) Al(OH)3 as a function of the dose
5.2.2.3 Room temperature stability
Al(OH)3 stabilization at room temperature is shown in Figure 5.17, after 24 hours the
initial H radical concentration decreased by 85%, as mentioned before H radicals were
not stable in hydrated Al(OH)3. RID III’ increased by 35%. The stability of H radicals
and RID III’ were comparable between dry and hydrated Al(OH)3.

156
Figure 5.17. Evolution at RT of EPR spectra of radiation induced defects in electron
irradiated Al(OH)3 at 30 kGy. The evolution of H radicals (on the left) and RID (on the
left) is shown as a function of time from one hour until 24 hours.
5.2.2.4 Annealing above room temperature
Annealing of EPR defects originating from the irradiation of Al(OH)3 using electron
beams at 30 kGy is shown and discussed in this section. In Figure 5.18, thermal evolution
of the relative intensity of H radical and RID I’ spectra is also plotted. H radicals lost 70%
of the initial intensity at 40°C, and disappears above 58°C. The stability of H radicals
regarding temperature was higher in dry Al(OH)3, at 40°C H radical intensity was almost
the double in dry samples. As for dry Al(OH)3 above 80°C RID I’ is replaced by a new
defect RID V’.
Figure 5.18. Al(OH)3 annealing showing radiation induced defect shapes a temperature and the
disappearance in intensity. Black dotted line represents H radicals while the two pink dotted
lines are used to show the disappearance of the square (RID I’) and the appearance of two new
defects symbolized with a close and an open triangle and which are related to RID V’ and RID
VI’ respectively.

157
5.3 Discussion
The main results concerning hydrated materials are given in Table 5.5, Table 5.6 and
Table 5.7.
Table 5.5. Defect radiolytic yields from irradiated samples at 77 K, RT using electron beams.
Radiolytic yield (mol/J) x 10-8
AlOOH L AlOOH S Al(OH)3
RT 77K RT 77K RT 77K
RID I 16 70 ± 10 4 ± 1 80 ± 20 65 ± 10 54 ± 9
RID II 0.3-1.9 17 ± 4 0.3 18 ± 5
Table 5.6. Concentrations of H radicals from irradiated samples at 77 K, RT using electron
beams.
(µmol/kg)
H
RT 77K
AlOOH L 450 1000
AlOOH S 28 ± 5 144
Al(OH)3 60 ± 5 725
While discussing H2 production in hydrated AlOOH and Al(OH)3, we must keep in
mind its analogies and differences with the behavior of dry materials:
- The H2 production is 15-20 times higher in hydrated materials,
- Hydrated materials do not present H2 detrapping upon heating,
- Same defects and almost same quantities are produced in dry and hydrated
materials.
The very important hydration effect on H2 production can be explained by different
mechanisms:
- Energy/electron transfer to the water layer,
- Activation of H diffusion that prevent its back reaction,
In AlOOH L and in a lesser extent in AlOOH S the global G(H2) (the yield calculated
with respect to the total energy received by the system) exceeds the primary yield of
liquid water. This result demonstrates that, if there is an energy transfer, it is
ultra efficient between the solid and sorbed water.
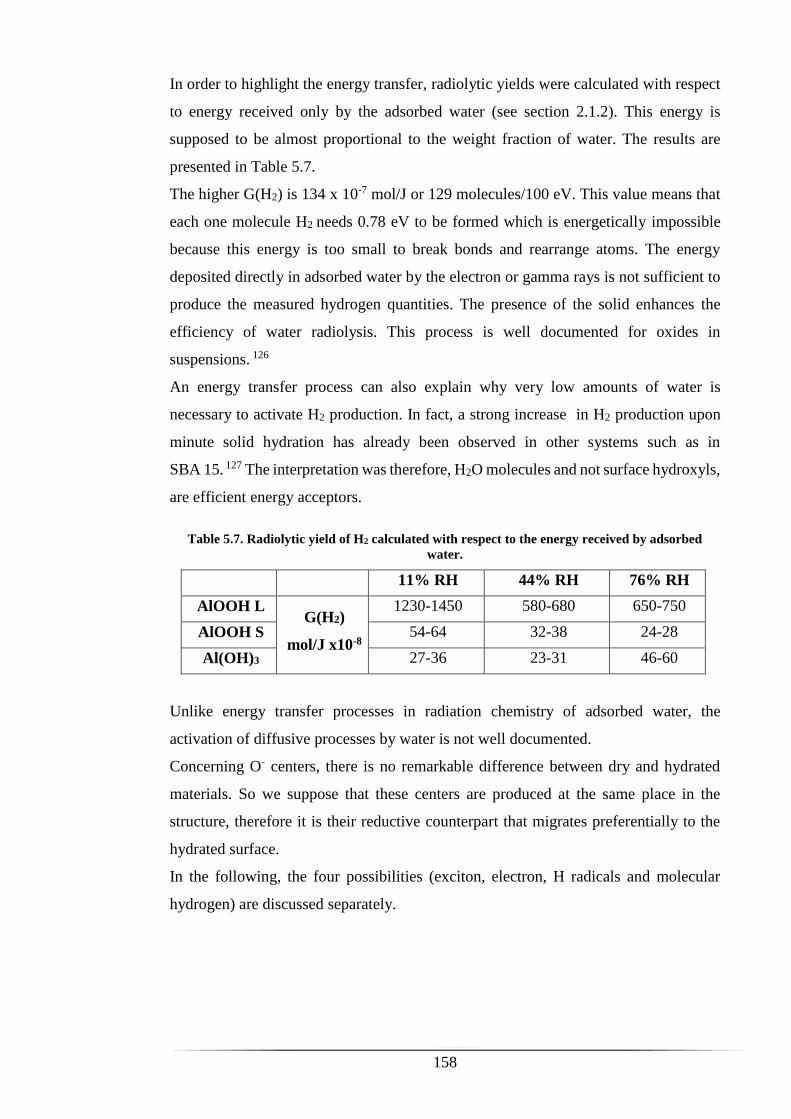
158
In order to highlight the energy transfer, radiolytic yields were calculated with respect
to energy received only by the adsorbed water (see section 2.1.2). This energy is
supposed to be almost proportional to the weight fraction of water. The results are
presented in Table 5.7.
The higher G(H2) is 134 x 10-7 mol/J or 129 molecules/100 eV. This value means that
each one molecule H2 needs 0.78 eV to be formed which is energetically impossible
because this energy is too small to break bonds and rearrange atoms. The energy
deposited directly in adsorbed water by the electron or gamma rays is not sufficient to
produce the measured hydrogen quantities. The presence of the solid enhances the
efficiency of water radiolysis. This process is well documented for oxides in
suspensions. 126
An energy transfer process can also explain why very low amounts of water is
necessary to activate H2 production. In fact, a strong increase in H2 production upon
minute solid hydration has already been observed in other systems such as in
SBA 15. 127 The interpretation was therefore, H2O molecules and not surface hydroxyls,
are efficient energy acceptors.
Table 5.7. Radiolytic yield of H2 calculated with respect to the energy received by adsorbed
water.
11% RH 44% RH 76% RH
AlOOH L
LL L
G(H2)
mol/J x10-8
1230-1450 580-680 650-750
AlOOH S 54-64 32-38 24-28
Al(OH)3 27-36 23-31 46-60
Unlike energy transfer processes in radiation chemistry of adsorbed water, the
activation of diffusive processes by water is not well documented.
Concerning O- centers, there is no remarkable difference between dry and hydrated
materials. So we suppose that these centers are produced at the same place in the
structure, therefore it is their reductive counterpart that migrates preferentially to the
hydrated surface.
In the following, the four possibilities (exciton, electron, H radicals and molecular
hydrogen) are discussed separately.

159
Exciton
By analogy with what was observed for silica glasses where the activation of energy
transfer by surface hydration leads to a strong decrease of defect production,7 a decrease
of the O- centers is expected in our systems. A significant reduction is detected for
AlOOH but the opposite effect is observed for Al(OH)3.
Electron
The transfer of electron and their trapping at the surface has been evidenced in dry
AlOOH L by the formation of FS center. Unfortunately these centers are not detected
in the others materials.
H radical
Our experiments do not provide quantitative information about the diffusion of H
radicals. It was only observed that trapped H radicals are more stable in hydrated
AlOOH L. This result is in contradiction with the proposal of an increase of the
migration in presence of water but it should not be over interpreted as we do not know
if trapped and mobile H radicals have the same properties.
H2
The absence of detrapped hydrogen in hydrated materials could be attributed to an
enhancement of H2 diffusion in the solid. This proposition is questionable because, as
discussed in Chapter 4, the quantity of hydrogen released after annealing results from
two competitive processes – the reaction of trapped hydrogen with O- centers and the
recombination of O- centers. Detrapped hydrogen represents only 5 or 10%. Finally
we could consider that the variation of the O- centers concentration or of the
recombination rate can inhibit the release of hydrogen.
The phenomena occurring in hydrated samples are concluded to be similar to that in
dry samples but with energy transfer effect. This last point has to be developed by
conducting time resolved experiments.

160
161
6. Chapter 6: Molecular hydrogen production from
Brucites
This section presented preliminary results related to the effect of impurities and particle
size on hydrogen production from another hydroxide chosen as a model compound
which is Mg(OH)2 ( Brucite). This is only a perspective test and experiments were not
taken further as far as with AlOOH and Al(OH)3. This was intended in order to see if
we can generalize the effect of impurities and nanometric particle size on hydrogen
production in other hydroxides.
Mg(OH)2 was elaborated in the laboratory following the method of Sutto et al.76 Some
parameters were adjusted regarding the article and were described in section 2.2.
A brief characterization was achieved and is described in section 6.1. In a first step the
effect of particle size on hydrogen production is briefly described and in a second one
the effect of impurity is presented. Materials were irradiated in the same way described
for dry AlOOH and Al(OH)3 using electron beams (section 2.3.1.1).
6.1 Characterization
Synthesized Mg(OH)2 with varied impurities types and amounts (KNO3 and K2SO4),
were analyzed with XRD in order to determine phase composition as well as crystallite
sizes (see Figure 6.1). They are compared to a commercial industrial Mg(OH)2
(containing 2 % of various impurities) and has 19 nm as a particle size (blue line Figure
6.1).

162
Figure 6.1. X-ray spectra of two sized Mg(OH)2 .
In Figure 6.1 1shows a 19 nm particle sized sample (blue line with various impurities).
Smaller particle sizes are represented (3 nm) with 1% and 18% K2SO4 (orange and
violet respectively) and a fourth sample is used having a 3 nm particle size and
containing 7% KNO3 (green line).
Synthetized samples contained more phases than the commercial one (blue line Figure
6.1). Particle size was calculated using Debye Scherer as explained in section 2.4.1
In this section, the effect of impurity and particle size are the only parameters studied,
therefore dry samples were used and were prepared after evacuation at 170°C for
5 hours under secondary vacuum. Figure 6.2. shows the thermogram of commercial
Mg(OH)2, phase transformation occurs at 400˚C and heat treatment applied at 170˚C
before irradiating samples assures that structural water is not altered.

163
Figure 6.2.TGA and DTG characterization of pristine Mg(OH)2 under N2.
Parameters were as follows:
- Particle size: 2 sizes, 3 nm (synthetized) and 19 nm (purchased used as a
reference, blue line)
- Impurity: 2% pure (commercial, blue line), synthetized one with 1% K2SO4,
18% K2SO4 and 7% KNO3 (orange violet and green lines respectively, Figure
6.1).
After a brief characterization of the samples, the next sections describe the hydrogen
production at room temperature from irradiated samples.
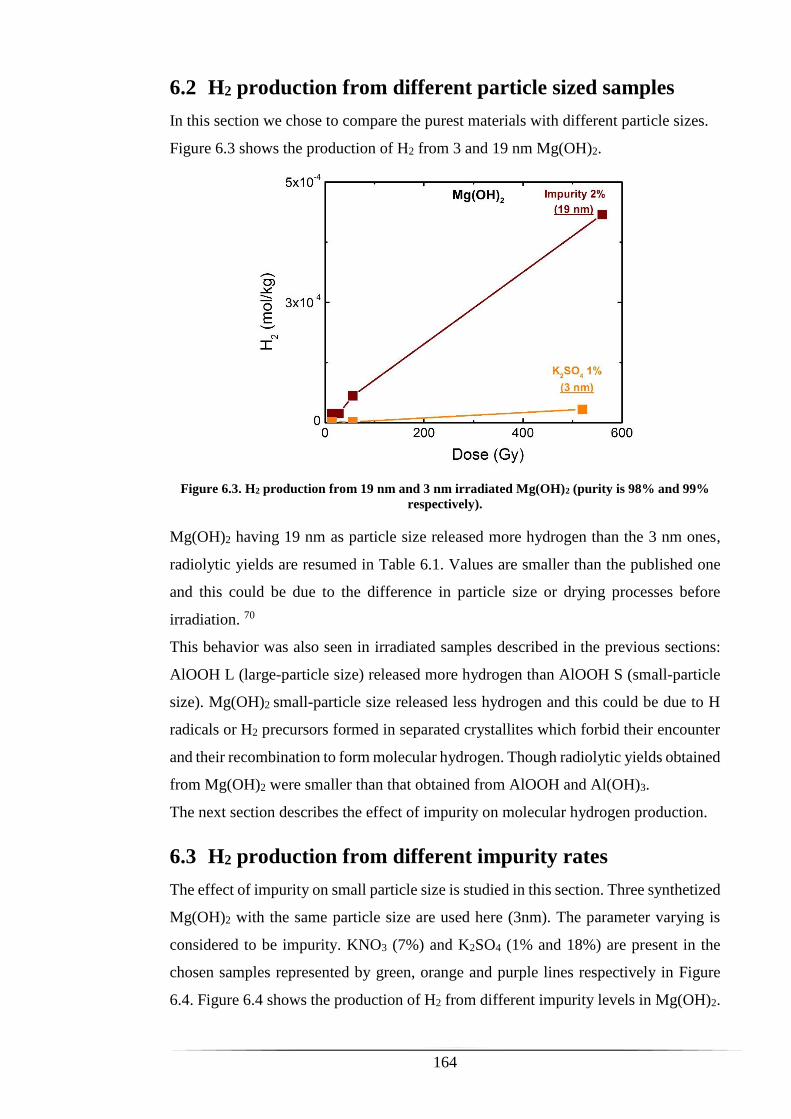
164
6.2 H2 production from different particle sized samples
In this section we chose to compare the purest materials with different particle sizes.
Figure 6.3 shows the production of H2 from 3 and 19 nm Mg(OH)2.
Figure 6.3. H2 production from 19 nm and 3 nm irradiated Mg(OH)2 (purity is 98% and 99%
respectively).
Mg(OH)2 having 19 nm as particle size released more hydrogen than the 3 nm ones,
radiolytic yields are resumed in Table 6.1. Values are smaller than the published one
and this could be due to the difference in particle size or drying processes before
irradiation. 70
This behavior was also seen in irradiated samples described in the previous sections:
AlOOH L (large-particle size) released more hydrogen than AlOOH S (small-particle
size). Mg(OH)2 small-particle size released less hydrogen and this could be due to H
radicals or H2 precursors formed in separated crystallites which forbid their encounter
and their recombination to form molecular hydrogen. Though radiolytic yields obtained
from Mg(OH)2 were smaller than that obtained from AlOOH and Al(OH)3.
The next section describes the effect of impurity on molecular hydrogen production.
6.3 H2 production from different impurity rates
The effect of impurity on small particle size is studied in this section. Three synthetized
Mg(OH)2 with the same particle size are used here (3nm). The parameter varying is
considered to be impurity. KNO3 (7%) and K2SO4 (1% and 18%) are present in the
chosen samples represented by green, orange and purple lines respectively in Figure
6.4. Figure 6.4 shows the production of H2 from different impurity levels in Mg(OH)2.

165
Figure 6.4. H2 production from 3 nm irradiated Mg(OH)2 with different impurity levels.
At low doses Mg(OH)2 containing 18% K2SO4 released more hydrogen than that
containing 1% K2SO4 and 7% KNO3 released more hydrogen than that containing 18%
K2SO4.. At higher doses, Mg(OH)2 containing 18% K2SO4 saturates ( the test at 520
kGy was repeated two times and results indicate a saturation).
Two factors may be affecting the production of H2:
- The amount of impurities, Mg(OH)2 containing more impurities released less
hydrogen, more impurities may be associated to defects which lead the H
radicals to react together and form H2 instead of reacting with impurities or
anionic defects.
- The type of impurities, NO3- and SO4
2- may have different behavior concerning
trapping H radicals or other H2 precursor species. These species play an
important role in the radiolytic decomposition: SO42- is a hole trap and NO3
- an
electron trap, hydrogen produced from the sample containing nitrates were
supposed to produce less hydrogen but results obtained have to be more
developed. 46, 128

166
Table 6.1. Radiolytic yield of irradiated samples as a function of impurity and particle size.
Irradiation
source
Impurity Particle size
(nm)
Radiolytic yield
(mol/J) x 10-8
e- 2 % impurity
(commercial)
19 0.07-0.13 Our
results
1% K2SO4 3 0.003-0.014
18% K2SO4 3 0.019-0.4
7% KNO3 3 0.0087-0.082
60Co - - 0.53 70
He 5 MeV - - 0.38
6.4 Summary
Considering these preliminary results, we can conclude as follows:
- Impurity tends to favor secondary reactions. As a consequence, a decrease in
hydrogen production is likely to occur. The extent of this reduction depends
certainly on the type and amount of impurities.
- Particle size influences hydrogen production and for nanometric particles we
can see that small particles release less hydrogen, this result could be
generalized for other hydroxides having nanometric sizes but more
investigations has to be conducted on other nanomeric samples and on larger
particle sizes.
- This test shows that by synthetizing hydroxides one can impose important
parameters affecting hydrogen production such as particle size, impurity type
and amount. A mix of impurities would be interesting in order to mimic phases
encountered in the metal casks

167
« Regardez les oiseaux du ciel : ils ne
sèment ni ne moissonnent, et ils n’amassent
rien dans des greniers; et votre père céleste les
nourrit. Ne valez-vous pas beaucoup plus
qu’eux? » Matthieu 6:26

168

169
7. Conclusion
This study elucidated the behavior of two hydrates acting as model compounds in the
nuclear industry. The behaviors of AlOOH and Al(OH)3 were studied under different
irradiation sources.
Many preexistent studies treated the radiolysis of liquid water in most cases or the
physical water adsorbed on a solid surface. This thesis not only studies the radiolysis
of adsorbed water on aluminum hydroxide and oxyhydroxide but also that of structural
water in carefully very dry samples.
Molecular hydrogen was quantified considering many factors such as particle size,
structure, water forms, temperature and impurities. These hydrates are so sensible to
radiolysis.
In order to understand the mechanisms of molecular hydrogen production from the
concerned irradiated samples we conducted electron paramagnetic resonance at 77K,
room temperature and above.
The main results are resumed as follows:
Sample structure and surface
Surface and structural characterizations were conducted on samples before and after
heat treatment and irradiation. To serve the purpose, XRD, IR, RAMAN, SEM, BET,
TGA, EPR, ICP and XPS were used.
AlOOH and Al(OH)3 studied showed different characteristics. Two particle sizes were
used: 5 nm for AlOOH and (18-20) nm for AlOOH and Al(OH)3.
These samples have different behaviors with respect to water adsorption and have
different degrees of internal ordering. The small particle size (AlOOH S) is more
disordered than AlOOH L.
Hydrogen production
Molecular hydrogen production was quantified in irradiated dry and hydrated samples.
For dry samples, AlOOH L showed the highest radiolytic yields (5.1 ± 2.4) x 10-9 mol/J
while AlOOH S the lowest ones (0-0.42 ± 0.02) x 10-9 mol/J. Al(OH)3 values ranged
between the first ones described and was (2.1 ± 0.5) x 10-9 mol/J.
The effect of particle size was obvious in dry samples, where the formation of H2 was
more efficient in large-particle size. This effect was suppressed under high LET
irradiation. An additional H2 production was observed at higher temperature. This
occluded H2 production is 10 times greater than at RT (4.6 ± 1.1) x 10-9 mol/J) in

170
AlOOH S. In AlOOH L, the highest H2 occluded (12 ± 9.1) x 10-9 mol/J. As for Al(OH)3
occluded yields were (7.6 ± 1.3) x 10-9 mol/J).
These yields can be compared to that from irradiated hydroxides in the literature but
one has to put in mind that quantified hydrogen published is only a small quantity of
the real one formed. As seen here a huge quantity is still trapped in the material and is
subject to sensible variations.
As for hydrated samples the production of H2 was very high, they released minimum
10 times more hydrogen than dry ones and, for example in AlOOH L, this release was
triggered by very low amounts of water. This indicates the efficiency of radiolysis and
that energy transfer occurs between solid and water on the surface.
To sum up three H2 sources may exist:
- H2 released at room temperature resulting from irradiated dry samples where H
radicals migrate and recombine on the surface.
- H2 released at room temperature resulting from irradiated hydrated samples due
to energy transfer between the solid and its surface.
- H2 is mainly produced by the homolytic reaction of OH that is trapped in the
material.
Radiation induced defects
The stability of radiation induced defects was studied and they were quantified using
electron paramagnetic resonance. Trapped electron and H radicals, which did not
accumulate, and different anionic oxygen radicals were formed in irradiated samples
defect and their spin characterizations are resumed in Table 7.1. In all AlOOH, same
behavior was observed with respect to temperature. Three main oxygen centered
defects were identified O-, O2- and O3
-.
O- was produced in greater number and supposed to be formed as follows:
(63)
2𝑂𝐻− = 2𝑂− + 𝐻2
The reducing equivalent would be H2 in this case.
Practical point of view
Particle size, structure, impurities don’t influence the primary processes in concerned
irradiated materials but influence well the processes related to the migration of the
radiation-induced species. This is why these parameters play a major role in the
production of H2 at room temperature.

171
The disorder and presence of impurities tend to reduce H2 production which is
reassuring from a practical point of view where perfect materials are rarely
encountered.
Further work
The study of the effect of impurity on H2 production were initiated in Mg (OH)2. Same
experiments done on AlOOH and Al(OH)3 would be interesting to be conducted on
brucite in order to generalize the hydrogen production in hydroxides with respect to
structure, particle size and impurity. Varying more impurity types as well as crystallite
sizes going to micrometric sizes is of prime importance to confirm and generalize our
hypotheses. Annealing of samples to see if there is any trapped gas (especially H2)
would be the most important to conduct in these materials.
The study of structure and the placement of H atoms was started using neutron
diffraction, data has to be treated in order to detect the maximum differences between
samples. Polarized neutron diffraction would eventually allow to localize defect sites.
However, the major challenge remains in the occluded H2 localization, an isotopic
labelling would be essential in this case.
Other Interesting experiments would be the following of reactions induced in irradiated
samples in the real time in order to detect the unstable species that might be formed and
recombine into H2 that was seen as trapped.
Owing to the high intensity of the EPR signals, time resolved EPR may be envisioned
as well as studying defects by annealing at low temperature.
The exposition of irradiated samples to air and different gas would be started in further
works. A pulse radiolysis of suspensions is water in one of the future objectives.
The effect of heavy ions on the creation of defects are essential in order to understand
the obtained radiolytic yields quantified during this thesis.

172
Table 7.1. Summary of RID with their spin characterizations and attribution.
Name Material Spin parameters Center
RID I AlOOH 𝑔𝑥 = 𝑔𝑦 = 2.024 ; 𝑔𝑧 = 2.0034
∆𝐻𝑝𝑝𝑥 = ∆𝐻𝑝𝑝
𝑦= 4.8 𝑚𝑇 ; ∆𝐻𝑝𝑝
𝑧 =
3.09 𝑚𝑇
𝑂−
RID I’ Al(OH)3 𝑔𝑥 = 𝑔𝑦 = 2.030 ; 𝑔𝑧 = 2.0026
∆𝐻𝑝𝑝𝑥 = ∆𝐻𝑝𝑝
𝑦= 4.72 𝑚𝑇 ; ∆𝐻𝑝𝑝
𝑧 =
3.88 𝑚𝑇
𝑂−
RID II AlOOH 𝑔𝑧 = 2.010 ; ∆𝐻𝑝𝑝𝑧 = 1.7 𝑚𝑇 𝑂3
−
RID II’ Al(OH)3 𝑔𝑧 = 2.009 ; ∆𝐻𝑝𝑝𝑧 = 2.07 𝑚𝑇 𝑂3
−
RID III AlOOH 𝑔𝑧 = 1.998 ; ∆𝐻𝑝𝑝𝑧 = 0.2 𝑚𝑇 𝐹𝑆
RID III’ Al(OH)3 𝑔𝑧 = 1.998 ; ∆𝐻𝑝𝑝𝑧 = 0.2 𝑚𝑇 𝐹𝑆
RID IV AlOOH 𝑔𝑥 = 𝑔𝑦 = 2.0043 ; 𝑔𝑧 = 2.064
∆𝐻𝑝𝑝𝑥 = ∆𝐻𝑝𝑝
𝑦= 2.06 𝑚𝑇 ; ∆𝐻𝑝𝑝
𝑧 =
4.63 𝑚𝑇
𝑂2−
RID V’ Al(OH)3 𝑔𝑥 = 𝑔𝑦 = 2.0037 ; 𝑔𝑧 = 2.036
∆𝐻𝑝𝑝𝑥 = ∆𝐻𝑝𝑝
𝑦= 1.84 𝑚𝑇 ; ∆𝐻𝑝𝑝
𝑧 =
1.66 𝑚𝑇
𝑂2−
RID VI’ Al(OH)3 𝐴𝑙 ⋯𝑂−⋯𝐴𝑙

173
Reference
1. Bonin, B.; Colin, M.; Dutfoy, A., Pressure Building During the Early Stages of Gas Production in a Radioactive Waste Repository. Journal of Nuclear Materials 2000, 281, 1-14. 2. Lewis, B.; von Elbe, G., Combustion, Flames and Explosion of Gases,(Esp. Chapter V, 15, Combustion Waves in Closed Vessels, Pp. 381-395). Academic Press, Inc., Orlando, Florida (Revised edition of text published in 1951) the end of the detonation cell. Gasdynamics of detonations and explosions. Prog. Astronaut. Aeronaut AIAA, Washington, DC 1987, 75, 358-369. 3. Drell, I. L.; Belles, F. E., Survey of Hydrogen Combustion Properties. 1958. 4. Hu, T. A., Improved Model for Hydrogen Generation Rate of Radioactive Waste at the Hanford Site. Nuclear Technology 2012, 178, 39-54. 5. Andes, T. Characterization of Corrosion Damage on Aluminum Fuel Assemblies in Basin Storage; Savannah River Site (US): 2002. 6. Westbrook, M. L.; Sindelar, R. L.; Fisher, D. L., Radiolytic Hydrogen Generation from Aluminum Oxyhydroxide Solids: Theory and Experiment. Journal of Radioanalytical and Nuclear Chemistry 2015, 303, 81-86. 7. Le Caër, S.; Rotureau, P.; Brunet, F.; Charpentier, T.; Blain, G.; Renault, J. P.; Mialocq, J.-C., Radiolysis of Confined Water: Hydrogen Production at a High Dose Rate. ChemPhysChem 2005, 6, 2585-2596. 8. Rotureau, P.; Renault, J.; Lebeau, B.; Patarin, J.; Mialocq, J. C., Radiolysis of Confined Water: Molecular Hydrogen Formation. ChemPhysChem 2005, 6, 1316-1323. 9. Jonah, C. D.; Rao, B. M., Radiation Chemistry: Present Status and Future Trends; Elsevier, 2001; Vol. 87. 10. Ziegler, J. F.; Ziegler, M. D.; Biersack, J. P., Srim – the Stopping and Range of Ions in Matter (2010). Nuclear Instruments and Methods in Physics Research Section B: Beam Interactions with Materials and Atoms 2010, 268, 1818-1823. 11. Ziegler, J.; Biersack, J., The Stopping and Range of Ions in Matter. In Treatise on Heavy-Ion Science, Bromley, D. A., Ed. Springer US: 1985; pp 93-129. 12. LaVerne, J. A., Track Effects of Heavy Ions in Liquid Water. Radiation research 2000, 153, 487-496. 13. Woods, R. J.; Pikaev, A. K., Applied Radiation Chemistry: Radiation Processing; John Wiley & Sons, 1994. 14. Han, B.; Kim, J.; Kim, Y.; Jeong, K.-Y., Industrial Application of E-Beam Accelerators in Korea. Journal of the Korean Physical Society 2012, 61, 180-184. 15. Rotureau, P. Etude De La Radiolyse De L'eau En Milieu Poreux. Université d'Evry-Val d'Essonne, 2004. 16. Leroy, C.; Rancoita, P.-G., Principles of Radiation Interaction in Matter and Detection; World Scientific, 2009; Vol. 2. 17. Hatano, Y.; Katsumura, Y.; Mozumder, A., Charged Particle and Photon Interactions with Matter: Recent Advances, Applications, and Interfaces; CRC Press, 2010. 18. Kotomin, E.; Popov, A., Radiation-Induced Point Defects in Simple Oxides. Nuclear Instruments and Methods in Physics Research Section B: Beam Interactions with Materials and Atoms 1998, 141, 1-15.

174
19. Nakamoto, K., Infrared and Raman Spectra of Inorganic and Coordination Compounds; Wiley Online Library, 1986. 20. Lund, A.; Shiotani, M., Epr of Free Radicals in Solids I: Trends in Methods and Applications; Springer Science & Business Media, 2012; Vol. 24. 21. Burton, M., Symposium on Radiation Chemistry Introduction. The Journal of Physical Chemistry 1952, 56, 545-545. 22. Hayes, W.; Stoneham, A. M., Defects and Defect Processes in Nonmetallic Solids; Courier Corporation, 2004. 23. El Omar, A. K. Études Des Réactions Primaires En Solutions Par La Radiolyse Pulsée Picoseconde. 2013. 24. Caffrey Jr, J. M.; Allen, A. O., Radiolysis of Pentane Adsorbed on Mineral Solids. The Journal of Physical Chemistry 1958, 62, 33-37. 25. Reiff, S. C.; LaVerne, J. A., Radiation-Induced Chemical Changes to Iron Oxides. The Journal of Physical Chemistry B 2015, 119, 7358-7365. 26. Emmett, P.; Livingston, R.; Zeldes, H.; Kokes, R., Formation of Hydrogen Atoms in Irradiated Catalysts. The Journal of Physical Chemistry 1962, 66, 921-923. 27. Weeks, R. A.; Abraham, M., Electron Spin Resonance of Irradiated Quartz: Atomic Hydrogen. The Journal of Chemical Physics 1965, 42, 68-71. 28. Le Caër, S.; Rotureau, P.; Brunet, F.; Charpentier, T.; Blain, G.; Renault, J. P.; Mialocq, J. C., Radiolysis of Confined Water: Hydrogen Production at a High Dose Rate. ChemPhysChem 2005, 6, 2585-2596. 29. Kulis, P.; Springis, M.; Tale, I.; Vainer, V.; Valbis, J., Impurity‐Associated Colour Centres in Mg‐and Ca‐Doped Al2o3 Single Crystals. physica status solidi (b) 1981, 104, 719-725. 30. Lee, K.-H.; Holmberg, G.; Crawford, J., Optical and Esr Studies of Hole Centers in Γ‐Irradiated Al2o3. physica status solidi (a) 1977, 39, 669-674. 31. Nakazato, C.; Masuda, T., Reactivity of Electrons Produced in Gamma-Irradiated Zeolite toward Several Electron Scavengers. Bulletin of the Chemical Society of Japan 1986, 59, 2237-2239. 32. Teolis, B. D.; Shi, J.; Baragiola, R. A., Formation, Trapping, and Ejection of Radiolytic O2 from Ion-Irradiated Water Ice Studied by Sputter Depth Profiling. The Journal of Chemical Physics 2009, 130, 134704. 33. Laffon, C.; Lacombe, S.; Bournel, F.; Parent, P., Radiation Effects in Water Ice: A near-Edge X-Ray Absorption Fine Structure Study. J Chem Phys 2006, 125, 204714. 34. Ghormley, J. A.; Stewart, A. C., Effects of Γ-Radiation on Ice1. Journal of the American Chemical Society 1956, 78, 2934-2939. 35. Bednarek, J.; Plonka, A., Single-Crystal Electron Spin Resonance Studies on Radiation-Produced Species in Ice I H. Part 1.—the O–Radicals. Journal of the Chemical Society, Faraday Transactions 1: Physical Chemistry in Condensed Phases 1987, 83, 3725-3735. 36. Parent, P.; Laffon, C., Adsorption of Hcl on the Water Ice Surface Studied by X-Ray Absorption Spectroscopy. The Journal of Physical Chemistry B 2005, 109, 1547-1553. 37. Rosenberg, R. A. L., P. R. Rehn, Victor Stöhr, J. Jaeger, R. Parks, C. C., K -Shell Excitation of D 2 O and H 2 O Ice: Photoion and Photoelectron Yields. Physical Review B 1983, 28, 3026-3030. 38. Lefort, M. C. a. M., Sur Le Mécanisme Chimique Primaire De Radiolyse De L'eau. Journal de chimie physique 1955, 52, 545-555.

175
39. J.A. Ghormley, a. A. O. A., A. E. C, In 115th American Chemical Society Meeting San Franciscom California, 1949. 40. Scheuer, W. D. a. O., Décomposition De L’eau Par Les Rayons. Compt. Rend 1913, 156, 466-467. 41. P. Gunther, a. L. H., Quantum Yields of Gas Reactions Induced by Shortwave Ultra-Violet Light. Z. Physik. Chem 1939, 374. 42. Alig, R.; Bloom, S., Electron-Hole-Pair Creation Energies in Semiconductors. Physical review letters 1975, 35, 1522. 43. Ranby, B.; Rabek, J. F., Esr Spectroscopy in Polymer Research; Springer Science & Business Media, 2012; Vol. 1. 44. Crawford, J. H.; Slifkin, L. M., Point Defects in Solids: General and Ionic Crystals; Springer Science & Business Media, 2013. 45. Gamble, F. T.; Bartram, R. H.; Young, C. G.; Gilliam, O. R.; Levy, P. W., Electron-Spin Resonances in Gamma-Ray-Irradiated Aluminum Oxide. Physical Review 1964, 134, A589-A595. 46. Joshi, N.; Garg, A., Energy Transfer in the Gamma Radiolytic Decomposition of Sodium and Potassium Nitrates Dispersed in Phosphate, Sulfate and Carbonate Matrices in Solid State. Radiation effects and defects in solids 1994, 132, 281-291. 47. La, S. Y.; Bartram, R. H.; Cox, R. T., The F+ Center in Reactor-Irradiated Aluminum Oxide. Journal of Physics and Chemistry of Solids 1973, 34, 1079-1086. 48. Kiiko, V. S.; Zabolotskaya, E. V.; Zolotukhina, L. V.; Frolov, N. M.; Dmitriev, I. A.; Makurin, Y. N., Paramagnetic Defects in Aluminum Oxide Nanopowders and Ceramics Based on These Powders. Glass and Ceramics 2001, 58, 111-114. 49. Ollier, N.; Rizza, G.; Boizot, B.; Petite, G., Effects of Temperature and Flux on Oxygen Bubble Formation in Li Borosilicate Glass under Electron Beam Irradiation. Journal of applied physics 2006, 99, 073511. 50. Kuruc, J., Paramagnetic Centers by X-Ray-Irradiation of Aluminium Hydroxide. Journal of Radioanalytical and Nuclear Chemistry 1991, 154, 61-72. 51. De Las Cuevas, C.; Miralles, L.; Pueyo, J. J., The Effect of Geological Parameters on Radiation Damage in Rock Salt: Application to Rock Salt Repositories. Nuclear technology 1996, 114, 325-336. 52. Shiyan, I. N.; Serikov, L. V.; Smekalina, T. V.; Vasiliev, A. A., Epr Studies of Aluminium Oxide Phase Compositions. Reaction Kinetics and Catalysis Letters 1990, 41, 291-294. 53. Blaginina, L.; Zatsepin, A.; Dmitriev, I., Paramagnetic Centers at Tricoordinated Oxygen in Beryllium Alumosilicate Glasses. 1987. 54. Steinike, U.; Barsova, L. I.; Jurik, T. K.; Kretchmar, U.; Hennig, H. P.; Bol'mann, U., Nature of Mechanically Induced Defects in Polycrystalline Hydrargillite and Al2o3-A1(Oh)3 Studied by Radiation Methods. Bulletin of the Academy of Sciences of the USSR, Division of chemical science 1990, 39, 1321-1324. 55. L. I. Barsova, T. K. Y., and V. I. Spitsyn, Formation of Vacancies in the Thermal Decomposition of Hydroxides of Alikaline-Earth Metals. Izvestiya Akademii Nauk SSSR, Seriya Khimicheskaya 1985, 12223-1227. 56. Barsova, L. I.; Yurik, T. K.; Spitsyn, V. I., Radiation Centers in Alkaline-Earth Hydroxides. Bulletin of the Academy of Sciences of the USSR, Division of chemical science 1984. 57. Spitsyn, V. I.; Yurik, T. K.; Barsova, L. I., Atomic Hydrogen In. Gamma. -Irradiated Hydroxides of Alkaline-Earth Elements. Journal Name: Bull. Acad. Sci. USSR, Div. Chem. Sci. (Engl. Transl.); (United States); Journal Volume: 31:4; Other
176
Information: Translated from Izv. Akad. Nauk SSSR; No. 4, 762-768(Apr 1982) 1982, Medium: X; Size: Pages: 672-677. 58. L.I.Barsova, T. K. Y., S. L. Orlov, and M. B. Zubareva, Radiolytic Conversions of Strontium and Barium Hydroxides and Their Crystal Hydrates. Khimiya Vysokikh Energii 1990, 24, 329-334. 59. Yurik, T. K., Ionova, G.V., Barsova, L.I., & Spitsyn, Esr Investigation of Hydrogen Atoms Stabilized in Γ-Irradiated Alkaline Earth Hydroxides. Radiation Effects 1988, 106, 87-98. . 60. Barsova, L. I.; Yurik, T. K.; Spitsyn, V. I., Radiation Centers in Alkaline-Earth Hydroxides. Journal Name: Bull. Acad. Sci. USSR, Div. Chem. Sci. (Engl. Transl.); (United States); Journal Volume: 35:5; Other Information: Translated from Izvestiya Akademii Nauk SSSR, Seriya Khimicheskaya; 35: No.5, 969-974(May 1986) 1986, Medium: X; Size: Pages: 879-883. 61. Symons, M. C., Electron Spin Resonance Studies of˙ Oh and˙ O–Radicals in Irradiated Ice. Journal of the Chemical Society, Faraday Transactions 1: Physical Chemistry in Condensed Phases. Journal of the Chemical Society, Faraday Transactions 1: Physical Chemistry in Condensed Phases 1982, 78, 1953-1959. 62. Marks, J.; Wenckebach, W. T.; Poulis, N. J., Properties of Electron-Irradiation-Produced O 2 - in Ca(Oh) 2. Journal of Physics C: Solid State Physics 1980, 13, 5481. 63. Praliaud, H.; Coluccia, S.; Deane, A.; Tench, A., Oxidising Properties of Mgo Formed by Thermal Decomposition of Mg (Oh) 2. Chemical Physics Letters 1979, 66, 44-47. 64. Vedrine, J. C.; Imelik, B.; Derouane, E. G., Influence of the Physical State of Three Different Aluminum Hydroxides on the Interaction between Trapped H Atom and Lattice Protons: An Epr and Endor Study. Journal of Magnetic Resonance (1969) 1974, 16, 95-109. 65. Box, H. C.; Budzinski, E. E.; Lilga, K. T.; Freund, H. G., Endor Study of X‐Irradiated Single Crystals of Ice. The Journal of Chemical Physics 1970, 53, 1059-1065. 66. Johnson, J. E.; Moulton, G. C., Esr Study of Ice Irradiated at 4.2 K, a Thermally Reversible Radical. The Journal of Chemical Physics 1978, 69, 3108-3111. 67. Scholz, G., & Stösser, R. , Atomic Hydrogen as Spin Probe in Thermally and Mechanically Activated Materials. Physical Chemistry Chemical Physics 2002, 4, 5448-5457. 68. LaVerne, J. A., H2 Formation from the Radiolysis of Liquid Water with Zirconia. The Journal of Physical Chemistry B 2005, 109, 5395-5397. 69. Jiang, N.; Spence, J. C., In Situ Eels Study of Dehydration of Al (Oh) 3 by Electron Beam Irradiation. Ultramicroscopy, 111, 860-864. 70. Jay A. LaVerne, a. L. T., H2 and Cl2 Production in the Radiolysis of Calcium and Magnesium Chlorides and Hydroxides. Journal of Physical Chemistry 2005, 109, 2861-2865. 71. Kloprogge, J. T.; Ruan, H. D.; Frost, R. L., Thermal Decomposition of Bauxite Minerals: Infrared Emission Spectroscopy of Gibbsite, Boehmite and Diaspore. Journal of materials science 2002, 37, 1121-1129. 72. Alphonse, P.; Courty, M., Structure and Thermal Behavior of Nanocrystalline Boehmite. Thermochimica Acta 2005, 425, 75-89. 73. Hasegawa, A. W. a. S., Relative Humidity-Temperature Relationships of Some Saturated Salt Solutions in the Temperature. Range 0 to 50c Journal of Research of the National Bureau of Standards 1954, Vol. 53, 19-26.

177
74. Greenspan, L., Humidity Fixed Points of Binary Saturated Aqueous Solutions. Journal of Research of the National Bureau of Standards - A 1977, 81A, 89-96 75. Haschke, J. M.; Ricketts, T. E., Adsorption of Water on Plutonium Dioxide. Journal of Alloys and Compounds 1997, 252, 148-156. 76. Sutto, T. E., One-Step Bulk Synthesis of Stable, near Unit-Cell Sized Oxide Nanoparticles and Nanoparticle Blends Using Ko2. Inorganic Chemistry, 53, 4570-4578. 77. Sutton, H. C., A Calibration of the Fricke Chemical Dosimeter. Physics in Medicine and Biology 1956, 1, 153. 78. Fricke, H. H., J. E, Attix, F. H., Roesch, W. C., Eds.; , In Radation Dosimetry, 2nd Ed. Academic Press: New York and London 1966, 2, 167. 79. Chatterjee, A.; Magee, J. L., Radiation Chemistry of Heavy-Particle Tracks. 2. Fricke Dosimeter System. The Journal of Physical Chemistry 1980, 84, 3537-3543. 80. Senvar, C., Chemical Dosimetry of Gamma Rays, Neutrons, and Accelerated Electrons. Communs. faculte sci. univ. Ankara 1960, 8. 81. Klassen, N.; Shortt, K.; Seuntjens, J.; Ross, C., Fricke Dosimetry: The Difference between G (Fe3+) for 60co-Rays and High-Energy X-Rays. Physics in medicine and biology 1999, 44, 1609. 82. Eduardo deAlmeida, C.; Ochoa, R.; de Lima, M. C.; David, M. G.; Pires, E. J.; Peixoto, J. G.; Salata, C.; Bernal, M. A. n., A Feasibility Study of Fricke Dosimetry as an Absorbed Dose to Water Standard for 192 Ir Hdr Sources. PloS one, 9, e115155. 83. Buxton, G. V.; Stuart, C. R., Re-Evaluation of the Thiocyanate Dosimeter for Pulse Radiolysis. Journal of the Chemical Society, Faraday Transactions 1995, 91, 279-281. 84. Bradshaw, W. W.; Cadena, D. G.; Crawford, G. W.; Spetzler, H. A. W. C. F. p. d. J., The Use of Alanine as a Solid Dosimeter. Radiation research 1962, 17, 11-21. 85. McLaughlin, W., Esr Dosimetry. Radiation Protection Dosimetry 1993, 47, 255-262. 86. Mierzwińska, G., Michalec, B., OGŁODEK, I., Petelenz, B., & Waligorski, M. P. R., Alanine/Epr Dosimetry as a Potential Tool for Quality Assurance in Proton Beam Radiotherapy. Romanian Reports in Physics, 66, 54-60. 87. Scherrer, P., Bestimmung Der Grösse Und Der Inneren Struktur Von Kolloidteilchen Mittels Röntgenstrahlen. Nachr. Ges. Wiss. Göttingen 1918, 26, 98-100. 88. Mierzwińska, G.; Michalec, B.; OGŁODEK, I.; Petelenz, B.; Waligorski, M., Alanine/Epr Dosimetry as a Potential Tool for Quality Assurance in Proton Beam Radiotherapy. Romanian Reports in Physics 2014, 66, 54-60. 89. Palmer, D. A., Bénézeth, P., Wesolowski, D. J., & Hilic, S. , Experimental Studies of the Solubilities of Aluminum Oxy-Hydroxy Phases to 300 C. 2001. 90. Panias, D.; Asimidis, P.; Paspaliaris, I., Solubility of Boehmite in Concentrated Sodium Hydroxide Solutions: Model Development and Assessment. Hydrometallurgy 2001, 59, 15-29. 91. Park, S. Y.; Kim, J. S.; Lee, J. B.; Esler, M. B.; Davis, R. S.; Wielgosz, R. I., A Redetermination of the Argon Content of Air for Buoyancy Corrections in Mass Standard Comparisons. Metrologia 2004, 41, 387. 92. A.Boumaza a, e., L.Favaro a, J.Le´dion b, G.Sattonnay a, J.B.Brubach c, P.Berthet d, A.M.Huntz a, P.Royc,a, R.Te´ tot a,, Transition Alumina Phases Induced by Heat Treatment of Boehmite: An X-Ray Diffraction and Infrared Spectroscopy Study. Journal of solid state chemistry 2009, 1171–1176.

178
93. Johnston, C. T., Wang, S. L., & Hem, S. L. , Measuring the Surface Area of Aluminum Hydroxide Adjuvant Journal of pharmaceutical sciences 2002, VOL. 91. 94. Ramesh, T. N., Polytypic Transformations of Aluminum Hydroxide: A Mechanistic Investigation. Particuology, 10, 359-364. 95. Lefevre, G. g.; Duc, M.; Lepeut, P.; Caplain, R.; Fédoroff, M., Hydration of γ-Alumina in Water and Its Effects on Surface Reactivity. Langmuir 2002, 18, 7530-7537. 96. Kolesova, V.; Ryskin, Y. I., Infrared Absorption Spectrum of Hydroargillite Al (Oh) 3. MEZHDUNARODNAYA KNIGA 39 DIMITROVA UL., 113095 MOSCOW, RUSSIA: 1959; Vol. 7, pp 261-263. 97. Freund, F., Infrarotspektren Von Mg (Oh) 2 Bei Erhöhten Temperaturen. Spectrochimica Acta Part A: Molecular Spectroscopy, 26, 195-205. 98. Fripiat, J. J.; Bosmans, H. J.; Rouxhet, P. G., Proton Mobility in Solids. I. Hydrogenic Vibration Modes and Proton Delocalization in Boehmite. The Journal of Physical Chemistry 1967, 71, 1097-1111. 99. Kiss, A.; Keresztury, G.; Farkas, L., Raman and Ir Spectra and Structure of Boehmite (Γ-Alooh). Evidence for the Recently Discarded D 17 2h Space Group. Spectrochimica Acta Part A: Molecular Spectroscopy 1980, 36, 653-658. 100. Boumaza, A.; Djelloul, A.; Guerrab, F., Specific Signatures of Α-Alumina Powders Prepared by Calcination of Boehmite or Gibbsite. Powder Technology 2010, 201, 177-180. 101. Gadzhieva, N. N., Oxidation and Accumulation of H2 in the Aluminum-Water System under the Radiation-Thermal Action. Journal of Applied Spectroscopy 2005, 72, 471-477. 102. Busing, W.; Levy, H. A., A Single Crystal Neutron Diffraction Study of Diaspore, Alo (Oh). Acta Crystallographica 1958, 11, 798-803. 103. Nakamoto, K., Infrared and Raman Spectra of Inorganic and Coordination Compounds. In Handbook of Vibrational Spectroscopy, John Wiley & Sons, Ltd: 2006. 104. Ruan, H. D.; Frost, R. L.; Kloprogge, J. T., Comparison of Raman Spectra in Characterizing Gibbsite, Bayerite, Diaspore and Boehmite. Journal of Raman Spectroscopy 2001, 32, 745-750. 105. Huang, E.; Li, A.; Xu, J.-a.; Chen, R.-J.; Yamanaka, T., High-Pressure Phase Transition in Al(Oh)3: Raman and X-Ray Observations. Geophysical Research Letters 1996, 23, 3083-3086. 106. Takamura, T.; Koezuka, J., Infra-Red Evidence of the Grinding Effect on Hydrargillite Single Crystals. 1965. 107. Kloprogge, J. T.; Duong, L. V.; Wood, B. J.; Frost, R. L., Xps Study of the Major Minerals in Bauxite: Gibbsite, Bayerite and (Pseudo-)Boehmite. Journal of Colloid and Interface Science 2006, 296, 572-576. 108. Rotole, J. A.; Sherwood, P. M. A., Gibbsite (Α-Al(Oh)3) by Xps. Surface Science Spectra 1998, 5, 25-31. 109. Rotole, J. A.; Sherwood, P. M. A., Nordstrandite (Al(Oh)3) by Xps. Surface Science Spectra 1998, 5, 32-38. 110. Rotole, J. A.; Sherwood, P. M. A., Bayerite (Β-Al(Oh)3) by Xps. Surface Science Spectra 1998, 5, 39-45. 111. Rotole, J. A.; Sherwood, P. M. A., Diaspore (Β-Alooh) by Xps. Surface Science Spectra 1998, 5, 46-52. 112. Rotole, J. A.; Sherwood, P. M. A., Boehmite (Γ-Alooh) by Xps. Surface Science Spectra 1998, 5, 53-59.

179
113. Hall, P. L., The Application of Electron Spin Resonance Spectroscopy to Studies of Clay Minerals: I. Isomorphous Substitutions and External Surface Properties. Clay Miner 1980, 15, 321-335. 114. Yves, B.; Bruno, D.; Sandrine, C.; Jean-Victor, Z., Electron Spin Resonance and Dilatometric Studies of Ancient Ceramics Applied to the Determination of Firing Temperature. Japanese Journal of Applied Physics 1998, 37, 4367. 115. Galamboš, M., Daňo, M., Rosskopfová, O., Šeršeň, F., Kufčáková, J., Adamcová, R., & Rajec, P., Effect of Gamma-Irradiation on Adsorption Properties of Slovak Bentonites. Journal of Radioanalytical and Nuclear Chemistry, 292, 481-492. 116. Brunauer, S.; Emmett, P. H.; Teller, E., Adsorption of Gases in Multimolecular Layers. Journal of the American Chemical Society 1938, 60, 309-319. 117. Brunauer S, E. P., Teller E. . 1938;60:309e19., Desorption of Gases in Multimolecular Layers. J Am Chem Soc 1938, 60, 309-319. 118. Frost, R. L.; Kloprogge, J. T.; Russell, S. C.; Szetu, J., Dehydroxylation of Aluminum (Oxo)Hydroxides Using Infrared Emission Spectroscopy. Part Ii: Boehmite. Applied Spectroscopy 1999, 53, 572-582. 119. Frost, R. L.; Kloprogge, J. T.; Russell, S. C.; Szetu, J., Dehydroxylation and the Vibrational Spectroscopy of Aluminum (Oxo)Hydroxides Using Infrared Emission Spectroscopy. Part Iii: Diaspore. Applied Spectroscopy 1999, 53, 829-835. 120. Frost, R. L.; Kloprogge, J. T.; Russell, S. C.; Szetu, J. L., Vibrational Spectroscopy and Dehydroxylation of Aluminum (Oxo)Hydroxides: Gibbsite. Applied Spectroscopy 1999, 53, 423-434. 121. Griscom, D. L., Diffusion of Radiolytic Molecular Hydrogen as a Mechanism for the Post‐Irradiation Buildup of Interface States in Sio2‐on‐Si Structures. Journal of Applied Physics 1985, 58, 2524-2533. 122. Chen, W., Optically Detected Magnetic Resonance of Defects in Semiconductors. In Epr of Free Radicals in Solids, Lund, A.; Shiotani, M., Eds. Springer US: 2003; Vol. 10, pp 601-625. 123. Janak, J. F., G Factor of the Two-Dimensional Interacting Electron Gas. Physical Review 1969, 178, 1416-1418. 124. Chen, W. M., Epr of Free Radicals in Solids Ii. Trends in Methods and Applications. Chapter: Optically Detected Magnetic Resonance of Defects in Semiconductors., 2nd ed.; Springer. 125. Leroy, G.; Sana, M.; Tinant, A., Étude Théorique Des Réactions D'abstraction D'hydrogène, Avec R, X≍ H, Ch3, Nh2, Oh Et F. Canadian journal of chemistry 1985, 63, 1447-1456. 126. LaVerne, J. A.; Tonnies, S. E., H2 Production in the Radiolysis of Aqueous Sio2 Suspensions and Slurries†. The Journal of Physical Chemistry B 2003, 107, 7277-7280. 127. Brodie-Linder, N., Le Caër, S., Alam, M. S., Renault, J. P., & Alba-Simionesco, C, H 2 Formation by Electron Irradiation of Sba-15 Materials and the Effect of Cuii Grafting. Physical Chemistry Chemical Physics 2010, 12, 14188-14195. 128. Tenchurina, A.; Sal’keeva, A., Radiolysis and Photolysis of Sodium Sulfate Crystalline Hydrate. Russian Journal of Physical Chemistry A 2016, 90, 688-690. 129. Agency, I. A. E. Spent Fuel Storage and Transport Cask Decontamination and Modification 1999.

180

181
8. Appendix
Appendix A: TN 12 casks
TN 12 casks are used to carry twelve fuel assemblies from the 900 MW (e) reactors while TN 13
casks are used to carry twelve spent fuel assemblies, from the 1300 and 1450 MW (e) stations.
The TN 12 and TN 13 casks are identical, except the length.129
TN 12 casks are used to carry twelve fuel assemblies from the 900 MW (e) reactors while TN 13
casks are used to carry twelve spent fuel assemblies, from the 1300 and 1450 MW (e) stations.
The TN 12 and TN 13 casks are identical, except the length.129 A description of the TN12 is
shown in Erreur ! Source du renvoi introuvable..
Figure 8.1. TN 12/2 cask for nuclear waste transportation (AREVA TN).
The TN12 is made of two parts:
- A body with a double closure system and two shock absorbers,
- A basket designed to receive 12 fuel assemblies.
The basket is made of modules with a neutron absorber material allowing also satisfactory heat
exchange conditions. Cask cavity and baskets are dried for seven hours between 150 and 200°C
under vacuum and they are tight sealed before transportation.
The internal basket designed specifically for a high decay heat load allows individual assemblies
with up to 6 kW and a total power of 50 kW (for the 12 fuel assemblies). In order to better
evacuate heat and improve pitting resistance,

182
Appendix B: EPR spectra of hydrated AlOOH and Al(OH)3
Figure 8.2. EPR spectra of electron irradiated AlOOH L, S and Al(OH)3 . RT indicated in the first line
significates irradiation and analyze at RT, 77K-77K significates irradiation and analyze at 77K and 77K-
RT significates irradiation at 77K and analyze at RT

183
Figure A 8.1. Evolution of H radicals and radiation induced defects as a function of the dose in electron
beam-irradiated AlOOH L.
Figure 8.3. Evolution of RID I and RID II as a function of the dose in electron beam-irradiated AlOOH L.
Purple, orange and pink represents 7, 15 and 30 kGy respectively.

184
Figure 8.4. Evolution radiation induced defects as a function of the dose in electron beam-irradiated
AlOOH S. At low doses (figure on the right) the EPR spectra is shown in order to compare it with that at
30 kGy.
Figure 8.5. Evolution of H radicals and radiation induced defects as a function of the dose in electron
beam-irradiated Al(OH)3.

185
Titre : Production de dihydrogène par irradiation d’hydroxyde et d’oxohydroxide
d’aluminium
Mots clés : Radiolyse, eau de structure, irradiation, hydroxide d’aluminium, défauts sous
irradiation
Résumé : Dans le cadre de l’entreposage et
du stockage des colis de déchets nucléaires
et du transport de combustibles usés, nous
nous sommes intéressés par l’étude de la
production d’hydrogène de deux produits de
corrosion de l’aluminium :
l’hydroxyde d’aluminium (Al(OH)3) et
l’oxyhydroxyde d’aluminium (AlO(OH)).
La production du dihydrogène par irradiation
de ces matériaux a été étudiée en fonction de
la taille et de la structure que ce soit à
température ambiante ou après recuit.
Afin d’avoir une meilleur compréhension
des mécanismes de production de ce gaz, les
défauts créés par irradiation ont été
caractérisés en utilisant la Résonnance
Paramagnétique Electronique (RPE).
Différentes sources d’irradiation ont été
utilisées comme le rayonnement Gamma, les
électrons accélérés et les ions lourds. Dans
un second temps, l’effet de l’hydratation de
surface des matériaux a été également étudié.
Enfin, l’effet de la présence d’impuretés sur
la production de H2 a été brièvement étudié.
Title : Molecular hydrogen production from irradiated aluminum hydroxide and
oxyhydroxide
Keywords : Radiolysis, structural water, irradiation, aluminum hydroxide, radiation induced
defects
Abstract: Molecular hydrogen production is
a critical issue for the current management of
nuclear wastes. One potential source of
hydrogen generation is the radiolysis of
hydrated mineral phases encountered in the
nuclear waste transportation and storage
casks. We chose to study aluminum
hydroxide (Al(OH)3) (Bayerite) and
oxyhydroxides (AlOOH) (Boehmite) as
model compounds. The determination of
molecular hydrogen production was
evaluated with respect to structure and
particle size at room temperature and after
annealing.
In order to have a better understanding of the
mechanisms and to identify the precursors of
molecular hydrogen, we studied the
irradiation defects and their stabilities using
Electron Paramagnetic Resonance (EPR).
The effect of adsorbed water and structural
water on the molecular hydrogen production
was studied. Different radiation sources were
used such as Gamma radiation, electron
beam radiations and heavy ions. In the last
part, preliminary results related to the impact
of impurities on hydrogen production are
presented.