hydrogen bonding interactions and miscibility between phenolic resin and octa(acetoxystyryl)...
TRANSCRIPT
Hydrogen Bonding Interactions and Miscibility BetweenPhenolic Resin and Octa(acetoxystyryl) PolyhedralOligomeric Silsesquioxane (AS-POSS) Nanocomposites
SHIAO-WEI KUO,1 HAN-CHING LIN,1 WU-JANG HUANG,2 CHIH-FENG HUANG,1 FENG-CHIH CHANG1
1Institute of Applied Chemistry, National Chiao Tung University, Hsin Chu, Taiwan, Republic of China
2Department of Environmental Science and Engineering, National Ping-Tung University of Science and Technology,Ping-Tun, Taiwan, Republic of China
Received 15 June 2005; accepted 20 November 2005DOI: 10.1002/polb.20731Published online in Wiley InterScience (www.interscience.wiley.com).
ABSTRACT: We have synthesized a polyhedral oligomeric silisesquioxane (POSS)derivative containing eight acetoxystyryl functional groups [octa(acetoxystyryl)octasil-sesquioxane (AS-POSS)] and then blended it with phenolic resin to form nanocompo-sites stabilized through hydrogen bonding interactions between the phenolic resin’shydroxyl group and the AS-POSS derivative’s carbonyl and siloxane groups. One-and two-dimensional infrared spectroscopy analyses provided positive evidence forthese types of hydrogen bonding interactions. In addition, we calculated the interas-sociation equilibrium constant, based on the Painter–Coleman association model(PCAM), between phenolic resin and POSS indirectly from the fraction of hydrogen-bonded carbonyl groups; quantitative analyses indicate that the hydroxyl–siloxaneinterassociation from the PCAM is entirely consistent with the classical Coggesthalland Saier (C and S) methodology. From a thermal analysis, we observed that the mis-cibility between phenolic and AS-POSS occurs at a relatively low AS-POSS content,which characterizes this mixture as a polymer nanocomposite system. VVC 2006 Wiley
Periodicals, Inc. J Polym Sci Part B: Polym Phys 44: 673–686, 2006
Keywords: 2D-FTIR; hydrogen bonding; nanocomposite; POSS
INTRODUCTION
Incorporating nanoparticles into polymer matri-ces to enhance their properties has attractedenormous interest in recent years because of thepotential to create candidate materials thatbridge the gap between polymers and nanopar-ticles. In particular, the use of polyhedral oligo-meric silsesquioxanes (POSS) derivatives is onesuitable approach because they embody an inor-ganic–organic hybrid architecture comprising a
well-defined inorganic framework composed ofsilicon and oxygen (SiO1.5)x and organic substitu-ents containing nonreactive or reactive function-alities. By designing the functionality of theorganic substituents, it is possible to create octa-functional or monofunctional macromonomers tofit a desired application. Therefore, these nano-structured compounds can be incorporated readilythrough copolymerization into such polymers aspolysiloxane,1 poly(methyl methylacrylate),2,3 poly(styrene),4 epoxy,5 polyurethane,6 polyimide,7 andpolynorborbornene.8
The physical properties of polymer/POSS nano-composites are strongly influenced by the misci-bility between the host polymer and the POSSmoiety. Random copolymerization of the organic
Correspondence to: S.-W. Kuo (E-mail: [email protected])
Journal of Polymer Science: Part B: Polymer Physics, Vol. 44, 673–686 (2006)VVC 2006 Wiley Periodicals, Inc.
673

functional groups of the POSS derivative is oneapproach to improving the miscibility. Therefore,in a previous study,9 we synthesized a seriesof poly(vinylphenol-co-vinylpyrrolidone-co-POSS)(PVPh-co-PVP-co-POSS) copolymers that exhibita significant glass-transition temperature in-crease relative to the corresponding nonPOSSPVPh-co-PVP copolymers because of the stronghydrogen bonds that exist between the PVPh andPOSS units. The synthesis of a random copolymeris generally more complicated and time-consum-ing than is preparing a physical blend; thus, poly-mer blending is seen as a more convenient methodof preparing polymer/POSS nanocomposites. Be-cause the combined entropy contribution to thefree energy of mixing two polymers is negligi-bly small, specific intermolecular interactionsare generally required to enhance the miscibilityof polymer blends. To improve the properties andmiscibility of hybrid materials, it is necessary toensure that favorable, specific interactions existbetween these components, such as hydrogenbonding,10 dipole–dipole, and acid–base interac-tions.
In a previous study,11 we demonstrated thatsimple blending of POSS derivatives containingnonreactive or inert diluent functional groups (inthat case, octaisobutyl-POSS) with phenolic resinprovide unsatisfactory results because of poormiscibility. The interassociation equilibrium con-stant between the phenolic hydroxyl group andthe octaisobutyl-POSS siloxane group (38.6) islower than the self-association equilibrium con-stant of pure phenolic (52.3), based on the Painter–Coleman association model10 (PCAM). This resultindicates that this POSS derivative tends to beonly partially miscible with phenolic in the phe-nolic/POSS hybrid because of the poor degree ofinteraction between the phenolic resin and theoctaisobutyl-POSS. Functionalization of POSSsuch that it displays pendent hydrogen-bond-acceptor groups is expected to improve the misci-bility with phenolic resin. Functionalization ofQ8M8
H [HSiMe2OSiO1.5]8 can be achieved byhydrosilylation of its Si��H groups onto acetoxys-tyrene in the presence of a platinum catalyst toform AS-POSS. Previously, we used infrared andsolid-state NMR spectroscopy to thoroughly inves-tigate the hydrogen bonding interactions betweenthe carbonyl groups of poly(acetoxystyrene) (PAS)and the hydroxyl groups of phenolic resin.12 Wefound that the interassociation equilibrium con-stant for the phenolic/PAS blend (64.6) is higherthan the self-association equilibrium constant of
pure phenolic (52.3), which implies that the ten-dency for hydrogen bonding between the phenolicresin and PAS dominates over the self-association(intramolecular hydrogen bonding) of the phenolicresin in the mixture.
Observing the carbonyl, hydroxyl, and siloxanevibrations by infrared (FTIR) spectroscopy is anexcellent tool for detecting intermolecular poly-meric interactions.13 This tool can be used to studythe mechanism—both qualitatively and quantita-tively—of interpolymer miscibility through theformation of different types of hydrogen bonds. Inaddition, the generalized two-dimensional (2D) IRcorrelation spectroscopy 14–19 has been appliedwidely in polymer science in recent years. In 2DIR, a spectrum is obtained as a function of twoindependent wavenumber axes, and peaks locatedon the spectral plane. This novel method monitorsspectral fluctuations as a function of time, temper-ature, pressure, and composition and allows thespecific interactions that exist between polymerchains to be identified. 2D IR correlation spectro-scopy can identify different intra- and intermolecu-lar interacting sites through the monitoring ofselected bands from the one-dimensional vibrationspectrum. In this study, we used generalized 2D IRcorrelation spectroscopy to explore the hydrogenbonding interactions present in blends of AS-POSSand phenolic resin.
The interassociation equilibrium constant be-tween the phenolic hydroxyl groups and thePOSS siloxane groups cannot be quantifieddirectly through IR spectroscopic analysis in thisbinary blend because no carbonyl groups areavailable to measure the fraction of groups thatare hydrogen bonded. The siloxane stretchingmode near 1100–1200 cm–1, which presents sig-nals for both the free and hydrogen-bonded silox-ane absorptions, is a highly coupled mode that isconformationally sensitive but cannot be decom-posed readily into two peaks. In a previousstudy,11 we calculated the interassociation equili-brium constant (KA) between the hydroxyl groupsof phenolic resin and the siloxane group of octai-sobutyl-POSS by using the classical Coggesthalland Saier (C and S)20 methodology. The interasso-ciation equilibrium constant obtained from lowmolecular weight compounds, however, is notexactly the same as that calculated for a true poly-mer blend because intramolecular screening andfunctional group accessibility affect the miscibilityof a polymer blend.21 Fortunately, in our previousstudy,11 octaisobutyl-POSS was the low-molecular-weight compound and, thus, this calculation can be
674 KUO ET AL.

considered to provide the true interassociation equi-librium constant for the interactions between thephenolic hydroxyl groups and the POSS siloxanegroups. To recheck the interassociation equilibriumconstant between the phenolic hydroxyl groups andthe POSS siloxane groups in this present study, wedetermined the value of KA indirectly from a least-squares fitting procedure of the experimental frac-tion of hydrogen-bonded carbonyl groups of AS-POSS in this binary blend. We have found a goodcorrelation between these two methods for deter-mining the interassociation equilibrium constant ofthe hydroxyl–siloxane interactions.
EXPERIMENTAL
Materials
The phenolic used in this study was synthesizedthrough a condensation reaction with sulfuricacid to give average weights of Mn ¼ 500 and Mw
¼ 1200. Q8M8H was purchased from Hybrid Plas-
tics Co. Platinum divinyltetramethyldisiloxanecomplex, Pt(dvs), and acetoxystyrene were ob-tained from Aldrich Chemical Co. Inc. Octa(ace-toxystyryl)octasilsesquioxane (AS-POSS) was syn-thesized according to the following method.
Synthesis of Octa(acetoxystyryl)octasilsesquioxane(AS-POSS)
Q8M8H (2.00 g, 1.96 mmol) was dissolved in tol-
uene (20 mL) in a 100-mL Schlenk flask, equippedwith a reflux condenser and a magnetic stirrer,and then 4-acetoxystyrene (3.2 g, 19.6 mmol) wasadded. Pt(dvs) (2 mM solution, 0.2 mL) was addedthrough a syringe. The reaction mixture washeated to 80 8C under nitrogen. The reaction wascomplete within 4 h. The toluene was evaporatedunder reduced pressure, and the residue wasdried in a vacuum oven at 80 8C for 24 h to giveAS-POSS (3.17 g, 93%). AS-POSS is a colorless,viscous liquid that is soluble in THF, CHCl3, andacetone. The chemical structure and scheme forthe synthesis of AS-POSS are shown here:
Blend Preparation
Blends of phenolic/AS-POSS of various composi-tions were prepared by solution blending. A THFsolution containing 5 wt % of the mixture wasstirred for 6–8 h and then the solvent was evapo-rated slowly at room temperature over 1 day. Toensure total elimination of solvent, the powder ofthe blend obtained was dried in a vacuum oven at60 8C for 2 days.
Characterization
Nuclear Magnetic Resonance (1H NMR)Spectroscopy
1H NMR spectra were recorded on a VarianUnity Inova 500 FT NMR spectrometer operat-ing at 500 MHz, using CDCl3 as the solvent;chemical shifts are reported in parts per million(ppm).
PHENOLIC RESIN AND AS-POSS NANOCOMPOSITES 675

Fourier Transform Infrared (FTIR) Spectroscopy
Infrared spectroscopic measurements were re-corded on a Nicolet Avatar 320 FTIR spectropho-tometer; 32 scans were collected with a spectral res-olution of 1 cm–1. Infrared spectra of polymer blendfilms were obtained through the conventional NaCldisk method. All sample preparations were per-formed under a continuous flow of nitrogen to mini-mize sample oxidation or degradation. Sampleswere prepared by casting a THF solution directlyonto a NaCl disk, which was dried under conditionssimilar to those used in the bulk preparation.
2D IR correlation analysis was conductedusing Vector 3D software (Bruker InstrumentCo.). All of the spectra were normalized beforebeing subjected to 2D correlation analyses. All ofthe spectra subjected to the 2D correlation analy-ses were normalized and classified into two sets:A and B. The spectra in set A are, in order, purephenolic, phenolic/AS-POSS ¼ 5/95, phenolic/AS-POSS ¼ 10/90, and phenoic/AS-POSS ¼ 20/80.Those in set B are, in order, phenolic/AS-POSS¼ 30/70, phenolic/AS-POSS ¼ 40/60, phenolic/AS-POSS ¼ 60/40, and pure AS-POSS. Shaded areasindicate regions of negative intensity of auto-peaks or crosspeaks in the 2D correlation spec-trum; unshaded areas indicate positive-intensityregions. Synchronous 2D spectra were used tostudy the specific interactions between phenolicand AS-POSS in the blends.
Differential Scanning Calorimetry (DSC)
Thermal analysis was performed using a DuPontDSC-9000 differential scanning calorimeter at ascan rate of 20 8C/min over a temperature rangefrom �50 to 150 8C. Temperature and energy cali-brations were undertaken using indium. Approxi-mately 5–10 mg of each blend was weighed andsealed in an aluminum pan. This sample wasquickly cooled to �50 8C from the melt of the firstscan and then it was scanned between �50 and150 8C at 20 8C/min. The glass-transition temper-ature was obtained at the midpoint of the specificheat increment.
RESULTS AND DISCUSSION
AS-POSS Analyses
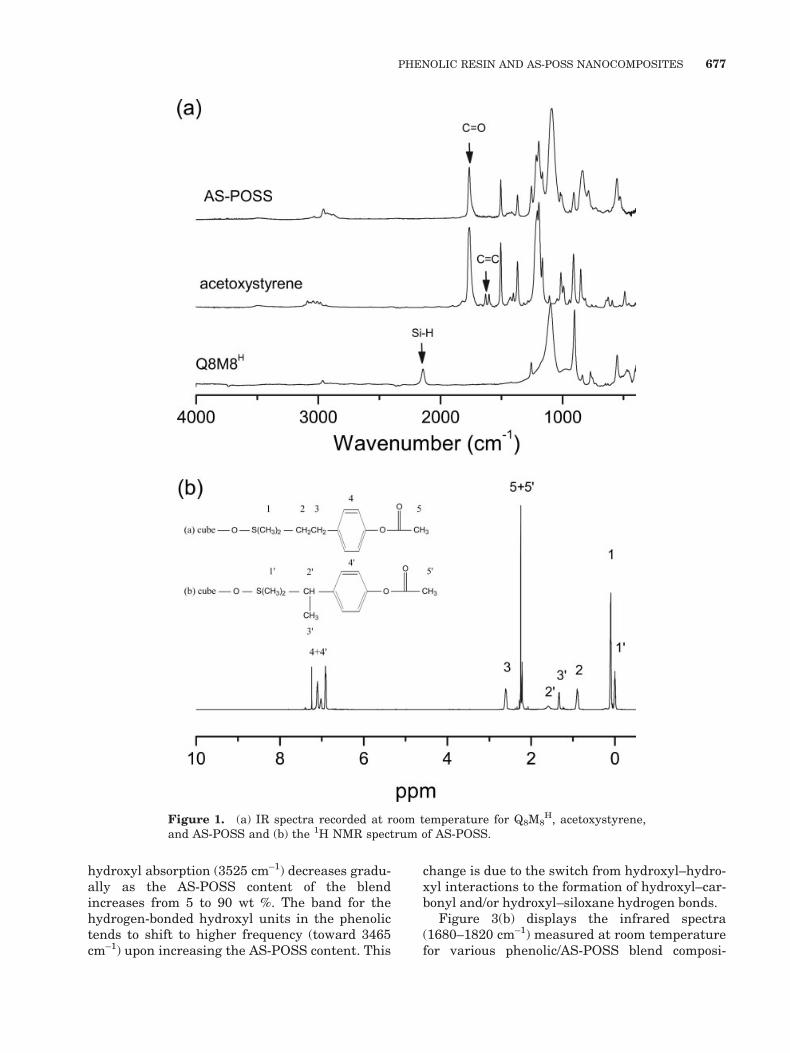
Figure 1(a) presents the FTIR spectra of Q8M8H,
acetoxystyrene, and the final hydrosilylation prod-uct, AS-POSS. The strong absorption peak at 1100
cm–1 for both Q8M8H and AS-POSS represents the
vibrations of the siloxane Si��O��Si groups and isa general feature of POSS derivatives. The charac-teristic stretching vibrations of the vinyl(ArCH¼¼CH2) and Si��H groups appear as peaksat 1650 and 2200 cm–1, respectively. In AS-POSS,these peaks have disappeared completely, indicat-ing that complete reaction was achieved. Further-more, the peak for the carbonyl groups of the ace-toxystyrene (1765 cm–1) remained in AS-POSS,which provides evidence for the successful attach-ment of the acetoxystyrene units to the POSS core.Figure 1(b) displays the corresponding 1H NMRspectra of AS-POSS. Clearly, the peaks for the vinyl(ca. 5.8 ppm) and Si��H protons (4.7 ppm) have dis-appeared in the spectrum of AC-POSS, which sup-ports the complete reaction. The spectrum in Fig-ure 1(b) indicates that the vinyl groups of acetoxys-tyrene underwent hydrosilylation of the Si��Hbonds of Q8M8
H in both a and b configurations,which is a mixture of these two orientation exists.From the integrated areas of the two types ofmethyl groups attached to the Si atoms, we esti-mate that a-carbon atom attachment was threetimes as prevalent as b-carbon atom attachment.
1D IR Spectral Analyses of Phenolic/AS-POSSNanocomposites
In a previous study,11 we used 1D and 2D FTIRspectra to discuss in detail the hydrogen bondinginteractions that exist between the phenolichydroxyl groups and the POSS siloxane groups.In addition, we have also studied22 the weak spe-cific hydrogen bonding interactions between thecarbonyl groups of PAS and the methylene unitsof PEO. In this study, we synthesized an acetox-ystyrene (AS)-grafted POSS (AS-POSS) to inves-tigate the specific interactions between phenolicand AS-POSS. Figure 2 displays infrared spectraof phenolic/AS-POSS blends in different composi-tions and Table 1 lists detailed peak assignmentsfor phenolic and AS-POSS.
Figure 3(a) presents scaled infrared spectra(2700–4000 cm–1) recorded at room temperaturefrom pure phenolic and various phenolic/AS-POSS nanocomposites. The pure phenolic poly-mer exhibits two bands in the hydroxyl stretchingregion of the infrared spectrum. We attributedthe very broadband centered at 3350 cm–1 to thewide distribution of hydrogen-bonded hydroxylgroups, while a narrower shoulder band at 3525 cm–1
represents the free hydroxyl groups. Figure 3(a)indicates clearly that the intensity of the free
676 KUO ET AL.
hydroxyl absorption (3525 cm–1) decreases gradu-ally as the AS-POSS content of the blendincreases from 5 to 90 wt %. The band for thehydrogen-bonded hydroxyl units in the phenolictends to shift to higher frequency (toward 3465cm–1) upon increasing the AS-POSS content. This
change is due to the switch from hydroxyl–hydro-xyl interactions to the formation of hydroxyl–car-bonyl and/or hydroxyl–siloxane hydrogen bonds.
Figure 3(b) displays the infrared spectra(1680–1820 cm–1) measured at room temperaturefor various phenolic/AS-POSS blend composi-
Figure 1. (a) IR spectra recorded at room temperature for Q8M8H, acetoxystyrene,
and AS-POSS and (b) the 1H NMR spectrum of AS-POSS.
PHENOLIC RESIN AND AS-POSS NANOCOMPOSITES 677
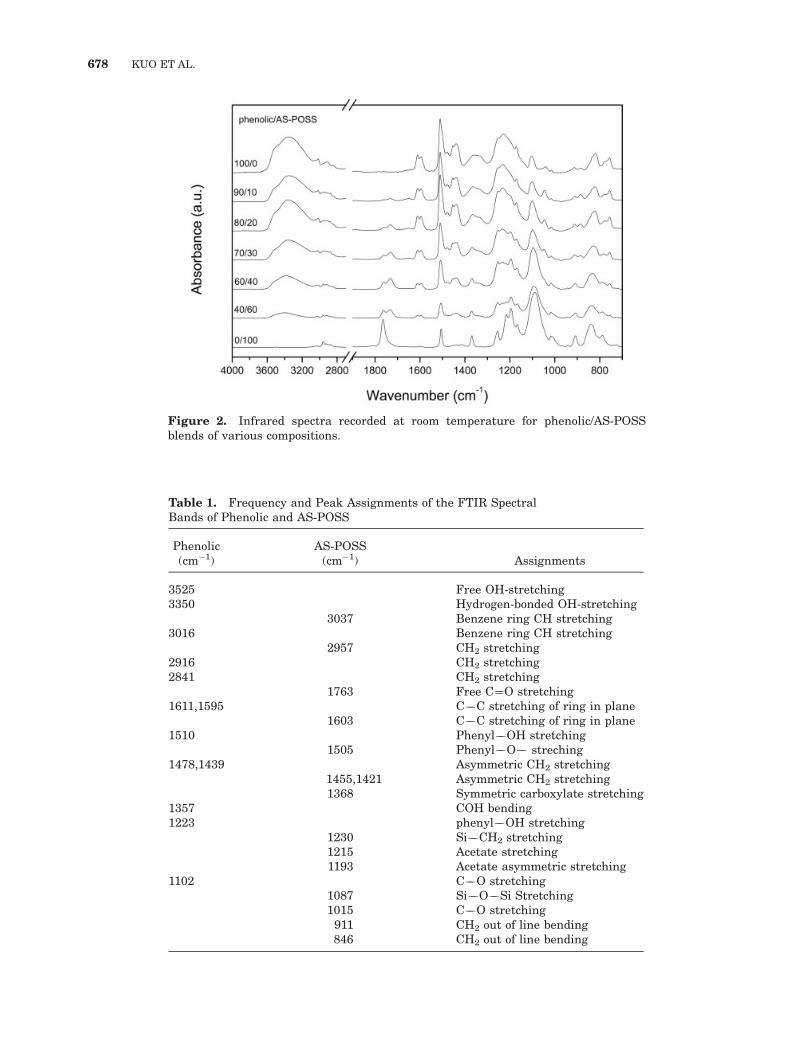
Figure 2. Infrared spectra recorded at room temperature for phenolic/AS-POSSblends of various compositions.
Table 1. Frequency and Peak Assignments of the FTIR SpectralBands of Phenolic and AS-POSS
Phenolic(cm�1)
AS-POSS(cm�1) Assignments
3525 Free OH-stretching3350 Hydrogen-bonded OH-stretching
3037 Benzene ring CH stretching3016 Benzene ring CH stretching
2957 CH2 stretching2916 CH2 stretching2841 CH2 stretching
1763 Free C¼¼O stretching1611,1595 C��C stretching of ring in plane
1603 C��C stretching of ring in plane1510 Phenyl��OH stretching
1505 Phenyl��O�� streching1478,1439 Asymmetric CH2 stretching
1455,1421 Asymmetric CH2 stretching1368 Symmetric carboxylate stretching
1357 COH bending1223 phenyl��OH stretching
1230 Si��CH2 stretching1215 Acetate stretching1193 Acetate asymmetric stretching
1102 C��O stretching1087 Si��O��Si Stretching1015 C��O stretching911 CH2 out of line bending846 CH2 out of line bending
678 KUO ET AL.
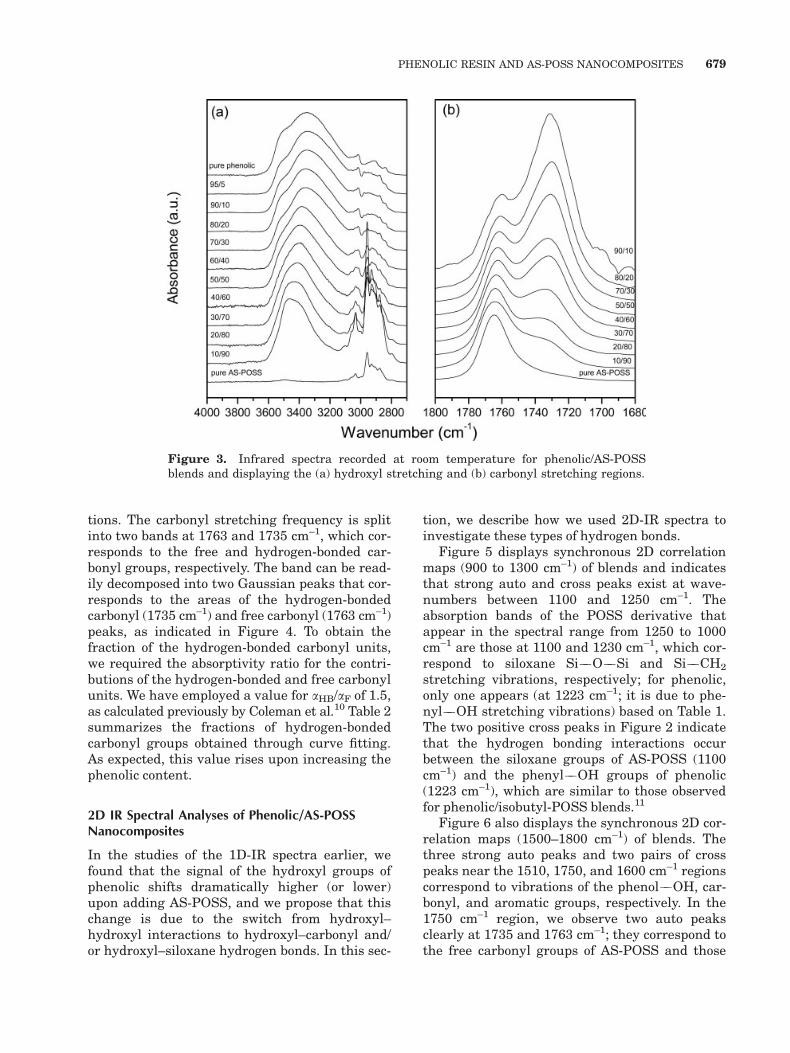
tions. The carbonyl stretching frequency is splitinto two bands at 1763 and 1735 cm–1, which cor-responds to the free and hydrogen-bonded car-bonyl groups, respectively. The band can be read-ily decomposed into two Gaussian peaks that cor-responds to the areas of the hydrogen-bondedcarbonyl (1735 cm–1) and free carbonyl (1763 cm–1)peaks, as indicated in Figure 4. To obtain thefraction of the hydrogen-bonded carbonyl units,we required the absorptivity ratio for the contri-butions of the hydrogen-bonded and free carbonylunits. We have employed a value for aHB/aF of 1.5,as calculated previously by Coleman et al.10 Table 2summarizes the fractions of hydrogen-bondedcarbonyl groups obtained through curve fitting.As expected, this value rises upon increasing thephenolic content.
2D IR Spectral Analyses of Phenolic/AS-POSSNanocomposites
In the studies of the 1D-IR spectra earlier, wefound that the signal of the hydroxyl groups ofphenolic shifts dramatically higher (or lower)upon adding AS-POSS, and we propose that thischange is due to the switch from hydroxyl–hydroxyl interactions to hydroxyl–carbonyl and/or hydroxyl–siloxane hydrogen bonds. In this sec-
tion, we describe how we used 2D-IR spectra toinvestigate these types of hydrogen bonds.
Figure 5 displays synchronous 2D correlationmaps (900 to 1300 cm–1) of blends and indicatesthat strong auto and cross peaks exist at wave-numbers between 1100 and 1250 cm–1. Theabsorption bands of the POSS derivative thatappear in the spectral range from 1250 to 1000cm–1 are those at 1100 and 1230 cm–1, which cor-respond to siloxane Si��O��Si and Si��CH2
stretching vibrations, respectively; for phenolic,only one appears (at 1223 cm–1; it is due to phe-nyl��OH stretching vibrations) based on Table 1.The two positive cross peaks in Figure 2 indicatethat the hydrogen bonding interactions occurbetween the siloxane groups of AS-POSS (1100cm–1) and the phenyl��OH groups of phenolic(1223 cm–1), which are similar to those observedfor phenolic/isobutyl-POSS blends.11
Figure 6 also displays the synchronous 2D cor-relation maps (1500–1800 cm–1) of blends. Thethree strong auto peaks and two pairs of crosspeaks near the 1510, 1750, and 1600 cm–1 regionscorrespond to vibrations of the phenol��OH, car-bonyl, and aromatic groups, respectively. In the1750 cm–1 region, we observe two auto peaksclearly at 1735 and 1763 cm–1; they correspond tothe free carbonyl groups of AS-POSS and those
Figure 3. Infrared spectra recorded at room temperature for phenolic/AS-POSSblends and displaying the (a) hydroxyl stretching and (b) carbonyl stretching regions.
PHENOLIC RESIN AND AS-POSS NANOCOMPOSITES 679

that are hydrogen bonded to the phenolic hy-
droxyl groups, respectively. In the 1600 cm–1
region, we observe two auto-peaks at 1590 and
1610 cm–1 that correspond to the phenyl groups
in both phenolic and AS-POSS. Figure 6 indicates
clearly that hydrogen bonding interactions do
indeed exist between the carbonyl groups of AS-
POSS (1763 cm–1) and the phenyl��OH groups of
the phenolic resin (1510 cm–1).
Hydroxyl–Siloxane Inter-Association EquilibriumConstant Determined through PCAM Analysis
According to the PCAM, the interassociationequilibrium constant between a noncarbonylgroup component and a hydrogen bond-donatingcomponent can be calculated using the classicalCoggesthall and Saier method.20 To recheck theinterassociation equilibrium constant betweenthe phenolic hydroxyl groups and the POSS silox-
Figure 4. Deconstructed models of the carbonyl stretching bands [in Fig. 3(b)] withrespect to the weight percentages of the phenolic/AS-POSS blends at various compositions.
680 KUO ET AL.

ane groups in this present study, we determinedthe value of KA indirectly from a least-squares fit-ting procedure of the experimental fraction ofhydrogen-bonded carbonyl groups of AS-POSS inthis binary blend. Figure 7 displays plots of theexperimental data and theoretically predicted
curves as a function of the composition at roomtemperature. The results demonstrate thatPCAM has the ability to predict the degree ofhydrogen bonding on the carbonyl group. Figure7 indicates that the experimental values are gen-erally lower than the predicted values when
Figure 5. The synchronous 2D correlation map of set A in the 900–1300 cm–1
region. (The y-axis is wavenumber (cm�1)). [Color figure can be viewed in the onlineissue, which is available at www.interscience.wiley.com.]
Table 2. Curve Fitting of the Area Fractions of the Carbonyl Stretching Bands in the FTIRSpectra of Phenolic/AS-Poss Blends Recorded at Room Temperature
Phenolic/AS-POSS(Wt Ratio)
Free C¼¼O H-Bonding C¼¼O
fbat (cm�1) W1/2 (cm�1) Af (%) t (cm�1) W1/2 (cm�1) Ab (%)
0/100 1763 23 100 – – – –10/90 1765 18 52.6 1739 30 47.4 0.37520/80 1765 17 41.5 1737 28 58.5 0.48430/70 1764 17 36.1 1736 28 63.9 0.54140/60 1764 16 32.6 1734 26 67.4 0.58050/50 1763 17 29.9 1734 26 70.1 0.61070/30 1763 17 25.6 1732 26 74.4 0.66080/20 1762 18 23.3 1731 25 76.7 0.68890/10 1762 18 22.1 1731 25 77.9 0.701
a fb, fraction of hydrogen bonding interaction.t, wavenumber; W1/2, half width.
PHENOLIC RESIN AND AS-POSS NANOCOMPOSITES 681

using the value of KA of 64.6 obtained from phe-
nolic/PAS blends. This result also indicates that
the hydroxyl groups of phenolic not only interact
with the carbonyl groups of the acetoxystyrene
units but also with the siloxane groups of the
POSS core, which is consistent with our results
from a previous study.11 In other words, the AS
carbonyl groups compete with the siloxane
groups of the POSS core in forming hydrogen
bonds with the hydroxyl groups of the phenolic
resin. We employed a numerical method to deter-
mine the value of KA of the phenolic/AS-POSS
blend, according to the PCAM, based on the frac-
tion of hydrogen-bonded carbonyl groups. The
approximate equations10 are as follows:
�B ¼ �B1�2 1þ KA�A1
rA
� �ð1Þ
�A ¼ �A1 1þ KA�B1�1½ � ð2Þ
where
�1 ¼8>>:1� K2
KB
9>>;þ K2
KB
8>>: 1
ð1�KB�B1Þ9>>; ð3Þ
�2 ¼8>>:1� K2
KB
9>>;þ K2
KB
8>>: 1
ð1� KB�B1Þ29>>; ð4Þ
and /A and /B denote the volume fractions of thenonself-associated species A (AS-POSS) and theself-associating species B (phenolic), respectively;/A1 and /B1 are the corresponding volume frac-tions of the isolated AS-POSS and phenolic seg-ments, respectively; r is the ratio of molar vol-ume, VA/VB. The self-association equilibrium con-stants, KB and K2, describe the formation ofmultimers and dimers, respectively. Finally, KA isthe equilibrium constant describing the associa-tion of A with B. The values of KB and K2 of purephenolic at 25 8C are 23.3 and 52.3, respectively.11
To calculate the values of the interassociationconstants KA, we used a least-squares methodthat we had described previously.12 Table 3 listsall of the parameters required by the Painter–
Figure 6. The synchronous 2D correlation map of set A in the 1500–1800 cm–1
region. (The y-axis is wavenumber (cm�1)). [Color figure can be viewed in the onlineissue, which is available at www.interscience.wiley.com.]
682 KUO ET AL.

Coleman association model to estimate the ther-modynamic properties for this phenolic/AS-POSSblend. We obtained an interassociation equili-brium constant of 26.0 for the phenolic/AS-POSSblend. It is difficult to exactly separate the seg-ment of AS and POSS because of the chemicalbond between these two segments, and so weassume that the molar volume of AS and POSSsegment is the same (ca. 1000 mL/mol). The valueof KA, however, for the phenolic/PAS blend is64.6, which implies that the value of KA betweenthe hydroxyl group of phenolic and the siloxanegroup of POSS is equal to 38.6 (i.e. 64.6 � 26.0¼ 38.6), which is entirely consistent with thevalue reported previously based on classical Cog-geshall and Saier (C and S) methodology. There-fore, there is a good correlation between thesetwo different methods when determining the val-ues of the interassociation equilibrium constantsfor hydroxyl–siloxane interactions.
Thermal Analyses
In general, DSC analysis is one of the most con-venient methods for determining the miscibilityof blend systems. DSC can determine whetherone or two values exist for Tg: a single value of Tg
is the most conventionally used criterion for
establishing the miscibility of polymer blends; animmiscible polymer blend exhibits more than onevalue of Tg. A single compositionally dependentglass transition indicates full miscibility withdimensions of the order of 20–40 nm. The misci-bilities of most polymer/nanoparticle blend sys-tems have not been studied using DSC analyses,however, because most of these nanoparticles
Figure 7. Fraction of hydrogen-bonded carbonyl groups plotted with respect to thecomposition of the blend: (n) FT-IR spectroscopic data, (–) theoretical values fromphenolic/PAS blends (KA ¼ 64.6), and (�) theoretical values from phenolic/AS-POSSblends (KA ¼ 26.0) calculated at 25 8C.
Table 3. Self- and Inter-Association EquilibriumConstants and Other Thermodynamic Parameters ofPhenolic/AS-Poss Blends at 25 8C
Polymer V Mw
Equilibrium Constant
K2 KB KA
Phenolica 84 105 23.3 52.3PASb 128.6 162.2 64.68-IsobutylPOSSc
778.6 872.2 38.6
AS-POSS 2058.6 2314.6 26.0
a reference 11.b reference 12.c reference 11.V, molar volume (ml/mol); Mw, molecular weight (g/mol);
K2, dimmer self-association equilibrium constant; KB, multi-mer self-association equilibrium constant; KA, inter-associa-tion equilibrium constant.
PHENOLIC RESIN AND AS-POSS NANOCOMPOSITES 683
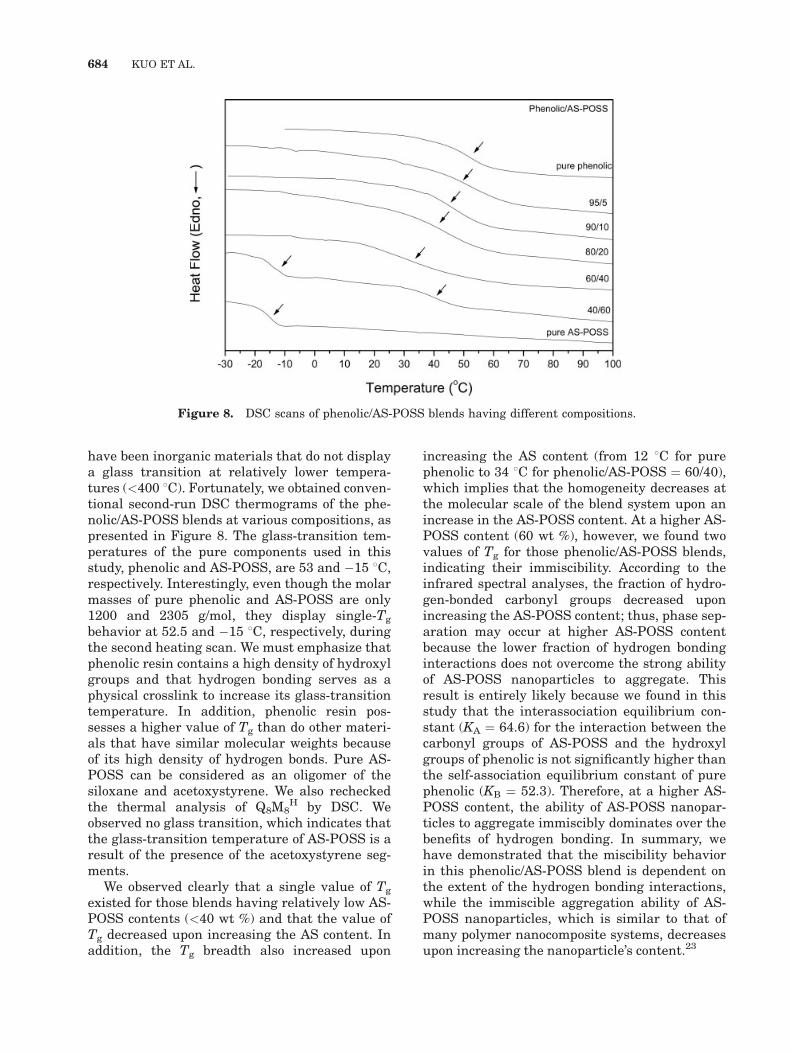
have been inorganic materials that do not displaya glass transition at relatively lower tempera-tures (<400 8C). Fortunately, we obtained conven-tional second-run DSC thermograms of the phe-nolic/AS-POSS blends at various compositions, aspresented in Figure 8. The glass-transition tem-peratures of the pure components used in thisstudy, phenolic and AS-POSS, are 53 and �15 8C,respectively. Interestingly, even though the molarmasses of pure phenolic and AS-POSS are only1200 and 2305 g/mol, they display single-Tg
behavior at 52.5 and �15 8C, respectively, duringthe second heating scan. We must emphasize thatphenolic resin contains a high density of hydroxylgroups and that hydrogen bonding serves as aphysical crosslink to increase its glass-transitiontemperature. In addition, phenolic resin pos-sesses a higher value of Tg than do other materi-als that have similar molecular weights becauseof its high density of hydrogen bonds. Pure AS-POSS can be considered as an oligomer of thesiloxane and acetoxystyrene. We also recheckedthe thermal analysis of Q8M8
H by DSC. Weobserved no glass transition, which indicates thatthe glass-transition temperature of AS-POSS is aresult of the presence of the acetoxystyrene seg-ments.
We observed clearly that a single value of Tg
existed for those blends having relatively low AS-POSS contents (<40 wt %) and that the value ofTg decreased upon increasing the AS content. Inaddition, the Tg breadth also increased upon
increasing the AS content (from 12 8C for purephenolic to 34 8C for phenolic/AS-POSS ¼ 60/40),which implies that the homogeneity decreases atthe molecular scale of the blend system upon anincrease in the AS-POSS content. At a higher AS-POSS content (60 wt %), however, we found twovalues of Tg for those phenolic/AS-POSS blends,indicating their immiscibility. According to theinfrared spectral analyses, the fraction of hydro-gen-bonded carbonyl groups decreased uponincreasing the AS-POSS content; thus, phase sep-aration may occur at higher AS-POSS contentbecause the lower fraction of hydrogen bondinginteractions does not overcome the strong abilityof AS-POSS nanoparticles to aggregate. Thisresult is entirely likely because we found in thisstudy that the interassociation equilibrium con-stant (KA ¼ 64.6) for the interaction between thecarbonyl groups of AS-POSS and the hydroxylgroups of phenolic is not significantly higher thanthe self-association equilibrium constant of purephenolic (KB ¼ 52.3). Therefore, at a higher AS-POSS content, the ability of AS-POSS nanopar-ticles to aggregate immiscibly dominates over thebenefits of hydrogen bonding. In summary, wehave demonstrated that the miscibility behaviorin this phenolic/AS-POSS blend is dependent onthe extent of the hydrogen bonding interactions,while the immiscible aggregation ability of AS-POSS nanoparticles, which is similar to that ofmany polymer nanocomposite systems, decreasesupon increasing the nanoparticle’s content.23
Figure 8. DSC scans of phenolic/AS-POSS blends having different compositions.
684 KUO ET AL.

If we take into account, only the resultsobtained at relatively low AS-POSS contents(<40 wt %), these compositions display miscibilityand variable glass-transition temperatures as afunction of the composition of the blend, as indi-cated in Figure 9. A number of equations havebeen designed to predict the variations in theglass-transition temperatures of miscible blendsin relation to their composition. The most widelyused equation is the Kwei equation,24 which pre-dicts the glass-transition temperature of a misci-ble blend featuring hydrogen bonding interac-tions as a function of its composition:
Tg ¼ W1Tg1 þ kW2Tg2
W1 þ kW2þ qW1W2 ð5Þ
where W1 and W2 denote the weight fractions ofthe compositions, Tg1 and Tg2 represent the corre-sponding glass-transition temperatures of theblend’s components, and k and q are fitting con-stants. Figure 9 displays plots of the values of Tg
of the blends versus their compositions; clearly,the linear and Fox equations do not fit the exper-
imental data well. The Kwei equation, however,correlates well with the experimental data. Onthe basis of the nonlinear least-squares best fitof this data, we obtained k ¼ 1 and q ¼ 25; q is aparameter that corresponds to the strength ofthe hydrogen bonds in the blend and reflects thebalance between the breaking of any self-associa-tion and the formation of the interassociationhydrogen bonds. Compared with the phenolic/PAS blend system (k ¼ 1, q ¼ �245),12 the phe-nolic/AS-POSS blend system (k ¼ 1, q ¼ 25)seems to have the stronger average hydrogenbonding interactions. This result may arise fromtwo phenomena. One is that the star-shaped ace-toxystyrene-POSS presents a larger fraction ofhydrogen-bonded carbonyl groups than does thelinear PAS, which is similar to the findings wemade in a previous study of the phenolic/poly(-methyl methacrylate) blend system.25 The otherreason is that the siloxane groups of the POSScore also take part in hydrogen bonding interac-tions with the hydroxyl groups of the phenolic toresult in organic/inorganic polymer nanocompo-sites.26
CONCLUSIONS
We have synthesized a new nanomaterial basedon AS-POSS and investigated its hydrogen bond-ing with phenolic by using 1D and 2D FTIR spec-troscopic analyses. Hydrogen bonds exist betweenthe phenolic hydroxyl groups and both the car-bonyl and siloxane groups of AS-POSS. We deter-mined the interassociation equilibrium constantbetween the hydroxyl groups of the phenolic andthe siloxane groups of the POSS indirectly from aleast-squares fitting procedure based on theexperimental fraction of hydrogen-bonded car-bonyl groups in this blend system. The value ofKA (38.6) we obtained for the hydroxyl–siloxaneinteractions is equal to the value determinedusing the classical Coggeshall and Saier (C andS) methodology.
We thank the National Science Council, Taiwan,Republic of China, for supporting this research finan-cially under Contract No. NSC-93-2216-E-009-021.
REFERENCES AND NOTES
1. Schwab, J. J.; Lichtenhan, J. D. Appl OrganometChem 1998, 12, 707.
Figure 9. Plots of Tg versus composition based onthe experimental data and the linear, Fox, and Kweiequations.
PHENOLIC RESIN AND AS-POSS NANOCOMPOSITES 685

2. Lichtenhan, J. D.; Otonari, Y.; Carri, M. G. Mac-romolecules 1995, 28, 8435.
3. Shochey, E. G.; Bolf, A. G.; Jones, P. F.; Schwab,J. J.; Chaffee, K. P.; Haddad, T. S.; Lichtenhan,J. D. Appl Organomet Chem 1999, 13, 311.
4. Haddad, T. S.; Lichtenhan, J. D. Macromolecules1996, 29, 7302.
5. Abad, M. J.; Barral, L.; Fasce, D. P.; Williams,R. J. J. Macromolecules 2003, 36, 3128.
6. Fu, B. X.; Zhang, W.; Hsiao, B. S.; Johansson, G.;Sauer, B. B.; Phillips, S.; Balnski, R.; Rafailovich,M.; Sokolov, J. Polym Prepr 2000, 41, 587.
7. Leu, C. M.; Chang, Y. T.; Wei, K. H. Macromole-cules 2003, 36, 9122.
8. Mather, P. T.; Jeon, H. G.; Romo-Uribe, A.; Had-dad, T. S.; Lichtenhan, J. D. Macromolecules1999, 32, 1194.
9. Xu, H.; Kuo, S. W.; Lee, J. S.; Chang, F. C. Poly-mer 2002, 43, 5117.
10. Coleman, M. M.; Graf, J. F.; Painter, P. C. SpecificInteractions and the Miscibility of Polymer Blends;Technomic: Lancaster, PA, 1991.
11. Lee, Y. J.; Kuo, S. W.; Huang, W. J.; Lee, H. Y.;Chang, F. C. J Polym Sci Part B: Polym Phys2004, 42, 1127.
12. Kuo, S. W.; Chang, F. C. Macromol Chem Phys2002, 203, 868.
13. Kuo, S. W.; Chang, F. C. Macromolecules 2001,34, 4089.
14. Noda, I. J Am Chem Soc 1989, 111, 8116.15. Ren, Y.; Murakami, T.; Nishioka, T.; Nakashima, K.;
Noda, I.; Ozaki, Y. Macromolecules 1999, 32,6307.
16. Makashima, K.; Ren, Y.; Nishioka, T.; Tsubahara,N.; Noda, I.; Ozaki, Y. J Phys Chem B 1999, 103,6704.
17. Haung, H.; Malkov, S.; Coleman, M.; Painter, P.Macromolecules 2003, 36, 8148.
18. Haung, H.; Malkov, S.; Coleman, M.; Painter, P.Macromolecules 2003, 36, 8156.
19. Shen, Y.; Wu, P. J Phys Chem B 2003, 107, 4224.20. Coggesthall, N. D.; Saier, E. L. J Am Chem Soc
1951, 71, 5414.21. Coleman, M. M.; Painter, P. C. Prog Polym Sci
1995, 20, 1.22. Kuo, S. W.; Huang, W. J.; Chan, S. C.; Huang, C.
F.; Chang, F. C. Macromolecules 2004, 37, 4164.23. Ginzburg, V. V. Macromolecules 2005, 38, 2362.24. Kwei, T. K. J Polym Sci Polym Lett Ed 1984, 22, 307.25. Haung, C. F.; Kuo, S. W.; Lin, H. C.; Chen, J. K.;
Chen, Y. K.; Xu, H.; Chang, F. C. Polymer 2004,45, 5913.
26. Xu, H.; Kuo, S. W.; Lee, J. S.; Chang, F. C. Macro-molecules 2002, 35, 8788.
686 KUO ET AL.