hydrocarbon resource evaluation using combined ... · analysis and seismically derived reservoir...
TRANSCRIPT
ORIGINAL PAPER - EXPLORATION GEOPHYSICS
Hydrocarbon resource evaluation using combined petrophysicalanalysis and seismically derived reservoir characterization,offshore Niger Delta
Kehinde David Oyeyemi1 • Mary Taiwo Olowokere2 • Ahzegbobor Philips Aizebeokhai1
Received: 10 November 2016 / Accepted: 23 September 2017 / Published online: 3 October 2017
� The Author(s) 2017. This article is an open access publication
Abstract Subsurface characterization and hydrocarbon
resource evaluation were conducted using integrated well
logs analysis and three-dimensional (3D) seismic-based
reservoir characterization in an offshore field, western
Niger Delta basin. Reservoir sands R1–R4 were delin-
eated, mapped and quantitatively evaluated for petro-
physical characteristics such as net-to-gross, volume of
shale, water saturation, bulk water volume, porosity,
permeability, fluid types and fluid contacts (GOC and
OWC). The volume attributes aimed at extracting features
associated with hydrocarbon presence detection, net pay
evaluation and porosity estimation for optima reservoir
characterization. Neural network (NN)-derived chimney
properties prediction attribute was used to evaluate the
integrity of the delineated structural traps. Common
contour binning was employed for hydrocarbon prospect
evaluation, while the seismic coloured inversion was also
applied for net pay evaluation. The petrophysical prop-
erties estimations for the delineated reservoir sand units
have the porosity range from 21.3 to 30.62%, hydrocarbon
saturation 80.70–96.90 percentage. Estimated resistivity
Rt, porosity and permeability values for the delineated
reservoirs favour the presence of considerable amount of
hydrocarbon (oil and gas) within the reservoirs. Ampli-
tude anomalies were equally used to delineate bright spots
and flat spots; good quality reservoirs in term of their
porosity models, and fluid content and contacts (GOC and
OWC) were identified in the area through common con-
tour binning, seismic colour inversion and supervised NN
classification.
Keywords Petrophysics � Hydrocarbon prediction �Seismic attributes � Amplitude anomaly � Neural network
Introduction
TheNiger Delta ranked ninth among theworld’s hydrocarbon
provinces with proven recoverable reserves approximately
37,062 millions of barrels (MMbbl) of oil (OPEC 2016) and
5.1 trillion cubic metre of gas resources (BP 2014). This
petroliferous basin has more promising reserves yet to be
discovered as exploration proceeds into the deeper waters. It
has therefore become necessary to apply new exploration and
production technologies to harness these hydrocarbon
resources. Seismic chimney cube, common contour binning
(CCB) and seismic coloured inversion (SCI) are newly
introduced approaches for optimal reservoir characterization.
Seismic attributes are qualitative and/or quantitative
properties derived from seismic data in order to better
understand the physical properties of sedimentary strata
(porosity, permeability, bed thickness, etc.). Seismic attri-
butes such as chimneys, common contour binning (CCB)
and seismic coloured inversion are examples of qualitative
usage of seismic attributes. The specially designed multi-
layer perceptron (MLP) neural network-modelled seismic
chimneys are usually associated with chaotic reflections on
seismic sections with low energy and low trace-to-trace
similarity associated with the propagation of fluids through
fissures and fractures in strata. Seismically derived chim-
neys seek to formulate a critical relationship between
& Kehinde David Oyeyemi
1 Applied Geophysics Unit, College of Science and
Technology, Covenant University, Ota, Nigeria
2 Department of Geology, Obafemi Awolowo University,
Ile-Ife, Nigeria
123
J Petrol Explor Prod Technol (2018) 8:99–115
https://doi.org/10.1007/s13202-017-0391-6
chimney characteristics such as occurrence, type and extent
with several geologic features (e.g. mud diapirism, active
gas seepage and migration pathways) within the hydro-
carbon field.
Ever since the first published articles on chimneys
technology (Meldahl et al. 1999; Heggland et al. 1999),
numerous successful case histories of its application in
evaluation of vertical hydrocarbon migration pathways,
bright spots, salt diapers, sand bodies, channels, fault
sealing capacity and prospect ranking have been reported
(Meldahl et al. 2001; Aminzade and Connolly 2002;
Connolly et al. 2002; Ligtenberg and Thomsen 2003;
Tingdahl 2003). Delineation and mapping of hydrocarbon
migration pathways using gas chimneys analyses can show
clearly how reservoirs are being charged (Ligtenberg
2005). The results of seismic chimney analyses could also
be used to refine 2D or 3D basin models for hydrocarbon
exploration with a view to thoroughly understand and
characterize the available petroleum system, and prioritize
exploration plays (Connolly et al. 2013).
Common contour binning (CCB) technique was intro-
duced to proffer solution to the challenges of identifying
fluid contacts on seismic profiles that has no significant
fluid responses. This method uses the concept of 3D
waveform stacking and enhances the amplitude variances
resulting in fluid-type change with a view to identify the
various fluid contacts that have no significant seismic
response. CCB employs the amplitude stacking of the 3D
seismic post-stack data to enhance and detect subtle
anomalies that are related to hydrocarbon accumulation. It
expedites the identifications of fluid contacts such as gas–
water (GW), gas–oil (GO) and oil–water (OW), which are
essential parameters to estimate the original oil in place.
The conditions of these delineated contacts affect the
optimal productivity of the well as water production in
relation to oil and gas production determines the life cycle
of a well.
In principle, CCB stacking is based on two assumptions.
Firstly, the seismic traces that penetrate a hydrocarbon
bearing reservoir at the same depth are meant to have
identical hydrocarbon columns. Secondly, all the stacking
traces along contour lines enhance possible hydrocarbon
effects, whereas the stratigraphic variations and noise are
cancelled (dGB 2008). The implication of the second
assumption is that when all stacked traces are along the
same contour lines, then hydrocarbon effects are expected
to be constructively stacked, while both stratigraphic
variations and random noise would cancel out. This
approach to fluid contacts finder has been employed by
Zhao et al. (2013) to delineate the fluid contacts of both
anticlinal gas reservoir and structural lithological trap
reservoir. The method was also combined with back
propagation neural network technique to predict the OW
contacts in Carbonate reservoir, Salawati basin of West
Papua (Sutrisno et al. 2013).
Seismic coloured inversion (SCI) method is a trace
integration that basically provides a platform where a
designed filter can transform the seismic trace into an
assumed acoustic impedance equivalent. It has been
employed for reservoir characterization by several workers
(Ferguson and Margrave 1996; Lancaster and Whitcombe
2000; Veeken and Da Silva 2004; Swissi and Morozov
2009). This technique generates a band-limited inversion of
the seismic traces, which then transform them into reflec-
tivity traces through a designed operator in frequency
domain. Traditional inversion techniques such as sparse-
spike and simultaneous inversions are generally known to
be time consuming, expensive and sophisticated which
require expert users. Seismic coloured inversion is, how-
ever, easy to use, cost-effective, robust and model inde-
pendent, whereby delineated reservoirs are shaper and
better defined for qualitative interpretation and further
seismic analysis.
Description and geological setting
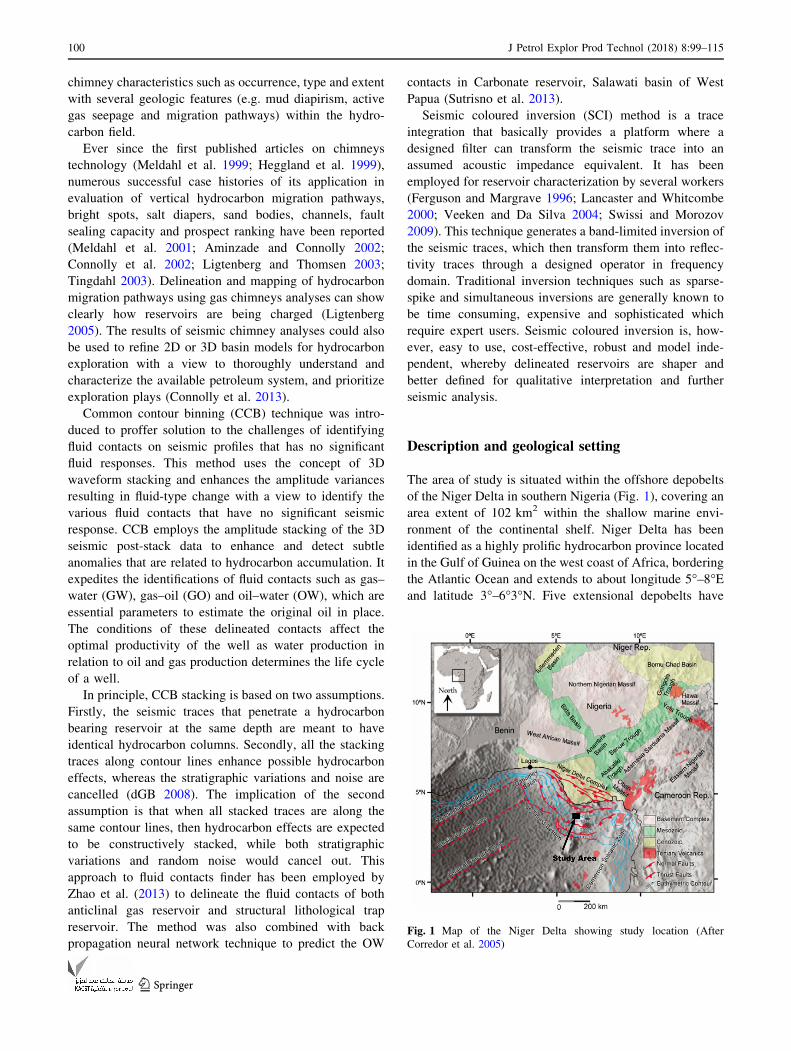
The area of study is situated within the offshore depobelts
of the Niger Delta in southern Nigeria (Fig. 1), covering an
area extent of 102 km2 within the shallow marine envi-
ronment of the continental shelf. Niger Delta has been
identified as a highly prolific hydrocarbon province located
in the Gulf of Guinea on the west coast of Africa, bordering
the Atlantic Ocean and extends to about longitude 5�–8�Eand latitude 3�–6�3�N. Five extensional depobelts have
Fig. 1 Map of the Niger Delta showing study location (After
Corredor et al. 2005)
100 J Petrol Explor Prod Technol (2018) 8:99–115
123
been recognized within the onshore area of Niger Delta,
comprising: northern Delta, greater Ughelli, central
swamp, coastal swamp and shallow offshore (Damuth
1994); sediments within these depobelts becomes younger
seawards. Each depobelt constitutes more or less an inde-
pendent unit based on structural setting, sedimentation and
hydrocarbon generation and accumulation (Evamy et al.
1978).
Three structural belts, namely inner thrust faults, fold
belts and the outer thrust belts, were identified within the
deep water toe of the Niger delta (Bilotti and Shaw 2005).
Both Agbami field and Bonga field were discovered within
these fold and thrust belts. The lithostratigraphic charac-
terization of the Niger Delta sediments comprises three
stratigraphic units that are of Cretaceous to Holocene; the
Akata, Agbada and Benin Formations (Reijers 2011). The
depositional environments for these identified stratigraphic
units are progradational (Corredor et al. 2005), and the
depositional packages comprise of sandstones, silts and
shales. The stratigraphic sequence consists of overpressure
shales of Akata Formation deposited under fully marine
conditions below 3658 m at the base, overlying by paralic
sequence of Agbada Formation (from 914 to 3658 m), and
the topmost massive continental sands of Benin Formation
above 3000 ft (914 m) to the surface. Niger Delta is typi-
cally a wave-and tide-dominated delta characterized by a
thick succession of deltaic sediments that have prograded
over the passive margin, overlying a ductile substrate of
over-pressured shales with thickness range 10–12 km
(Doust and Omatsola 1990; Cohen and McClay 1996).
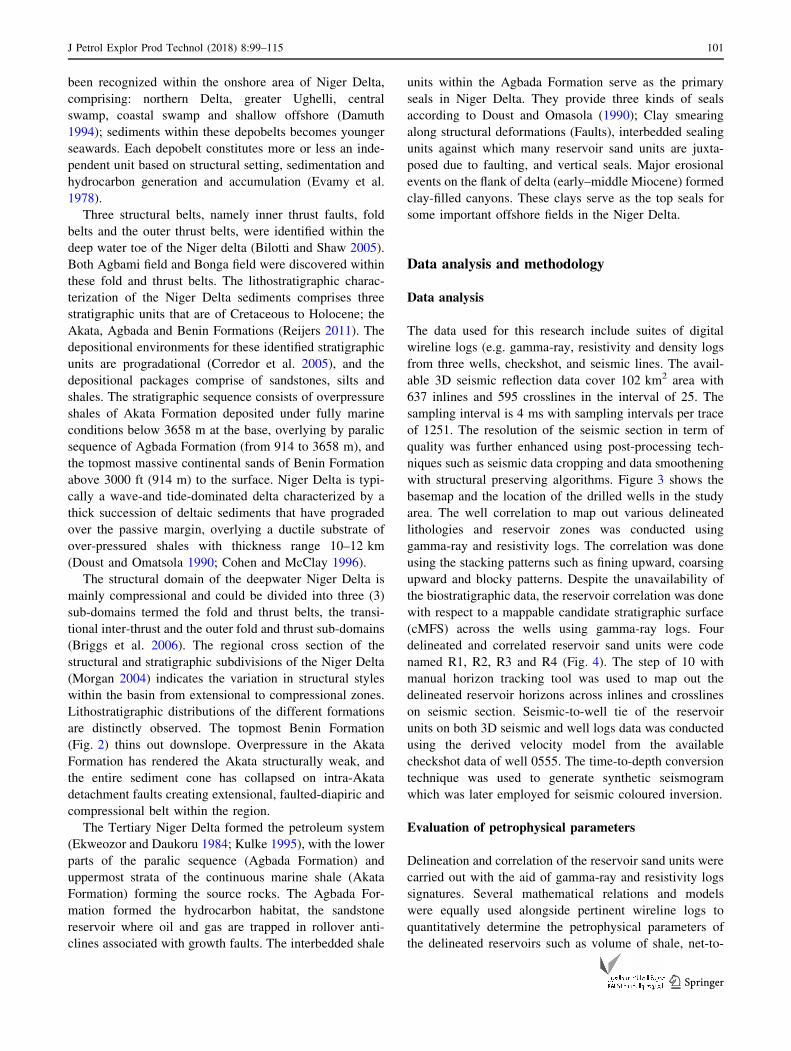
The structural domain of the deepwater Niger Delta is
mainly compressional and could be divided into three (3)
sub-domains termed the fold and thrust belts, the transi-
tional inter-thrust and the outer fold and thrust sub-domains
(Briggs et al. 2006). The regional cross section of the
structural and stratigraphic subdivisions of the Niger Delta
(Morgan 2004) indicates the variation in structural styles
within the basin from extensional to compressional zones.
Lithostratigraphic distributions of the different formations
are distinctly observed. The topmost Benin Formation
(Fig. 2) thins out downslope. Overpressure in the Akata
Formation has rendered the Akata structurally weak, and
the entire sediment cone has collapsed on intra-Akata
detachment faults creating extensional, faulted-diapiric and
compressional belt within the region.
The Tertiary Niger Delta formed the petroleum system
(Ekweozor and Daukoru 1984; Kulke 1995), with the lower
parts of the paralic sequence (Agbada Formation) and
uppermost strata of the continuous marine shale (Akata
Formation) forming the source rocks. The Agbada For-
mation formed the hydrocarbon habitat, the sandstone
reservoir where oil and gas are trapped in rollover anti-
clines associated with growth faults. The interbedded shale
units within the Agbada Formation serve as the primary
seals in Niger Delta. They provide three kinds of seals
according to Doust and Omasola (1990); Clay smearing
along structural deformations (Faults), interbedded sealing
units against which many reservoir sand units are juxta-
posed due to faulting, and vertical seals. Major erosional
events on the flank of delta (early–middle Miocene) formed
clay-filled canyons. These clays serve as the top seals for
some important offshore fields in the Niger Delta.
Data analysis and methodology
Data analysis
The data used for this research include suites of digital
wireline logs (e.g. gamma-ray, resistivity and density logs
from three wells, checkshot, and seismic lines. The avail-
able 3D seismic reflection data cover 102 km2 area with
637 inlines and 595 crosslines in the interval of 25. The
sampling interval is 4 ms with sampling intervals per trace
of 1251. The resolution of the seismic section in term of
quality was further enhanced using post-processing tech-
niques such as seismic data cropping and data smoothening
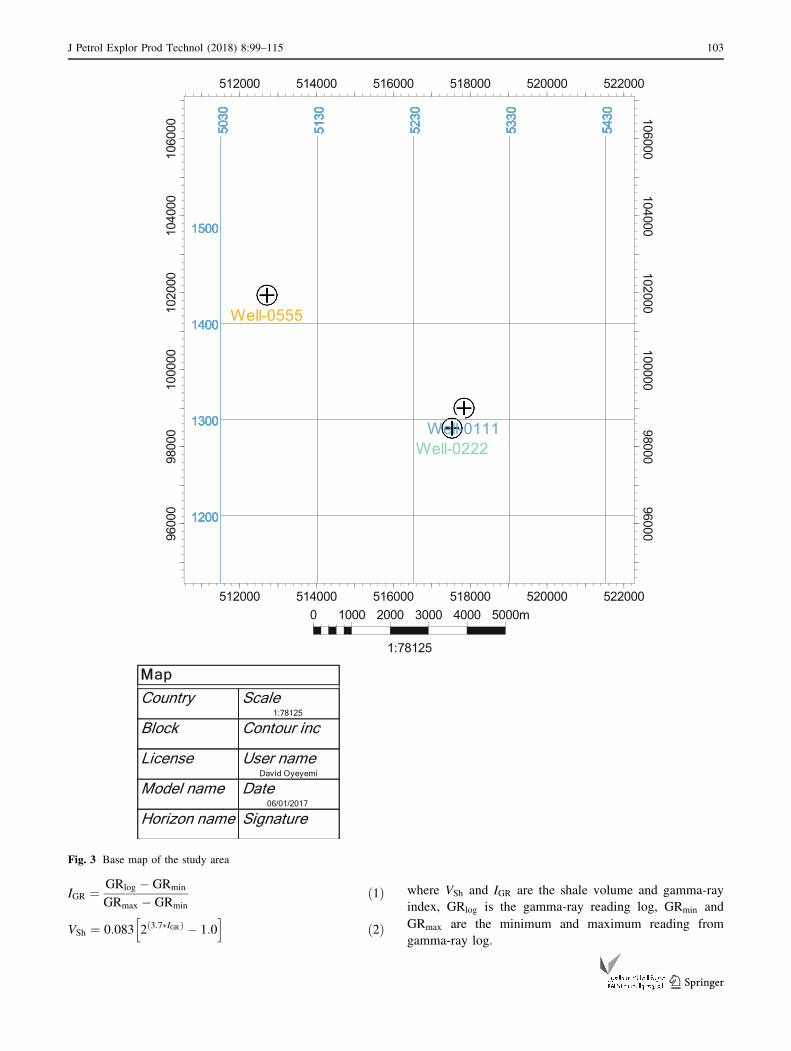
with structural preserving algorithms. Figure 3 shows the
basemap and the location of the drilled wells in the study
area. The well correlation to map out various delineated
lithologies and reservoir zones was conducted using
gamma-ray and resistivity logs. The correlation was done
using the stacking patterns such as fining upward, coarsing
upward and blocky patterns. Despite the unavailability of
the biostratigraphic data, the reservoir correlation was done
with respect to a mappable candidate stratigraphic surface
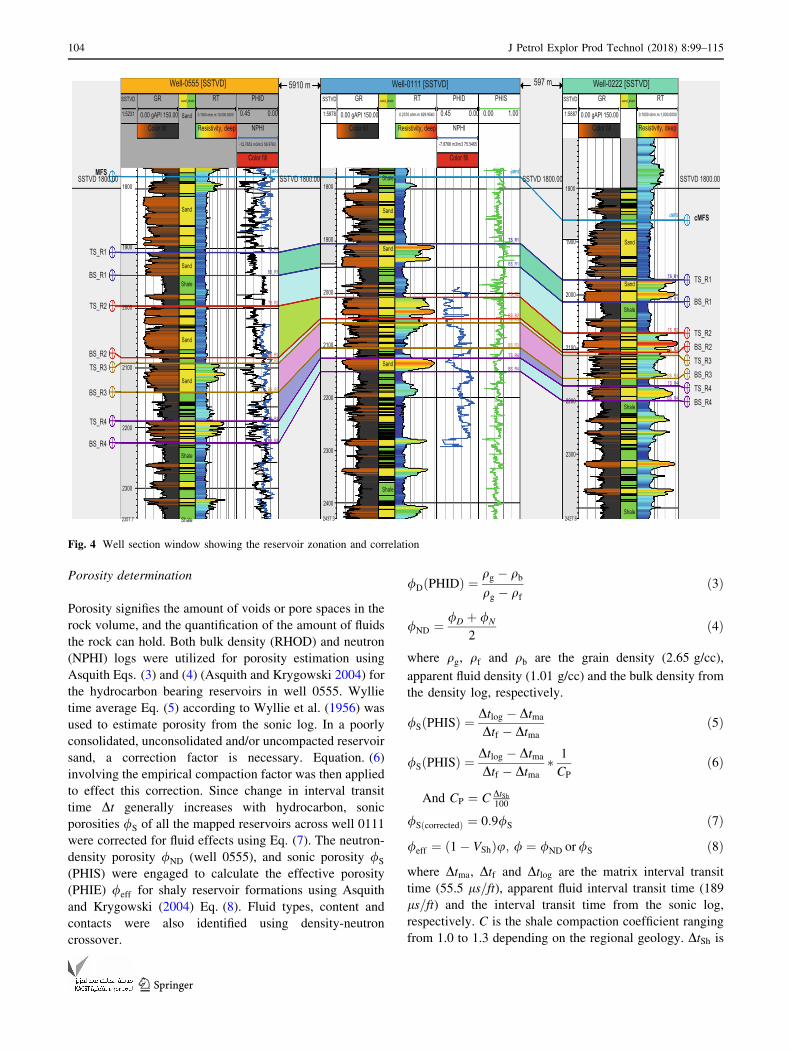
(cMFS) across the wells using gamma-ray logs. Four
delineated and correlated reservoir sand units were code
named R1, R2, R3 and R4 (Fig. 4). The step of 10 with
manual horizon tracking tool was used to map out the
delineated reservoir horizons across inlines and crosslines
on seismic section. Seismic-to-well tie of the reservoir
units on both 3D seismic and well logs data was conducted
using the derived velocity model from the available
checkshot data of well 0555. The time-to-depth conversion
technique was used to generate synthetic seismogram
which was later employed for seismic coloured inversion.
Evaluation of petrophysical parameters
Delineation and correlation of the reservoir sand units were
carried out with the aid of gamma-ray and resistivity logs
signatures. Several mathematical relations and models
were equally used alongside pertinent wireline logs to
quantitatively determine the petrophysical parameters of
the delineated reservoirs such as volume of shale, net-to-
J Petrol Explor Prod Technol (2018) 8:99–115 101
123
gross, water saturation, hydrocarbon saturation, bulk vol-
ume of water, porosity and permeability.
Net-to-gross sand estimation
Reservoir lithological characterization in terms of sand and
shale distributions was done based on shale volume
determination using Eqs. (1) and (2) for tertiary uncon-
solidated rocks after Larinov (1969)and Schlumberger
(1989). The volume of shale was estimated from gamma-
ray log, and well log cut-offs were applied based on shale
volume and effective porosity in order to determine net
reservoir rock. Net-to-gross (NTG) ratio estimation was
carried out with a view to evaluate the sand units within the
study area and determine their quality as a potential
reservoir. High NTG value connotes a good quality
hydrocarbon reservoir (Al-Baldawi 2014).
Fig. 2 Stratigraphic column of
the Niger Delta basin (Doust
and Omatsola 1990)
102 J Petrol Explor Prod Technol (2018) 8:99–115
123
IGR ¼ GRlog � GRmin
GRmax � GRmin
ð1Þ
VSh ¼ 0:083 2ð3:7�IGRÞ � 1:0h i
ð2Þ
where VSh and IGR are the shale volume and gamma-ray
index, GRlog is the gamma-ray reading log, GRmin and
GRmax are the minimum and maximum reading from
gamma-ray log.
Well-0222
Well-0555
50
Well-0111
30
5130
523 0
5 330
543 0
1200
1300
1400
150050
30
5130
523 0
5 330
543 0
1200
1300
1400
150050
30
5130
523 0
5 330
543 0
1200
1300
1400
150050
30
5130
523 0
5 330
543 0
1200
1300
1400
1500
512000 514000 516000 518000 520000 522000
512000 514000 516000 518000 520000 522000
9600
098
000
1000
0010
2000
1040
0010
6000
9600098000
100000102000
104000106000
0 1000 2000 3000 4000 5000m
1:78125
MMap
Country Scale1:78125
Block Contour inc
License User nameDavid Oyeyemi
Model name Date06/01/2017
Horizon name Signature
Fig. 3 Base map of the study area
J Petrol Explor Prod Technol (2018) 8:99–115 103
123
Porosity determination
Porosity signifies the amount of voids or pore spaces in the
rock volume, and the quantification of the amount of fluids
the rock can hold. Both bulk density (RHOD) and neutron
(NPHI) logs were utilized for porosity estimation using
Asquith Eqs. (3) and (4) (Asquith and Krygowski 2004) for
the hydrocarbon bearing reservoirs in well 0555. Wyllie
time average Eq. (5) according to Wyllie et al. (1956) was
used to estimate porosity from the sonic log. In a poorly
consolidated, unconsolidated and/or uncompacted reservoir
sand, a correction factor is necessary. Equation. (6)
involving the empirical compaction factor was then applied
to effect this correction. Since change in interval transit
time Dt generally increases with hydrocarbon, sonic
porosities /S of all the mapped reservoirs across well 0111
were corrected for fluid effects using Eq. (7). The neutron-
density porosity /ND (well 0555), and sonic porosity /S
(PHIS) were engaged to calculate the effective porosity
(PHIE) /eff for shaly reservoir formations using Asquith
and Krygowski (2004) Eq. (8). Fluid types, content and
contacts were also identified using density-neutron
crossover.
/DðPHIDÞ ¼qg � qbqg � qf
ð3Þ
/ND ¼ /D þ /N
2ð4Þ
where qg, qf and qb are the grain density (2.65 g/cc),
apparent fluid density (1.01 g/cc) and the bulk density from
the density log, respectively.
/SðPHISÞ ¼Dtlog � Dtma
Dtf � Dtma
ð5Þ
/SðPHISÞ ¼Dtlog � Dtma
Dtf � Dtma
� 1
CP
ð6Þ
And CP ¼ C DtSh100
/SðcorrectedÞ ¼ 0:9/S ð7Þ
/eff ¼ ð1� VShÞu; / ¼ /ND or/S ð8Þ
where Dtma, Dtf and Dtlog are the matrix interval transit
time (55.5 ls=ft), apparent fluid interval transit time (189
ls=ft) and the interval transit time from the sonic log,
respectively. C is the shale compaction coefficient ranging
from 1.0 to 1.3 depending on the regional geology. DtSh is
SSTVD 1800.00
TS_R1
BS_R1
TS_R2
BS_R2TS_R3
BS_R3
TS_R4
BS_R4
MFS
Sand
Sand
Sand
Shale
Sand
Sand
Shale
Shale
TS_R1
BS_R1
TS_R2
BS_R2TS_R3
BS_R3
TS_R4
BS_R4
cMFS
2357.7
1800
1900
2000
2100
2200
2300
SSTVD 1800.00 Shale
Sand
Sand
Sand
Shale
TS_R1
BS_R1
TS_R2
BS_R2TS_R3
BS_R3
TS_R4
BS_R4
cMFS
2437.3
1800
1900
2000
2100
2200
2300
2400
SSTVD 1800.00
Sand
Sand
Shale
Shale
Shale
TS_R1
BS_R1
TS_R2
BS_R2TS_R3
BS_R3TS_R4
BS_R4
cMFS
2427.6
1800
1900
2000
2100
2200
2300
SSTVD 1800.00
TS_R1
BS_R1
TS_R2BS_R2TS_R3BS_R3TS_R4BS_R4
cMFS
5910 m 597 mWell-0555 [SSTVD]SSTVD
1:5231 0.00 gAPI 150.00
GR
Color fill
sand_shale
0.1000 ohm.m 10,000.0000
RT
Resistivity, deep
0.45 0.00
PHID
-12.7653 m3/m3 56.9763
NPHI
Color fill
Well-0111 [SSTVD]SSTVD
1:5978 0.00 gAPI 150.00
GR
Color fill
sand_shale
0.2370 ohm.m 829.9540
RT
Resistivity, deep
0.45 0.00
PHID
-7.8766 m3/m3 75.5465
NPHI
Color fill
0.00 1.00
PHIS
Well-0222 [SSTVD]SSTVD
1:5887 0.00 gAPI 150.00
GR
Color fill
sand_shale
0.1000 ohm.m 1,000.0000
RT
Resistivity, deep
Fig. 4 Well section window showing the reservoir zonation and correlation
104 J Petrol Explor Prod Technol (2018) 8:99–115
123
the specific acoustic transit time in adjacent shales,
whereas 100 ls=ft is the acoustic transit time in a com-
pacted shales.
Estimation of water and hydrocarbon saturation
Water saturation as the percentage of the reservoir volume
that is made up of water was estimated using Archie
Eq. (9)
Sw ¼ffiffiffiffiffiffiffiffiffiffiffiffiffiffiffia � Rw
Rt � /m
sð9Þ
where a and m are the tortuosity and cementation exponent
taking as 0.81 and 2, respectively, / is the porosity (/ND or
/S). Rt is the true resistivity of the formation measured by
deep laterolog on the assumption that the formation is
greater than 1 m (about 3ft), and the formation invasion is
not too deep (Asquith and Krygowski 2004). R0 is the
resistivity of the reservoir when the entire fluid is water and
Rw is the formation water resistivity at the formation
temperature, it is determined using Eq. (10) from both the
resistivity and porosity logs within clean water zone.
Rw ¼ /mR0
að10Þ
Consequent hydrocarbon saturation Sh (Schlumberger
1989) denoting the percentage of the pore volume in a
formation occupied by hydrocarbon is determined using
Eq. (11).
Sh ¼ ð100� SwÞ% ð11Þ
Bulk volume of water determination
Bulk volume of water (BVW) which determines whether
the hydrocarbon from the reservoir would be water free or
not was estimated using Eq. (12) according to Morris and
Briggs (1967).
BVW ¼ Sw � / ð12Þ
Permeability estimation
Free-fluid Coates model that is applicable to water satu-
rated and/or hydrocarbon-saturated reservoirs was used in
this research. The model assumes a good correlation
between porosity, pore throat size and pore connectivity.
This model has been validated, with the assumptions valid
for clastic reservoirs such as those in the Niger Delta basin.
Equation (13) used after Coates and Denoo (1981) was
derived to ensure zero permeability as porosity and water
saturation approach zero and hundred percentage,
respectively.
K1=2 ¼ ½100/2eð1� SwiÞ=SwiÞ� ð13Þ
S2wi ¼F
2000;F ¼ a
/m ð14Þ
where Swi is irreducible water saturation, F is the formation
factor and all other symbols have their usual meanings.
Dip-steering attribute
The dip-steering attribute analysis allows the creation of
steering cube that contains both local dip and azimuth
positions at each sample position. The attribute is quite
useful for improved faults and fault zones detection. Its
application minimizes the sensitivity of similarity to
dipping reflectors with no apparent link to faulting by
aligning adjacent trace segments with lag time. A
steering cube designed using dip-steered median filter
attribute can be used to effectively perform a structurally
oriented filtering. When a dip-steered similarity attribute
is employed, dip-steering cube can be used for enhanc-
ing multi-trace attributes simply by extracting attributes
input along the reflectors. Other applications of dip-
steering attributes include the estimation of some unique
attributes such as dip and azimuth, 3D curvature and dip
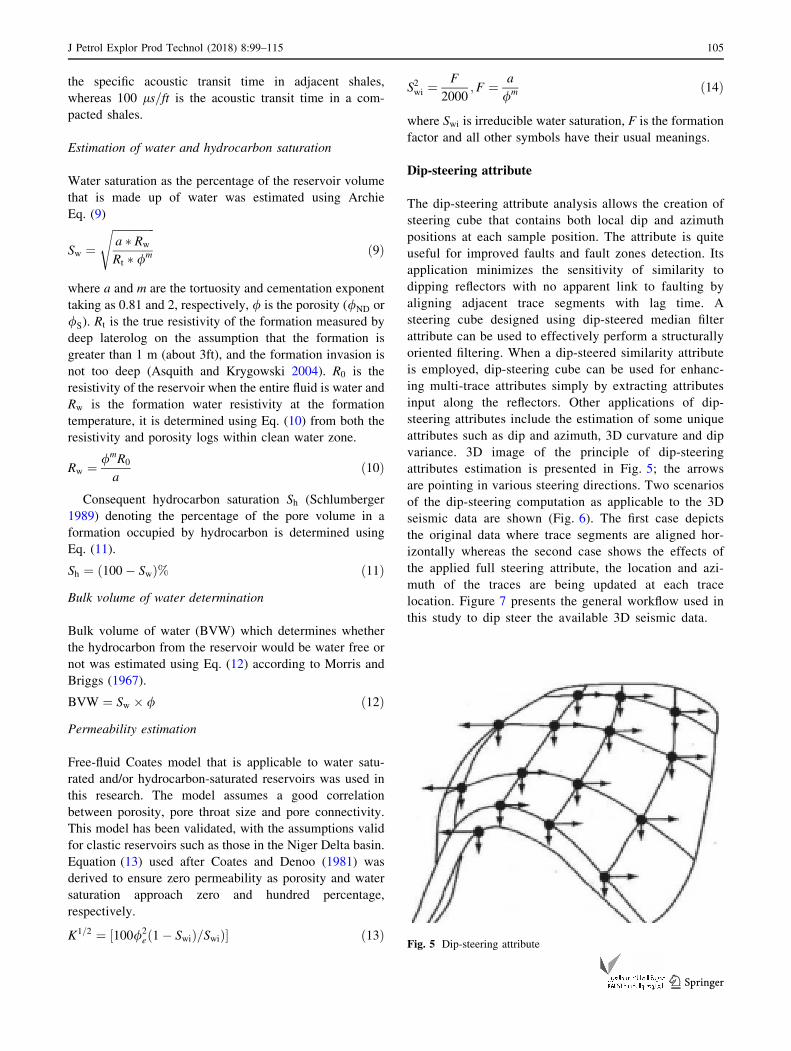
variance. 3D image of the principle of dip-steering
attributes estimation is presented in Fig. 5; the arrows
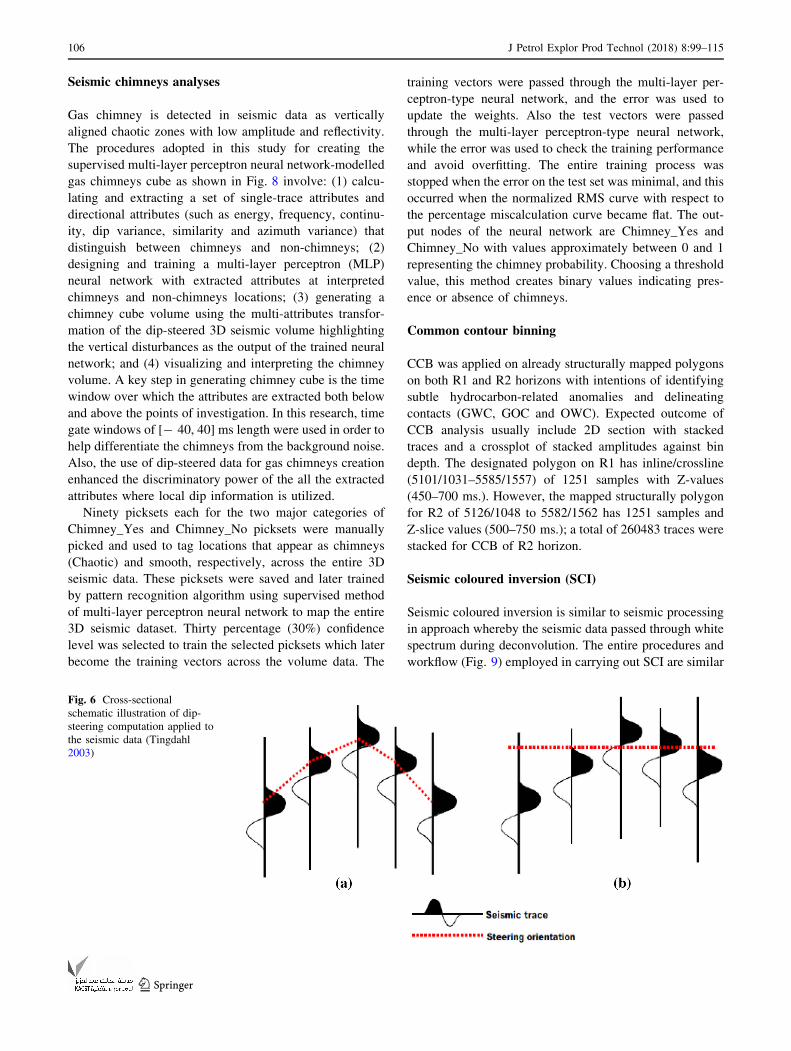
are pointing in various steering directions. Two scenarios
of the dip-steering computation as applicable to the 3D
seismic data are shown (Fig. 6). The first case depicts
the original data where trace segments are aligned hor-
izontally whereas the second case shows the effects of
the applied full steering attribute, the location and azi-
muth of the traces are being updated at each trace
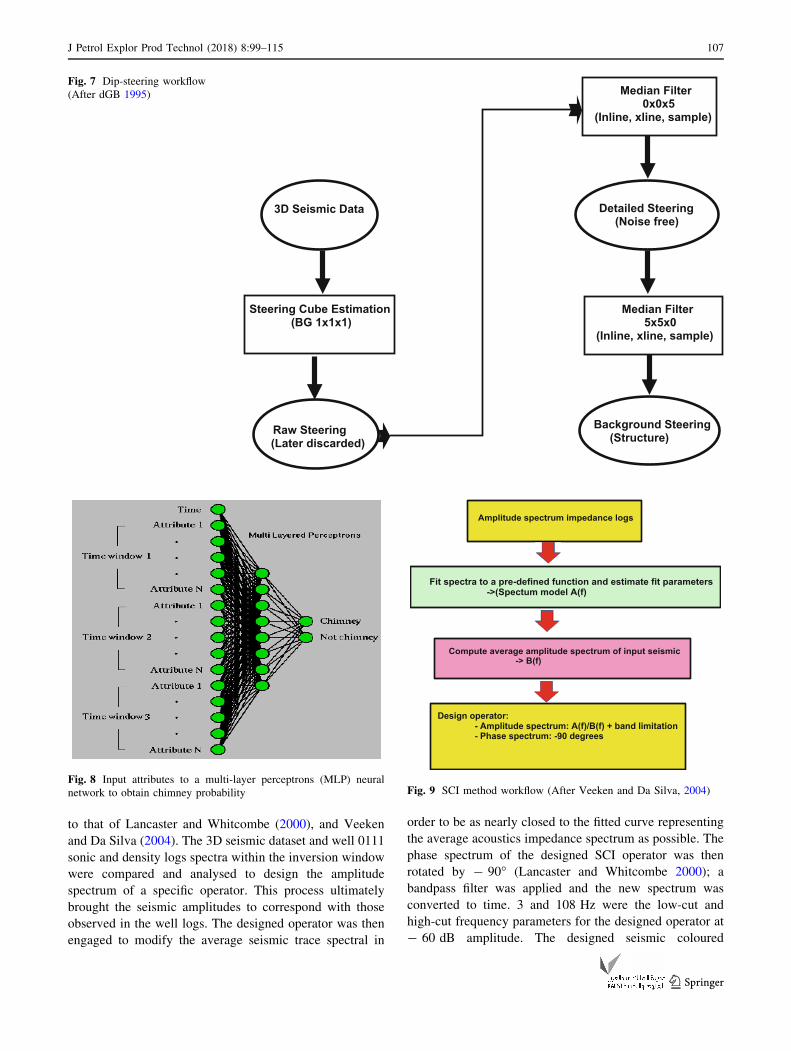
location. Figure 7 presents the general workflow used in
this study to dip steer the available 3D seismic data.
Fig. 5 Dip-steering attribute
J Petrol Explor Prod Technol (2018) 8:99–115 105
123
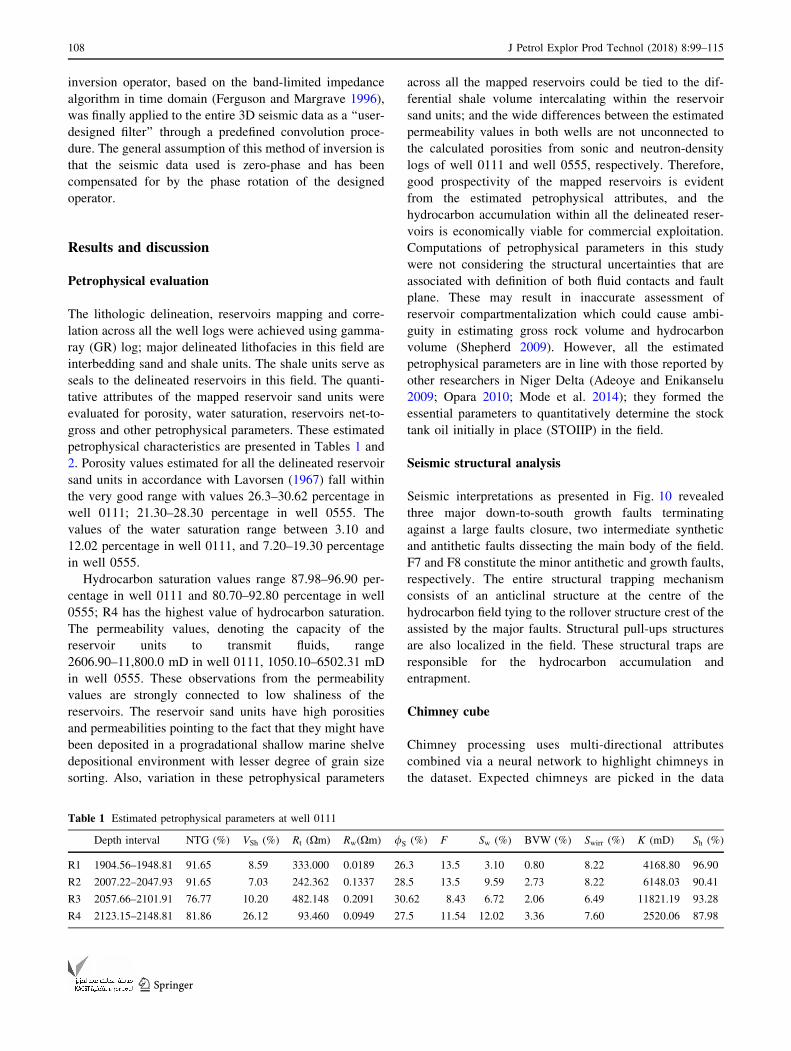
Seismic chimneys analyses
Gas chimney is detected in seismic data as vertically
aligned chaotic zones with low amplitude and reflectivity.
The procedures adopted in this study for creating the
supervised multi-layer perceptron neural network-modelled
gas chimneys cube as shown in Fig. 8 involve: (1) calcu-
lating and extracting a set of single-trace attributes and
directional attributes (such as energy, frequency, continu-
ity, dip variance, similarity and azimuth variance) that
distinguish between chimneys and non-chimneys; (2)
designing and training a multi-layer perceptron (MLP)
neural network with extracted attributes at interpreted
chimneys and non-chimneys locations; (3) generating a
chimney cube volume using the multi-attributes transfor-
mation of the dip-steered 3D seismic volume highlighting
the vertical disturbances as the output of the trained neural
network; and (4) visualizing and interpreting the chimney
volume. A key step in generating chimney cube is the time
window over which the attributes are extracted both below
and above the points of investigation. In this research, time
gate windows of [- 40, 40] ms length were used in order to
help differentiate the chimneys from the background noise.
Also, the use of dip-steered data for gas chimneys creation
enhanced the discriminatory power of the all the extracted
attributes where local dip information is utilized.
Ninety picksets each for the two major categories of
Chimney_Yes and Chimney_No picksets were manually
picked and used to tag locations that appear as chimneys
(Chaotic) and smooth, respectively, across the entire 3D
seismic data. These picksets were saved and later trained
by pattern recognition algorithm using supervised method
of multi-layer perceptron neural network to map the entire
3D seismic dataset. Thirty percentage (30%) confidence
level was selected to train the selected picksets which later
become the training vectors across the volume data. The
training vectors were passed through the multi-layer per-
ceptron-type neural network, and the error was used to
update the weights. Also the test vectors were passed
through the multi-layer perceptron-type neural network,
while the error was used to check the training performance
and avoid overfitting. The entire training process was
stopped when the error on the test set was minimal, and this
occurred when the normalized RMS curve with respect to
the percentage miscalculation curve became flat. The out-
put nodes of the neural network are Chimney_Yes and
Chimney_No with values approximately between 0 and 1
representing the chimney probability. Choosing a threshold
value, this method creates binary values indicating pres-
ence or absence of chimneys.
Common contour binning
CCB was applied on already structurally mapped polygons
on both R1 and R2 horizons with intentions of identifying
subtle hydrocarbon-related anomalies and delineating
contacts (GWC, GOC and OWC). Expected outcome of
CCB analysis usually include 2D section with stacked
traces and a crossplot of stacked amplitudes against bin
depth. The designated polygon on R1 has inline/crossline
(5101/1031–5585/1557) of 1251 samples with Z-values
(450–700 ms.). However, the mapped structurally polygon
for R2 of 5126/1048 to 5582/1562 has 1251 samples and
Z-slice values (500–750 ms.); a total of 260483 traces were
stacked for CCB of R2 horizon.
Seismic coloured inversion (SCI)
Seismic coloured inversion is similar to seismic processing
in approach whereby the seismic data passed through white
spectrum during deconvolution. The entire procedures and
workflow (Fig. 9) employed in carrying out SCI are similar
Fig. 6 Cross-sectional
schematic illustration of dip-
steering computation applied to
the seismic data (Tingdahl
2003)
106 J Petrol Explor Prod Technol (2018) 8:99–115
123
to that of Lancaster and Whitcombe (2000), and Veeken
and Da Silva (2004). The 3D seismic dataset and well 0111
sonic and density logs spectra within the inversion window
were compared and analysed to design the amplitude
spectrum of a specific operator. This process ultimately
brought the seismic amplitudes to correspond with those
observed in the well logs. The designed operator was then
engaged to modify the average seismic trace spectral in
order to be as nearly closed to the fitted curve representing
the average acoustics impedance spectrum as possible. The
phase spectrum of the designed SCI operator was then
rotated by - 90� (Lancaster and Whitcombe 2000); a
bandpass filter was applied and the new spectrum was
converted to time. 3 and 108 Hz were the low-cut and
high-cut frequency parameters for the designed operator at
- 60 dB amplitude. The designed seismic coloured
Median Filter0x0x5
(Inline, xline, sample)
Detailed Steering(Noise free)
Median Filter5x5x0
(Inline, xline, sample)
Background Steering(Structure)
3D Seismic Data
Steering Cube Estimation(BG 1x1x1)
Raw Steering(Later discarded)
Fig. 7 Dip-steering workflow
(After dGB 1995)
Fig. 8 Input attributes to a multi-layer perceptrons (MLP) neural
network to obtain chimney probability
Amplitude spectrum impedance logs
Fit spectra to a pre-defined function and estimate fit parameters ->(Spectum model A(f)
Compute average amplitude spectrum of input seismic -> B(f)
Design operator: - Amplitude spectrum: A(f)/B(f) + band limitation - Phase spectrum: -90 degrees
Fig. 9 SCI method workflow (After Veeken and Da Silva, 2004)
J Petrol Explor Prod Technol (2018) 8:99–115 107
123
inversion operator, based on the band-limited impedance
algorithm in time domain (Ferguson and Margrave 1996),
was finally applied to the entire 3D seismic data as a ‘‘user-
designed filter’’ through a predefined convolution proce-
dure. The general assumption of this method of inversion is
that the seismic data used is zero-phase and has been
compensated for by the phase rotation of the designed
operator.
Results and discussion
Petrophysical evaluation
The lithologic delineation, reservoirs mapping and corre-
lation across all the well logs were achieved using gamma-
ray (GR) log; major delineated lithofacies in this field are
interbedding sand and shale units. The shale units serve as
seals to the delineated reservoirs in this field. The quanti-
tative attributes of the mapped reservoir sand units were
evaluated for porosity, water saturation, reservoirs net-to-
gross and other petrophysical parameters. These estimated
petrophysical characteristics are presented in Tables 1 and
2. Porosity values estimated for all the delineated reservoir
sand units in accordance with Lavorsen (1967) fall within
the very good range with values 26.3–30.62 percentage in
well 0111; 21.30–28.30 percentage in well 0555. The
values of the water saturation range between 3.10 and
12.02 percentage in well 0111, and 7.20–19.30 percentage
in well 0555.
Hydrocarbon saturation values range 87.98–96.90 per-
centage in well 0111 and 80.70–92.80 percentage in well
0555; R4 has the highest value of hydrocarbon saturation.
The permeability values, denoting the capacity of the
reservoir units to transmit fluids, range
2606.90–11,800.0 mD in well 0111, 1050.10–6502.31 mD
in well 0555. These observations from the permeability
values are strongly connected to low shaliness of the
reservoirs. The reservoir sand units have high porosities
and permeabilities pointing to the fact that they might have
been deposited in a progradational shallow marine shelve
depositional environment with lesser degree of grain size
sorting. Also, variation in these petrophysical parameters
across all the mapped reservoirs could be tied to the dif-
ferential shale volume intercalating within the reservoir
sand units; and the wide differences between the estimated
permeability values in both wells are not unconnected to
the calculated porosities from sonic and neutron-density
logs of well 0111 and well 0555, respectively. Therefore,
good prospectivity of the mapped reservoirs is evident
from the estimated petrophysical attributes, and the
hydrocarbon accumulation within all the delineated reser-
voirs is economically viable for commercial exploitation.
Computations of petrophysical parameters in this study
were not considering the structural uncertainties that are
associated with definition of both fluid contacts and fault
plane. These may result in inaccurate assessment of
reservoir compartmentalization which could cause ambi-
guity in estimating gross rock volume and hydrocarbon
volume (Shepherd 2009). However, all the estimated
petrophysical parameters are in line with those reported by
other researchers in Niger Delta (Adeoye and Enikanselu
2009; Opara 2010; Mode et al. 2014); they formed the
essential parameters to quantitatively determine the stock
tank oil initially in place (STOIIP) in the field.
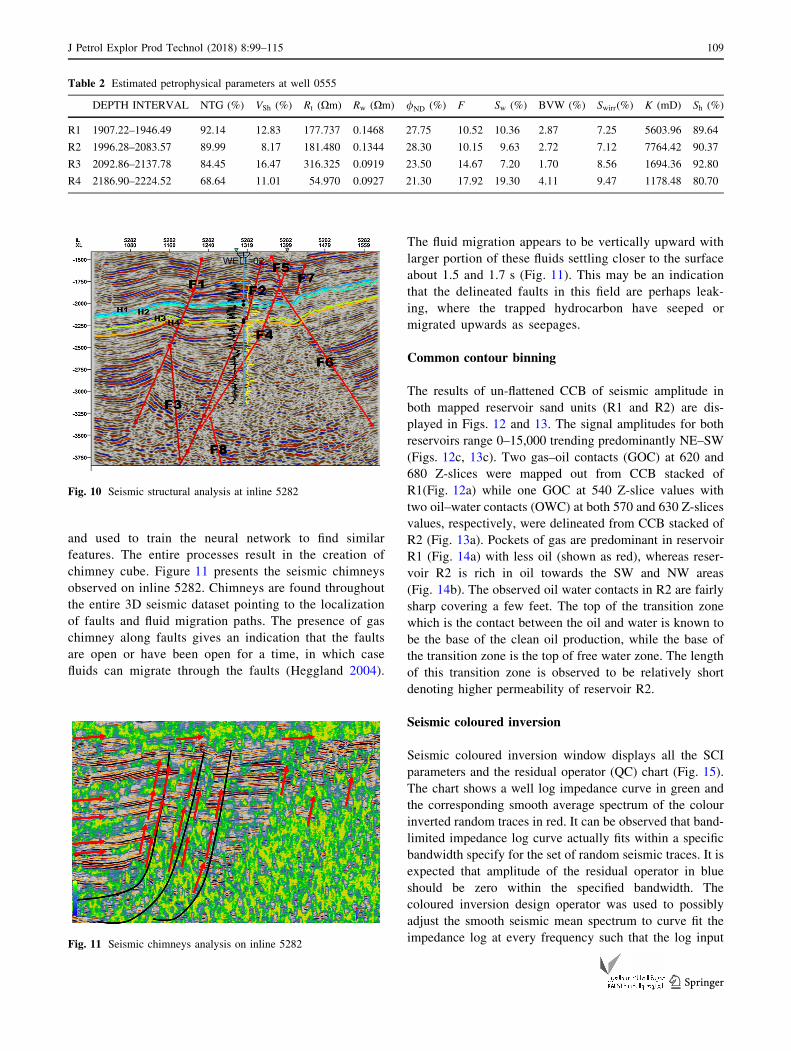
Seismic structural analysis
Seismic interpretations as presented in Fig. 10 revealed
three major down-to-south growth faults terminating
against a large faults closure, two intermediate synthetic
and antithetic faults dissecting the main body of the field.
F7 and F8 constitute the minor antithetic and growth faults,
respectively. The entire structural trapping mechanism
consists of an anticlinal structure at the centre of the
hydrocarbon field tying to the rollover structure crest of the
assisted by the major faults. Structural pull-ups structures
are also localized in the field. These structural traps are
responsible for the hydrocarbon accumulation and
entrapment.
Chimney cube
Chimney processing uses multi-directional attributes
combined via a neural network to highlight chimneys in
the dataset. Expected chimneys are picked in the data
Table 1 Estimated petrophysical parameters at well 0111
Depth interval NTG (%) VSh (%) Rt (Xm) Rw(Xm) /S (%) F Sw (%) BVW (%) Swirr (%) K (mD) Sh (%)
R1 1904.56–1948.81 91.65 8.59 333.000 0.0189 26.3 13.5 3.10 0.80 8.22 4168.80 96.90
R2 2007.22–2047.93 91.65 7.03 242.362 0.1337 28.5 13.5 9.59 2.73 8.22 6148.03 90.41
R3 2057.66–2101.91 76.77 10.20 482.148 0.2091 30.62 8.43 6.72 2.06 6.49 11821.19 93.28
R4 2123.15–2148.81 81.86 26.12 93.460 0.0949 27.5 11.54 12.02 3.36 7.60 2520.06 87.98
108 J Petrol Explor Prod Technol (2018) 8:99–115
123
and used to train the neural network to find similar
features. The entire processes result in the creation of
chimney cube. Figure 11 presents the seismic chimneys
observed on inline 5282. Chimneys are found throughout
the entire 3D seismic dataset pointing to the localization
of faults and fluid migration paths. The presence of gas
chimney along faults gives an indication that the faults
are open or have been open for a time, in which case
fluids can migrate through the faults (Heggland 2004).
The fluid migration appears to be vertically upward with
larger portion of these fluids settling closer to the surface
about 1.5 and 1.7 s (Fig. 11). This may be an indication
that the delineated faults in this field are perhaps leak-
ing, where the trapped hydrocarbon have seeped or
migrated upwards as seepages.
Common contour binning
The results of un-flattened CCB of seismic amplitude in
both mapped reservoir sand units (R1 and R2) are dis-
played in Figs. 12 and 13. The signal amplitudes for both
reservoirs range 0–15,000 trending predominantly NE–SW
(Figs. 12c, 13c). Two gas–oil contacts (GOC) at 620 and
680 Z-slices were mapped out from CCB stacked of
R1(Fig. 12a) while one GOC at 540 Z-slice values with
two oil–water contacts (OWC) at both 570 and 630 Z-slices
values, respectively, were delineated from CCB stacked of
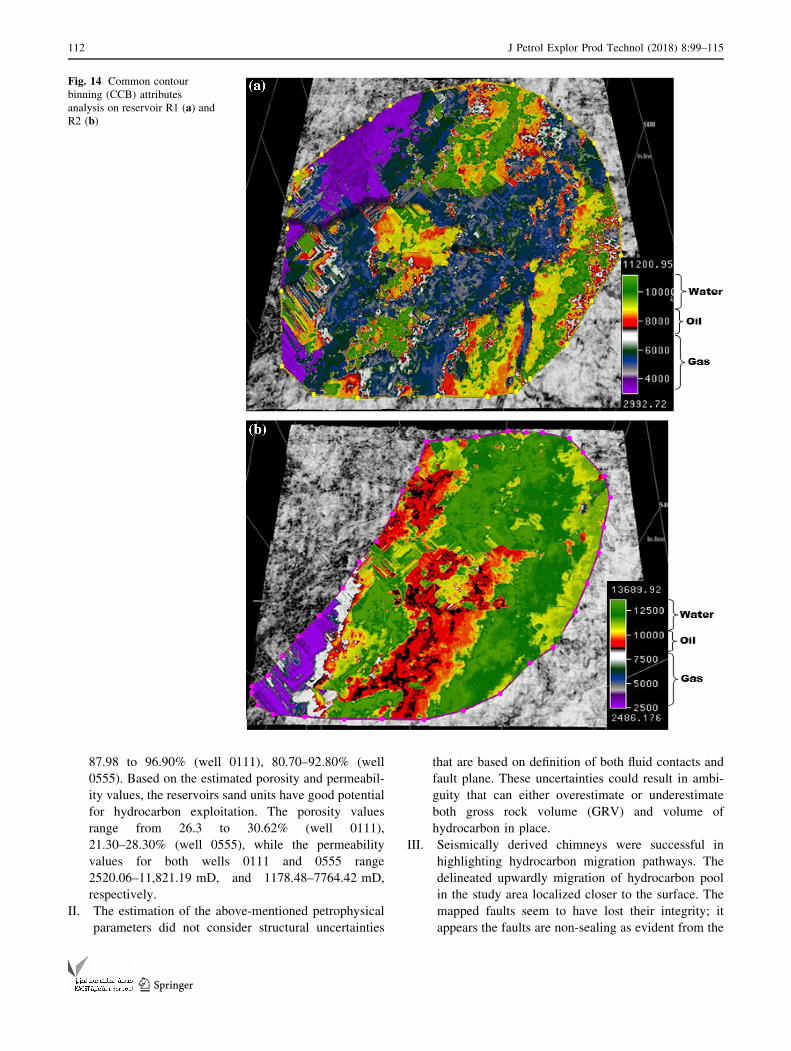
R2 (Fig. 13a). Pockets of gas are predominant in reservoir
R1 (Fig. 14a) with less oil (shown as red), whereas reser-
voir R2 is rich in oil towards the SW and NW areas
(Fig. 14b). The observed oil water contacts in R2 are fairly
sharp covering a few feet. The top of the transition zone
which is the contact between the oil and water is known to
be the base of the clean oil production, while the base of
the transition zone is the top of free water zone. The length
of this transition zone is observed to be relatively short
denoting higher permeability of reservoir R2.
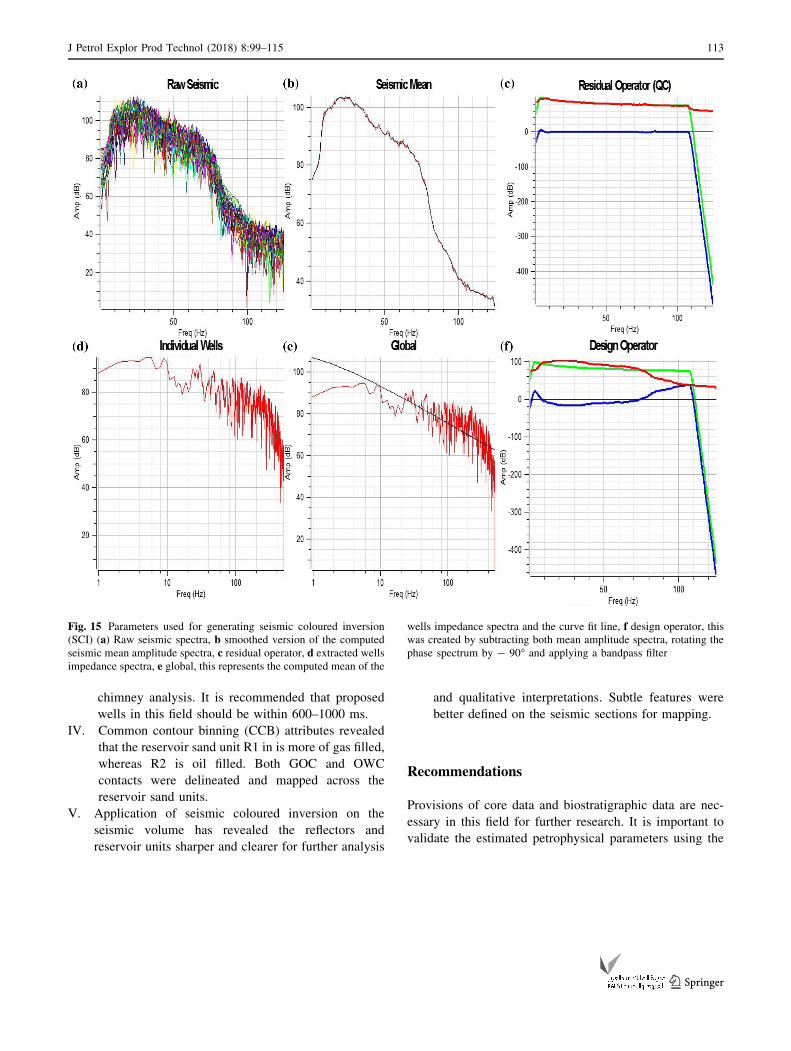
Seismic coloured inversion
Seismic coloured inversion window displays all the SCI
parameters and the residual operator (QC) chart (Fig. 15).
The chart shows a well log impedance curve in green and
the corresponding smooth average spectrum of the colour
inverted random traces in red. It can be observed that band-
limited impedance log curve actually fits within a specific
bandwidth specify for the set of random seismic traces. It is
expected that amplitude of the residual operator in blue
should be zero within the specified bandwidth. The
coloured inversion design operator was used to possibly
adjust the smooth seismic mean spectrum to curve fit the
impedance log at every frequency such that the log input
Fig. 10 Seismic structural analysis at inline 5282
Fig. 11 Seismic chimneys analysis on inline 5282
Table 2 Estimated petrophysical parameters at well 0555
DEPTH INTERVAL NTG (%) VSh (%) Rt (Xm) Rw (Xm) /ND (%) F Sw (%) BVW (%) Swirr(%) K (mD) Sh (%)
R1 1907.22–1946.49 92.14 12.83 177.737 0.1468 27.75 10.52 10.36 2.87 7.25 5603.96 89.64
R2 1996.28–2083.57 89.99 8.17 181.480 0.1344 28.30 10.15 9.63 2.72 7.12 7764.42 90.37
R3 2092.86–2137.78 84.45 16.47 316.325 0.0919 23.50 14.67 7.20 1.70 8.56 1694.36 92.80
R4 2186.90–2224.52 68.64 11.01 54.970 0.0927 21.30 17.92 19.30 4.11 9.47 1178.48 80.70
J Petrol Explor Prod Technol (2018) 8:99–115 109
123
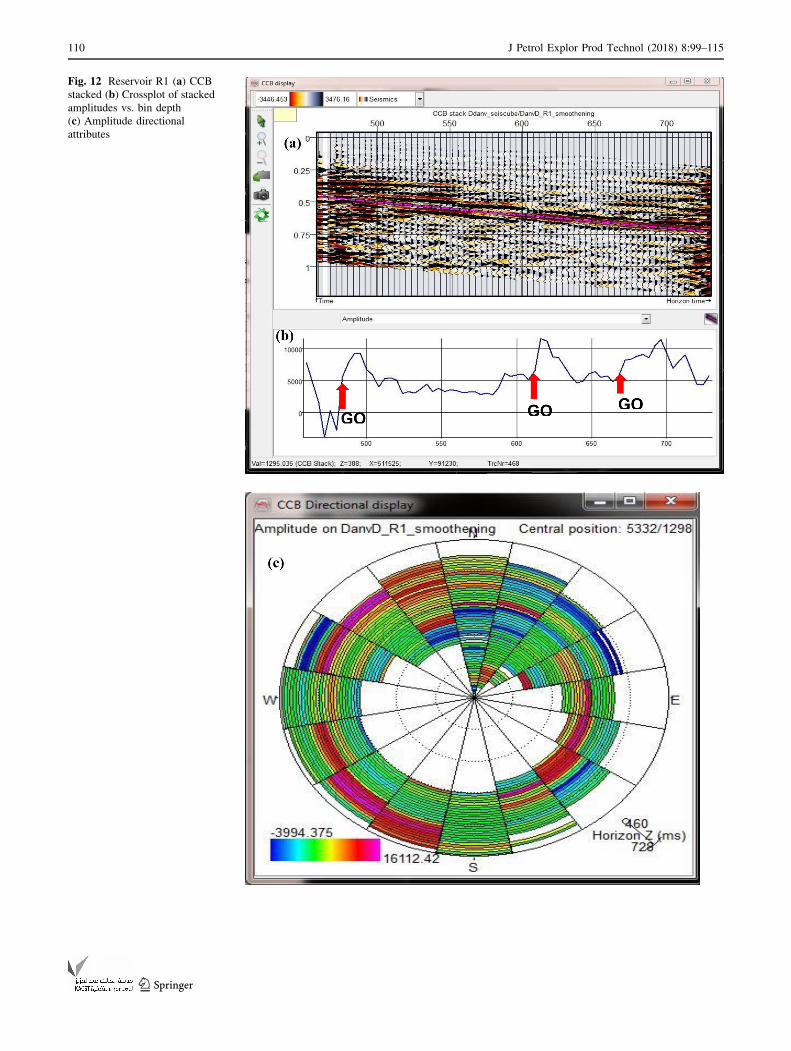
Fig. 12 Reservoir R1 (a) CCBstacked (b) Crossplot of stackedamplitudes vs. bin depth
(c) Amplitude directional
attributes
110 J Petrol Explor Prod Technol (2018) 8:99–115
123
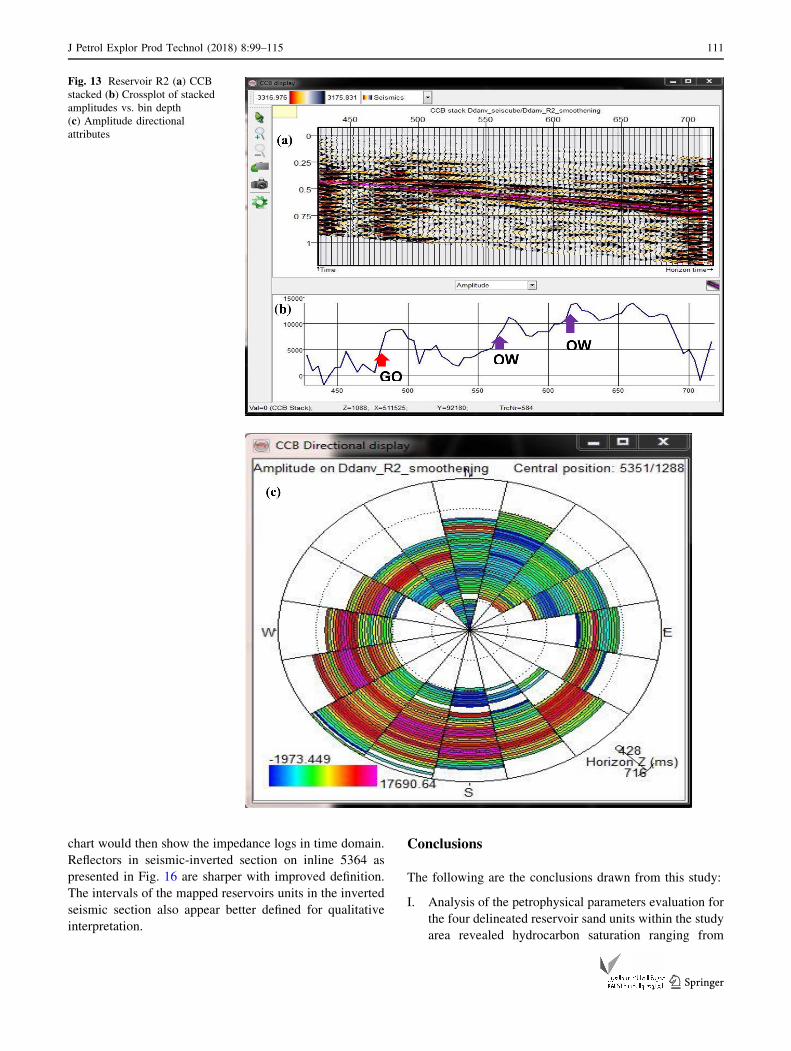
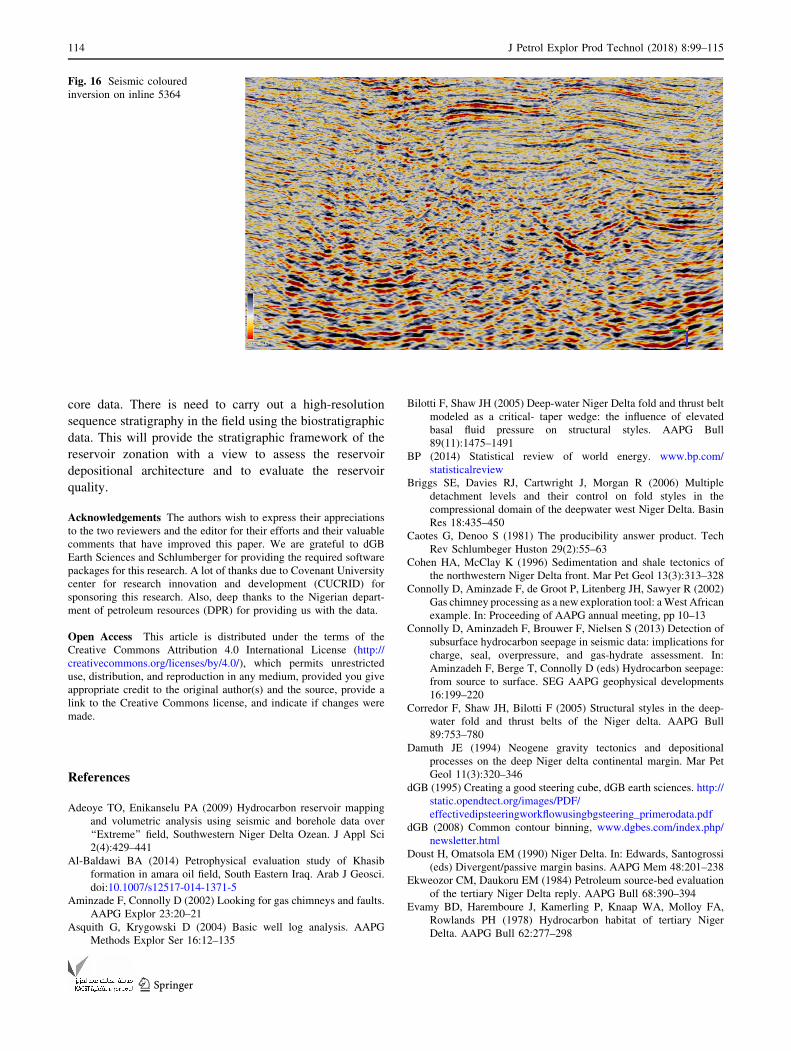
chart would then show the impedance logs in time domain.
Reflectors in seismic-inverted section on inline 5364 as
presented in Fig. 16 are sharper with improved definition.
The intervals of the mapped reservoirs units in the inverted
seismic section also appear better defined for qualitative
interpretation.
Conclusions
The following are the conclusions drawn from this study:
I. Analysis of the petrophysical parameters evaluation for
the four delineated reservoir sand units within the study
area revealed hydrocarbon saturation ranging from
Fig. 13 Reservoir R2 (a) CCBstacked (b) Crossplot of stackedamplitudes vs. bin depth
(c) Amplitude directional
attributes
J Petrol Explor Prod Technol (2018) 8:99–115 111
123
87.98 to 96.90% (well 0111), 80.70–92.80% (well
0555). Based on the estimated porosity and permeabil-
ity values, the reservoirs sand units have good potential
for hydrocarbon exploitation. The porosity values
range from 26.3 to 30.62% (well 0111),
21.30–28.30% (well 0555), while the permeability
values for both wells 0111 and 0555 range
2520.06–11,821.19 mD, and 1178.48–7764.42 mD,
respectively.
II. The estimation of the above-mentioned petrophysical
parameters did not consider structural uncertainties
that are based on definition of both fluid contacts and
fault plane. These uncertainties could result in ambi-
guity that can either overestimate or underestimate
both gross rock volume (GRV) and volume of
hydrocarbon in place.
III. Seismically derived chimneys were successful in
highlighting hydrocarbon migration pathways. The
delineated upwardly migration of hydrocarbon pool
in the study area localized closer to the surface. The
mapped faults seem to have lost their integrity; it
appears the faults are non-sealing as evident from the
Fig. 14 Common contour
binning (CCB) attributes
analysis on reservoir R1 (a) andR2 (b)
112 J Petrol Explor Prod Technol (2018) 8:99–115
123
chimney analysis. It is recommended that proposed
wells in this field should be within 600–1000 ms.
IV. Common contour binning (CCB) attributes revealed
that the reservoir sand unit R1 in is more of gas filled,
whereas R2 is oil filled. Both GOC and OWC
contacts were delineated and mapped across the
reservoir sand units.
V. Application of seismic coloured inversion on the
seismic volume has revealed the reflectors and
reservoir units sharper and clearer for further analysis
and qualitative interpretations. Subtle features were
better defined on the seismic sections for mapping.
Recommendations
Provisions of core data and biostratigraphic data are nec-
essary in this field for further research. It is important to
validate the estimated petrophysical parameters using the
Fig. 15 Parameters used for generating seismic coloured inversion
(SCI) (a) Raw seismic spectra, b smoothed version of the computed
seismic mean amplitude spectra, c residual operator, d extracted wells
impedance spectra, e global, this represents the computed mean of the
wells impedance spectra and the curve fit line, f design operator, this
was created by subtracting both mean amplitude spectra, rotating the
phase spectrum by - 90� and applying a bandpass filter
J Petrol Explor Prod Technol (2018) 8:99–115 113
123
core data. There is need to carry out a high-resolution
sequence stratigraphy in the field using the biostratigraphic
data. This will provide the stratigraphic framework of the
reservoir zonation with a view to assess the reservoir
depositional architecture and to evaluate the reservoir
quality.
Acknowledgements The authors wish to express their appreciations
to the two reviewers and the editor for their efforts and their valuable
comments that have improved this paper. We are grateful to dGB
Earth Sciences and Schlumberger for providing the required software
packages for this research. A lot of thanks due to Covenant University
center for research innovation and development (CUCRID) for
sponsoring this research. Also, deep thanks to the Nigerian depart-
ment of petroleum resources (DPR) for providing us with the data.
Open Access This article is distributed under the terms of the
Creative Commons Attribution 4.0 International License (http://
creativecommons.org/licenses/by/4.0/), which permits unrestricted
use, distribution, and reproduction in any medium, provided you give
appropriate credit to the original author(s) and the source, provide a
link to the Creative Commons license, and indicate if changes were
made.
References
Adeoye TO, Enikanselu PA (2009) Hydrocarbon reservoir mapping
and volumetric analysis using seismic and borehole data over
‘‘Extreme’’ field, Southwestern Niger Delta Ozean. J Appl Sci
2(4):429–441
Al-Baldawi BA (2014) Petrophysical evaluation study of Khasib
formation in amara oil field, South Eastern Iraq. Arab J Geosci.
doi:10.1007/s12517-014-1371-5
Aminzade F, Connolly D (2002) Looking for gas chimneys and faults.
AAPG Explor 23:20–21
Asquith G, Krygowski D (2004) Basic well log analysis. AAPG
Methods Explor Ser 16:12–135
Bilotti F, Shaw JH (2005) Deep-water Niger Delta fold and thrust belt
modeled as a critical- taper wedge: the influence of elevated
basal fluid pressure on structural styles. AAPG Bull
89(11):1475–1491
BP (2014) Statistical review of world energy. www.bp.com/
statisticalreview
Briggs SE, Davies RJ, Cartwright J, Morgan R (2006) Multiple
detachment levels and their control on fold styles in the
compressional domain of the deepwater west Niger Delta. Basin
Res 18:435–450
Caotes G, Denoo S (1981) The producibility answer product. Tech
Rev Schlumbeger Huston 29(2):55–63
Cohen HA, McClay K (1996) Sedimentation and shale tectonics of
the northwestern Niger Delta front. Mar Pet Geol 13(3):313–328
Connolly D, Aminzade F, de Groot P, Litenberg JH, Sawyer R (2002)
Gas chimney processing as a new exploration tool: aWest African
example. In: Proceeding of AAPG annual meeting, pp 10–13
Connolly D, Aminzadeh F, Brouwer F, Nielsen S (2013) Detection of
subsurface hydrocarbon seepage in seismic data: implications for
charge, seal, overpressure, and gas-hydrate assessment. In:
Aminzadeh F, Berge T, Connolly D (eds) Hydrocarbon seepage:
from source to surface. SEG AAPG geophysical developments
16:199–220
Corredor F, Shaw JH, Bilotti F (2005) Structural styles in the deep-
water fold and thrust belts of the Niger delta. AAPG Bull
89:753–780
Damuth JE (1994) Neogene gravity tectonics and depositional
processes on the deep Niger delta continental margin. Mar Pet
Geol 11(3):320–346
dGB (1995) Creating a good steering cube, dGB earth sciences. http://
static.opendtect.org/images/PDF/
effectivedipsteeringworkflowusingbgsteering_primerodata.pdf
dGB (2008) Common contour binning, www.dgbes.com/index.php/
newsletter.html
Doust H, Omatsola EM (1990) Niger Delta. In: Edwards, Santogrossi
(eds) Divergent/passive margin basins. AAPG Mem 48:201–238
Ekweozor CM, Daukoru EM (1984) Petroleum source-bed evaluation
of the tertiary Niger Delta reply. AAPG Bull 68:390–394
Evamy BD, Haremboure J, Kamerling P, Knaap WA, Molloy FA,
Rowlands PH (1978) Hydrocarbon habitat of tertiary Niger
Delta. AAPG Bull 62:277–298
Fig. 16 Seismic coloured
inversion on inline 5364
114 J Petrol Explor Prod Technol (2018) 8:99–115
123
Ferguson RJ, Margrave GF (1996) A simple algorithm for band-
limited impedance inversion. CREWES Res 8(21):1–10
Heggland R (2004) Using gas chimneys in seal integrity: a discussion
based on case histories. In: Boult P, Kardi J (eds) Evaluating
fault and caprock seals. AAPG Hedberg series, pp 237–245
Heggland R, Meldahl P, Brill B, de Groot P (1999) The chimney
cube, an example of semi-automated detection of seismic objects
by directive attributes and neural networks: part 2. Interpretation.
In: 69th Annual international meeting, SEG Expanded Abstracts,
pp. 935–940
Kulke H (1995) Nigeria. In: Kulke H (ed) Regional petroleum
geology of the world. Part II: Africa, America, Australia and
Antarctica: Berlin, Gebruder Borntraeger, pp 143–172
Lancaster S, Whitcombe D (2000) Fast track coloured inversion.
Expanded abstract, 70th SEG annual meeting, Calgary,
pp 1572–1575
Larinov VV (1969) Borehole radiometry: Moscow, U.S.S.R. Nedra
Levorsen AI (1967) Geology of petroleum, 2nd edn. W.H Freeman
and Co, San Francisco
Ligtenberg JH (2005) Detection of fluid migration pathways in
seismic data: implications for fault seal analysis. Basin Res
17:141–153
Ligtenberg JH, Thomsen RO (2003) Fluid migration path detection
and its applications for fault seal analysis. Basin Res 17:14–153
Meldahl P, Heggland R, Brill B, de Groot P (1999) The chimney
cube, an example of semi-automated detection of seismic objects
by directive attributes and neural networks: part 1. In: Method-
ology 69th annual international meeting, SEG, expanded
abstracts, pp 931–934
Meldahl P, Heggland R, Brill B, de Groot P (2001) Identifying faults
and gas chimneys using multi-attributes and neural networks.
Lead Edge 20:474–482
Mode AW, Anyiam OA, Aghara IK (2014) Identification and
petrophysical evaluation of thinly bedded low-resistivity pay
reservoir in the Niger Delta. Arab J Geosci. doi:10.1007/s12517-
014-1348-4
Morgan R (2004) Structural controls on the positioning of submarine
channels on the lower slopes of the Niger Delta. In: Davies RJ
et al. (eds). 3D Seismic technology: applications to the
exploration of sedimentary basins. Geol Soc Spec Mem,
pp 45–51
Morris RL, Briggs WP (1967) Using log-derived values of water
saturation and porosity, Trans. SPWLA annual logging sympo-
sium paper, pp 10–26
Opara AI (2010) Prospectivity evaluation of ‘‘Usso Field’’, onshore
Niger Delta basin using 3-D seismic and well log data. Petrol
Coal 52(4):307–315
OPEC (2016) Annual statistical bulletin. www.opec.org/opec_web/
en/publications/202.htm
Reijers TJA (2011) Stratigraphy and sedimentology of the Niger
Delta. Geologos 17(3):133–162
Schlumberger (1989) Log interpretation, principles and application,
schlumberger wireline and testing, Houston. Texas, pp 21–89
Shepherd M (2009) Where hydrocarbons can be left behind, in oil
field production geology. AAPG Mem 91:211–215
Sutrisno WT, Prahastudhi S, Bahri AS, Wulandari YP (2013)
Application of common contour binning (CCB) and back
propagation neural network for oil water contact prediction in
carbonate reservoir. In: Proceeding of Indonesian petroleum
association 37th annual convention and exhibition
Swissi A, Morozov IB (2009) Impedance of blackfoot 3D seismic
dataset CSPG/CSEG/CWLS Geoconvention 2009 Calgary
Alberta Canada
Tingdahl KM (2003) Improving seismic chimney detection using
directional attributes. In: Nikravesh M, Aminzadeh F, Zadeh LA
(eds) Soft computing and intelligent data analysis in oil
exploration. Dev Petrol Sci 51:157–173
Veeken PCH, Da Silva M (2004) Seismic inversion methods and
some of their constraints. First Break 22:48–70
Wyllie MRJ, Gregory AR, Gardner LW (1956) Elastic wave
velocities in heterogeneous and porours media. Geophysics
21(1):41–70. doi:10.1190/11438217
Zhao Z, Yang R, Ma Y (2013) Method for pinpointing the contacts of
oil, gas and water by common contour binning stacking and its
application. Nat Gas Geosci 24(4):808–814
Publisher’s Note
Springer Nature remains neutral with regard to jurisdictional claims in
published maps and institutional affiliations.
J Petrol Explor Prod Technol (2018) 8:99–115 115
123