hydrocarbon research internship - prince william … · hydrocarbon research internship . date: 5...
TRANSCRIPT

Hydrocarbon Research Internship
Prince William Sound
Regional Citizen’s Advisory Council
May 2016
By Seth Suydam
The opinions expressed in this PWSRCAC-commissioned report are not necessarily those of PWSRCAC.
500.431.160501.InternHCResearch
i
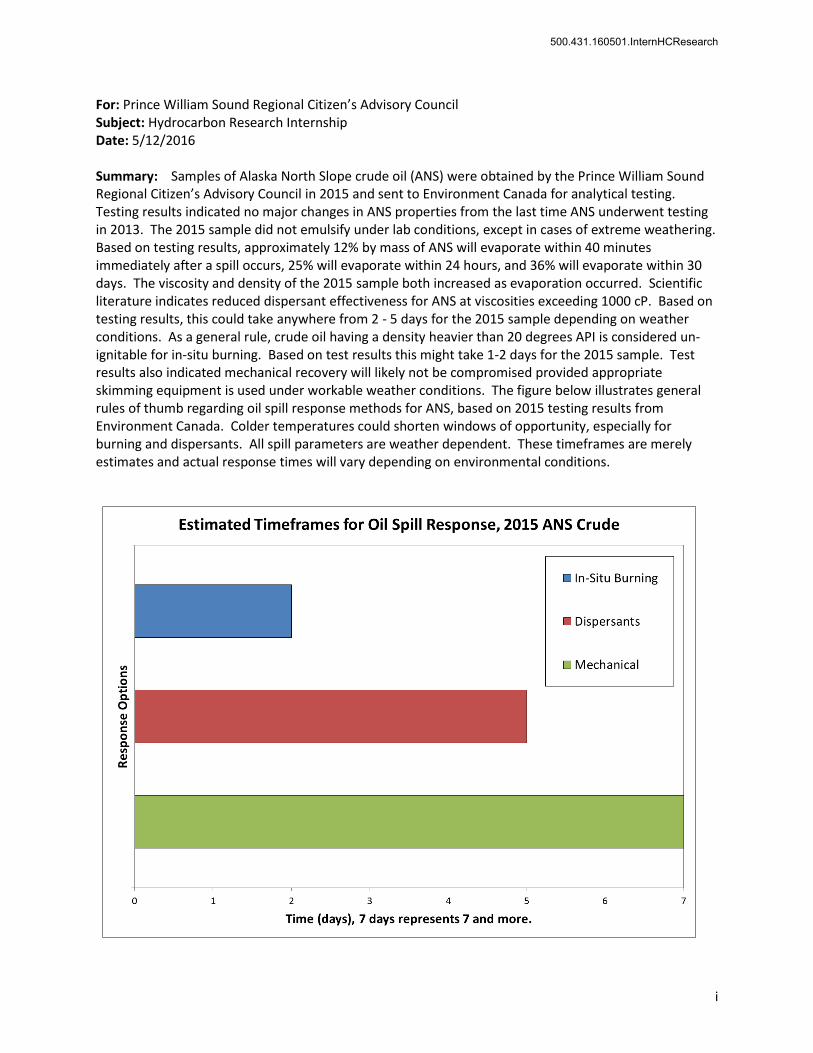
For: Prince William Sound Regional Citizen’s Advisory Council Subject: Hydrocarbon Research Internship Date: 5/12/2016 Summary: Samples of Alaska North Slope crude oil (ANS) were obtained by the Prince William Sound Regional Citizen’s Advisory Council in 2015 and sent to Environment Canada for analytical testing. Testing results indicated no major changes in ANS properties from the last time ANS underwent testing in 2013. The 2015 sample did not emulsify under lab conditions, except in cases of extreme weathering. Based on testing results, approximately 12% by mass of ANS will evaporate within 40 minutes immediately after a spill occurs, 25% will evaporate within 24 hours, and 36% will evaporate within 30 days. The viscosity and density of the 2015 sample both increased as evaporation occurred. Scientific literature indicates reduced dispersant effectiveness for ANS at viscosities exceeding 1000 cP. Based on testing results, this could take anywhere from 2 - 5 days for the 2015 sample depending on weather conditions. As a general rule, crude oil having a density heavier than 20 degrees API is considered un-ignitable for in-situ burning. Based on test results this might take 1-2 days for the 2015 sample. Test results also indicated mechanical recovery will likely not be compromised provided appropriate skimming equipment is used under workable weather conditions. The figure below illustrates general rules of thumb regarding oil spill response methods for ANS, based on 2015 testing results from Environment Canada. Colder temperatures could shorten windows of opportunity, especially for burning and dispersants. All spill parameters are weather dependent. These timeframes are merely estimates and actual response times will vary depending on environmental conditions.
500.431.160501.InternHCResearch
Table of Contents Executive Summary .................................................................................................................................. i 1. Crude Oil Chemical and Physical Properties ......................................................................................... 1
1.1 Chemical composition ........................................................................................................... 1 1.2 Examples of physical properties - interfacial tension and flash point ................................... 2 1.3 Two critical properties - viscosity and density ....................................................................... 3 2. Overview of Weathering Processes ...................................................................................................... 4 2.1 Evaporation ........................................................................................................................... 4 2.2 Emulsification ........................................................................................................................ 4 2.3 Other weathering processes ................................................................................................. 5 3. Oil Properties and Spill Response Technologies ................................................................................... 6 3.1 Dispersants ............................................................................................................................ 6 3.2 In-situ burning ....................................................................................................................... 7 3.3 Mechanical recovery ............................................................................................................. 7 4. Presentation of 2015 ANS Testing Results ........................................................................................... 8 4.1 Viscosity ................................................................................................................................ 8 4.2 Density .................................................................................................................................. 9 4.3 Emulsion formation tendency ............................................................................................. 9 4.4 Change in ANS properties over time ................................................................................... 10 4.5 Weathering rates .............................................................................................................. 10 5. Window of Opportunity for Spill Response .................................................................................... 11 6. Conclusion and Summary .................................................................................................................... 12 7. References ........................................................................................................................................... 13 Appendix A: Figures Appendix B: Tables
500.431.160501.InternHCResearch
1
1. Crude Oil Chemical and Physical Properties
A property is any characteristic that can be observed or measured. For example, a
crude oil’s color can be observed and wax content and sulfur content can be measured.
Therefore, these characteristics are properties of crude oil. Common crude oil properties
tested in a lab are chemical composition, interfacial tension, flash point, viscosity, and density.
In order to further illustrate how crude oil’s physical and chemical properties may be broken
down, a brief discussion of each follows. Two main properties - viscosity and density - are
widely considered as being the best indicators for how effective oil spill response technologies
will be.
1.1 Chemical Composition
Crude oil is a mixture of hundreds of different kinds of molecules, and these molecules
are roughly divided into four categories: saturates, aromatics, resins (polar), and asphaltenes
(SARA). SARA content is the distribution of crude oil within each category by percent weight.
Saturates are typically light weight, straight chained hydrocarbons and make up the majority of
crude oil. Aromatics are identified by a chemical bond called a benzene ring, and are
considered to be highly toxic. Asphaltenes and resins are typically heavier molecules and
increase a crude oil’s tendency to form emulsions (1, p.93). Figure 1 illustrates these different
types of chemicals. All figures are located in Appendix A and Tables in Appendix B, attached to
this report.
Chemical composition is important because it determines what a crude oil’s physical
properties are. No two crude oils have the exact same chemical composition. This is because
500.431.160501.InternHCResearch
2
crude oil varies from region to region based on the geological formation, and oil gradually
changes over time as it is produced from a well. Typically, oil becomes heavier and more
viscous as a reservoir is depleted.
1.2 Examples of Physical Properties - Interfacial Tension and Flash Point
Different fluids, for instance oil and water, are separated at a boundary called an
interface. Interfacial tension describes how much resistance exists between separating two
fluids at their interface, and is usually given in mili-Newtons per meter (mN/m). When
interfacial tension is taken between liquid and air, it is referred to as surface tension (2, p.6).
Low interfacial tension results in oil spreading out more over water and being able to form
smaller droplets in water. In fact, dispersants work by lowering oil’s interfacial tension to that
of surrounding sea conditions, which allows sea energy to disperse oil into the water column (3,
p.12). Interfacial tension usually varies only a small amount between different crude oils (4,
p.3).
Flash point is “the lowest temperature at which a substance can vaporize to form an
ignitable mixture” (5, p.11). Flash point is given in degrees Celsius (°C) or Fahrenheit (°F). It is
an important property for safety considerations such as during cleanup or handling operations.
It also influences how easily the oil will ignite during in-situ burning. Because flash point
describes how readily the oil vaporizes, it has no appreciable effect on how oil behaves as a
fluid during an oil spill.
500.431.160501.InternHCResearch

3
1.3 Two Critical Properties - Viscosity and Density
As previously mentioned, two properties are used as major indicators to predict how an
oil will behave during a spill and how effective any particular cleanup technology will be.
Viscosity is a fluid property which describes how much resistance internal layers of fluid
encounter when flowing past each other. Its units are centi-Poise (cP), or milli-Pascal seconds
(mPa-s) - which is equivalent to cP. An example of a high viscosity fluid is molasses, which has a
viscosity of roughly 10,000 cP. For comparison, water has a viscosity of 1 cP. Centi-Poise is
actually used when referring to dynamic or absolute viscosity. Another way of stating viscosity
is kinematic viscosity, which is dynamic viscosity divided by density, with units of centi-Stokes
(cSt). What’s different between dynamic viscosity and kinematic viscosity is that the first
measures a fluid’s absolute resistance to flow, and the other is a derived quantity which
describes a fluid’s resistance to flow under gravity.
Density describes the mass per unit volume of a substance. Typical units are grams per
cubic centimeter (g/cm3). Often, density is expressed as some fraction of the density of fresh
water. This is called specific gravity. Oil floats on top of water because it is less dense than
water, which is why specific gravity is a desired value. Oil industries also have a way of
expressing crude oil density called API gravity, which is given in units of degrees API (°API). API
gravity is somewhat counter-intuitive; higher °API values correspond with less dense oils and
smaller °API values mean denser oils. In 2015 Alaska North Slope crude oil (ANS) had an API
gravity of 31, and was designated as a ‘light’ to ‘medium’ crude oil - see Table 1 (6, p.4).
500.431.160501.InternHCResearch
4
2. Overview of Weathering Processes
Despite what crude oil properties may be while oil is being transported, once oil is
spilled into the marine environment its properties will change with time. Weathering processes
act upon oil once it is spilled and cause changes to the oil’s chemical composition and physical
properties. Such weathering processes include evaporation, emulsification, dissolution,
microbial oxidation, and photo-oxidation. Two critical weathering processes are evaporation
and emulsification.
2.1 Evaporation
Evaporation occurs when oil is exposed to open air and lighter molecules escape into
the atmosphere. Evaporation occurs very rapidly immediately after an oil spill occurs, and
gradually decreases with time. This may be observed and measured in a lab by allowing a
sample of crude oil to evaporate under controlled conditions, and taking sample weights
periodically to see how much is lost to evaporation. Figure 2 represents evaporation curves for
various kinds of petroleum, with lighter petroleum evaporating more due to higher amounts of
lighter molecules. Since evaporation removes lighter molecules and leaves heavier ones,
evaporation increases density and viscosity (7, p.74).
2.2 Emulsification
When crude oil is spilled in water, energy from waves and the sea can cause oil to
uptake tiny water droplets. Once they penetrate, these water droplets may stabilize inside oil
due to viscous entrainment and surfactant-like action from asphaltenes and resins. Crude oil
500.431.160501.InternHCResearch
5
exposed to sea energy will likely uptake water, and if an emulsion forms the water will not
separate out very quickly. Emulsification acts to increase spill volume (through increasing
water content), oil viscosity, and density. A stable water-in-oil emulsion can contain anywhere
from 60-80% water by weight - see Table 2 (1, p.93). Emulsified crude is sometimes called
mousse and can become a highly viscous, almost semi-solid material. Mousse was encountered
during the Exxon Valdez oil spill cleanup. While freshly spilled oil may not form an emulsion
immediately, once evaporation occurs and asphaltene and resin concentrations increase, the oil
has a greater tendency to quickly emulsify (3, p.6).
2.3 Other Weathering Processes
Other weathering processes include dissolution, photo oxidation, and microbial
degradation, and are not as important in terms of predicting oil spill behavior. Dissolution is
loss of water-soluble components, such as toxic aromatic compounds, into the water column.
Photo-oxidation and microbial degradation fall under oxidative processes which break down
and transform hydrocarbons. Photo oxidation could potentially be heightened by longer
periods of sunlight during Alaska summers.
Microbial degradation acts to breakdown crude oil into different substances. When oil
is separated into tiny droplets, biodegradation can occur at a faster rate because more surface
area is available for micro-organisms to attach, whereas tar balls and mousse degrade
extremely slowly (8, p.77). It is thought chemical dispersants speed up natural microbial
degradation; however, evidence from dispersant research does not reinforce such claims.
Another way microbial degradation has been altered is through fertilizers. Fertilizer additives
500.431.160501.InternHCResearch
6
used during Exxon Valdez spill cleanup activities reportedly increased biodegradation by 3 - 5
times (7, p.83).
3. Oil Properties and Spill Response Technologies
When crude oil is weathered by evaporation and emulsification, clean-up technologies
gradually lose effectiveness. Eventually, a point is reached where a particular clean up
technology may no longer be a viable option. Here are some general examples of how crude oil
properties impact spill response.
3.1 Dispersants
During a real oil spill, dispersant effectiveness is largely weather dependent and can be
affected by ambient conditions of the surrounding environment such as temperature or water
salinity. For example, dispersants typically work better in saline water, and are less efficient in
lower salinities. However, oil viscosity may be used to roughly indicate how effective
dispersant application will be. According to the CNA report, Oil Properties and Their Impact on
Spill Response Options, dispersants become less effective as weathering occurs and oil increases
in viscosity (5, p.25). Through conducting a literature review of dispersant studies, CNA found
ranges of dispersant effectiveness based on different ranges of ANS viscosity. Table 3, taken
from the CNA report, shows how dispersants are no longer a viable response option for ANS
once viscosity exceeds 10,000 cP.
500.431.160501.InternHCResearch
7
3.2 In-Situ Burning
In-Situ Burning involves igniting an oil spill in place in order to remove it from water
through burning. How easily an oil spill is ignited may depend on several things including how
readily it vaporizes or how much water content it has. In general, lighter oils ignite more readily
than heavier oils due to increased evaporation of lighter hydrocarbons. The CNA report
identifies API gravity as being the single biggest predictor of ignitability (5, p.18). CNA again
determined ranges of API gravity for in-situ burning effectiveness by conducting a literature
review of various testing reports. Table 4 indicates API gravity boundaries for burning based on
the CNA report. Heavy oils with an API gravity of 20 or less are no longer ignitable (5, p.18).
3.3 Mechanical Recovery
Mechanical equipment may be used to physically separate oil from the underlying water
column, thus removing it without using any chemicals or burning. Many different types of
mechanical oil recovery equipment, called skimmers, are manufactured. For instance, weir
skimmers allow floating oil to pass over a lip into the skimmer, and brush skimmers attract oil
onto rotating brushes. Figure 3 shows which type of skimmers are useful with increasing oil
viscosity. The American Society of Testing and Materials (ASTM) standard skimmer categories
are given in Table 5. Typically weir skimmers are more effective in lower viscosity oils and
brush or drum skimmers are more effective in weathered, high viscosity oil (5, p.41). Important
to note is hybrid skimmers with new technologies, for instance disk skimmers with micro brush
coatings on the disks, may be effective beyond the typical ranges shown in Figure 3.
500.431.160501.InternHCResearch
8
4. Presentation of 2015 ANS Testing Results
The Prince William Sound Regional Citizen’s Advisory Council (PWSRCAC) obtained a
sample of ANS in 2015 and had it shipped to an Environment Canada lab for testing.
Environment Canada is Canada’s equivalent to the US Environmental Protection Agency or EPA.
PWSRCAC had this testing done in parallel with industry tests performed by SL Ross
Environmental Research Ltd in order to compare results. Both testing agencies reported very
similar findings. A few of Environment Canada’s testing results will now be discussed.
4.1 Viscosity
Figure 4 contains 2015 ANS viscosity testing results from Environment Canada. Test
procedures allowed the ANS sample to evaporate under laboratory conditions in order to
simulate weathering. Samples were tested at different evaporative mass losses to see how
properties change with weathering. Figure 4 shows two separate curves, one at 0 degrees
Celsius (32 °F) and one at 15 degrees Celsius (59 °F). Tests were done at different temperatures
to simulate differences between summer and winter conditions. Viscosity is temperature
dependent, and lower temperatures resulted in higher viscosity. Figure 4 is a representation of
how viscosity increases over time with weathering. Table 3 indicates the effectiveness of
dispersants is reduced to less than 70 percent once ANS viscosity exceeds 1000 cP. Using lines
of best fit with Figure 4, this value could be reached after ANS is approximately 25.2 to 35.9
percent evaporated, depending on temperature.
500.431.160501.InternHCResearch
9
4.2 Density
ANS density in 2015 is shown as API gravity in Figure 5. Two different curves are again
shown for two different temperatures. A high API gravity corresponds to a light crude oil. At
time zero, ANS is a light oil. As evaporation occurs, ANS becomes heavier due to removal of
light molecular-weight compounds. Density is also temperature dependent and increases with
colder temperatures due to thermal contraction of materials. Table 4 indicates how easily
crude oil may be ignited using API gravity, as a general rule of thumb. Once oil has weathered
to the point where API gravity falls to 20 or less, in-situ burning may no longer be usable. Using
lines of best fit with Figure 5, this point may be reached once ANS has evaporated
approximately 25.9 to 30.9 percent, depending on temperature. Both Figures 4 and 5 indicate
cold temperatures are worse for oil spill cleanup efforts. For example, at colder temperature,
ANS would only have to evaporate 25.9% before in-situ burning becomes unusable, versus
30.9% evaporative loss for warm temperature.
4.3 Emulsion Formation Tendency
Results presented so far have indicated how viscosity and density change with
evaporation. ANS samples were also tested for emulsion formation tendency at various stages
of evaporation. Those results are summarized in Table 6. Based on Environment Canada’s
observations, ANS is not likely to form an emulsion until it has undergone extensive
evaporation over a long time period. The resulting emulsion which formed had relatively low
water content, approximately 20 percent water by weight.
500.431.160501.InternHCResearch

10
Emulsion formation tendency and ability are greatly affected by asphaltene and resin
contents. Figure 6 shows SARA content of 2015 ANS at four stages of evaporation. Asphaltene
and Resin contents steadily increase with weathering, however, these compositions apparently
were not enough to cause ANS to form a stable emulsion.
4.4 Change in ANS Properties Over Time
Test data over a 10 year span indicate little change in ANS properties. Figure 7 shows
ANS density over an approximate 10 year span, from 2004 to 2015. Testing results have been
nearly identical during this time frame. This trend indicates there are no expected changes in
ANS properties, at least not in the near future.
Looking back over a longer time frame, ANS properties have changed. Figure 8 shows
ANS testing for density, with results going back to 1983 (3, p.7). Since Exxon Valdez, ANS has
gotten lighter because lighter, more valuable oil fields have been developed on the North
Slope. As previously mentioned, mousse emulsion was encountered during the Exxon Valdez
spill. This is because ANS had different properties in 1989 - it was much denser than it is today.
If ANS density increased in the future, the tendency of ANS to form an emulsion could also be
increased depending on chemical composition. This could happen for instance if oil companies
produced different oil fields on the slope.
4.5 Weathering Rates
Laboratory results have so far indicated evaporation will have the most significant
effects on ANS crude’s properties, since ANS is unlikely to emulsify. Figure 9 shows laboratory
500.431.160501.InternHCResearch
11
results for evaporative testing of ANS (6, p.5). This data was obtained by allowing the sample to
evaporate under controlled conditions, and then taking sample weights periodically to see how
much was lost to evaporation. A logarithmic equation was fitted to the data in order to
calculate a precise time for any stage of evaporation. Table 7 shows calculated times based on
this equation to reach each of the 3 evaporative percent losses used in testing. These are
approximately one third and two thirds of total evaporation of 36%. Table 7 shows the first
third is gone within 40 minutes, the second third takes an additional 24 hours, and to get the
last third to evaporate takes an additional 30-some days. These results are consistent with
general evaporation trends of petroleum (Figure 2).
5. Window of Opportunity for Spill Response
Laboratory testing allows us to predict ANS crude properties at various stages of
weathering, and determine approximately how long it would take for those changes to occur.
Windows of opportunity for each spill response method may be defined using testing results as
guidelines. Examples of such timeframes are shown in Figure 10 for three major recovery
techniques. Actual windows of opportunity will vary depending on weather and ambient
environmental conditions; these guidelines are merely to be taken as general rules of thumb.
Colder temperatures may shorten the windows of opportunity for in-situ burning and
dispersants. The CNA report estimates light crude oils may remain burnable for 40 to 60 hours
after a spill, therefore estimated timeframe for using in-situ burning is approximately 2 days (5,
p. 19). The timeframe for using dispersants was determined based on how long it would take
to reach 30% evaporative loss, which is roughly the midpoint between warm and cold
500.431.160501.InternHCResearch

12
temperature results for 1000 cP viscosity (Figure 4). Using the equation from Figure 9 to solve
for time t, this would take approximately 5 days. Therefore, the initial 5 days after an oil spill is
an estimated timeframe for when dispersants will be most effective. Mechanical recovery
encountered no hold-ups at either temperature range. Based on Tables 8 and 9, ANS oil falls
within ASTM categories I, II, and II - III depending on weathering and temperature. Prince
William Sound has a variety of skimming equipment suitable for effective response in those
category ranges. Therefore, mechanical recovery has no discernable time limit. While testing
results indicate ANS is unlikely to emulsify, it is worth noting that high sea energy could cause
water uptake. This would adversely affect mechanical recovery - for instance having to deal
with higher volumes of fluid.
6. Conclusions and Summary
Testing results requested by PWSRCAC indicate no major changes in 2015 for ANS crude
oil properties from prior testing done in 2013. Trends indicate ANS properties such as viscosity
and density are remaining relatively constant. However, ANS properties could change if
different oil fields are produced on Alaska’s North Slope or if reservoir depletion leads to
changes in oil currently being produced.
Laboratory testing of ANS provides hard scientific data for determining the
appropriateness of oil spill response methods. Based on 2015 testing results, Prince William
Sound would have appropriate response options in place during the event of an oil spill. Cold
temperatures could shorten the window of opportunity for using response options like
dispersants and in-situ burning. However, mechanical recovery, the primary cleanup
500.431.160501.InternHCResearch
13
technology for Prince William Sound, would likely remain effective over a wide range of
temperatures and oil properties. Actual windows of opportunity for spill response will vary
depending on ambient environmental conditions.
7. References
[1] Oil in the Sea III: Inputs, Fates, and Effects. National Research Council, The National Academies Press, 2003
[2] Wang et al., Characteristics of Spilled Oils, Fuels, and Petroleum Products: 1. Composition and Properties of Selected Oils, Environment Canada, July 2003 [3] Spill Related Properties of ANS Crude in 2015, SL Ross Environmental Research Ltd., June 2015 [4] Fingas Merv, Analytical Data on Crude Oils Necessary for Oil Spill Work, June 2008 [5] Federici, Mintz, Oil Properties and Their Impact on Spill Response Options; Literature Review, CNA Analysis & Solutions, May 2014 [6] Hollebone, Bruce, Physical Properties, Behavior and Composition of Alaskan North Slope Crude Oil, Environment Canada, Ottowa, February 2016 [7] Responding to Oil Spills in the U.S. Arctic Marine Environment. National Research Council, the National Academies Press, 2014 (NRC, 2014) [8] Marine Pollution, 5th edition, Clark, R.B., Oxford University Press, 2001 (Clark, 2001)
500.431.160501.InternHCResearch

Appendix A: Figures
500.431.160501.InternHCResearch
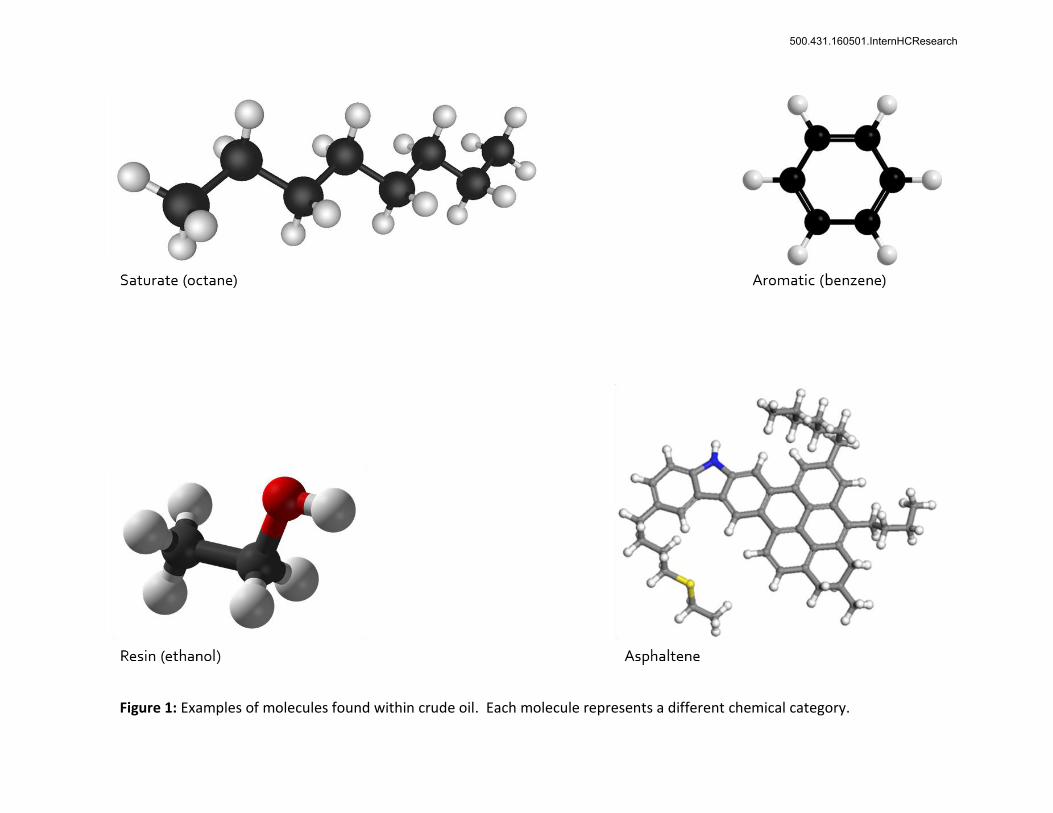
Figure 1: Examples of molecules found within crude oil. Each molecule represents a different chemical category.
500.431.160501.InternHCResearch

Figure 2: Evaporation curves of various petroleum products. (adapted from The Basics of Oil Spill Cleanup, Merv Fingas, 2013)
500.431.160501.InternHCResearch

Figure 3: Effectiveness of different skimmer types with increasing viscosity. (from Oil Properties and Their Impact on Spill
Response Options, Carolyne Federici, Jonathon Mintz, 2014)
500.431.160501.InternHCResearch

Figure 4: Graph of ANS viscosity as a result of weathering, 2015. (source: Environment Canada)
500.431.160501.InternHCResearch

Figure 5: Graph of ANS API gravity as a result of weathering, 2015. (source: Environment Canada)
500.431.160501.InternHCResearch

Figure 6: SARA content of ANS as a result of weathering, 2015. (source: Environment Canada)
500.431.160501.InternHCResearch

Figure 7: ANS crude oil properties over a 10 year span. (source: Environment Canada)
500.431.160501.InternHCResearch
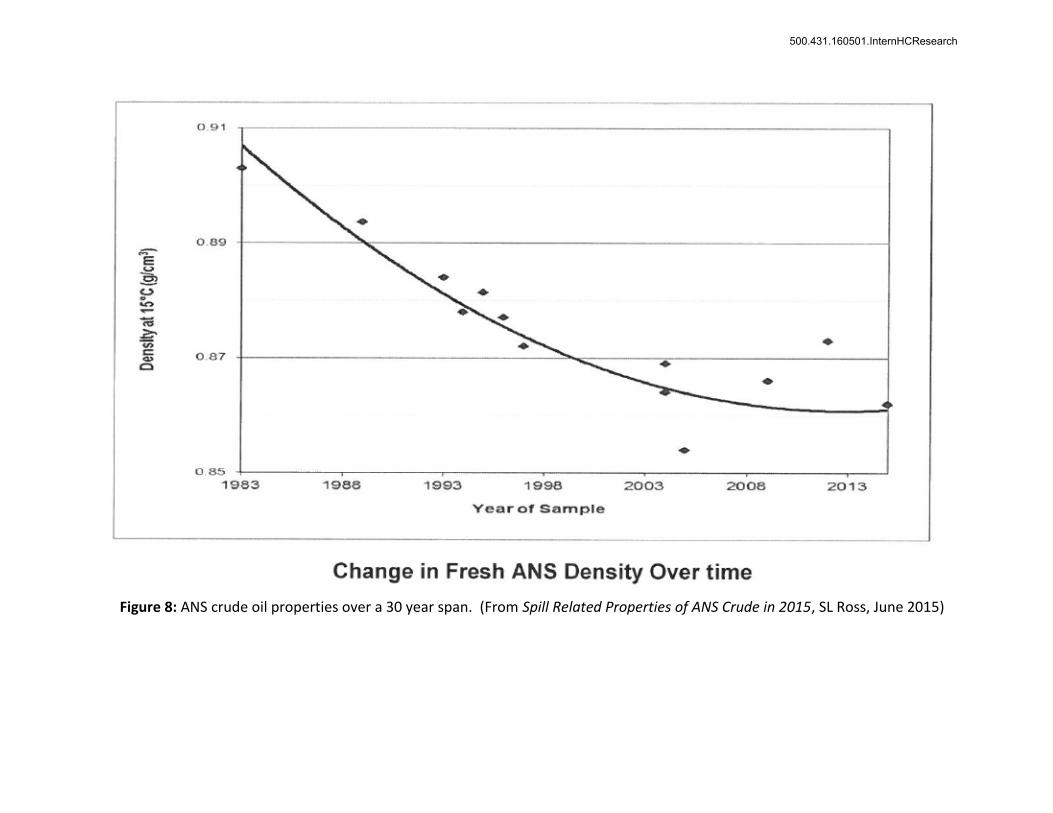
Figure 8: ANS crude oil properties over a 30 year span. (From Spill Related Properties of ANS Crude in 2015, SL Ross, June 2015)
500.431.160501.InternHCResearch

Figure 9: Evaporation Curve of ANS, 2015. (from Physical Properties, Behaviour, and Composition of
Alaskan North Slope Crude Oil, Environment Canada, February 2016)
500.431.160501.InternHCResearch

Figure 10: Using laboratory testing results to determine windows of opportunity for oil spill response options. (source:
Environment Canada)
500.431.160501.InternHCResearch

Appendix B: Tables
500.431.160501.InternHCResearch
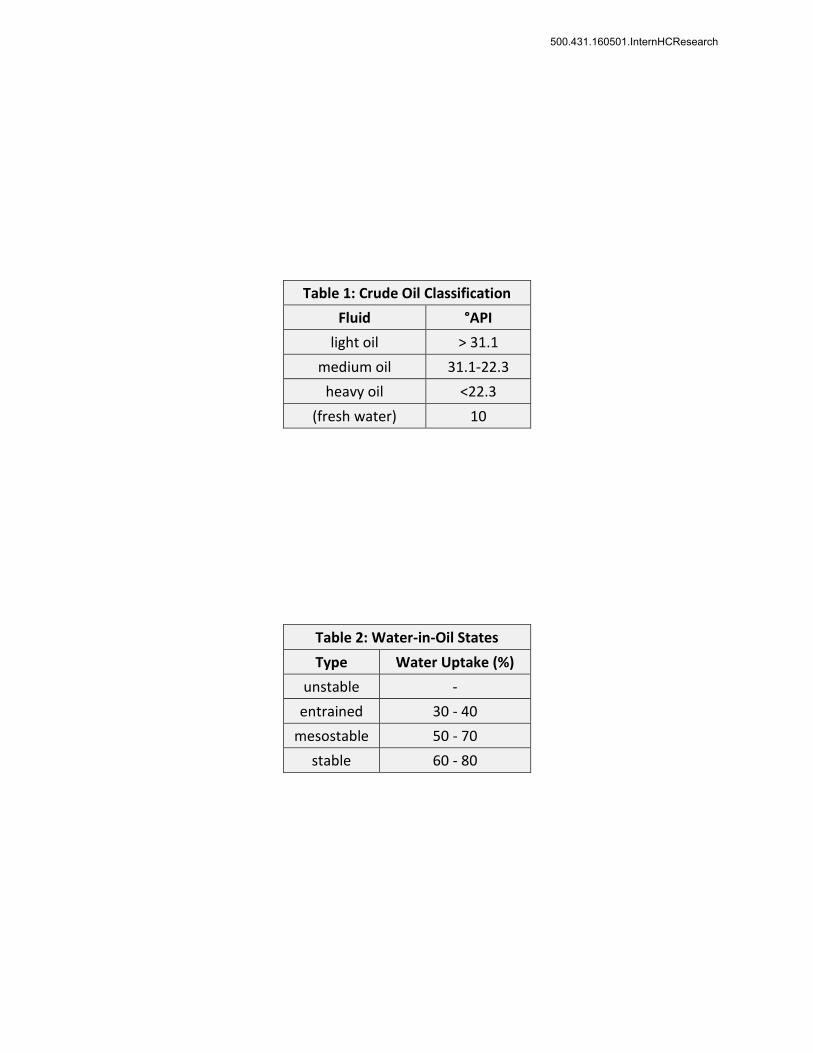
Table 1: Crude Oil Classification
Fluid °API
light oil > 31.1
medium oil 31.1-22.3
heavy oil <22.3
(fresh water) 10
Table 2: Water-in-Oil States
Type Water Uptake (%)
unstable -
entrained 30 - 40
mesostable 50 - 70
stable 60 - 80
500.431.160501.InternHCResearch

Table 3: Dispersability of ANS
Category Viscosity
(cP) Effectiveness
(%)
dispersable < 1,000 > 70
reduced dispersability
1,000 - 10,000
70 - 5
not dispersable > 10,000 < 5
Source: Oil Properties and Their Impact on Spill Response Options, CNA 2014
Table 4: In-Situ Burning
Category °API
easy to burn > 35
burnable, variable ignitability
35 - 20
unignitable < 20
Source: Oil Properties and Their Impact on Spill Response Options, CNA 2014
500.431.160501.InternHCResearch

Source: Oil Properties and Their Impact on Spill Response Options, CNA 2014
Table 6: 2015 ANS Emulsion Tendency & Stability
% Evaporative Mass Loss
Emulsion Stability
Water Content Viscosity (cP)
0.00 Unstable 0.04 66
12.42 Unstable 0.20 100
24.56 Unstable 1.03 200
36.76 Meso-Stable 22.80 2400
Table 5: ASTM Skimmer Categories
500.431.160501.InternHCResearch

Table 7: Weathering Time for 2015 ANS
Mass Loss (% Ev.) 0.00 12.42 24.56 36.76
Time - 39.1 minutes 23.5 hrs 35.9 days
Table 8: 2015 ANS Properties, 0° C
Mass Loss (% Ev) Density (g/mL)
Kinematic Viscosity
(cSt)
ASTM Skimmer Category
0.00 0.88 20 < I
12.42 0.91 104 I
24.56 0.93 799 I - II
36.76 0.96 8812 II - III
500.431.160501.InternHCResearch

Table 9: 2015 ANS Properties, 15° C
Mass Loss (% Ev) Density (g/mL)
Kinematic Viscosity
(cSt)
ASTM Skimmer Category
0.00 0.86 10 < I
12.42 0.90 41 < I
24.56 0.92 185 I
36.76 0.94 1496 II
500.431.160501.InternHCResearch