hydrocarbon dew point article - oct 2004
TRANSCRIPT

Hydrocarbon Dew-point – A Key Natural Gas Quality Parameter
Natural Gas as an Energy Resource
Around a quarter of the World’s energy is produced from natural gas, making it the second largest resource after petroleum. The largest reserves of natural gas are found in the Middle East, Northern Europe and Russia, accounting for more than three-quarters of the World’s total resources. It is estimated that current and known (but as yet untapped) natural gas
resources will satisfy demand for at least the next fifty years, but in reality it is likely to be longer.
De-regulation in the European gas markets, coupled with the development of a massive Continental inter-connection pipeline system, has resulted in a huge market for the production, transportation and sale of gas. In recent years there has been a significant changeover from large thermal and nuclear power plant to smaller, local natural gas-fired or CCGT (Combined Cycle Gas Turbine) power plant, further increasing demand. In the automotive industry, the push to develop more eco-friendly fuels is likely to increase demand for natural gas even further as CNG (Compressed Natural Gas) technology becomes more widely available. According to the International Association for Natural Gas Vehicles, there are already more than 3.5 million vehicles powered by natural gas World-wide, and more than 7,000 natural gas re-fuelling stations. Consumption will increase rapidly in the coming years as the CNG infrastructure is developed further, enabling more domestic customers to opt for greener, cheaper CNG than for traditional gasoline or diesel fuels.
The Quality of Natural Gas

What is natural gas? In essence, it is a mixture of various hydrocarbon and inorganic gas compounds that have been produced over thousands of years by the de-composition of carboniferous material trapped in underground formations. Generally it consists of a large proportion of methane, with reducing concentrations of higher straight chain alkane components and various impurities such as carbon dioxide, hydrogen sulphide and usually saturated with water vapour and some heavy-end liquid hydrocarbon compounds.
It is obvious that when natural gas is extracted in this contaminated fashion, it is not suitable for distribution or sale, let alone for use by the end consumer. First, the gas must be processed to remove any undesirable components and render it safe for transmission and consumption. The first process to be carried out is the removal of bulk liquids from the gas stream, utilising a separation process that removes both hydrocarbon liquids and water, using a simple heat exchange mechanism. Depending on the gas composition, it may then be clean enough to compress and transport to a remote processing plant (perhaps on-shore if the gas has been extracted from a deep-sea gas field) or may require further processing to remove contaminants such as the inorganic gases and heavy hydrocarbons prior to compression and transportation.
Wherever the processing occurs, the objective is always the same – to produce a gas suitable for high-pressure transportation and with the appropriate chemical and physical characteristics to render it suitable for sale and for combustion. The determining parameters in terms of the gas quality are many and varied, but essentially are based around two main criteria – safety and value. In terms of safety, the gas must not be overly corrosive or introduce risk of pipeline, plant or domestic appliance failure. In practice this means that corrosive components such as hydrogen sulphide and carbon dioxide must be removed and that excess water and condensable hydrocarbon content must be reduced to a level that will prevent condensation anywhere in the downstream pipeline system. Removal of water and heavy hydrocarbons is particularly important as an excess of these components, leading to condensation in
adverse conditions, can cause hydrate formation within the pipeline leading to excessive pressure drop and potential blocking of the pipe. In terms of value, the equation is simple: the gas is processed to give it the best balance of value (measured by it’s calorific value) against processing cost. Removal of water and heavy hydrocarbons costs money, but both processes improve the value of the gas at fiscal transfer. So control of the water dew-
point and hydrocarbon dew-point reduction processes will produce an optimal gas composition that meets the fiscal requirements of seller and buyer and minimises the safety risks involved in transporting the gas at high pressure.
Hydrocarbon dew-point measurement in Natural Gas
There are three common techniques for the measurement of hydrocarbon dew-point or it’s equivalent, potential liquid hydrocarbon content.
The first is by far the most commonly accepted method – a fundamental chilled mirror technique. Originally discovered by Regnault in the 19th Century, the chilled mirror principle relies on the cooling of a mirrored surface in contact with the gas stream. As the dew-point temperature is reached, condensate starts to appear on the mirrored surface. The temperature of the mirror at the point where condensate is first observed is, by definition, the dew point. Many thousands of manual dewscopes are in regular use as a chemist’s tool in determining the practical hydrocarbon dew point of natural gas. However, this manual, optical technique is not particularly appropriate for current needs. This is because the observation of hydrocarbon condensate is very subjective to the human eye – such condensates are notoriously difficult to detect – and in such a manual technique it is extremely common for a falsely low reading to be made as the mirror temperature often needs to be significantly below dew point for enough condensate to form such that the operator can see it.
The second technique involves the analysis of gas composition using a process gas chromatograph, combined with a calculation method based upon equations of state that estimates the resultant hydrocarbon dew-point temperature. Whilst this methodology is capable of giving a reasonable degree of accuracy in terms of the hydrocarbon dew-point temperature, to do so requires analysis of a large number of hydrocarbon components, to the heavy end of the spectrum, where concentrations are very low. As it is these heavy ends that have the greatest influence on the practical hydrocarbon dew-point temperature, it is essential they are taken into account if an accurate determination is to be made using GC analysis. This increases the cost and complexity of the GC system chosen, increases elution time of the measurement cell (therefore reducing sample frequency) and requires a much larger calibration and maintenance overhead, in an already very expensive piece of analysis equipment.
The third technique, not widely used within industry, is the measurement of potential hydrocarbon liquid content (PHLC). This technique effectively measures the amount of hydrocarbon liquid, in

milligrams per cubic metre, which will condense out of a natural gas stream at a particular operating temperature. It is therefore a parallel measurement to hydrocarbon dew-point temperature. It has the advantage that it is a fundamental measurement that can be related back to mass and flow standards, but has the considerable disadvantage that it is quite difficult to realise in practice and is therefore more suited to a periodic validation technique than to an on-line measurement process.
Although the three techniques above have their particular weaknesses, all are used to varying levels of success to determine the hydrocarbon dew-point (or PHLC) of natural gas. However, there is a derivative version of the first, primary dew-point technique that overcomes all of the main deficiencies of the manual Dewscope.
The Condumax II automatic, on-line hydrocarbon dew-point analyser from Michell Instruments Ltd uses an electro-optical technique that has been available for twenty years and combines this with latest state-of-the-art electronics and control functions to give reliable, continuous and maintenance free measurement of hydrocarbon dew-point temperature.
The fundamental principle on which the Condumax II is based is that of direct measurement of the temperature at which hydrocarbon liquids start to condense on a cooled surface that is exposed to the sample being measured – by definition this is the hydrocarbon dewpoint temperature.
The main difficulties in making such a measurement, however, are associated with two characteristics of liquid formation in natural gas. Firstly, the
colourless appearance and low surface tension of natural gas condensates means that the liquid film that forms as the sample is cooled through the dewpoint temperature is almost invisible. Therefore, it is difficult to detect either “by eye” or by using automated opto-electronic techniques. Secondly, natural gas has a spectrum of potentially condensable components that contribute to the liquid formed when the gas is cooled through the hydrocarbon dewpoint temperature. This compound effect is complex in that some of the hydrocarbon compounds exhibit an affinity for one another while others repel; Effectively the heaviest end components condense first followed by the lighter compounds in descending order of molecular weight. The difficulty here is that, unlike the

measurement of water dewpoint where the objective is to determine the temperature at which a single condensable component (water vapour) becomes saturated, hydrocarbon dewpoint is, by its very nature, indistinct, as condensation occurs gradually across a range of temperature.
The liquid to gas ratio (LGR) curve, which shows the region referred to commonly as the ‘hydrocarbon tail’, best illustrates this characteristic. This shows that the theoretical dewpoint, if defined as the temperature at which the
first of the heaviest end components bond together from gaseous to liquid phase, would be some 20°C or more higher than the measurable dewpoint where the first visible, and thus, detectable formations of condensates will occur. It is clearly the latter that is of primary significance to producers, transporters and end users of the gas. It is therefore accepted practice to take an extrapolation of the linear portion of the curve, thereby eliminating the otherwise exaggerated effects of the hydrocarbon tail, in order to determine an operational hydrocarbon dewpoint of significance in gas quality terms.
Any form of automatic hydrocarbon dewpoint analyser must therefore allow the user to adjust the sensitivity of measurement in an informed manner. Ideally, this will be achieved by periodically providing a 'picture' for the condensate formation characteristic of the gas, from the first minute liquid formations into the linear region of the characteristic as shown on the LGR plot.
Due to this fractional condensation effect, the repeatability and sensitivity of measurement will be adversely affected by the inter-relationship of sample flow rate and cooling rate during measurement cooling cycles. The amount of condensate formed on a cooled surface during a measurement cycle is not only dependant on the composition of the gas, but also the supply of components being condensed at that temperature, which in turn is influenced by both the cooling rate and sample flow rate. As such, to achieve good measurement performance, any such automatic technique should operate with a fixed sample volume trapped within the analysis cell prior to the start of each measurement cycle. This de-couples the sample flow-rate/cooling rate interdependency and maintains the integrity of the sample throughout the measurement cycle.

The successful application of on-line, automatic measurement has been achieved by developing specialist measurement technologies that confront these issues. One of the most significant of these is the “Dark Spot” optical technique utilised by Michell Instruments in their Condumax II Hydrocarbon Dewpoint Analyser.
The Condumax II Dark Spot automatic measurement technique
Operating with sensitivity of the order of 1ppm (molar) of condensate, the “Dark Spot” optical principle is radically different to that of any other chilled mirror instrument. In essence, the Condumax II system incorporates a small pressure vessel, the sensor cell, housed in a self contained EExd certified field mounted transmitter type analyser system. Requiring nothing other than electrical power to operate, the Condumax II performs sample handling and cooling functions together with
fully automatic system management and measurement functions.
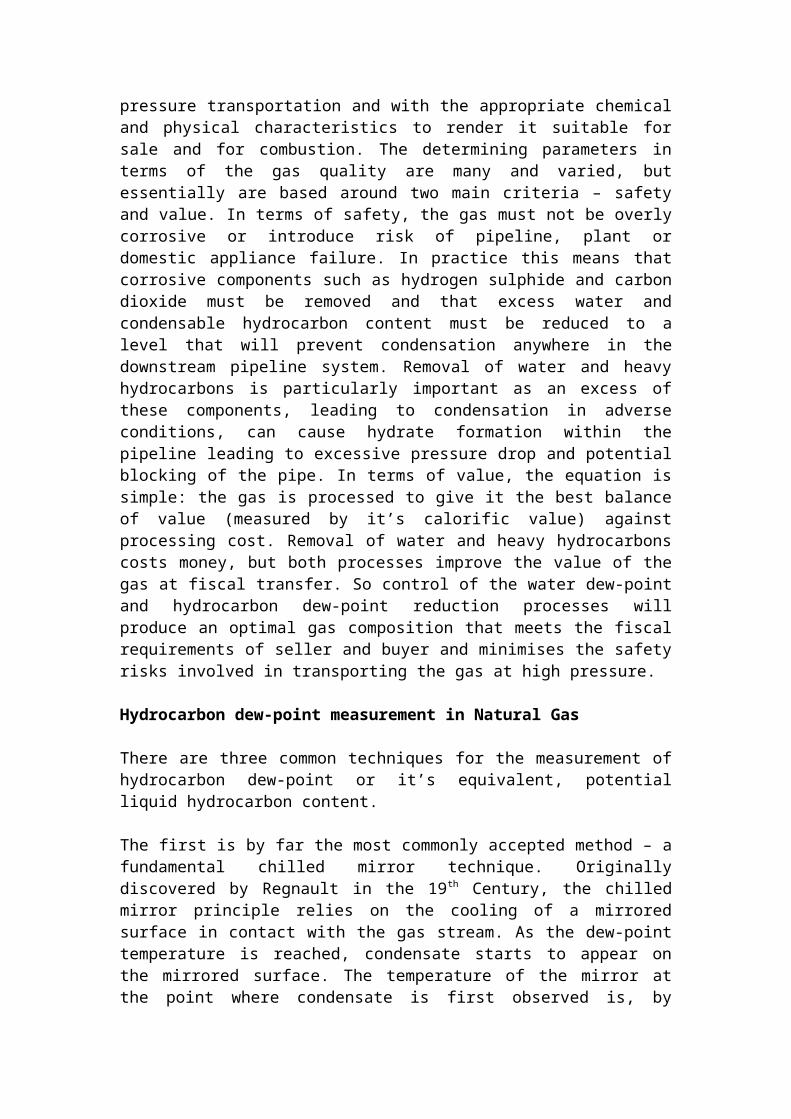
The sensor cell contains an optical surface, mounted on a cooled probe with an embedded miniature precision thermocouple and optical detection components. The optical surface is acid etched and semi-matt with a central conical shaped depression. A well-collimated beam of visible red light is focused onto this central region that, in dry conditions, reflects most of the beam from the surface to form an annulus ring of light. Optical detection is focused on light dispersed into the centre of the annulus ring - the “Dark Spot.”

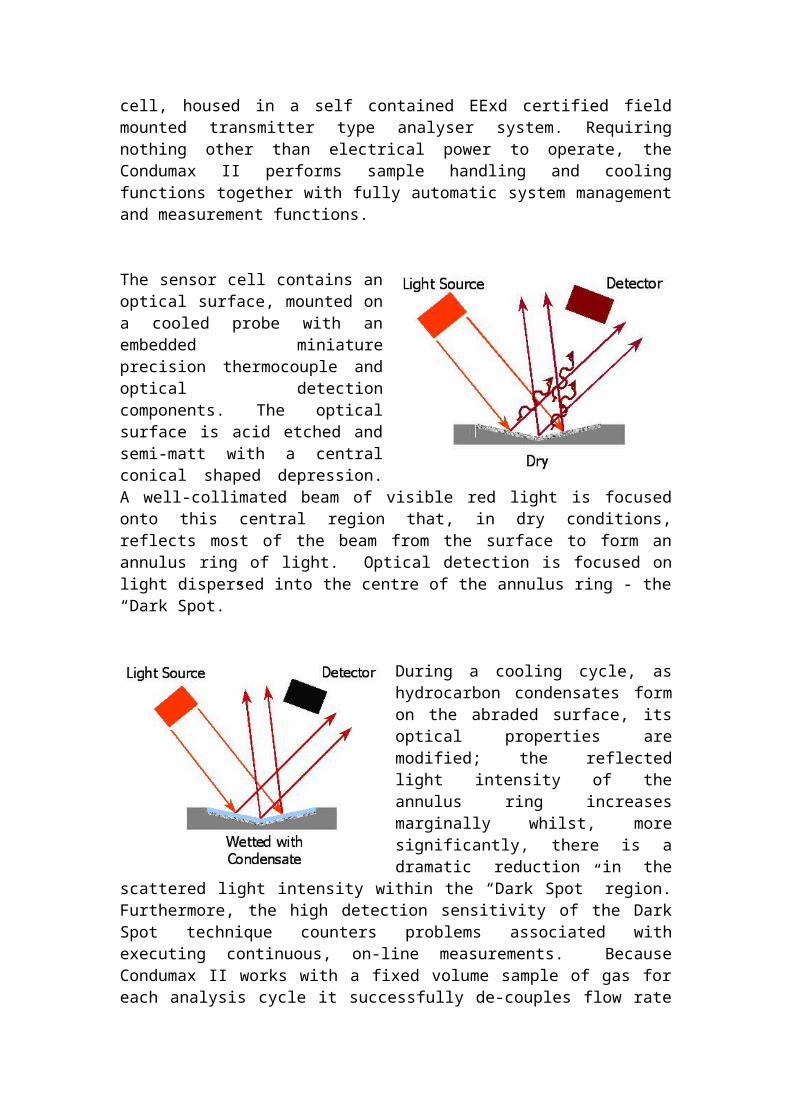
During a cooling cycle, as hydrocarbon condensates form on the abraded surface, its optical properties are modified; the reflected light intensity of the annulus ring increases marginally whilst, more significantly, there is a dramatic reduction in the scattered light intensity within the “Dark Spot” region. Furthermore, the high detection sensitivity of the Dark Spot technique counters
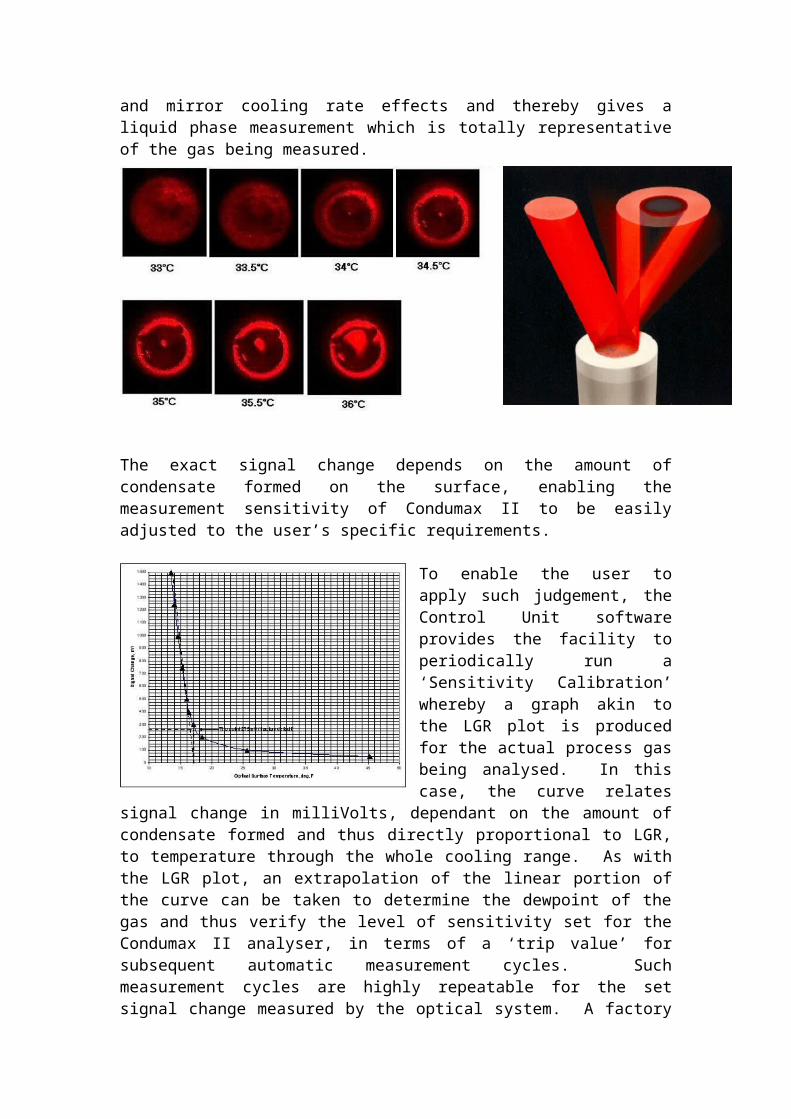
problems associated with executing continuous, on-line measurements. Because Condumax II works with a fixed volume sample of gas for each analysis cycle it successfully de-couples flow rate and mirror cooling rate effects and thereby gives a liquid phase measurement which is totally representative of the gas being measured.
The exact signal change depends on the amount of condensate formed on the surface, enabling the measurement sensitivity of Condumax II to be easily adjusted to the user’s specific requirements.
To enable the user to apply such judgement, the Control Unit software provides the facility to periodically run a ‘Sensitivity Calibration’ whereby a graph akin to the LGR plot is produced for the actual process gas being analysed. In this case, the curve relates signal change in milliVolts, dependant on the
amount of condensate formed and thus directly proportional to LGR, to temperature through the whole cooling range. As with the LGR plot, an extrapolation of the linear portion of the curve can be taken to determine the dewpoint of the gas and thus verify the level of sensitivity set for the Condumax II analyser, in terms of a ‘trip value’ for subsequent automatic measurement cycles. Such measurement cycles are highly repeatable for the set signal change measured by the optical system. A factory default value of 275mV has been proven to provide comparative measurements to those obtained by an experienced operator applying the manual, visual technique.
This flexibility allows Condumax II to be used for both condensate quantity and dewpoint temperature analysis. In the former, the optical surface is cooled to a fixed temperature and the change in optical intensity is monitored. This data is interpreted as a liquid to gas ratio by periodic cross calibration against a recognised condensate analysis technique.
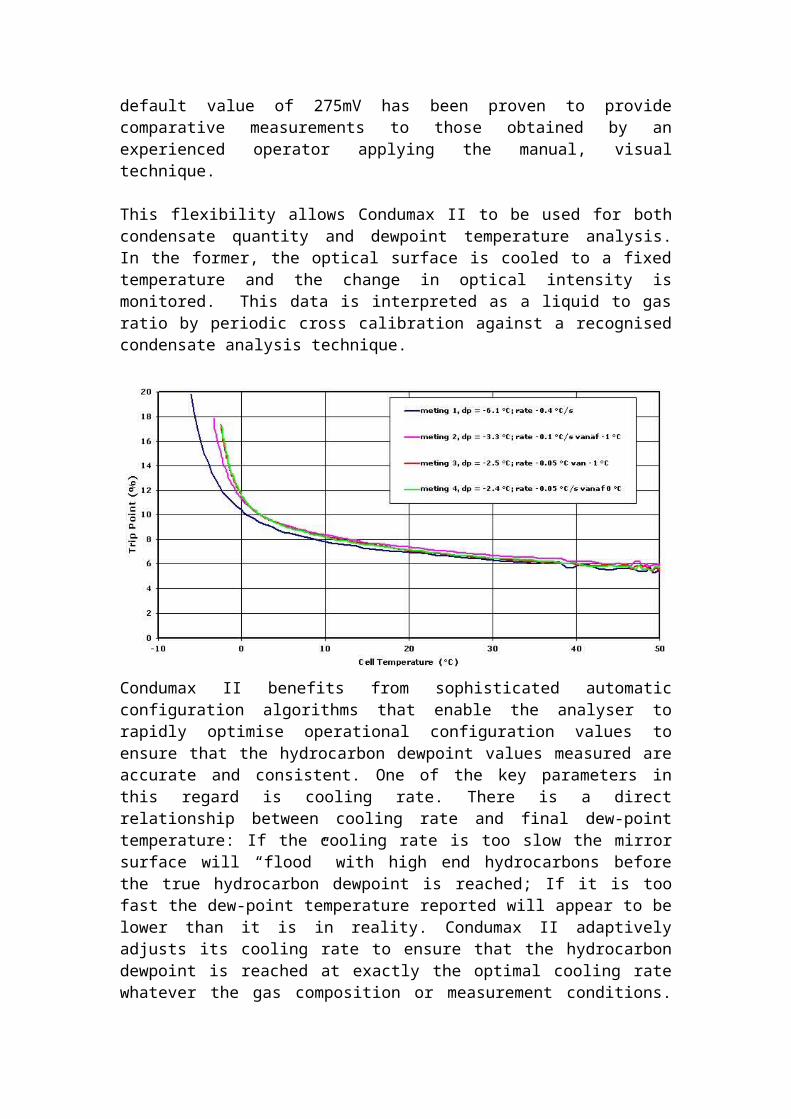
Condumax II benefits from sophisticated automatic configuration algorithms that enable the analyser to rapidly optimise operational configuration values to ensure that the hydrocarbon dewpoint values measured are accurate and consistent. One of the key parameters in this regard is cooling rate. There is a direct relationship between cooling rate and final dew-point temperature: If the cooling rate is too slow the mirror surface will “flood” with high end hydrocarbons before the true hydrocarbon dewpoint is reached; If it is too fast the dew-point temperature reported will appear to be lower than it is in reality. Condumax II adaptively adjusts its cooling rate to ensure that the hydrocarbon dewpoint is reached at exactly the optimal cooling rate whatever the gas composition or measurement conditions. If conditions change dynamically the Condumax II detects the variation and will
automatically re-optimise its settings. Typically this is achieved over one to three measurement cycles.
Furthermore, Condumax II has a very wide hydrocarbon dewpoint measurement range extending to –63C hydrocarbon dewpoint at an ambient temperature of -20C and maintaining the ability to measure to –6.6C hydrocarbon dewpoint from high ambient temperatures of up to +60C.
Featuring ModBus protocol communication systems as well as more traditional analogue output interfaces, the Condumax II is ready for whatever sophisticated data acquisition systems the process operators of the future will require. As well as being able to access logged data and alter the configuration of the analyser at the point of use, it is possible to network analysers together (up to a maximum of 31 channels per node) and to then have full remote access to measurement data and system configuration via Modbus protocol digital communication. Integration into users existing Scada systems or other data acquisition systems could not be simpler as the Condumax II is provided with Active X controls. For the user seeking a stand alone communication solution Michell Instruments Ltd have developed the Condumax II Remote Indicator which provides fully integrated communication, data logging and process monitoring for up to 31 analysers.
CONCLUSION
As the process of global de-regulation of the natural gas industry continues, bringing with it the need to comply with increasingly stringent legislation and achieve improved processing efficiency in order to remain competitive, the effective, accurate measurement of hydrocarbon dewpoint grows in importance. As such, the use of
automatic, on-line instruments such as Michell Instruments’ Condumax II is likely to increase.
The combination of a fundamental measurement principle with the high sensitivity and objectivity afforded by the “dark spot” technique makes Condumax II suitable to fulfil a wide range of applications. These range from performance monitoring and operational control of hydrocarbon dewpoint reduction plant and gas quality measurement at fiscal monitoring points, to reservoir engineering research work to improve extraction techniques. The advanced networking and Intranet/Internet communication capabilities of Condumax II, combined with its high reliability and lack of any requirement for continuous user intervention, mean that it has the capability to be installed on unmanned installations providing live data to the users control and monitoring infrastructure together with remote configuration and diagnostic functions. Until Condumax II the possibilities that these advances offer in terms of process monitoring on a National, International or even Global scale have been impossible to imagine.