hydraulic model tests of rock material in canyon …€¦ · conclusions model tests indicated the...
TRANSCRIPT

HYDRAULICS BRANCH OFFICIAL FILE COPY
-425 WHEN BORROWED RETURN PROMPTLY
HYDRAULIC MODEL TESTS OF ROCK MATERIAL
IN CANYON FERRY DAM SPILLWAY STILLING BASIN
BY
EUGENE ZEIGLER
PAP-425

5. 30,
ram, nr-c-ii (12-411 Bureau Of Reclamation
, INFORMATIONAL ROUTING -
D-1531 510.
Memorandum
• FEB
1
Regional Director, Attention: UM-200
1
Hydraulic Model Tests of Rock Material in the Canyon Ferry Dam Spillway Basin
The problem of rocks in the stilling basin was investigated in a previous hydraulic model study (REC-ERC-74-27, December 1974). The model showed rocks were drawn into the basin by outlet works flows and could be flushed from the basin by spillway flows. Also, criteria were developed by model tests for flow releases to minimize rocks .being drawn into the basin. - Flow releases were made from the prototype spillway to flush rocks from the basin and thereafter the prototype operated under t'ie developed criteria. However, rocks again entered the basin. Prototype experience shows the model gave a good indication about method of rock entry and removal, but , the model appears inaccurate for the threshold of rock entry.
Additional hydraulic model tests were made in an effort to determine any-thing different about the threshold of rock entry. A finer sand (which tended to move somewhat more easily in the model) was used. These model tests were made for somewhat limited flow conditions and did not indicate a difference from the earlier model study. Evidently at the lower dis-charges the model does not duplicate prototype action. Thus, field obser- vations are important to determine threshold flow conditions that move rock into the basin.
Enclosed is a memorandum report of the additional model tests. One portion of the memorandum deals with "Considerations Concerning Rock in the Stilling Basin." These considerations are given as ideas, and the people directly involved may judge whether or not the considerations have merit.
Our work with the Canyon Ferry model is completed. The floor space was needed for another model study,. and the Canyon Ferry model was removed.
.Enclosure
Copy to:
Elind to;
Chief, Division of O&M Technical Services, EP Center (with copy of enclosure)
D-220 '-‘1530 0-1533 D-221 0-1531 (with copy of enclosure to each)
, Montana 1
From:
Subject:
Chief, Hydraulics Branch
ERZeigler:alg *GPO-1972-777-637
OPTIONAL r Ofl O. 0 JULY 1073 EDITION GSA FP140 541 Cr RI 101-11.6
UNITED STATES GOVERNMENT
Memorandum TO
Memorandum
Chief, Hydraulics Branch Denver, Colorado DATE: February 2, 1982
FROM
Euaene Zeigler
SUBJECT: Hydraulic Model Tests of Rock Material in Canyon Ferry Dam Spillway Stilling Basin
BACKGROUND
The Canyon Ferry Dam stilling basin experienced abrasion damage from rocks in the basin. A hydraulic model study was made to determine how rocks entered the stilling basin and to develop a method of removing the rocks (REC-ERC-74-27, December 1974). Model tests showed that the river outlets caused currents which carried rocks into the basin, and that sufficient spillway flows could flush rocks from the basin. The prototype spillway was operated during 1974, and an underwater diver inspection verified that 690 10 (900 ydi) of rock material had been removed from the basin. There-after the river outlets' discharge was restricted to prevent rock from being drawn into the 4sin. Model tests indicated the outlet discharge should be 85 m3/s (3000 fts/s) or less, and equally divided between tLe four gates. However, an inspection in 1977 showed that 1030 m3 (135Q yd') of rock material had again entered the basin. Thus a 56.6-m3/s (2000-fti/s) limitation was recommended for the outlets' discharge. At the Upper Missouri Region's request, model tests were made to investigate movement of large debris in the basin (memorandum to Regional Director, Billings, Montana, from Chief, Hydraulics Branch, February 1980).
After rock was flushed from the basin in 1974, the prototype was operated under criteria developed by the model study. However, the 1977 entry of rock into the prototype basin indicated that the model might not have dupli-cated prototype rock movement at low discharges. Another possibility was that material may have entered the baqin when the prototype operated for 6 days (June 24-30, 1976) with 67.9 e/s,(2400 ft3/s) each from river out-lets No. 1 and 4, and 66.8 m3/s (2360 fe/s) each from spillway gates 2 and 3.
The June 1976 flow condition and others were tested in the model. This memorandum documents and reports results of the model tests and gives some considerations concerning the problems of rock material in the Canyon Ferry Dam stilling basin.
Buy U.S. Savings Bonds Regularly on the Payroll Savings PI 5010-110

CONCLUSIONS
Model tests indicated the June 24-30, 1976 flow condition was not responsible for drawing rock material into the stilling basin. The evidence is strong that at low, discharges the model does not represent prototype action.. Possibly rocks will again be drawn into the basin, pen with the lower outlet works discharge limitation of 56.6 reis (2000 ft Is). (The basin was cleaned again with a spillway flow in June 1980.) The project should continue their close surveillance of rock in the stilling basin and also maintain an operating record to determine what flow conditions draw rock into the basin,
HYDRAULIC MODEL TESTS
Because field results were different than the model tests results, additional consideration was given to the model bed material. During previous tests, fines were washed from the sand bed and before another test the sand would be mixed to return it to its initial mixture. However, for the tests reported in this memorandum, the sand in the erodible area downstream from the stilling basin was replaced before each test. Also a finer sand was used for some tests in case it would be susceptible to erosion. Sieve analysis of the two sands is given in figure 1.
The primary flow condition for the tests was simultaneous operation of the two outside outlets and the two inside spillway gates. However, other flow conditions were tested so a comparison could be made of one test series with the original model sand and a second test series with finer sand in the model. Also, the method of operating the model influenced flow condi-tions. Previous tests showed that the best method was to set all model gate openings, slowly bring water into the head box, gradually fill the stilling basin and downstream channel without eroding the sand, and then quickly bring the water level in the head box to the desired reservoir water surface elevation. Another method was to establish the reservoir water surface ele-vation in the head box after the correct tailwater had been set and then set the model gate openings. However, the first one or two gates opened created eddies which carried sand into the model basin before true flow conditions were established with the remaining gates. Thus, for ease of model operation, flow conditions tested were some gate combinations with the initial test method.
Seven tests were made in the 1:48 scale model, table 1. For each test the reservoir water surface elevation was 1156 m (3794 ft), the tailwater ele-vation 1113 m (3650 ft), and the model operated about 6 hours or approximately 40 hours prototype time.
2

Test No. 1
The discharge was 67.9 m3/s (2400 ft3/s) from each of outlets No. 1 and 4 and 66.8 m3/s (2360 ft3/s) from each of spillway gates 2 and 3. No sand entered the basin, and only minor sand erosion occurred downstream from the basin.
Test No. 2
Only river outlets No. 1 and 4 operated, each with a 67.9-m3/s (2400-ft3/s) discharge. Sand was carried into the basin. Most sand entered during the first hour of model operation, a very slight amount the next 2 hours, and
no sand appeared to enter during the remaining 3 hours. Sand in the basin and erosion downstream from the basin is shown on figure 2.
Test No. 3
All four river outlets operated, each with a 67.9-m3/s (2400-ft3/s) dis-charge. Sand was immediately carried into the basin at the start of the test and more sand entered the basin than in the previous test (fig. 3a). Similar to the previous test, most of the sand entered at the beginning of the test and none was detected entering the basin during the latter part of the test. The eroded areas downstream from the basin showed a tendency for fines to be removed and some coarser particles (fig. 3b). Thus armoring appeared to develop and stop the erosion process.
Test No. 4
For this test the finer sand was used, and model flow was the same as test No. 1. Only slight erosion occurred downstream from the basin and no appreciable amount of sand entered the basin (fig. 4). At the left side of the photograph a few sand grains can be seen next to the basin wall and just upstream from the end sill, but notenough to measure.
Test No. 5
Model flow conditions were the same as for test No. 2 with the finer sand. Some sand was carried into the basin and erosion occurred downstream from the basin (fig. 5).
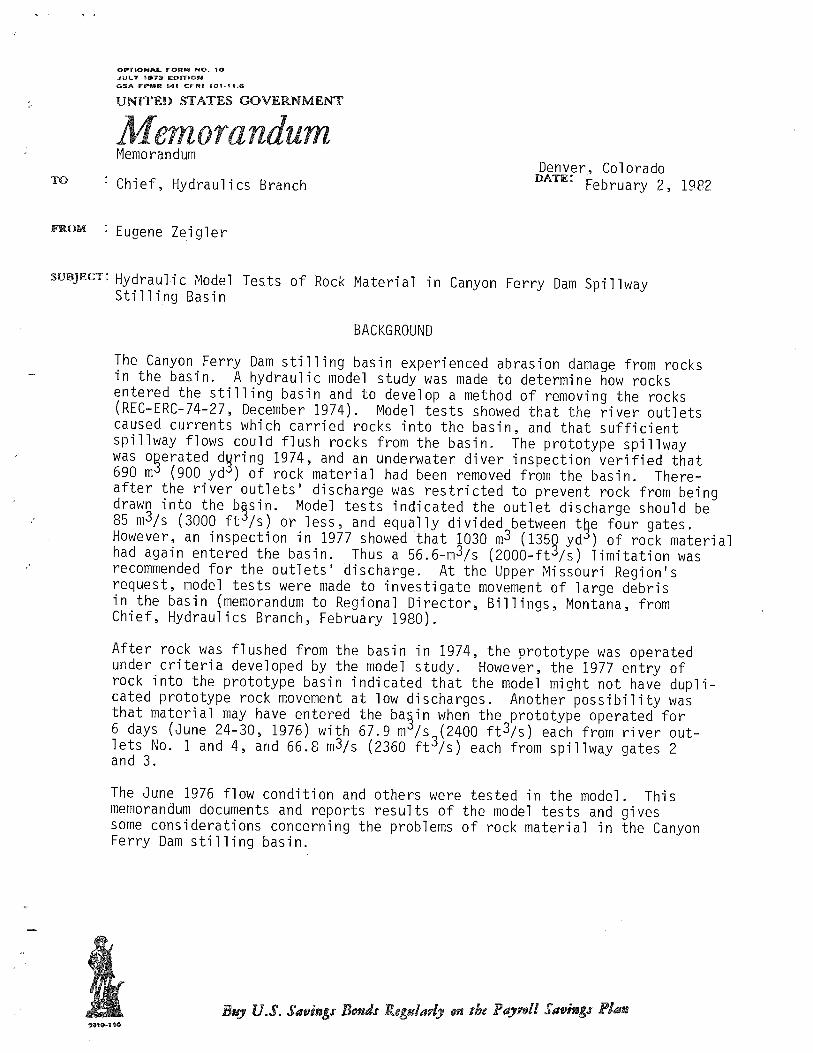
Test No. 6
Model test conditions were the same as for test No. 3 except the finer sand was used. The sand carried into the basin is shown in figure 6a. Also some rocks were carried into the left bay of the stilling basin (fig. 6b). The rocks came from the downstream left corner of the model stilling basin. Rocks were used in the model to represent remnants of the cofferdam from construction of the pumping plant.
Test No. 7
All four river outlets operated, each with a 21.2-m3/s (750-ft3/s) discharge. A slight amount of sand was drawn into the stilling basin, figure 7.
3

DISCUSSION OF TESTS
After each test the volume of sand deposited in the left and right bays of the model stilling basin was measured and converted to prototype units (table 1). For comparable tests, more fine sand was carried into the still-ing basin, providing more downstream erosion. Even with the fine (more erodible) sand in the model and for the flow condition of primary interest, sand was not carried into the stilling basin (test No. 4). Therefore, entry of rock material in the prototype basin apparently was not caused by this flow condition.
Each of the three flow conditions (tests No. 4, 5, and 6) had a different erosion pattern downstream from the end sill (figs. 4, 5, and 6). For test No. 4, erosion downstream from the end sill was slight. The erosion had a general distribution across the basin width with a maximum at the center and decreasing toward the sides (fig. 4). For test No. 5, erosion was more localized and there was an erosion hole on each side of the basin (fig. 5). The difference in erosion between tests No. 4 and 5 showed that operating the two inside spillway gates effectively decreased erosion forces in the downstream channel. For test No. 6, the erosion was again localized but with three erosion holes. A smaller hole was located at the middle of the basin (fig. 6). The various erosion patterns that developed for the different flow conditions indicate that the prototype is susceptible to movement and changing patterns of rock material downstream from the end sill
Observation of sand movement in the model stilling basin was difficult. Air bubbles in the turbulent water covered the water surface immediately downstream from the basin. However, by placing an empty glass jar partly in the water, some of the air bubble interference was eliminated when looking downward through the bottom of the jar. Sand movement into the basin and downstream from the basin could be observed. Numerous obser-vations were made during test No. 6. At the beginning of the test there was a continuous movement of sand into the basin. After 1 hour of operation much of the erosion shown in figure 6 had already occurred and sand move-ment was not as prevalent. Near the end of the test, only occasional sand movement occurred downstream from the basin. No movement could be seen for a period of 30 seconds, then a burst of turbulence would move a few sand grains 25 to 75 mm (1 to 3 in). However, sand did not move into the basin. Evidently erosion equilibrium is approached after a sufficient large erosion hole has developed downstream from the basin.
Location of the large rocks that moved into the stilling basin during test No. 6 was coincidental to location of the large debris of the previous model study. Note in figure 6b the two squares marked on the floor just left of the rocks. These two squares note the location of two 1- by 1-m (3.5- by 3.5-ft) concrete slabs found in the prototype stilling basin. These rocks in the model stilling basin indicate the possibility of erosion from the cofferdam remnant.
4

Previous model tests indicated outlet flows of 84.9 m3/s (3000 ft3/s) or less brought very little sand into the model stilling basin, figure 8 of REC-ERC-74-27. Test No. 7 was made with the 84.9-m3/s outlet works discharge and with finer model sand. Again, very little sand was drawn into the basin, figure 7 and table 1. The amount of sand drawn into the basin did not appear much different when using the finer sand, and test No. 7 did not refute the earlier model tests with somewhat coarser sand. Thus model test results do not explain how rock material was Vawn into the prototype still-ing basin at outlet works discharge of 84.9 m /s (3000 ft3/s) or less.
CONSIDERATIONS CONCERNING ROCK IN THE STILLING BASIN
After the prototype operated 3 years wnder criteria developed by the model study, approximately 1020 m3 (1350 yd3) of rock material had beeq drawn into the stilling basin. This volume was greater than the 690 m (900 yd3) which had previously entered the basin without any restrictions upon prototype operation. This prototype experience indicates the model is not duplicating rock movement at low discharges. Sediment modeling is not an exact science and it is not unreasonable that the model could be somewhat off. Thus the project should closely monitor the presence of rock in the stilling basin in order to accurately determine what discharges will and will not cause rock entry.
Could rock material be drawn into the prototype basin when establishing a new and different set of gate openings? For the model tests, erosion was strongest at the beginning of the test. Also, earlier model experience showed some sand could be drawn into the model basin when opening the first one or two gates. If field policy is to open one gate to the desired gate opening before proceeding to the next gate then possibly a large return flow may form and draw rock material into the basin.
Model test No. 6 had some large rocks from the cofferdam remnant carried into the stilling basin. Possibly in a future underwater inspection the divers should look at the integrity of the grouted rock area at the down-stream left corner of the stilling basin and also the steep channel side (if its structural stability depends upon grouted concrete) between the end of the basin and the pumping plant.
The prototype experience, related to information gained from the model tests, provides a consideration shoulq future cleaning of the stilling basin be required. In 1972, 13 000 mi (17 000 yd3) of rock material were taken from the basin with a clamshell bucket mounted on a platform barge and the equipment was removed. Subsequently, 690 m3 (900 yd3) of rock material entered the basin, considerably less than the previous rock entry. For future cleaning with equipment, movement of rock down-stream from the end sill should be considered. The basin should be
5

cleaned and the barge taken to a safe location away from the basin. The river outlet works should be operated to draw downstream rock material into the basin. The equipment can again remove rock from the basin. Hopefully most rock material downstream from the basin which is susceptible to being drawn into the basin will have been removed.
6

Table 1. - Log of model tests
Test No. Material carried into
Operating units Discharge per unit model stilling basin m3/s ft3/s ms yd3
Test series 1 - original model sand
None
ROW 1,4 67.9 2400
S 2,3 66.8 2360
2 ROW 1,4 67.9 2400 5 7 28 37
3 ROW 1,2,3,4 67.9 2400 L 316 413 R 349 457
Test series 2 - finer sand in model
4
ROW 1,4 67.9 2400
S 2,3 66.8 2360 None
5 ROW 1,4 67.9 2400 L 61 80 R 190 249
6 ROW 1,2,3,4 67.9 2400 L 742 970 R 1109 1450
7 ROW 1,2,3,4 21.2 750 L 5 7 R 8 11
Operating units: ROW - units of the river outlet works operated for the test. S - units of the spillway operated for the test.
Material carried into model stilling basin: L - designates the left bay. R - designates the right bay.

9i 1
0C90
,30
MUM. eV
MIMED In
DATE
•
Ito
90
es z so
to 4
50
liJ
ac la 40
10
ro
0
P5M1,451411
HYDROMETER ANALYSIS TIME READINGS
7104,151401. 60 114114. 19 MIN. 4 MIN. I MIN. . I -200
SIEVE ANALYSIS U.S. STANDARD SERIES 1
Ow *50 *40 *30 *14 °AO *e Is f CLEAR
1 SQUARE
kr OPENINGS
r r tr fa
to
0 ' sot 4 i- 4,4
30
4a
60 ag a.
1 3°
--------- -...r", 1
/11 _ /
r_
10 4 4- I
i i • I
70 . I —Tr" i
. I 4 I i -
--- 4 -4 1._ .---
I
t ,
4 T
I - I -I - --% +-
4- ---/-
... I
7"- I 4 -7 r r r
-I-- _
..._ I. I t 1 I 1 I 1 I 1 J l_Jeer l.4 l -----L-Tr- i I 1 I 1 I 1 1 I I I , J I I I
g. A A A AAAA'ci .002 .005 .009 .019
vt 73.
.037
Z 4 ;VME:
.014 Ma DIAMETER
.297 OF
.1 •••' ..1 Q42
.590 PARTICLE
4.4i l': 411. 0:c1
I. IN MILLIMETERS
.4 1 2.0
9 1311
0. wit
416
01. VA P- to 4142
. 152 I
12.1
2 2 311
2 2 2 222 Mt It? I*
I
CLAY (PLASTIC) TO SILT (NON-PLASTIC) SAND dRAVEL
GOBBLES -I FINE I MEDIUM COARSE _ FINE I COARSE
NOTES:
.
...........
Initial model sand Finer model sand
........-
I. - Sieve analysis of model sands.
•
LADONATORY SAMPLE MA , F tk DEsIGNATIOH__— ,
GRADATION TEST
EXCFNATtON AWL.— --DEPTH_ PT. . .
Figure

Figure 2. - Sand in basin after test No. 2.

a. Sand in basin after test.
b. Armoring effect at eroded areas.
Figure 3. - Test No. 3.

Figure 4. - Practically no sand in basin after test No. 4.
Figure 5. - Sand in basin after test No. 5.
a. Sand in basin after test.
b. Rock drawn into the left bay o the stilling basin.
Figure 6. - Test No. 6.

Figure 7. - Very slight amount of sand in the basin after test No. 7.