hybrid data approach for selecting effective test …
TRANSCRIPT

INTERNATIONAL JOURNAL ON SMART SENSING AND INTELLIGENT SYSTEMS SPECIAL ISSUE, SEPTEMBER 2017
1
HYBRID DATA APPROACH FOR SELECTING EFFECTIVE
TEST CASES DURING THE REGRESSION TESTING
M. Mohan1* Tarun Shrimali
2
1Research Scholar, Department of Computer Science Engineering, Pacific University, Udaipur,
India
2 principal, Sunrise Group of Institutions, Udaipur, India
Email:[email protected],
Submitted: May 27, 2017 Accepted: June 15, 2017 Published: Sep 1, 2017
Abstract- In the software industry, software testing becomes more important in the entire software
development life cycle. Software testing is one of the fundamental components of software quality
assurances. Software Testing Life Cycle (STLC)is a process involved in testing the complete software,
which includes Regression Testing, Unit Testing, Smoke Testing, Integration Testing, Interface
Testing, System Testing & etc. In the STLC of Regression testing, test case selection is one of the most
important concerns for effective testing as well as cost of the testing process. During the Regression
testing, executing all the test cases from existing test suite is not possible because that takes more time
to test the modified software. This paper proposes new Hybrid approach that consists of modified
Greedy approach for handling the test case selection and Genetic Algorithm uses effective parameter
like Initial Population, Fitness Value, Test Case Combination, Test Case Crossover and Test Case
Mutation for optimizing the tied test suite. By doing this, effective test cases are selected and minimized
the tied test suite to reduce the cost of the testing process. Finally the result of proposed approach
compared with conventional greedy approach and proved that our approach is more effective than
other existing approach.
Index terms: Software Testing, Regression Testing, Test Reduction, Test Optimization, Test Data Generation.

M. Mohan and Tarun Shrimali
Hybrid data approach for selecting effective test cases during the regression testing
2
I. INTRODUCTION
Software Testing is the process of evaluation of the product to achieve the expected performance
of the product to meet the required performance. Software testing involves execution of a system
component or software component to validate one or more functions to identify the fault or detect
the fault. The need of software testing is important or main part of the software evolution because
software bugs could be more expensive and dangerous. Let see the incident happen due to
software bugs in the real world history in April 2015, due to software anomaly in Bloomberg
Terminal at London, more than 300,000 traders affected on financial markets. Due to this the
United Kingdom government postponed a Three Billion pound debt sale. In the Nissan cars due
to software failure in the airbag sensor detector, the companies recalled over one million cars
from the market. Due to software bugs in Amazon‟s third party retailers product price is reduced
to one pound. And they have heavy money losses. In 2015 fighter plane F – 35 fells victim to a
software bug. In 1994 China airlines airbus A300 crashed due to a software bug which killed 264
passenger. In the Software Development life cycle, software testing start from the first phase
requirements collection and continue till the deployment of the software. Software Testing
depends on the development model, for example in the waterfall model testing is conducted in
the testing phase and in the incremental model testing done at the end of the application. So
testing is done at any phase of Software Development Life Cycle. In the software testing it‟s hard
to conclude when to stop the testing process of the product. No one can prerogative that the
software or product is 100% tested perfectly. There are some criteria to stop the testing process.
They are Execution of test case completely. Completion of functional and code coverage to a
certain point. Fault detected below certain level and no high priority faults are detected.
II. Deadlines of Testing.
There are different types of software testing basically manual testing and automation testing. In
manual testing, a tester performs test planning, test execution and reporting bugs manually by
human efforts. Manual testing will run sequentially and it takes more time, human efforts and
low accuracy with less expensive. Automation testing is a part of manual testing, the tester writes
the test scripts to start the testing of the product. Automation testing can run at different machine
in the similar time, it takes less time, high accuracy and more expensive than manual testing.
There are different methods used in the software testing they are Black-Box Testing, White-Box
Testing and Grey-Box Testing. In the Black-Box Testing, the testers have knowledge of system
INTERNATIONAL JOURNAL ON SMART SENSING AND INTELLIGENT SYSTEMS SPECIAL ISSUE, SEPTEMBER 2017
3
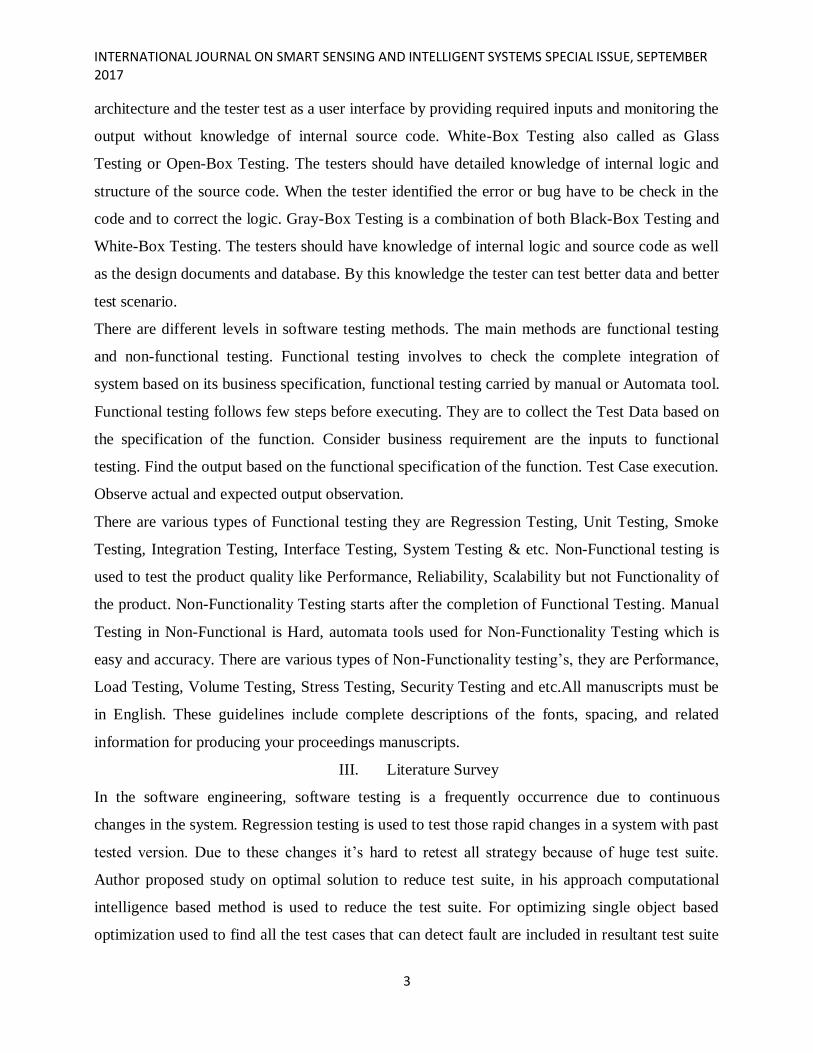
architecture and the tester test as a user interface by providing required inputs and monitoring the
output without knowledge of internal source code. White-Box Testing also called as Glass
Testing or Open-Box Testing. The testers should have detailed knowledge of internal logic and
structure of the source code. When the tester identified the error or bug have to be check in the
code and to correct the logic. Gray-Box Testing is a combination of both Black-Box Testing and
White-Box Testing. The testers should have knowledge of internal logic and source code as well
as the design documents and database. By this knowledge the tester can test better data and better
test scenario.
There are different levels in software testing methods. The main methods are functional testing
and non-functional testing. Functional testing involves to check the complete integration of
system based on its business specification, functional testing carried by manual or Automata tool.
Functional testing follows few steps before executing. They are to collect the Test Data based on
the specification of the function. Consider business requirement are the inputs to functional
testing. Find the output based on the functional specification of the function. Test Case execution.
Observe actual and expected output observation.
There are various types of Functional testing they are Regression Testing, Unit Testing, Smoke
Testing, Integration Testing, Interface Testing, System Testing & etc. Non-Functional testing is
used to test the product quality like Performance, Reliability, Scalability but not Functionality of
the product. Non-Functionality Testing starts after the completion of Functional Testing. Manual
Testing in Non-Functional is Hard, automata tools used for Non-Functionality Testing which is
easy and accuracy. There are various types of Non-Functionality testing‟s, they are Performance,
Load Testing, Volume Testing, Stress Testing, Security Testing and etc.All manuscripts must be
in English. These guidelines include complete descriptions of the fonts, spacing, and related
information for producing your proceedings manuscripts.
III. Literature Survey
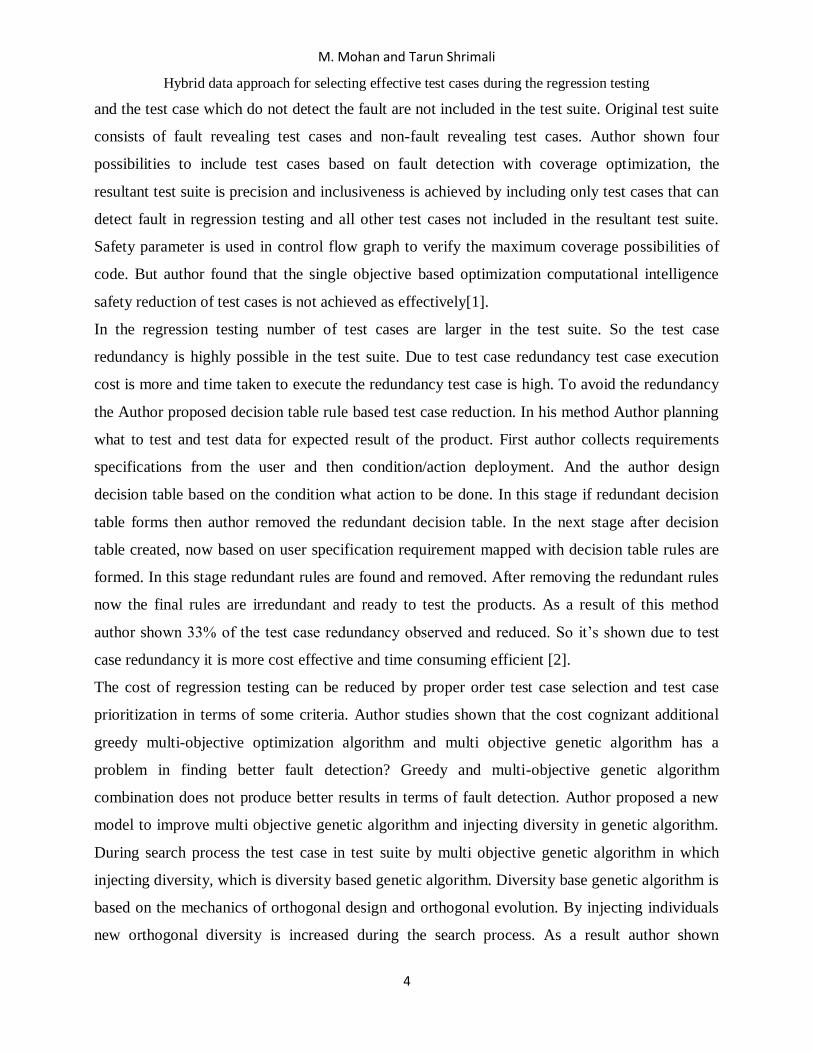
In the software engineering, software testing is a frequently occurrence due to continuous
changes in the system. Regression testing is used to test those rapid changes in a system with past
tested version. Due to these changes it‟s hard to retest all strategy because of huge test suite.
Author proposed study on optimal solution to reduce test suite, in his approach computational
intelligence based method is used to reduce the test suite. For optimizing single object based
optimization used to find all the test cases that can detect fault are included in resultant test suite
M. Mohan and Tarun Shrimali
Hybrid data approach for selecting effective test cases during the regression testing
4
and the test case which do not detect the fault are not included in the test suite. Original test suite
consists of fault revealing test cases and non-fault revealing test cases. Author shown four
possibilities to include test cases based on fault detection with coverage optimization, the
resultant test suite is precision and inclusiveness is achieved by including only test cases that can
detect fault in regression testing and all other test cases not included in the resultant test suite.
Safety parameter is used in control flow graph to verify the maximum coverage possibilities of
code. But author found that the single objective based optimization computational intelligence
safety reduction of test cases is not achieved as effectively[1].
In the regression testing number of test cases are larger in the test suite. So the test case
redundancy is highly possible in the test suite. Due to test case redundancy test case execution
cost is more and time taken to execute the redundancy test case is high. To avoid the redundancy
the Author proposed decision table rule based test case reduction. In his method Author planning
what to test and test data for expected result of the product. First author collects requirements
specifications from the user and then condition/action deployment. And the author design
decision table based on the condition what action to be done. In this stage if redundant decision
table forms then author removed the redundant decision table. In the next stage after decision
table created, now based on user specification requirement mapped with decision table rules are
formed. In this stage redundant rules are found and removed. After removing the redundant rules
now the final rules are irredundant and ready to test the products. As a result of this method
author shown 33% of the test case redundancy observed and reduced. So it‟s shown due to test
case redundancy it is more cost effective and time consuming efficient [2].
The cost of regression testing can be reduced by proper order test case selection and test case
prioritization in terms of some criteria. Author studies shown that the cost cognizant additional
greedy multi-objective optimization algorithm and multi objective genetic algorithm has a
problem in finding better fault detection? Greedy and multi-objective genetic algorithm
combination does not produce better results in terms of fault detection. Author proposed a new
model to improve multi objective genetic algorithm and injecting diversity in genetic algorithm.
During search process the test case in test suite by multi objective genetic algorithm in which
injecting diversity, which is diversity based genetic algorithm. Diversity base genetic algorithm is
based on the mechanics of orthogonal design and orthogonal evolution. By injecting individuals
new orthogonal diversity is increased during the search process. As a result author shown

INTERNATIONAL JOURNAL ON SMART SENSING AND INTELLIGENT SYSTEMS SPECIAL ISSUE, SEPTEMBER 2017
5
empirical study on eleven programs that outperforms on both the greedy algorithm and traditional
multi objective genetic algorithm optimally and by diversity based genetic algorithm, fault
detection rate is higher for same cost of test case execution compare to other algorithms [3].
Genetic algorithm used in regression testing for fault localization. Due to crossover mutation in
the genetic algorithm, global population is not retaining it variations because mutation operation
is violent. Author proposed new method to overcome above stated drawback, he combined
genetic immune algorithm and artificial immune algorithm based up on their characteristics.
Initially, the antigen is modified code for the analysis data flow on the control flow graph and
form the binary encoding. Next is antibody represents test case that covers all the modified code
and population represents the collection of test case. Affinity refers to distance between antigen
and antibody in the program and then test case are converted in to binary codes. Affinity process
to find concentration that represents similarities among test cases, with minimum degree of
similarity and maximum diversity of test cases based up on concentration immune selection,
cloning, crossover, mutation and clone inhibition. At last replace the population, antibody results
and generating fault localization for regression test case. As a result of this approach author
shown that the enhancement qualities of regression test case fault localization by combining
Genetic Immune Algorithm and Artificial Immune Algorithm [4].
From the literature survey reference [1]-[4] its clearly conclude that there is no optimal solution
to handle when the test case tie occurs.
IV. Problem Description
Regression Testing is one of the Testing process changes in software to make sure that the
existing software still working with new changes. During the Regression testing, we need
minimal number of test cases from already tested test suite that minimize the time and cost of the
testing. There are many conventional techniques available for test case reduction. The
conventional test case reduction techniques are Get split, Greedy and Coverall algorithm. In
conventional techniques, most of the technique not effectively used for selecting the effective test
cases from the test suite in the form of fault detection capability and does not handling test case
tie during the reduction process. To overcome this problem, the proposed approach uses hybrid
approach to select effective test cases as well as handle the test case which one is tie.Identifying
test case tie and removing it will reduce the test cases to be test as well as reduce in cost and time
to test the test case.

M. Mohan and Tarun Shrimali
Hybrid data approach for selecting effective test cases during the regression testing
6
Block Diagram
Figure.1 Proposed Approach
Methodology&Implementation
Test Case Reduction Using Hybrid Approach
Algorithm.1 shows that proposed approach for test case reductions that consists ofGreedy Loop
and Genetic Loop.
Algorithm.1 Hybrid Algorithm
Hybrid (T[1…n], S[1…n])
For every Ti ϵ T[1…n]
For every Si ϵ S[1…n]
If (Si covered by Ti) then
Mark „1‟ in the coverage set.
Else
Mark „0‟ in the coverage set.
For every Ti ϵ T[1…n]
Count number of statement covered by Ti.
[Greedy Loop]
Select Ti which one covering more number of statements then
Test Case
Reduction Using
Modified Greedy
Approach
Genetic Loop
Tied Test Suite Reduced Test
Suite (RTS)
TTC
TS
Optimized Test Case from GA
ROTC
TS – Test Suite TTC – Tied Test Case
ROTC – Randomly Ordered Test Case
Test Case from
Greedy

INTERNATIONAL JOURNAL ON SMART SENSING AND INTELLIGENT SYSTEMS SPECIAL ISSUE, SEPTEMBER 2017
7
Mark „0‟ if the same statement covered by other test cases.
If more than one Ti covering same number of statement
Select all Ti and Mark „0‟ if the same statement covered by other test cases.
Store Ti in RTS
Repeat Greedy Loop until no one marked „1‟ in coverage set.
[Genetic Process]
Generate Initial population for tied test case based on coverage and HF.
Calculate Fitness value for each Ti ϵ T[1…n] and keep in Roulette wheel.
[Genetic Loop]
Select Ti from Roulette wheel.
Perform selection operation If output of selection = = Target then select Ti otherwise Go to 4.3.3
Perform cross over If output of crossover = = Target then select Ti otherwise Go to 4.3.4.
Perform mutation If output of mutation = = Target then select Ti otherwise select any one Ti
which one has highest fitness value and repeat step 4.3.
Store selected Ti in RTS
Return RTS.
Implementation
Sample Code For Testing
The source code has been taken for testing process in which the some statements are numbered
and weightage of few statements are mentioned. The source code follows
Algorithm.2 Sample Code
CODE Statement
Number
Weightage
Function Max (num1, num2, num3) - -
{ - -
If ( num1 > num2 ) && ( num1 > num3 ) S7 -
{ - -
Largest = num1; S8 0.5
} - -
Else If (num2 > num1)
&& (num2 > num3)
S9 -

M. Mohan and Tarun Shrimali
Hybrid data approach for selecting effective test cases during the regression testing
8
Largest = num2; S10 0.2
Else Largest = num3; S11 0.7
Return (Largest); - -
} - -
Function Total (num1, num2, num3) - -
{ - -
If (num1 > num2) S12 -
{ - -
If (num1==num3) S13 -
{ - -
Total = num1+ num2; S14 0.3
} - -
} - -
Else
If(num3<=num2)
S15
-
{ - -
Total=num1+num2+num3; S16 0.5
} - -
Else - -
Total = num1; S17 0.2
Return (Total); - -
} - -
Void main () - -
{ - -
Int num1, num2, num3; - -
If (num1 > num2) S1 -
If (num1 == num3) S2 -
{ - -

INTERNATIONAL JOURNAL ON SMART SENSING AND INTELLIGENT SYSTEMS SPECIAL ISSUE, SEPTEMBER 2017
9
Call max(num1, num2, num3); S3 0.2
} - -
Else - -
If (num1 < num3) S4 -
Call max(num1, num2, num3); S5 0.7
Else - -
Call Total (num1, num2, num3); S6 0.4
} - -
Sample Test Data
The Table.1 shows list of test cases has been taken for testing the above source code initially. The
table1 gives Test Id, Test Data and History Factor for every test case in which history factor
represents most effective test cases which has been used in the previous testing process. More
effective test cases have higher History Factor that calculated from previous project. The test case
consideration follows
Table.1 Test Data and History Factor
TEST ID TEST
DATA
HISTORY
FACTOR
T1 [1, 8, 4] 2
T2 [2, 16, 1] 6
T3 [2, 2, 8] 5
T4 [4, 6, 4] 1
T5 [7, 4, 4] 0
T6 [16, 1, 9] 8
T7 [3, 1, 3] 1
T8 [1, 1, 1] 0
T9 [9, 6, 5] 0
T10 [12, 2, 12] 3
Coverage Information for main function:
M. Mohan and Tarun Shrimali
Hybrid data approach for selecting effective test cases during the regression testing
10
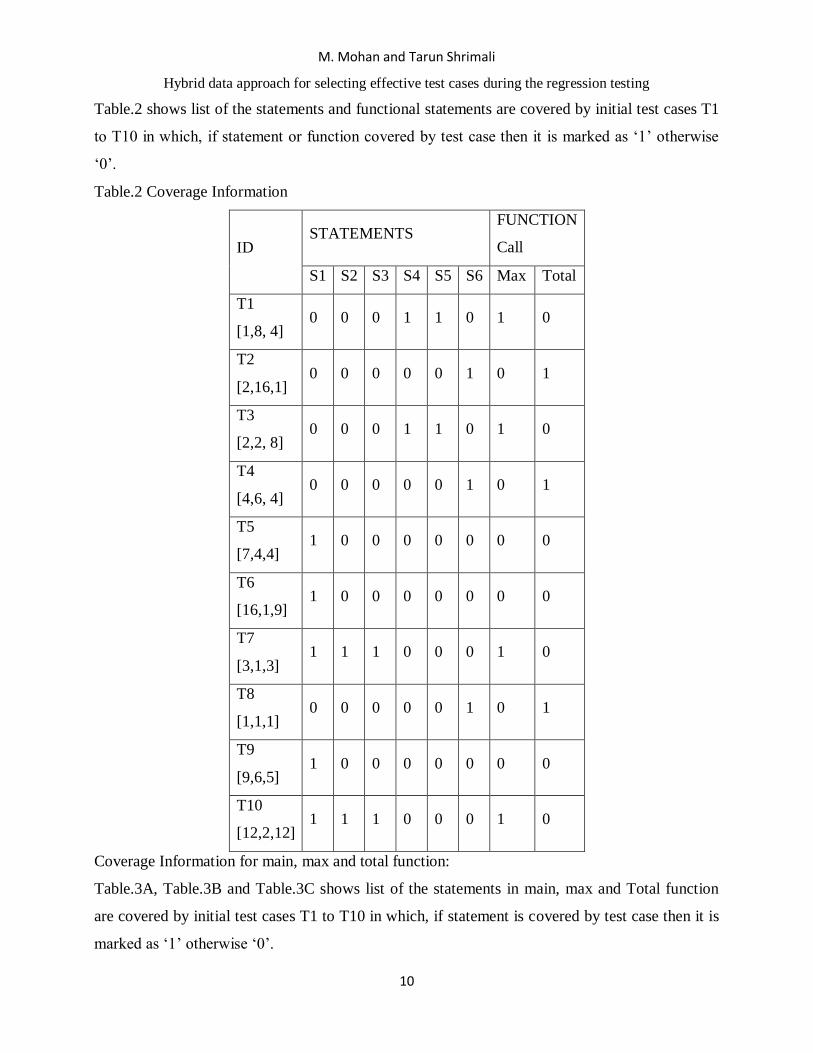
Table.2 shows list of the statements and functional statements are covered by initial test cases T1
to T10 in which, if statement or function covered by test case then it is marked as „1‟ otherwise
„0‟.
Table.2 Coverage Information
ID STATEMENTS
FUNCTION
Call
S1 S2 S3 S4 S5 S6 Max Total
T1
[1,8, 4] 0 0 0 1 1 0 1 0
T2
[2,16,1] 0 0 0 0 0 1 0 1
T3
[2,2, 8] 0 0 0 1 1 0 1 0
T4
[4,6, 4] 0 0 0 0 0 1 0 1
T5
[7,4,4] 1 0 0 0 0 0 0 0
T6
[16,1,9] 1 0 0 0 0 0 0 0
T7
[3,1,3] 1 1 1 0 0 0 1 0
T8
[1,1,1] 0 0 0 0 0 1 0 1
T9
[9,6,5] 1 0 0 0 0 0 0 0
T10
[12,2,12] 1 1 1 0 0 0 1 0
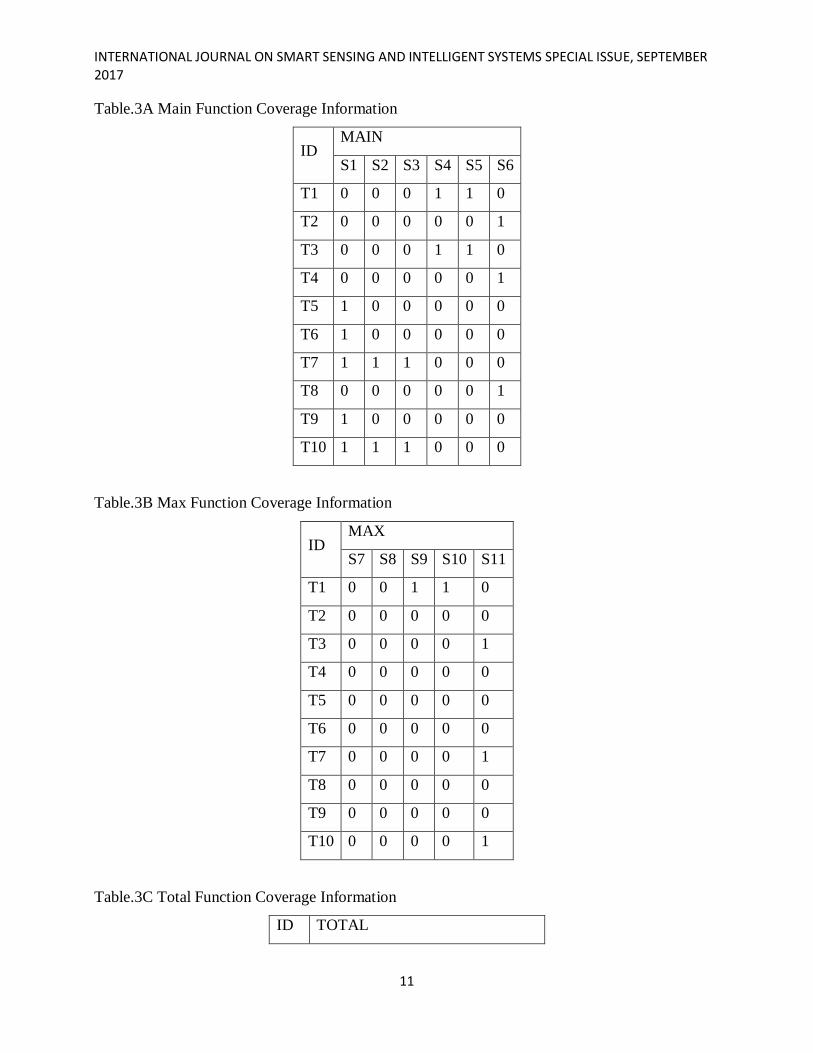
Coverage Information for main, max and total function:
Table.3A, Table.3B and Table.3C shows list of the statements in main, max and Total function
are covered by initial test cases T1 to T10 in which, if statement is covered by test case then it is
marked as „1‟ otherwise „0‟.
INTERNATIONAL JOURNAL ON SMART SENSING AND INTELLIGENT SYSTEMS SPECIAL ISSUE, SEPTEMBER 2017
11
Table.3A Main Function Coverage Information
ID MAIN
S1 S2 S3 S4 S5 S6
T1 0 0 0 1 1 0
T2 0 0 0 0 0 1
T3 0 0 0 1 1 0
T4 0 0 0 0 0 1
T5 1 0 0 0 0 0
T6 1 0 0 0 0 0
T7 1 1 1 0 0 0
T8 0 0 0 0 0 1
T9 1 0 0 0 0 0
T10 1 1 1 0 0 0
Table.3B Max Function Coverage Information
ID MAX
S7 S8 S9 S10 S11
T1 0 0 1 1 0
T2 0 0 0 0 0
T3 0 0 0 0 1
T4 0 0 0 0 0
T5 0 0 0 0 0
T6 0 0 0 0 0
T7 0 0 0 0 1
T8 0 0 0 0 0
T9 0 0 0 0 0
T10 0 0 0 0 1
Table.3C Total Function Coverage Information
ID TOTAL

M. Mohan and Tarun Shrimali
Hybrid data approach for selecting effective test cases during the regression testing
12
S12 S13 S14 S15 S16 S17
T1 0 0 0 0 0 0
T2 0 0 0 1 1 0
T3 0 0 0 0 0 0
T4 0 0 0 0 0 1
T5 0 0 0 0 0 0
T6 0 0 0 0 0 0
T7 0 0 0 0 0 0
T8 0 0 0 1 1 0
T9 0 0 0 0 0 0
T10 0 0 0 0 0 0
Initially Greedy approach has been used for test case reduction and then if there is any test case
has tie during test case reduction then Genetic approach has been applied for handling test case
tie to improving the TCR process. Table4 shows list of statement are covered by every test cases
from test suite [T1…T10]. After finding coverage information, the weight map has been
generated and Greedy approach used for selecting the test cases in which test case is selected
which one has highest weight. The coverage information, weight mapping and selected test case
by Greedy approach follows
Table.4 Weight Mapping 1
TEST CASE STATEMENT COVERED
T1 4, 5, 9, 10
T2 6, 15, 16
T3 4, 5, 11
T4 6, 17
T5 1
T6 1
T7 1, 2, 3, 11
T8 6, 15, 16
T9 1

INTERNATIONAL JOURNAL ON SMART SENSING AND INTELLIGENT SYSTEMS SPECIAL ISSUE, SEPTEMBER 2017
13
T10 1, 2, 3, 11
Weight map calculated by total number of statement covered by test case. In Table 4, four
statements covered by T1, three statements by T2 and so on. Then highest weight 4 is selected
from the weight mapping sequence and corresponding test case T1is selected. The weight
mapping followsWeight mapping: 4, 3, 3, 2, 1, 1, 4, 3, 1, 4
Selected test case: T1
In Table 5 shows that the statements which are covered by selected test case T1 that statements
are marked as „0‟. The table follows
Table.5 Weight Mapping 2
TEST CASE STATEMENT COVERED
T1 0, 0, 0, 0
T2 6, 15, 16
T3 0, 0, 11
T4 6, 17
T5 1
T6 1
T7 1, 2, 3, 11
T8 6, 15, 16
T9 1
T10 1, 2, 3, 11
Weight Map: 0, 3, 1, 2, 1, 1, 4, 3, 1, 4
Selected Test cases: T7 and T10
From the Table.5 weight map two test cases T7 and T10 are selected, because both test cases
having same weight as well as covering same statements. To handle this test case tie, both test
case selected and optimized in the further process with help of genetic algorithm. This process
will continue until all the statements covered by selected test cases. The further reduction process
follows
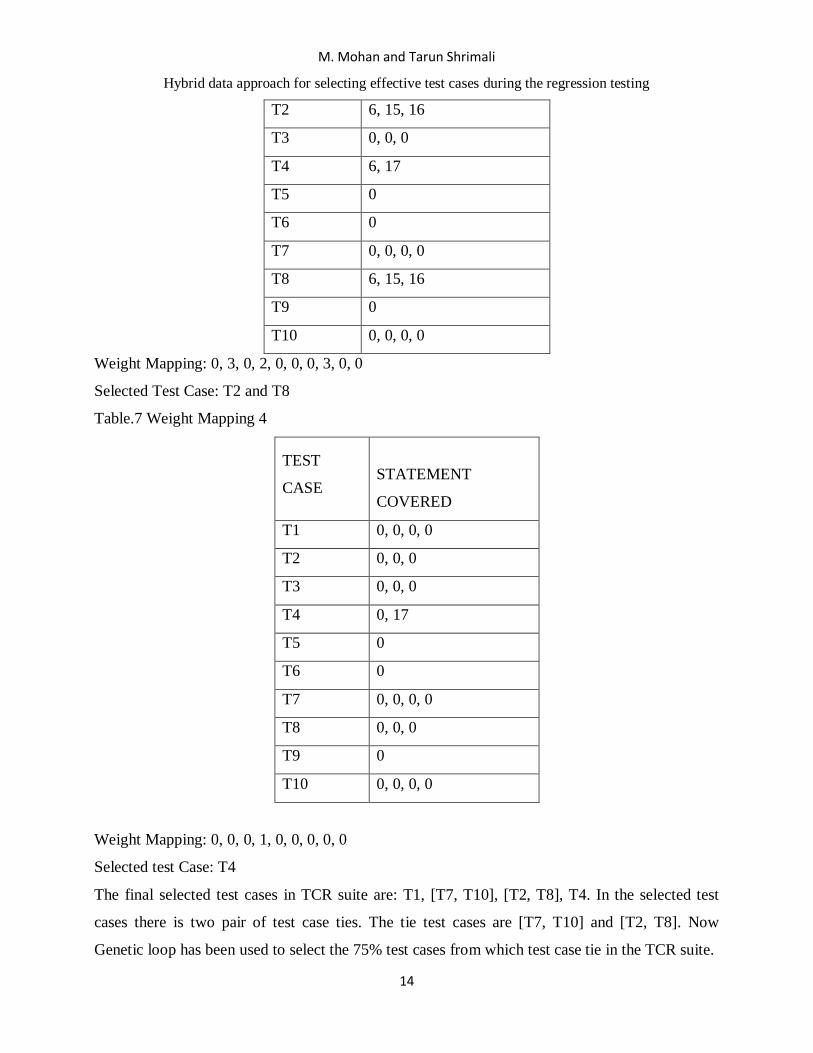
Table.6 Weight Mapping 3
TEST CASE STATEMENT COVERED
T1 0, 0, 0, 0
M. Mohan and Tarun Shrimali
Hybrid data approach for selecting effective test cases during the regression testing
14
T2 6, 15, 16
T3 0, 0, 0
T4 6, 17
T5 0
T6 0
T7 0, 0, 0, 0
T8 6, 15, 16
T9 0
T10 0, 0, 0, 0
Weight Mapping: 0, 3, 0, 2, 0, 0, 0, 3, 0, 0
Selected Test Case: T2 and T8
Table.7 Weight Mapping 4
TEST
CASE
STATEMENT
COVERED
T1 0, 0, 0, 0
T2 0, 0, 0
T3 0, 0, 0
T4 0, 17
T5 0
T6 0
T7 0, 0, 0, 0
T8 0, 0, 0
T9 0
T10 0, 0, 0, 0
Weight Mapping: 0, 0, 0, 1, 0, 0, 0, 0, 0
Selected test Case: T4
The final selected test cases in TCR suite are: T1, [T7, T10], [T2, T8], T4. In the selected test
cases there is two pair of test case ties. The tie test cases are [T7, T10] and [T2, T8]. Now
Genetic loop has been used to select the 75% test cases from which test case tie in the TCR suite.

INTERNATIONAL JOURNAL ON SMART SENSING AND INTELLIGENT SYSTEMS SPECIAL ISSUE, SEPTEMBER 2017
15
For Genetic Loop, we have considered the test cases T7, T10, T8, T2 because T7 & T10 tied and
T2 & T8 are tied. Now Genetic loop has been applied to select the 75% of test cases from above
considered test cases. In the Genetic loop we have generated initial population for every test
cases based on its coverage and history factor. In the Initial population generation, if any
statement covered by test case than it Gene marked as „1‟ otherwise „0‟. In the Table.8 first 17
bits represent statement coverage information and last four bit represent binary equivalent of
history factor of the test case.
Table.8Initial Population
Test ID T2 T7 T8 T10
I
N
I
T
I
A
L
P
O
P
U
L
A
T
I
O
N
0 1 0 1
0 1 0 1
0 1 0 1
0 0 0 0
0 0 0 0
1 0 1 0
0 0 0 0
0 0 0 0
0 0 0 0
0 0 0 0
0 1 0 1
0 0 0 0
0 0 0 0
0 0 0 0
1 0 1 0
1 0 1 0
0 0 0 0
0 0 0 0
1 0 0 0
1 0 0 1
0 1 0 1

M. Mohan and Tarun Shrimali
Hybrid data approach for selecting effective test cases during the regression testing
16
Next step of the Genetic loop is Fitness value calculation for all the test cases. In this step, the
fitness value calculated by formula
n
i 1 (GeneiX Wi) (1)
Here „W‟ (Weight) represents weight of the statement given in Table.1and weightage of first
Gene of history factor is 0.8, second weightage is 0.4, third weightage is 0.2 and the fourth
weightage is 0.1has been considered. The Fitness value follows
Table.9 Fitness Value
TES
T ID FITNESS VALUE
T2 (1*0.4)+(1*0.5)+(1*0.5)+(1*0.4)+(
1*0.2) =2.0
T7 (1*0.2)+(1*0.2)+(1*0.2)+(1*0.7)+(
1*0.1)=1.4
T8 (1*0.4)+(1*0.5)+(1*0.5) =1.4
T10 (1*0.2)+(1*0.2)+(1*0.2)+
(1*0.7)=1.3
Next step of the Genetic loop is Selection. Initially, Selection loop selects any two test cases from
the Roulette wheel. Assume T7 and T10 has selected from Roulette wheel in the first iteration of
selection loop. Then further steps follows
Table.10 TC Combination

INTERNATIONAL JOURNAL ON SMART SENSING AND INTELLIGENT SYSTEMS SPECIAL ISSUE, SEPTEMBER 2017
17
Before combining T7 with T10, our coverage percentage is 23.80. After combining with T7 and
T10 our coverage percentage improved from 23.80 to 28.56. But still our coverage percentage is
not meeting our target percentage (50%). So we need crossover loop for next level optimization
in which 4th& 5th bit of T7 and 11th&12th bit has been considered for crossover operation. The
crossover step shown in Table.11.
Table.11 TC Cross Over
T7 T10 OR
1 1 1
1 1 1
1 1 1
0 0 0
0 0 0
0 0 0
1 0 1
0 0 0
0 0 0
0 0 0
1 0 1
0 0 0
0 0 0
0 0 0
0 0 0
0 0 0
0 0 0
0 0 0
0 0 0
0 1 1
1 1 1

M. Mohan and Tarun Shrimali
Hybrid data approach for selecting effective test cases during the regression testing
18
Before crossover of T7 with T10, our coverage percentage is 28.56. After crossover, our
coverage percentage improved from 28.56 to 33.33. But still our coverage percentage is not
meeting our target percentage (50%). So we need mutation loop for next level optimization in
which „0‟ as „1‟ and vice versa. Here 8th and 9th bit has been considered from crossover output
for mutation operation. The mutation step shown in Table.12.
Table.12 TC Mutation
OR
1
T7 T10 OR
1 1 1
1 1 1
1 1 1
0 0 0
0 0 0
0 0 0
0 0 0
0 0 0
0 0 0
0 0 0
1 1 1
0 0 0
0 0 0
0 0 0
0 0 0
0 0 0
0 0 0
0 0 0
0 0 0
0 1 1
1 1 1

INTERNATIONAL JOURNAL ON SMART SENSING AND INTELLIGENT SYSTEMS SPECIAL ISSUE, SEPTEMBER 2017
19
1
1
0
0
0
1
1
1
0
1
0
0
0
0
0
0
0
0
1
1
Before mutation our coverage percentage is 33.33. After mutation, our coverage percentage
improved from 33.33 to 42.85. But still our coverage percentage is not meeting our target
percentage (50%). At end of this iteration, both combination of T7 & T10 has not reached our
target. So highest Fitness value test case T7 is retained and one new test case selected from
Roulette wheel for further optimization to reach our target. These Genetic loops repeat the
process until 75% of test cases are retained. Suppose all combination of test cases not meet our
target criteria then the target criteria reduced and Genetic loop will be initiated for new target. At
end of Genetic loop the selected test cases are T10, T2 and T7. The final selected test cases using
combination of Greedy and Genetic Algorithm are T1, T10, T2, T4 and T7.
Result Analysis

M. Mohan and Tarun Shrimali
Hybrid data approach for selecting effective test cases during the regression testing
20
In Figure.2 shown that the performance of basic Greedy algorithm. In the performance chart X-
axis represent Test Case ID and Y-axis represent Number of Statements covered. Chart shows
total six number of test case selected from test suite and covering the 12 statement that needs
execution of all six test cases because those 12statements covered after execution of last test case
T4.
Figure.2 Basic Greedy Approach
0
2
4
6
8
10
12
14
T1 T7 T10 T2 T8 T4
No.Of.Statement
Figure.3 shows that the performances of Hybrid approach. In the performance chart X-axis
represent Test Case ID and Y-axis represent Number of Statements covered.The performance
chart shows five test cases selected from test suite and covering 12 statements.
The Basic Greedy approach covered 12 statements after execution of fifth test case. From the
analysis of Greedy and Hybrid approach, we can conclude that our proposed approach is better
than Basic Greedy approach in terms of covering the statement as earlier as possible and reducing
number of test cases in the test suite.Hybrid approach proves that it takes less time in testing to
cover same number of statement which covered in basic greedy Algorithm and also Hybrid
approach will reduce the testing Cost.
Figure.3Hybrid Approach(Greedy+Genetic)

INTERNATIONAL JOURNAL ON SMART SENSING AND INTELLIGENT SYSTEMS SPECIAL ISSUE, SEPTEMBER 2017
21
0
2
4
6
8
10
12
14
T1 T7 T10 T4 T2
No.of.Statement
V. Conclusion and Future
In this research we have introduced new proposed model for test case reduction and
prioritization. To reduce number of test cases in the test suite, Hybrid approach for has been used.
Finally result of Hybrid approach has compared with Basic Greedy approach and this research
proved that performance of Hybrid approach is better than Basic Greedy approach for effective
test case selection. In this Hybrid approach, only 25% of test cases are eliminated from tied test
suite but still there is some tied test cases in the reduction test suite that degrades performance of
the testing during the test case prioritization. In future, this research going to focus on effective
test case prioritization for tied test case instead of random prioritization.
References
REFERENCES
[1] Aizat Azmi, Ahmad Amsyar Azman, Sallehuddin Ibrahim, and Mohd Amri Md Yunus,
“Techniques In Advancing The Capabilities Of Various Nitrate Detection Methods: A Review”,
International Journal on Smart Sensing and Intelligent Systems., VOL. 10, NO. 2, June 2017, pp.
223-261.

M. Mohan and Tarun Shrimali
Hybrid data approach for selecting effective test cases during the regression testing
22
[2] Tsugunosuke Sakai, Haruya Tamaki, Yosuke Ota, Ryohei Egusa, Shigenori Inagaki, Fusako
Kusunoki, Masanori Sugimoto, Hiroshi Mizoguchi, “Eda-Based Estimation Of Visual Attention
By Observation Of Eye Blink Frequency”, International Journal on Smart Sensing and Intelligent
Systems., VOL. 10, NO. 2, June 2017, pp. 296-307.
[3] Ismail Ben Abdallah, Yassine Bouteraa, and Chokri Rekik , “Design And Development Of 3d
Printed Myoelctric Robotic Exoskeleton For Hand Rehabilitation”, International Journal on
Smart Sensing and Intelligent Systems., VOL. 10, NO. 2, June 2017, pp. 341-366.
[4] S. H. Teay, C. Batunlu and A. Albarbar, “Smart Sensing System For Enhanceing The
Reliability Of Power Electronic Devices Used In Wind Turbines”, International Journal on Smart
Sensing and Intelligent Systems., VOL. 10, NO. 2, June 2017, pp. 407- 424
[5] SCihan Gercek, Djilali Kourtiche, Mustapha Nadi, Isabelle Magne, Pierre Schmitt, Martine
Souques and Patrice Roth, “An In Vitro Cost-Effective Test Bench For Active Cardiac Implants,
Reproducing Human Exposure To Electric Fields 50/60 Hz”, International Journal on Smart
Sensing and Intelligent Systems., VOL. 10, NO. 1, March 2017, pp. 1- 17
[6] P. Visconti, P. Primiceri, R. de Fazio and A. Lay Ekuakille, “A Solar-Powered White Led-
Based Uv-Vis Spectrophotometric System Managed By Pc For Air Pollution Detection In
Faraway And Unfriendly Locations”, International Journal on Smart Sensing and Intelligent
Systems., VOL. 10, NO. 1, March 2017, pp. 18- 49
[7] Samarendra Nath Sur, Rabindranath Bera and Bansibadan Maji, “Feedback Equalizer For
Vehicular Channel”, International Journal on Smart Sensing and Intelligent Systems., VOL. 10,
NO. 1, March 2017, pp. 50- 68
[8] Yen-Hong A. Chen, Kai-Jan Lin and Yu-Chu M. Li, “Assessment To Effectiveness Of The
New Early Streamer Emission Lightning Protection System”, International Journal on Smart
Sensing and Intelligent Systems., VOL. 10, NO. 1, March 2017, pp. 108- 123
[9] Iman Heidarpour Shahrezaei, Morteza Kazerooni and Mohsen Fallah, “A Total Quality
Assessment Solution For Synthetic Aperture Radar Nlfm Waveform Generation And Evaluation
In A Complex Random Media”, International Journal on Smart Sensing and Intelligent Systems.,
VOL. 10, NO. 1, March 2017, pp. 174- 198
[10] P. Visconti ,R.Ferri, M.Pucciarelli and E.Venere, “Development And Characterization Of A
Solar-Based Energy Harvesting And Power Management System For A Wsn Node Applied To
INTERNATIONAL JOURNAL ON SMART SENSING AND INTELLIGENT SYSTEMS SPECIAL ISSUE, SEPTEMBER 2017
23
Optimized Goods Transport And Storage”, International Journal on Smart Sensing and Intelligent
Systems., VOL. 9, NO. 4, December 2016 , pp. 1637- 1667
[11] YoumeiSong,Jianbo Li, Chenglong Li, Fushu Wang, “Social Popularity Based Routing In
Delay Tolerant Networks”, International Journal on Smart Sensing and Intelligent Systems.,
VOL. 9, NO. 4, December 2016 , pp. 1687- 1709
[12] Seifeddine Ben Warrad and OlfaBoubaker, “Full Order Unknown Inputs Observer For
Multiple Time-Delay Systems”, International Journal on Smart Sensing and Intelligent Systems.,
VOL. 9, NO. 4, December 2016 , pp. 1750- 1775
[13] Rajesh, M., and J. M. Gnanasekar. "Path observation-based physical routing protocol for
wireless ad hoc networks." International Journal of Wireless and Mobile Computing 11.3 (2016):
244-257.
[14]. Rajesh, M., and J. M. Gnanasekar. "Congestion control in heterogeneous wireless ad hoc
network using FRCC." Australian Journal of Basic and Applied Sciences 9.7 (2015): 698-702.
[15]. Rajesh, M., and J. M. Gnanasekar. "GCCover Heterogeneous Wireless Ad hoc Networks."
Journal of Chemical and Pharmaceutical Sciences (2015): 195-200.
[16]. Rajesh, M., and J. M. Gnanasekar. "CONGESTION CONTROL USING AODV
PROTOCOL SCHEME FOR WIRELESS AD-HOC NETWORK." Advances in Computer
Science and Engineering 16.1/2 (2016): 19.
[17]. Rajesh, M., and J. M. Gnanasekar. "An optimized congestion control and error management
system for OCCEM." International Journal of Advanced Research in IT and Engineering 4.4
(2015): 1-10.
[18]. Rajesh, M., and J. M. Gnanasekar. "Constructing Well-Organized Wireless Sensor
Networks with Low-Level Identification." World Engineering & Applied Sciences Journal 7.1
(2016).
[19] Aftab Ali Haider, AcmerNadeem, ShamailaAkram, “Safe Regression Test Suite
Optimization: A Review”,In: Proc. of IEEE International Conference on Open Source Systems
and Technologies, pp. 7-12, 2016.
[20] AvinashGupta,Namita Mishra,Dharmender Singh Kushwaha, “Rule-Based test case
Reduction Technique using Decision Table”,In: Proc. of IEEE Conference on International
Advance Computing Conference,pp.1398-1405,2014.

M. Mohan and Tarun Shrimali
Hybrid data approach for selecting effective test cases during the regression testing
24
[21] Annibalepanichella,Rocco oliveto,Massimiliano Di Penta,Andrea De Lucia, “ Improving
multi-objective test case Selection by Injecting Diversity in genetic Algorithms”, IEEE
Transactions on Software Engineering,pp.358-383,Vol.41,No.4,April 2015.
[22] Zhang Hui, “Fault Localization Method Generated by Regression Test Cases on the Basis of
Genetic Immune Algorithm”, In: proc. Of IEEE conference on Annual International Computers,
Software & Applications Conference, pp. 46-51, 2016.
[23] S. Yoo and M. Harman, “Regression testing minimization, selectionand prioritization: A
survey,” Softw. Test. Verif. Rel., vol. 22,no. 2, pp. 67–120, Mar. 2012.
[24] S. Yoo, “A novel mask-coding representation for set cover problemswith applications in test
suite minimisation,” In: Proc. of 2nd International Symposium. Search-Based Software. Eng.,
2010, pp. 19–28.
[25] S. Yoo and M. Harman, “Pareto efficient multi-objective test case selection,” In: Proc. of
ACM /SIGSOFT Int. Symp. Softw. Testing Anal.,2007, pp. 140–150.
[26] S. Yoo and M. Harman, “Using hybrid algorithm for Pareto efficientmulti-objective test
suite minimisation,” J. Syst. Softw.,vol. 83, no. 4, pp. 689–701, 2010.
[27] S. Yoo, M. Harman, and S. Ur, “Highly scalable multi objectivetest suite minimization using
graphics cards,” In:Proc. of 3rd Int.Conf. Search Based Softw. Eng., 2011, pp. 219–236.
[28] Q. Zhang and Y.-W. Leung, “An orthogonal genetic algorithm for multimedia multicast
routing,” IEEE Trans. Evol. Comput., vol. 3,no. 1, pp. 53–62, Apr. 1999.
[29] J. Zhu, G. Dai, and L. Mo, “A cluster-based orthogonal multi objective genetic algorithm”,
Comput. Intell. Intell. Syst., vol. 51,pp. 45–55, 2009.
[30] E. Zitzler, D. Brockhoff, and L. Thiele, “The hypervolume indicatorrevisited: On the design
of Pareto-compliant indicators via weighted integration”,In: Proc. of 4th Int. Conf. Evol. Multi-
CriterionOptim., 2007, pp. 862–876.
[31] Jones JA, Harrold MJ. “Empirical Evaluation of the Tarantula Automatic Fault -
Localization Technique”. In: Proc. of 20th IEEE/ ACM International Conference on Automated
Software Engineering, 2005: 273-282.
[32] Jones JA, Harrold MJ, Stasko J. “Visualization of Test Information to Assist Fault
Localization”.In: Proc. ofthe 24th International Conference on Software Engineering, 2002:467-
477.