hy 2016 - asx · hy 2016 results presentation a visionary adventure leisure company ... investor...
TRANSCRIPT

HY 2016 Results Presentation
A visionary adventure leisure company formed to build and operate world class indoor skydiving facilities across the region
For
per
sona
l use
onl
y

Disclaimer
2
This presentation has been prepared by Indoor Skydive Australia Group Limited (ISA Group) and provides general background information about the Company’s activities. That information is current at the date of this presentation. The information is a summary and does not purport to be complete. This presentation is not (and should be construed as) an offer, invitation, solicitation or recommendation with respect to the subscription for, purchase or sale of any security in any jurisdiction, and neither this document nor anything in it shall form the basis of any contract or commitment. The presentation is not intended to be relied upon as advice to investors or potential investors and does not take into account the investment objectives, financial situation or needs of any particular investor which need to be considered, with or without professional advice, when deciding whether an investment is appropriate.
ISA Group has prepared this presentation based on information available to it, including information derived from publically available sources that have not been independently verified. No representation or warranty, express or implied, is made as to the fairness, accuracy, completeness, correctness or reliability of the information, opinions and conclusions expressed in this presentation.
Any statements or assumptions in this presentation as to future matters may prove to be incorrect and the differences may be material. This presentation should not be relied upon as a recommendation of or forecast by the Company. To the maximum extent permitted by law, none of the Company, its directors, employees or agents , or any other person accepts any liability, including without limitation, any liability arising from fault or negligence on the part of any of them or any other person, for any loss arising from the use of this presentation or its content or otherwise arising in connection with it.
The financial information disclosed in this presentation has been prepared on a statutory and pro forma basis consistent with the financial information prepared in the Company’s accounts. Due care and attention should be undertaken when considering and analysing the financial performance of the Company. All references to dollars are to Australian currency unless otherwise stated. The distribution of this presentation in jurisdictions outside Australia may be restricted by law and you should observe such restrictions.
For
per
sona
l use
onl
y

Contents 1. Overview
2. Results & Analysis 3. Strategy 4. Current Focus 5. Outlook 6. Summary 7. Appendices F
or p
erso
nal u
se o
nly

Utilisation Remains Strong: 66%
1. Overview
* Comprises Penrith iFLY Downunder Facility - iFLY Gold Coast opening post period end 4
Highlights
VWT Operations Revenue Contribution*: $3.6m
VWT Operational EBITDA Margin*: 55%
Cost of Sales Decreased
Delivery of Rollout continues – Gold Coast Opening
International IT Systems Development
Debt Facility in place
For
per
sona
l use
onl
y

Dec 2015 HY only (‘000)
June 2015 FY (‘000)
Dec 2014 HY only (‘000)
Consolidated Revenue $3,905 $6,588 $3,185
Consolidated EBITDA* $33 ($833) ($1,597)
Consolidated NPAT ($190) ($1,750) ($1,995)
VWT Operational EBITDA $1,992 $3,056 $1,269
Cashflow from operations $1,550 $683 $241
Net Tangible Assets/Share $0.24 $0.25 $0.25
2. Results & Analysis
* Reported EBITDA includes the effect of share based payments 5
For
per
sona
l use
onl
y
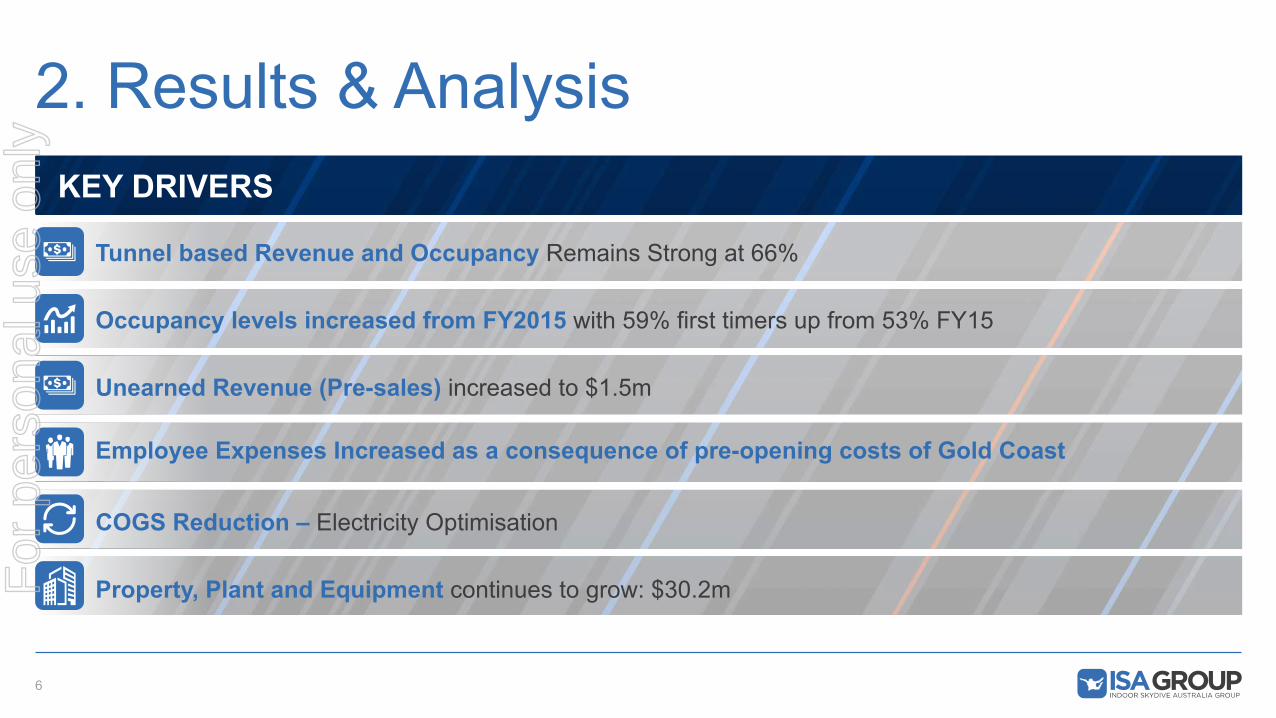
2. Results & Analysis
6
Tunnel based Revenue and Occupancy Remains Strong at 66%
Occupancy levels increased from FY2015 with 59% first timers up from 53% FY15
Unearned Revenue (Pre-sales) increased to $1.5m
COGS Reduction – Electricity Optimisation
Property, Plant and Equipment continues to grow: $30.2m
KEY DRIVERS
Employee Expenses Increased as a consequence of pre-opening costs of Gold Coast
For
per
sona
l use
onl
y

2. Results & Analysis
7
First timers Professional Groups / Events Merchandise
Average Weekday Revenue Mix Average Weekend Revenue Mix Average Weekly Revenue Mix
Unique Visitors – 20,790 (6 months)
For
per
sona
l use
onl
y
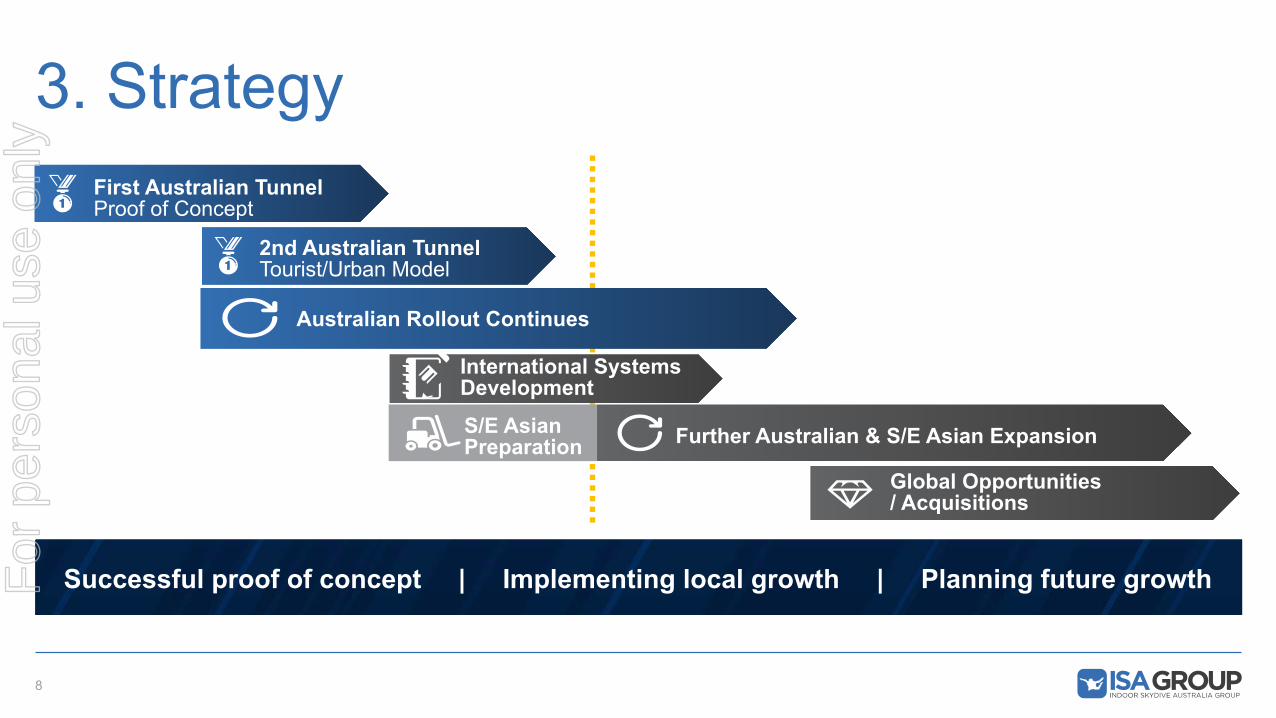
3. Strategy
8
Successful proof of concept | Implementing local growth | Planning future growth
First Australian Tunnel Proof of Concept
Australian Rollout Continues
International Systems Development
Global Opportunities / Acquisitions
S/E Asian Preparation Further Australian & S/E Asian Expansion
2nd Australian Tunnel Tourist/Urban Model
For
per
sona
l use
onl
y

4. Current Focus
9
§ Proof of Concept Sydney and Gold Coast
§ Growth in market segments
§ Business Model Blueprint
§ International capable IT Systems
Australian Tunnel Operations
§ Fabrication Complete
§ DA Approved
§ Site established
§ Early works to commence Mar 16
§ Open Last Qtr16 (construction risks)
Perth Construction
Contingencies: § Currency
§ Construction risk
§ Economic downturn
Managed by:
§ Project Timeline Management
§ Cost Management
§ Debt
Resulting in: § Growth Platform
§ Stable Operations
§ Economies of Scale
§ Corporate overhead absorption
Further Expansion § Additional Australian
Projects
§ Partnership Projects: Australia & NZ (SkyVenture Projects)
§ S/E Asia
§ Hong Kong
§ Acquisitions For
per
sona
l use
onl
y

10
Driving Performance 4. Current Focus
• 12ft Chamber • High foot traffic
location • International
Tourist • Corporate Events
• 16ft Chamber • Western Sydney • Specialist Military/
Professional • Skydiver Training
• 14ft Chamber • Highly Visible Site • 5 min from CBD • Opening late 2016
For
per
sona
l use
onl
y

5. Outlook – Global Industry
11
80+ Vertical Wind Tunnels in Operation World Wide*
20+ New Wind Tunnels Opened in 2015*
Global Growth of 50% expected in the next 12 months
Increased technology and efficiency as further credible manufacturers enter the market.
*Source - indoorskydivingsource.com
Proven Business Model – expanding successful operations world wide.
For
per
sona
l use
onl
y

6. Summary
12
Clear strategy for growth
Dynamic Board of Directors
Strong management team
Expertise in planning and execution
Proven to deliver
Flexibility in engagement / manufacturers / technology For
per
sona
l use
onl
y
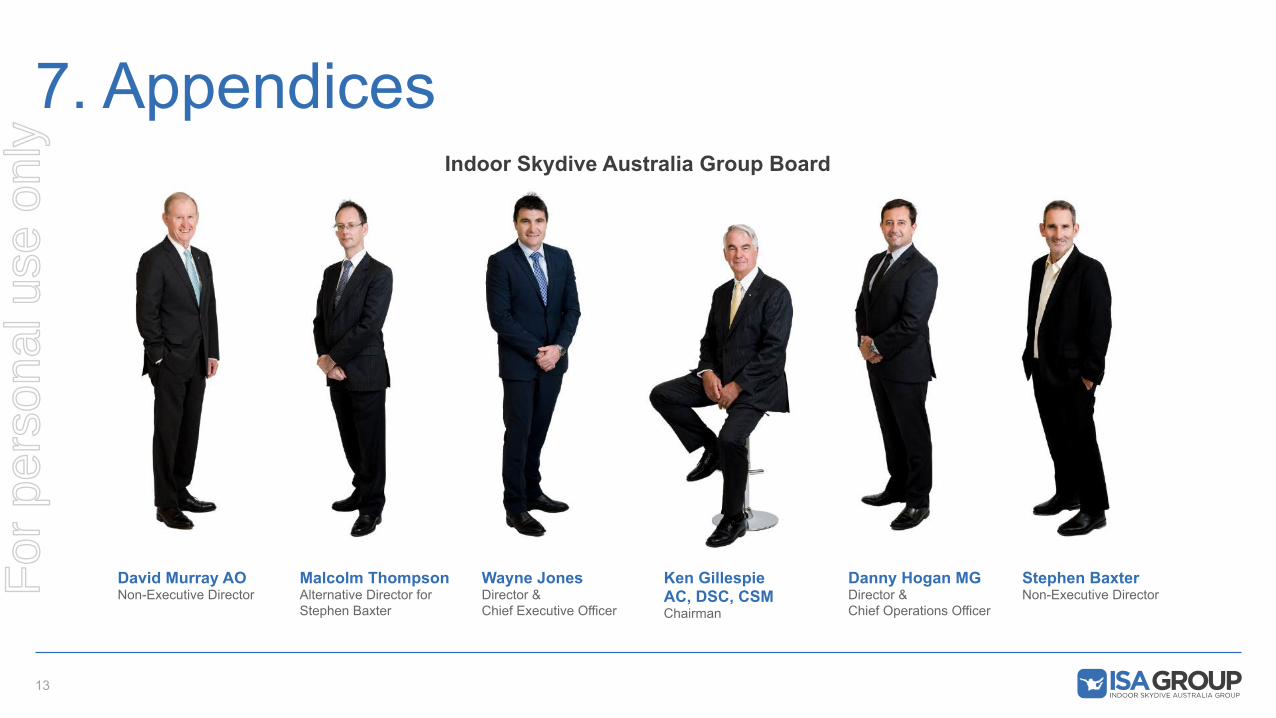
7. Appendices
13
Stephen Baxter Non-Executive Director
Wayne Jones Director & Chief Executive Officer
Ken Gillespie AC, DSC, CSM Chairman
Danny Hogan MG Director & Chief Operations Officer
Malcolm Thompson Alternative Director for Stephen Baxter
David Murray AO Non-Executive Director
Indoor Skydive Australia Group Board
For
per
sona
l use
onl
y
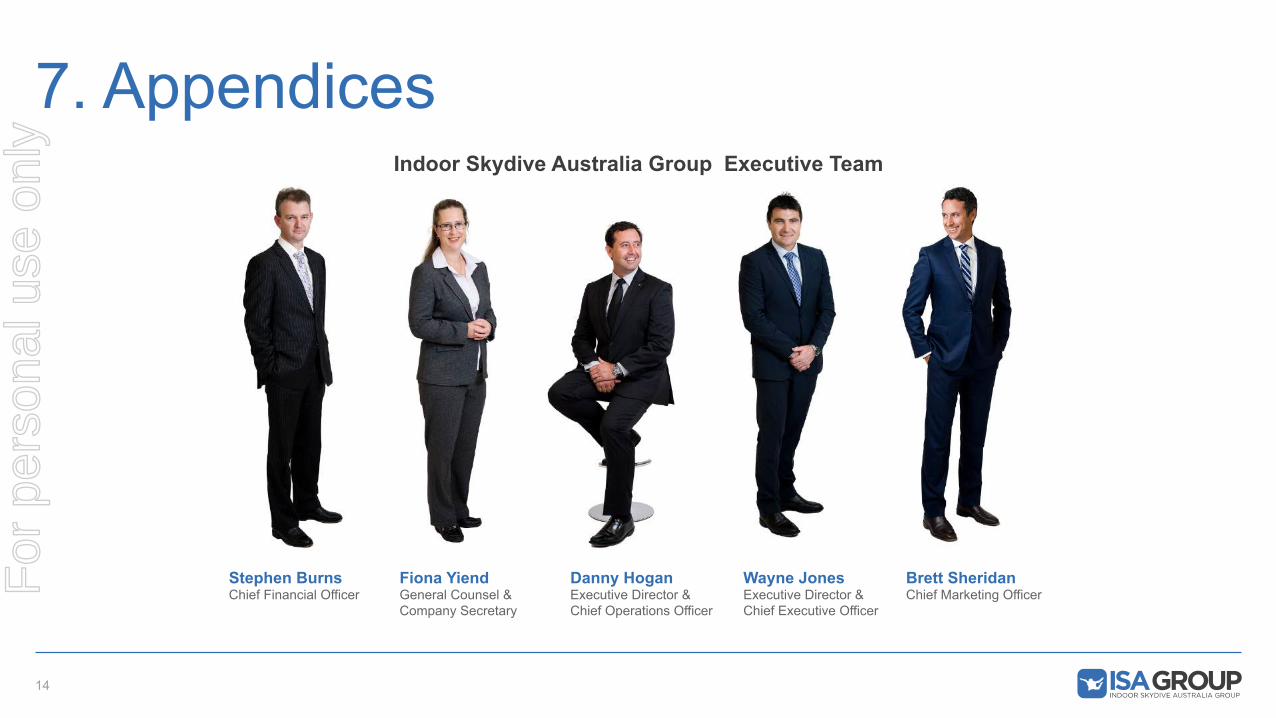
7. Appendices
14
Brett Sheridan Chief Marketing Officer
Fiona Yiend General Counsel & Company Secretary
Danny Hogan Executive Director & Chief Operations Officer
Wayne Jones Executive Director & Chief Executive Officer
Stephen Burns Chief Financial Officer
Indoor Skydive Australia Group Executive Team
For
per
sona
l use
onl
y

7. Appendices
15
Wind Tunnels – Long Term, High Growth, Global Market – 15 Year CAGR 25%
Global Wind Tunnel Market – Installed Capacity
0
20
40
60
80
100
120
140
160
<1991 1992 1993 1994 1995 1996 1997 1998 1999 2000 2001 2002 2003 2004 2005 2006 2007 2008 2009 2010 2011 2012 2013 2014 2015 2016 2017
Global Wind Tunnel Market - Installed Capacity
For
per
sona
l use
onl
y
7. Appendices
16
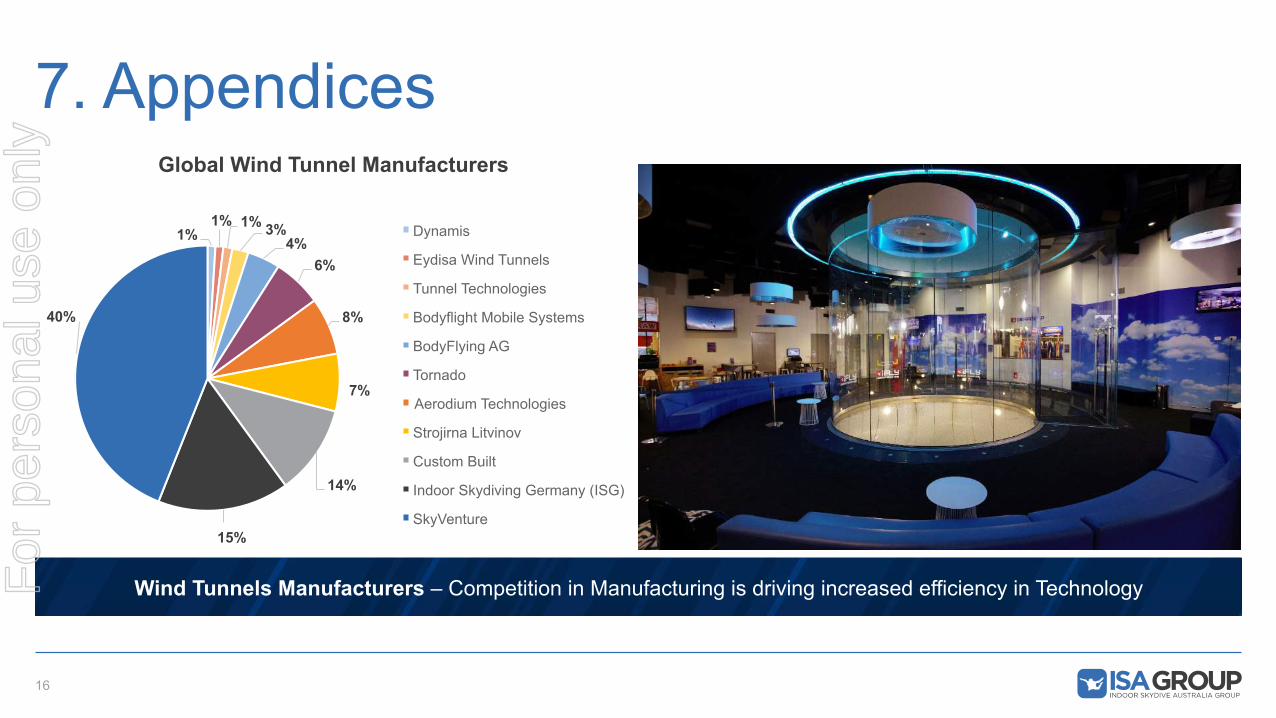
Wind Tunnels Manufacturers – Competition in Manufacturing is driving increased efficiency in Technology
1% 1% 1% 3%
4% 6%
8%
7%
14%
15%
40%
Dynamis
Eydisa Wind Tunnels
Tunnel Technologies
Bodyflight Mobile Systems
BodyFlying AG
Tornado
Aerodium Technologies
Strojirna Litvinov
Custom Built
Indoor Skydiving Germany (ISG)
SkyVenture
Global Wind Tunnel Manufacturers
For
per
sona
l use
onl
y
7. Appendices
17
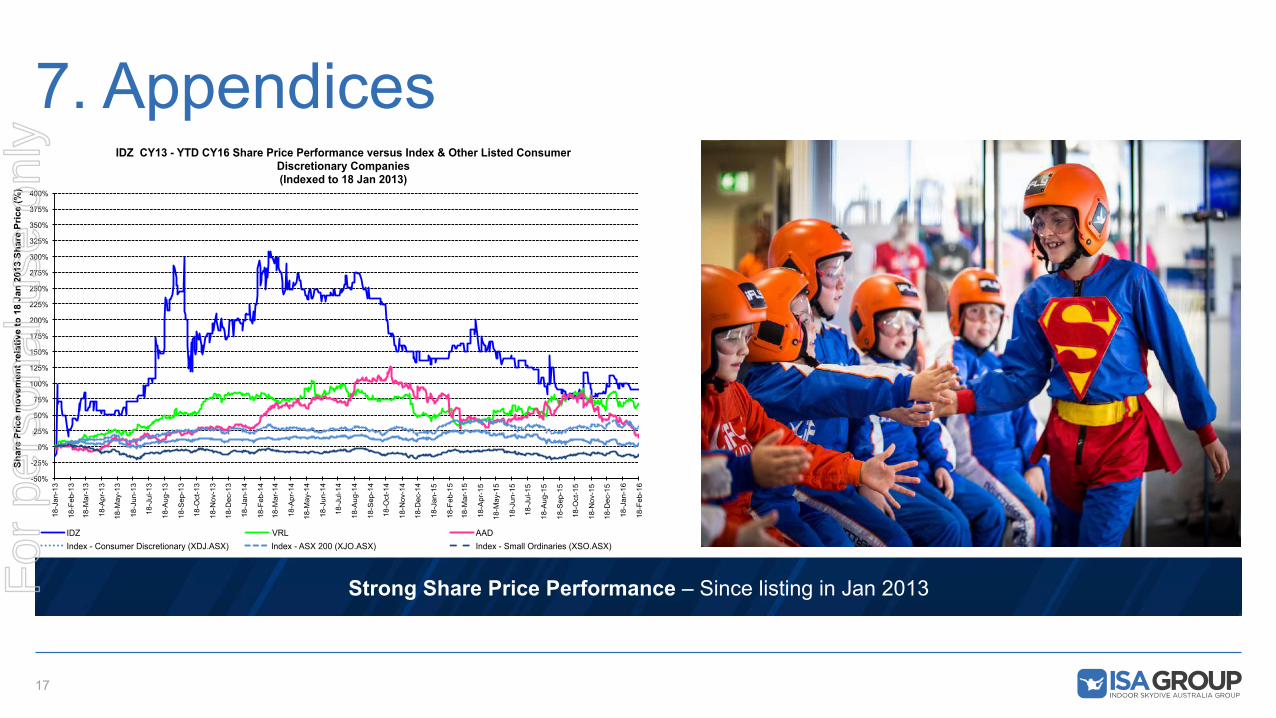
Strong Share Price Performance – Since listing in Jan 2013
-50%
-25%
0%
25%
50%
75%
100%
125%
150%
175%
200%
225%
250%
275%
300%
325%
350%
375%
400%
18-J
an-1
3
18-F
eb-1
3
18-M
ar-1
3
18-A
pr-1
3
18-M
ay-1
3
18-J
un-1
3
18-J
ul-1
3
18-A
ug-1
3
18-S
ep-1
3
18-O
ct-1
3
18-N
ov-1
3
18-D
ec-1
3
18-J
an-1
4
18-F
eb-1
4
18-M
ar-1
4
18-A
pr-1
4
18-M
ay-1
4
18-J
un-1
4
18-J
ul-1
4
18-A
ug-1
4
18-S
ep-1
4
18-O
ct-1
4
18-N
ov-1
4
18-D
ec-1
4
18-J
an-1
5
18-F
eb-1
5
18-M
ar-1
5
18-A
pr-1
5
18-M
ay-1
5
18-J
un-1
5
18-J
ul-1
5
18-A
ug-1
5
18-S
ep-1
5
18-O
ct-1
5
18-N
ov-1
5
18-D
ec-1
5
18-J
an-1
6
18-F
eb-1
6
Sha
re P
rice
mov
emen
t rel
ativ
e to
18
Jan
2013
Sha
re P
rice
(%)
IDZ CY13 - YTD CY16 Share Price Performance versus Index & Other Listed Consumer Discretionary Companies (Indexed to 18 Jan 2013)
IDZ VRL AAD Index - Consumer Discretionary (XDJ.ASX) Index - ASX 200 (XJO.ASX) Index - Small Ordinaries (XSO.ASX)
For
per
sona
l use
onl
y

Thank you
A visionary adventure leisure company formed to build and operate world class indoor skydiving facilities across the region
For
per
sona
l use
onl
y