hvb group annual press conference - hypovereinsbank.de · strategic direction successfully set...
TRANSCRIPT

HVB Group – Annual Press ConferenceResults for the 2015 financial year (provisional and unaudited)
Dr Theodor Weimer, Board Spokesman of HypoVereinsbankFrancesco Giordano, Chief Financial Officer of HypoVereinsbank
Munich, 10 February 2016

2015: a turbulent year for the global economy and the banking industry
2
“Banks increasingly burdened by ultra-low interest rates and regulation” Die Welt, 16/11/2015
“Paris terror appals business”Süddeutsche Zeitung, 16/11/2015
“Banks in one-on-one coverage by watchdog”Badische Zeitung, 15/1/2015
“The year of the refugee”DER SPIEGEL, 12/12/2015
“Crisis in China: the new fear for the global economy”Frankfurter Allgemeine Zeitung, 20/8/2015
“Falling oil price remains a mood killer”Die Welt, 15/12/2015

Financial markets characterised by extreme market trends and increasing volatility in 2015
Oil price (Brent, USD/bbl)
EUR-USD exchange rate
10-year government bonds (%)
0,63
2,27
1,30
0,27 0,00
1,00
2,00
3,00
4,00
2016201520142013201220112010
3.84
3.39
110
94
80
90
100
110
120
130
Jan
Dec
NovOct
Sep
AugJu
l
Jun
MayApr
Mar
Feb
Jan
1,43
1,09
1,00
1,10
1,20
1,30
1,40
1,50
2016201520142013201220112010
78
37
20
40
60
80
100
120
140
20152014 20162013201220112010
DAX / EURO STOXX Banks (indexed)
JapanUSAGermany
3 Source: Bloomberg, UniCredit Research
DAX EURO STOXX Banks

Strong operating performance – HypoVereinsbank increases net operating income by 10.2% to 983 Mio €
Operating income
Operating costs
Operating profit
Net write-downs of loans
Net operating profit
+1.6%
+0.6%
+5.1%
-25.2%
+10.2%
Change, 2015 vs. 2014
4
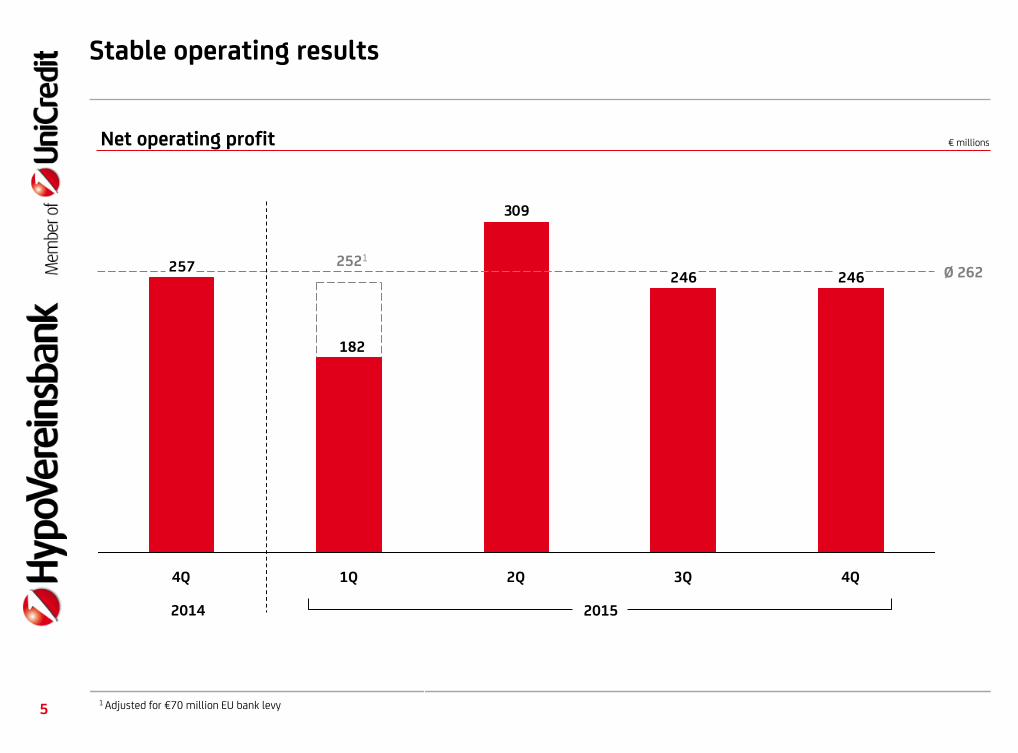
Stable operating results
5
246246
309
257
3Q1Q4Q 4Q2Q
Ø 262
Net operating profit € millions
20152014
182
2521
1 Adjusted for €70 million EU bank levy
Ø 262
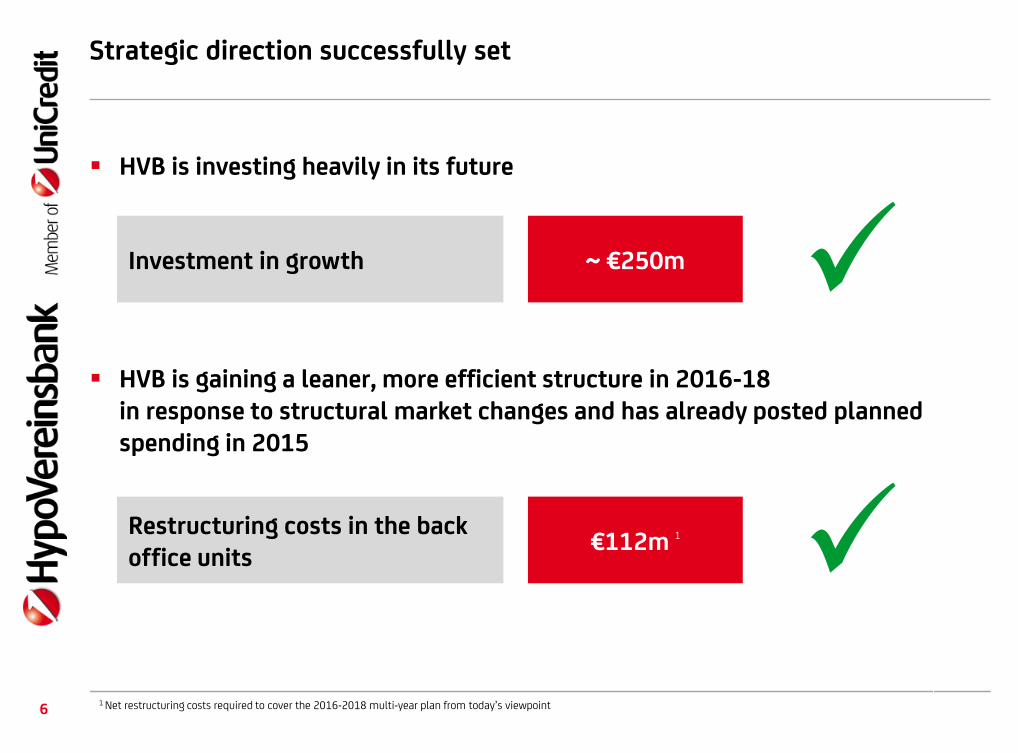
HVB is investing heavily in its future
HVB is gaining a leaner, more efficient structure in 2016-18 in response to structural market changes and has already posted planned spending in 2015
Strategic direction successfully set
Investment in growth ~ €250m
Restructuring costs in the back office units
€112m 1
61 Net restructuring costs required to cover the 2016-2018 multi-year plan from today’s viewpoint

Higher adjusted consolidated profit year-on-year
7
Consolidated profit adjusted for restructuring costs
827
773
+7.0%
20151
2014
€ millions
1 The net restructuring costs posted in 2015 cover the requirements from the 2016-2018 multi-year plan from today’s viewpoint
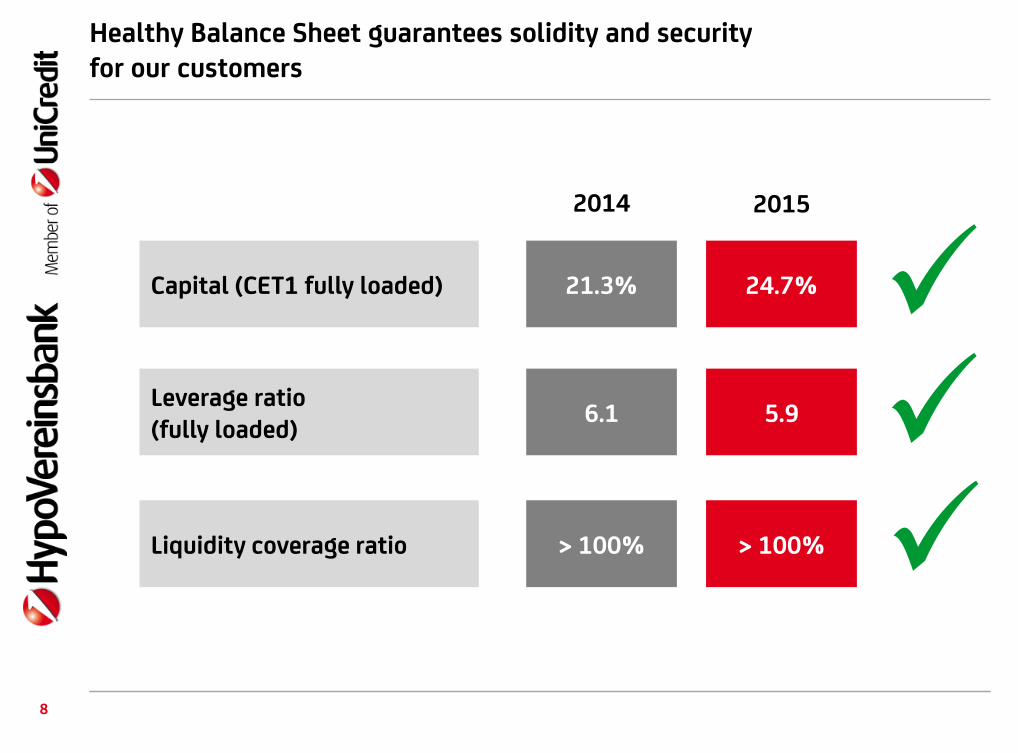
Healthy Balance Sheet guarantees solidity and security for our customers
Capital (CET1 fully loaded)
Leverage ratio(fully loaded)
Liquidity coverage ratio
24.7%
5.9
> 100%
21.3%
6.1
> 100%
20152014
8

Slight increases in net interest and net trading income thanks to stronger customer activities
9
Net interest
2.7282.643
+3.2%
20152014
Slight rise in net interest
despite persistently ultra-low
interest rates
Net fees and commissions Net trading income€ millions € millions€ millions
1.0351.082-4.3%
20152014
Slight fall in net fees and
commissions year-on-year
due to market development
and sale of PlanetHome
Positive trend mainly in
lending to business
customers
525 483
+8.7%
2014 2015
Results benefit from positive
market trend in interest rates
and credit spreads
Currency-related business
also grows

Higher lending and deposit volumes reaffirm growth course taken and strong market position
10
Deposits from customersLoans to customers
113,5109,6
2014 2015
+3.5%
107,7100,7
2014 2015
+7.0%
€ billions € billions

Costs again stable – despite investment in growth fields
11
Operating costs
+0.6%
2015
(3,579)(3,559)
2014
Ongoing cost-cutting and consistent cost management create
leeway for
~80% higher investments in growth and digitisation
Rise in spending on marketing, compliance and pensions
Initial positive cost effects from strategic repositioning in
retail banking
Effect in 2015: payroll costs down 8.2%, rental costs
down 20%
Full effect in the coming years
Concluded reconciliation of interests facilitates rapid
implementation of the job cuts already communicated
Reduction of 450 of the ~2,000 full-time equivalents
planned through 2018 already completed
€ millions

Good portfolio quality pays off in net write-downs of loans
12
Net write-downs of loans
-25.2%
2015
(113)
(151)
2014
Net write-downs of loans still at a very low level in
2015 against a higher volume of lending overall
High portfolio quality and conservative risk policy for
new business written is paying off
€ millions
-4BPS
2015
10BPS
14BPS
2014
Cost of risk in BPS
Cost of risk down 4BPS year-on-year and at a very low
level of 10BPS
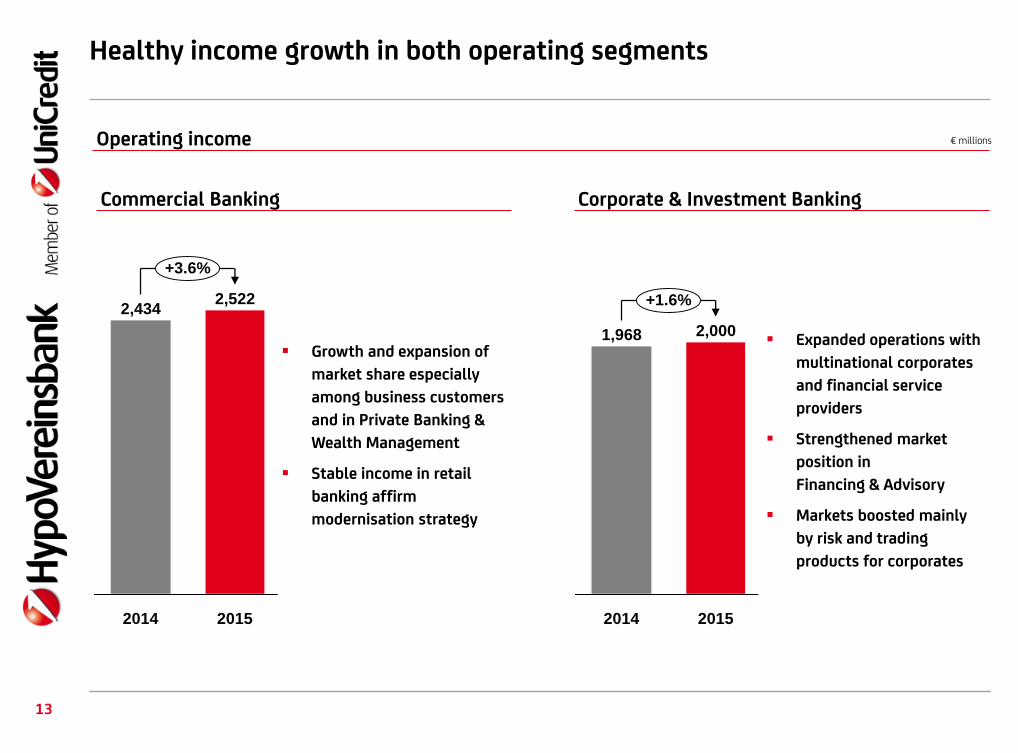
Healthy income growth in both operating segments
13
Corporate & Investment BankingCommercial Banking
2,434
+3.6%
2015
2,522
2014
Growth and expansion of
market share especially
among business customers
and in Private Banking &
Wealth Management
Stable income in retail
banking affirm
modernisation strategy
2,000
+1.6%
2014
1,968
2015
Expanded operations with
multinational corporates
and financial service
providers
Strengthened market
position in
Financing & Advisory
Markets boosted mainly
by risk and trading
products for corporates
€ millionsOperating income

Strong operating performance by HVB Group leads to higher operating profit and adjusted consolidated profit year-on-year
Technical effects in consolidated financial statements: funding value adjustments posted for the first time in the income statement and lower tax burden from recognition of moderate deferred tax assets as part of future planning (in accordance with IFRS)
Improved segment operating performance
14
Corporate & Investment BankingCommercial Banking
347
470
+35.4%
20152014
Growth in all relevant
customer segments
Effective cost
advantages
Rising profitability
Much higher customer
satisfaction
427
495
+15.9%
2014 2015
Positive trend in net
interest
Stable net trading
profit despite burden
from funding value
adjustments posted in
the Income Statement
for the first time
Results boosted by
loan-loss provisions at
a low level
€ millionsNet operating profit

2015 summary
15
Net write-downs of loans still at a low level
Costs again stable – despite investment in growth fields together with higher compliance and pension costs
Profitable growth and efficiency measures secure another good result in a difficult environment
Strong operating performance supported by growth in lending volumes and deposits
Year-on-year increase in operating profit and adjusted consolidated profit
Focus remains on boosting efficiency in back office units and growing in core business areas

16
Annex

HVB Group: Income statement
17
2015 2014
€ millions € millions € millions in %
Net interest 2,728 2,643 + 85 + 3.2
Dividends and other income from equity investments 69 92 (23) (25.0)
Net fees and commissions 1,035 1,082 (47) (4.3)
Net trading income 525 483 + 42 + 8.7
Net other expenses/income 318 302 + 16 + 5.3
Operating income 4,675 4,602 + 73 + 1.6
Operating costs (3,579) (3,559) (20) + 0.6
Operating profit 1,096 1,043 + 53 + 5.1
Net write-downs of loans (113) (151) + 38 (25.2)
Net operating profit 983 892 + 91 + 10.2
Provisions for risks and charges (194) 25 (219)
Restructuring costs (112) 18 (130)
Net income from investments 99 148 (49) (33.1)
Profit before tax 776 1,083 (307) (28.3)
Profit before tax adjusted by restructuring costs 888 1,065 (177) (16.6)
Income tax for the period (26) (298) + 272 (91.3)
Profit after tax/consolidated profit 750 785 (35) (4.5)
Consolidated profit after tax adjusted for restructuring costs 827 773 + 54 + 7.0
CHANGEIncome/Expenses

HVB Group: Quarterly income statement
18
Q4 Q3 Q2 Q1 Q4
2015 2015 2015 2015 2014
Net interest 764 644 668 652 655
Dividends and other income from equity investments 8 48 7 6 18
Net fees and commissions 230 246 257 302 262
Net trading income 33 42 270 180 137
Net other expenses/income 126 106 65 21 199
Operating income 1,161 1,086 1,267 1,161 1,271
Operating costs (869) (883) (910) (917) (858)
Operating profit 292 203 357 244 413
Net write-downs of loans (46) 43 (48) (62) (156)
Net operating profit 246 246 309 182 257
Provisions for risks and charges (91) (44) (57) (2) 20
Restructuring costs (112) 0 0 0 18
Net income from investments 36 5 41 17 60
Profit before tax 79 207 293 197 355
Profit before tax adjusted by restructuring costs 191 207 293 197 337
Income tax for the period 210 (72) (98) (66) (8)
Profit after tax/consolidated profit 289 135 195 131 347
Consolidated profit after tax adjusted for restructuring costs 366 135 195 131 335
INCOME/EXPENSES
€ millions
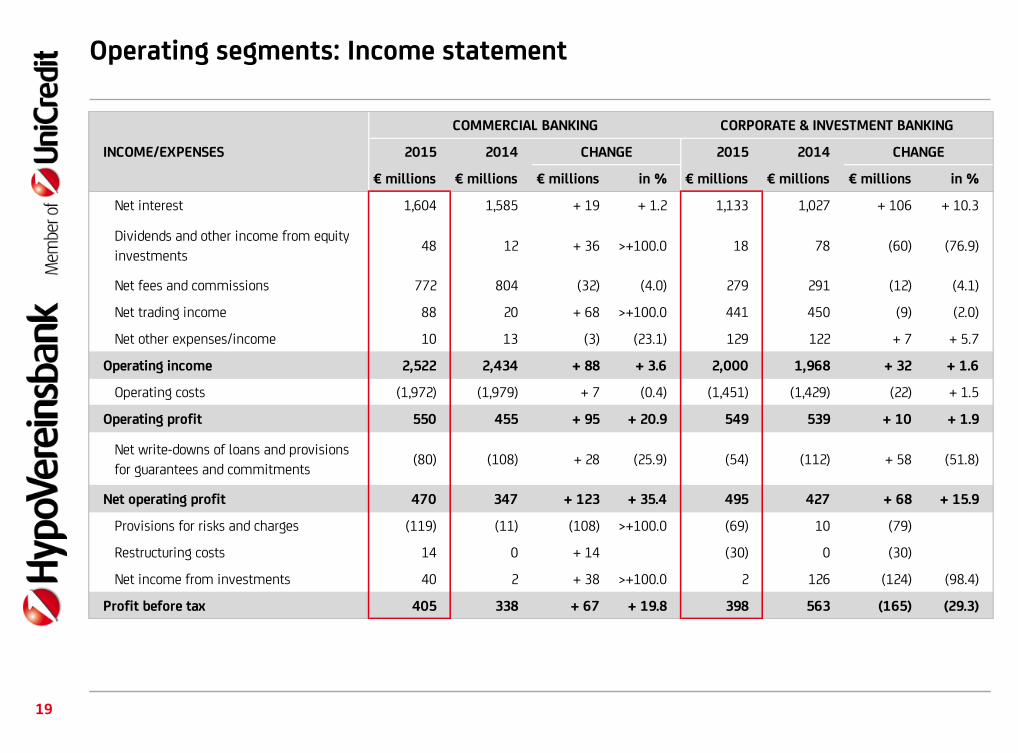
Operating segments: Income statement
19
2015 2014 2015 2014
€ millions € millions € millions in % € millions € millions € millions in %
Net interest 1,604 1,585 + 19 + 1.2 1,133 1,027 + 106 + 10.3
Dividends and other income from equity
investments48 12 + 36 >+100.0 18 78 (60) (76.9)
Net fees and commissions 772 804 (32) (4.0) 279 291 (12) (4.1)
Net trading income 88 20 + 68 >+100.0 441 450 (9) (2.0)
Net other expenses/income 10 13 (3) (23.1) 129 122 + 7 + 5.7
Operating income 2,522 2,434 + 88 + 3.6 2,000 1,968 + 32 + 1.6
Operating costs (1,972) (1,979) + 7 (0.4) (1,451) (1,429) (22) + 1.5
Operating profit 550 455 + 95 + 20.9 549 539 + 10 + 1.9
Net write-downs of loans and provisions
for guarantees and commitments(80) (108) + 28 (25.9) (54) (112) + 58 (51.8)
Net operating profit 470 347 + 123 + 35.4 495 427 + 68 + 15.9
Provisions for risks and charges (119) (11) (108) >+100.0 (69) 10 (79)
Restructuring costs 14 0 + 14 (30) 0 (30)
Net income from investments 40 2 + 38 >+100.0 2 126 (124) (98.4)
Profit before tax 405 338 + 67 + 19.8 398 563 (165) (29.3)
CHANGE CHANGE
CORPORATE & INVESTMENT BANKINGCOMMERCIAL BANKING
INCOME/EXPENSES

HVB Group: Balance sheet
20
2015 2014
€ millions € millions in %
Cash and cash balances 11,443 5,173 >+100.0
Financial assets held for trading 97,800 111,838 (12.6)
Fiancial assets at fair value through profit or
loss33,823 31,205 + 8.4
Available-for-sale financial assets 1,354 1,569 (13.7)
Investments in associates and joint ventures 56 77 (27.3)
Held-to-maturity investments 63 66 (4.5)
Loans and receivables with banks 32,832 32,654 + 0.5
Loans and receivables with customers 113,488 109,636 + 3.5
Hedging derivatives 450 753 (40.2)
Hedge adjustment of hedged items in the fair
value hedge portfolio57 66 (13.6)
Property, plant and equitment 3,230 2,949 + 9.5
Investment properties 1,163 1,293 (10.1)
Intangible assets 462 478 (3.3)
Tax assets 1,631 1,695 (3.8)
Non-current assets or disposal groups held
for sale104 32 >+100.0
Other assets 789 858 (8.0)
Total assets 298,745 300,342 (0.5)
AssetsCHANGE 2015 2014
€ millions € millions in %
Deposits from banks 58,480 54,080 + 8.1
Deposits from customers 107,690 100,674 + 7.0
Debt securities in issue 26,002 28,249 (8.0)
Financial liabilities held for trading 77,148 87,970 (12.3)
Hedging derivatives 1,049 749 + 40.1
Hedging adjustments of hedged items in the
fair value hedge portfolio2,030 2,430 (16.5)
Tax liabilities 745 749 (0.5)
Liabilities of disposal groups held for sale 31 1 >+100.0
Other liabilities 2,572 2,534 + 1.5
Provisions 2,232 2,309 (3.3)
Shareholders' equity 20,766 20,597 + 0.8
Shareholder's equity attributable to the
shareholder of UniCredit Bank AG20,762 20,566 + 1.0
Minority interest 4 31 (87.1)
Total shareholders' equity and liabilities 298,745 300,342 (0.5)
LiabilitiesCHANGE

Financial calendar and contacts
21
Contacts for the pressFinancial calendar
18 March 2016Publication of the Annual Report at 31 December 2015
11 May 2016Interim Report at 31 March 2016
4 August 2016Half-yearly Financial Report at 30 June 2016
11 November 2016Interim Report at 30 September 2016
Marion NaglPhone +49 89 378-25554 [email protected]
Nicholas WenzelPhone +49 89 378-44959 [email protected]

This presentation contains forward-looking statements. Forward-looking statements are statements that are not historical facts. They include statements about our beliefs and expectations, and the underlying assumptions of UniCredit Bank AG. These statements are based on plans, estimates and projections as currently available to the management of UniCredit Bank AG. Consequently, forward-looking statements are only applicable on the day on which they are made. We undertake no obligation to update such statements in light of new information or future events. By their very nature, forward-looking statements involve risks and uncertainties. A number of important factors could cause actual results to differ materially from forward-looking statements. Such factors include conditions in the financial markets in Germany, Europe and the United States, the development of asset prices, potential defaults of borrowers or trading counterparties, and other changes–notably including significant political changes–that may materially alter the parameters underlying our business activities. This presentation does not constitute any kind of recommendation or investment advice.
Disclaimer
22