hurricane cristina · cristina was a category 4 hurricane on the saff-simpson hurricane ir wind...
TRANSCRIPT

NATIONAL HURRICANE CENTER TROPICAL CYCLONE REPORT
HURRICANE CRISTINA (EP032014) 9 – 15 June 2014
Eric Blake National Hurricane Center
21 August 2014
CRISTINA NEAR PEAK INTENSITY FROM VIIRS (12 JUN 0827 UTC) – NOAA
Cristina was a category 4 hurricane on the Saffir-Simpson Hurricane Wind Scale that
brought hurricane-force wind gusts to Socorro Island. It was the earliest second major hurricane of a season on record for the eastern North Pacific basin.

Hurricane Cristina 2
Hurricane Cristina 9 – 15 JUNE 2014
SYNOPTIC HISTORY Cristina formed from the combination of an intertropical convergence zone (ITCZ) disturbance, a tropical wave, and a convectively coupled Kelvin wave (CCKW). The low-latitude tropical wave left the coast of western Africa on 26 May, travelled quickly westward and moved into the eastern Pacific on 5 June. Meanwhile, a broad area of low pressure was noted within the ITCZ several hundred miles south of Acapulco, Mexico on 3 June, perhaps initiated by an earlier weak tropical wave. The low drifted northwestward over the next few days, with the tropical wave from the east catching up with the low on 7 June, causing a temporary increase in convection. On 8 June, thunderstorm activity increased again, likely due to the CCKW passing through the area early that day, which resulted in the formation of a well-defined low pressure area early on 9 June. After a decrease in overnight convection, organized convective bands formed near and east of the center by 1200 UTC 9 June, marking the formation of a tropical depression about 135 n mi southwest of Acapulco. The “best track” chart of Cristina’s path is given in Fig. 1, with the wind and pressure histories shown in Figs. 2 and 3, respectively. The best track positions and intensities are listed in Table 11.
Initially, the low- and mid-level circulations of the depression were not vertically aligned, perhaps due to northerly shear. The depression intensified only slowly with this structure, becoming a tropical storm 18 h after genesis, and the cyclone turned westward. However by midday on 10 June, a decrease in shear was noted in SHIPS-model analyses, and microwave images showed that the circulation of Cristina had become more vertically aligned. Scatterometer data also indicated that the radius of maximum winds had decreased, and by late on 10 June Cristina started to rapidly intensify with a faint eye noted in visible satellite images. The storm became a hurricane early on 11 June, and turned west-northwestward around a ridge centered over Mexico. Cristina strengthened into a major hurricane early the next day, with an increase in wind speed of about 45 kt from 0000-1200 UTC 12 June. The cyclone reached a peak intensity of 130 kt around 1200 UTC 12 June about 210 n mi southwest of Manzanillo, Mexico, with a well-defined eye and symmetric presentation (cover image). The hurricane did not stay very intense for long, however, due to an eyewall replacement cycle that began later that day. In addition, Cristina was moving into a more stable and drier environment, which also contributed to the weakening process.
Almost as fast as it had intensified, Cristina rapidly weakened during the next three days. The weakening rate levelled off somewhat on 13 June when the eyewall cycle was completed, but by that point the cyclone was moving over cooler waters and was deeper into the more
1 A digital record of the complete best track, including wind radii, can be found on line at ftp://ftp.nhc.noaa.gov/atcf. Data for the current year’s storms are located in the btk directory, while previous years’ data are located in the archive directory.

Hurricane Cristina 3
stable eastern Pacific environment, and the weakening continued. The hurricane moved to the northwest for about a day, with the center of the cyclone passing about 20 n mi north of Socorro Island. Cristina weakened into a tropical storm on 14 June, and turned toward the west-northwest later that day. The storm lost all of its deep convection early on 15 June, and Cristina became a non-convective low around 0600 UTC when it was located about 230 n mi southwest of Cabo San Lucas, Mexico. The remnant low generally moved to the west-northwest or northwest for the next couple of days and gradually weakened. Late on 17 June, the weak circulation turned eastward then southeastward within the low-level flow and dissipated just after 0000 UTC 19 June about 275 n mi west of Cabo San Lucas.
METEOROLOGICAL STATISTICS Observations in Cristina (Figs. 2 and 3) include subjective satellite-based Dvorak technique intensity estimates from the Tropical Analysis and Forecast Branch (TAFB) and the Satellite Analysis Branch (SAB), and objective Advanced Dvorak Technique (ADT) estimates from the Cooperative Institute for Meteorological Satellite Studies/University of Wisconsin-Madison. Data and imagery from NOAA polar-orbiting satellites including the Advanced Microwave Sounding Unit (AMSU), the NASA Tropical Rainfall Measuring Mission (TRMM), the European Space Agency’s Advanced Scatterometer (ASCAT), and Defense Meteorological Satellite Program (DMSP) satellites, among others, were also useful in constructing the best track of Cristina.
The estimated peak intensity of 130 kt is based on a blend of subjective Dvorak satellite intensity estimates of 115 kt and an objective ADT estimate of 139 kt.
A Mexican Navy surface station on Socorro Island (site elevation 35 m), reported a 10-min sustained wind of 295°/60 kt at 0330 UTC 14 June, with a peak gust of 76 kt measured 45 minutes prior.
There were no ship reports of winds of tropical storm force associated with Cristina.
Cristina was the earliest second major hurricane of a season recorded in the basin, reaching that intensity early on 12 June. The previous record was Darby of 2010, which became a major hurricane on 25 June.
CASUALTY AND DAMAGE STATISTICS There were no reports of damage or casualties associated with Cristina.

Hurricane Cristina 4
FORECAST AND WARNING CRITIQUE
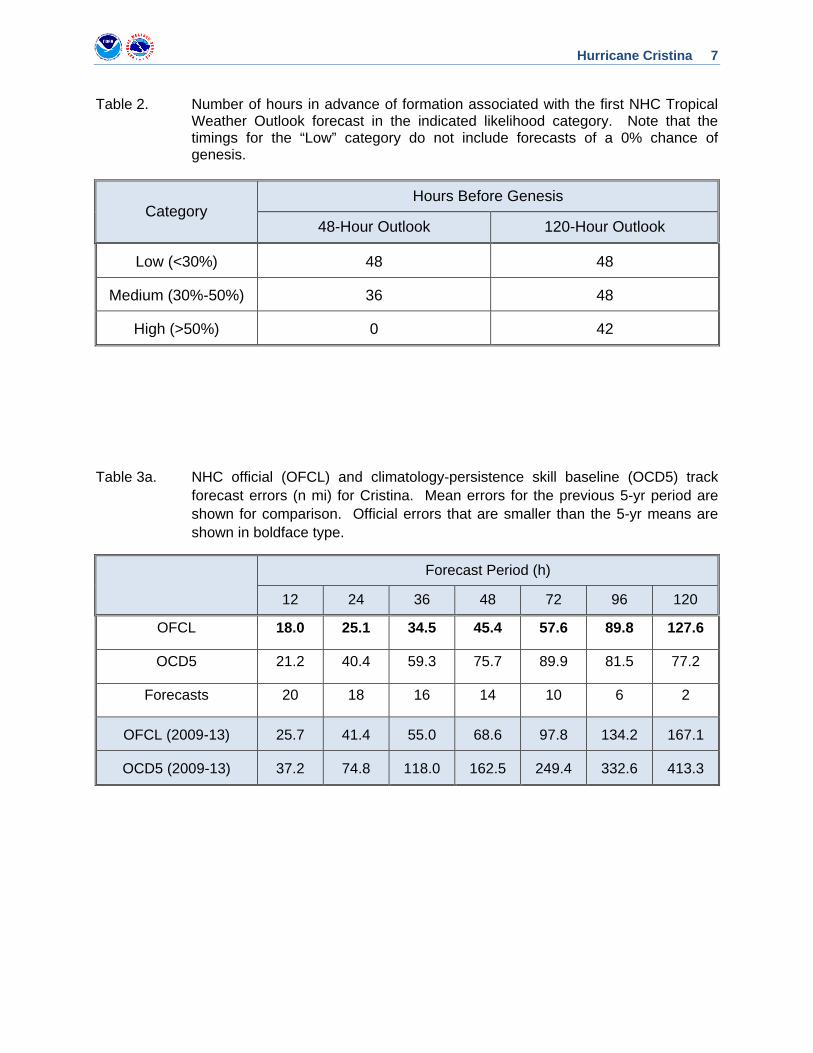
Table 2 indicates how far in advance of formation the NHC official genesis forecasts first reached the indicated likelihood categories. The genesis of Cristina was poorly forecast, especially in the long range, with no lead time beyond 48 h. Although the system spent 36 h in the medium (30-50%) chance of genesis category, the system was not considered to have a high chance of genesis until the time of formation in the final best-track.
A verification of NHC official track forecasts is given in Table 3a. Official forecast track errors were extraordinarily lower than the mean official errors for the previous 5-yr period, although the CLIPER errors were also smaller than average. A homogeneous comparison of the official track errors with selected guidance models is given in Table 3b. The TVCE consensus model provided the best overall forecasts for Cristina, with extremely low errors, and the best single deterministic model was the HWRF. Otherwise, the official forecast (OFCL) was generally superior to the rest of the guidance. The ECMWF model (EMXI) did not perform well for this storm.
A verification of NHC official intensity forecasts is given in Table 4a. Official forecast intensity errors were much higher than the mean official errors for the previous 5-yr period at most time intervals, which matched the higher-than-average CLIPER errors. This is not a surprising result given the longstanding issues with rapid intensification and rapid weakening. A homogeneous comparison of the official intensity errors with selected guidance models is given in Table 4b. Although all of the guidance had large errors, the Florida State Superensemble (FSSE) had the best performance for this storm. Interestingly, the FSSE had significantly lower errors than the intensity consensus IVCN, which suggest the corrections used by the FSSE model were somewhat effective for this cyclone. Most of the guidance demonstrated a notable low bias at first, and a high bias after Cristina started to weaken (Figs 4, 5). The global models GFSI and EMXI did not provide much useful guidance, with extremely high errors noted.

Hurricane Cristina 5
Table 1. Best track for Hurricane Cristina, 9-15 June 2014.
Date/Time (UTC) Latitude (°N) Longitude
(°W) Pressure
(mb) Wind Speed
(kt) Stage
09 / 0000 14.8 101.3 1007 25 low
09 / 0600 15.0 101.4 1007 25 "
09 / 1200 15.2 101.5 1006 30 tropical depression
09 / 1800 15.4 101.6 1006 30 "
10 / 0000 15.6 101.8 1006 30 "
10 / 0600 15.5 102.2 1005 35 tropical storm
10 / 1200 15.4 102.6 1003 40 "
10 / 1800 15.3 103.0 1001 45 "
11 / 0000 15.3 103.4 996 55 "
11 / 0600 15.3 103.9 990 65 hurricane
11 / 1200 15.4 104.4 987 70 "
11 / 1800 15.6 104.9 983 75 "
12 / 0000 15.8 105.4 975 85 "
12 / 0600 16.1 106.1 959 105 "
12 / 1200 16.4 106.8 935 130 "
12 / 1800 16.7 107.5 940 125 "
13 / 0000 17.0 108.1 955 110 "
13 / 0600 17.4 108.8 967 95 "
13 / 1200 17.8 109.5 973 85 "
13 / 1800 18.3 110.1 978 80 "
14 / 0000 18.7 110.5 979 80 "
14 / 0600 19.0 110.8 984 70 "
14 / 1200 19.3 111.2 990 60 tropical storm
14 / 1800 19.5 111.6 997 50 "
15 / 0000 19.7 112.0 1002 40 "
15 / 0600 19.9 112.5 1003 35 low
15 / 1200 20.1 113.0 1004 30 "
15 / 1800 20.4 113.5 1005 30 "
16 / 0000 20.7 114.1 1005 30 "
16 / 0600 21.1 114.8 1005 30 "

Hurricane Cristina 6
Date/Time (UTC) Latitude (°N) Longitude
(°W) Pressure
(mb) Wind Speed
(kt) Stage
16 / 1200 21.6 115.6 1005 25 "
16 / 1800 22.1 116.4 1005 25 "
17 / 0000 22.5 116.9 1006 20 "
17 / 0600 22.7 117.2 1006 20 "
17 / 1200 22.8 117.6 1007 15 "
17 / 1800 23.0 117.8 1007 15 "
18 / 0000 23.1 117.5 1008 15 "
18 / 0600 23.0 117.2 1009 15 "
18 / 1200 22.8 117.0 1010 15 "
18 / 1800 22.5 116.8 1010 15 "
19 / 0000 22.2 116.6 1010 15 "
19 / 0600 dissipated
12 / 1200 16.4 106.8 935 130 min pressure & max winds
Hurricane Cristina 7
Table 2. Number of hours in advance of formation associated with the first NHC Tropical Weather Outlook forecast in the indicated likelihood category. Note that the timings for the “Low” category do not include forecasts of a 0% chance of genesis.
Category Hours Before Genesis
48-Hour Outlook 120-Hour Outlook
Low (<30%) 48 48
Medium (30%-50%) 36 48
High (>50%) 0 42
Table 3a. NHC official (OFCL) and climatology-persistence skill baseline (OCD5) track forecast errors (n mi) for Cristina. Mean errors for the previous 5-yr period are shown for comparison. Official errors that are smaller than the 5-yr means are shown in boldface type.
Forecast Period (h)
12 24 36 48 72 96 120
OFCL 18.0 25.1 34.5 45.4 57.6 89.8 127.6
OCD5 21.2 40.4 59.3 75.7 89.9 81.5 77.2
Forecasts 20 18 16 14 10 6 2
OFCL (2009-13) 25.7 41.4 55.0 68.6 97.8 134.2 167.1
OCD5 (2009-13) 37.2 74.8 118.0 162.5 249.4 332.6 413.3

Hurricane Cristina 8
Table 3b. Homogeneous comparison of selected track forecast guidance models (in n mi) for Cristina. Errors smaller than the NHC official forecast are shown in boldface type.
Model ID Forecast Period (h)
12 24 36 48 72 96 120 OFCL 17.1 23.7 31.9 41.2 53.7 83.4 94.7
OCD5 20.9 38.6 56.5 72.6 86.2 76.9 96.7
GFSI 21.1 29.3 36.1 43.8 59.3 78.0 30.7
AEMI 19.7 31.8 41.2 50.4 66.0 98.2 61.8
GHMI 19.5 31.3 46.9 61.1 104.6 117.6 226.9
HWFI 18.9 26.5 31.8 36.0 40.6 58.1 36.4
EMXI 21.4 39.6 59.4 74.3 103.4 166.8 266.1
CMCI 29.4 58.0 81.6 97.8 129.3 231.6 240.4
NVGI 27.7 52.5 77.1 95.8 144.6 201.3 178.2
GFNI 22.4 38.5 53.4 56.3 114.9 202.6 329.5
FSSE 16.3 24.7 36.6 48.5 62.7 122.3 164.8
TVCE 13.9 22.5 31.4 38.4 42.2 40.3 24.7
LBAR 20.8 45.1 75.8 110.3 181.3 234.6 310.4
BAMD 26.0 40.9 56.3 64.9 96.2 130.6 142.7
BAMM 32.3 55.2 76.8 103.9 171.1 234.5 306.4
BAMS 35.5 63.2 94.7 124.9 209.1 281.6 386.5
Forecasts 19 17 15 13 9 5 1

Hurricane Cristina 9
Table 4a. NHC official (OFCL) and climatology-persistence skill baseline (OCD5) intensity forecast errors (kt) for Cristina. Mean errors for the previous 5-yr period are shown for comparison. Official errors that are smaller than the 5-yr means are shown in boldface type.
Forecast Period (h)
12 24 36 48 72 96 120
OFCL 10.8 17.2 20.0 23.6 19.0 15.0 7.5
OCD5 14.7 22.9 27.4 34.9 32.6 22.3 5.5
Forecasts 20 18 16 14 10 6 2
OFCL (2009-13) 6.1 10.4 13.4 14.5 15.0 16.4 16.1
OCD5 (2009-13) 7.7 12.7 16.4 18.8 20.5 20.3 20.8

Hurricane Cristina 10
Table 4b. Homogeneous comparison of selected intensity forecast guidance models (in kt) for Cristina. Errors smaller than the NHC official forecast are shown in boldface type.
Model ID Forecast Period (h)
12 24 36 48 72 96 120
OFCL 11.1 17.9 21.0 25.0 15.0 14.0 5.0
OCD5 15.4 23.9 27.7 35.1 27.0 18.8 3.0
DSHP 13.3 20.3 23.5 26.1 15.6 11.6 18.0
LGEM 13.3 19.7 23.0 26.8 18.6 12.2 9.0
HWFI 11.1 17.1 20.9 27.3 18.0 15.2 23.0
GHMI 13.2 19.8 20.6 20.4 13.6 6.0 32.0
IVCN 12.2 18.5 21.5 24.7 15.9 7.4 21.0
FSSE 11.2 14.9 13.7 16.5 11.8 10.4 8.0
GFSI 14.1 24.2 31.7 37.5 20.4 10.6 6.0
EMXI 18.5 30.2 36.9 42.6 28.4 16.6 2.0
Forecasts 19 17 15 13 9 5 1

Hurricane Cristina 11
Figure 1. Best track positions for Hurricane Cristina, 9-15 June 2014.

Hurricane Cristina 12
Figure 2. Selected wind observations and best track maximum sustained surface wind speed curve for Cristina. Advanced Dvorak Technique estimates represent the current intensity at the nominal observation time. AMSU intensity estimates are from the Cooperative Institute for Meteorological Satellite Studies technique. Dashed vertical lines correspond to 0000 UTC.
20
30
40
50
60
70
80
90
100
110
120
130
140
6/7 6/9 6/11 6/13 6/15 6/17 6/19
BEST TRACKSat (TAFB)Sat (SAB)ADTScatterometerSurfaceAMSU
Win
d Sp
eed
(kt)
Date (Month/Day)
Hurricane Cristina9 - 15 June 2014

Hurricane Cristina 13
Figure 3. Selected pressure observations and best track minimum central pressure curve for Cristina. Advanced Dvorak Technique estimates represent the Current Intensity at the nominal observation time. AMSU intensity estimates are from the Cooperative Institute for Meteorological Satellite Studies technique. KZC P-W refers to pressure estimates derived using the Knaff-Zehr-Courtney pressure-wind relationship. Dashed vertical lines correspond to 0000 UTC.
920
930
940
950
960
970
980
990
1000
1010
6/8 6/10 6/12 6/14 6/16 6/18
BEST TRACKKZC P-WSat (TAFB)Sat (SAB)ADTAMSU
Pres
sure
(mb)
Date (Month/Day)
Hurricane Cristina9 - 15 June 2014

Hurricane Cristina 14
Figure 4. Plot of selected intensity model guidance for Cristina valid 1200 UTC 11 June 2014, about 24 h before the time of maximum intensity. All of the guidance models had a substantial low bias for about 36h, and were too high beyond 72h.

Hurricane Cristina 15
Figure 5. Plot of selected intensity model guidance for Cristina valid 1200 UTC 12 June 2014, near the time of maximum intensity. All of the guidance models had a substantial high bias after this point.