hunger, hardship and health: impact on the youngest americans
TRANSCRIPT

Dr. Deborah A. FrankProfessor of Pediatrics, Boston University School of MedicineFounder and Principal Investigator, Children’s HealthWatch
Founder and Director, Grow Clinic for Children, Boston Medical Center
Hunger, Hardship and Health: Impact on the Youngest
Americans The Children’s HealthWatch Experience

Children’s HealthWatch
Collect datain five urban, safety-net hospitals
Produce scientific research
that is original and timely
Share evidencewith state and national partners to inform policy choices

3
CHANGES IN FAMILY SURVIVAL
RESOURCES RAPIDLY
REFLECTED IN HEALTH,
LEARNING, AND GROWTH OF
YOUNG CHILDREN

Why Watch Children Birth to 3?

Official Poverty Rates by Age
Group
22%
18%
14%
0%
5%
10%
15%
20%
25%
Children Under Age 6 Children Age 6 or Older Adult s 18-64
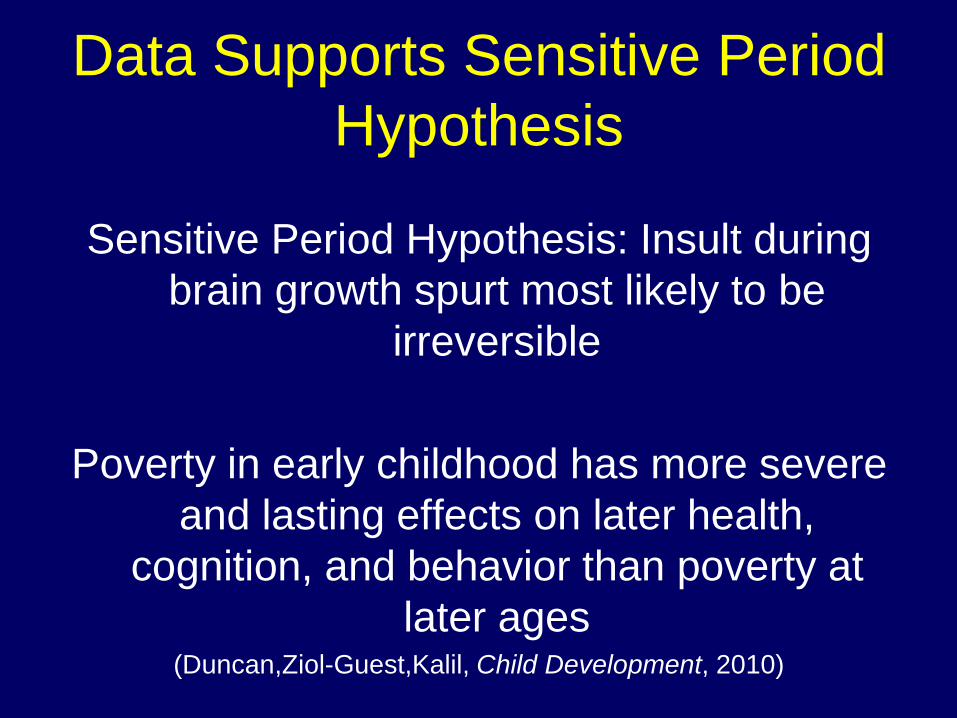
Data Supports Sensitive Period
Hypothesis
Sensitive Period Hypothesis: Insult during
brain growth spurt most likely to be
irreversible
Poverty in early childhood has more severe
and lasting effects on later health,
cognition, and behavior than poverty at
later ages (Duncan,Ziol-Guest,Kalil, Child Development, 2010)

Young Children Often Invisible
Except to Families and Health
Providers

Food Insecurity
Limited or uncertain availability of
nutritionally adequate and safe foods
or limited or uncertain ability to
acquire acceptable foods in socially
acceptable ways because of lack of
money
Source: USDA/ERS; Food Security Measurement
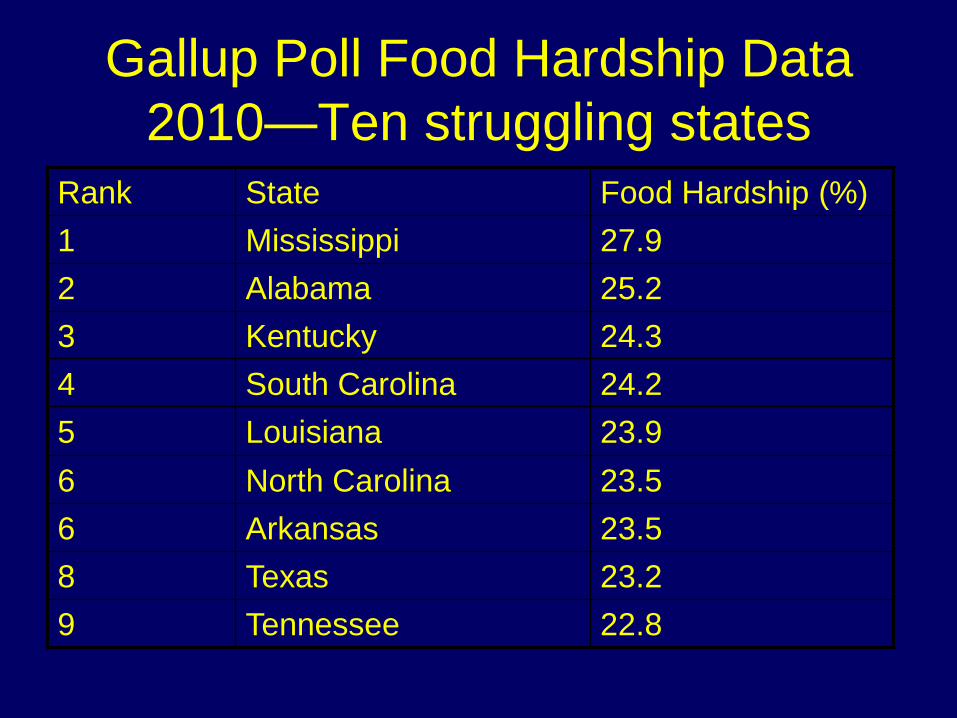
Gallup Poll Food Hardship Data
2010—Ten struggling states
Rank State Food Hardship (%)
1 Mississippi 27.9
2 Alabama 25.2
3 Kentucky 24.3
4 South Carolina 24.2
5 Louisiana 23.9
6 North Carolina 23.5
6 Arkansas 23.5
8 Texas 23.2
9 Tennessee 22.8

FOOD INSECURITY IS AN
INFANT SURVIVAL ISSUE


FOOD INSECURITY IS A
CHILD HEALTH ISSUE

Infection
Malnutrition
Cycle

Babies and Toddlers in Food Insecure Households:
- 30% more likely to have had past hospitalization,
- 90% more likely to have fair or poor health,
compared to food secure babies and toddlers.
An odds ratio of
1.00 indicates
an even chance
of the problem
occurring.

FOOD INSECURITY IS A
SCHOOL READINESS AND
A SCHOOL ACHIEVEMENT
ISSUE

Young children
from food
insecure
households are
40% more likely
to be at
developmental
risk

Developmental Functions Are at
Risk Following Early Undernutrition
Language
Short Term Memory
Audio Visual Equivalence
Attention
Modulation of Activity and Affect
Locomotor Skills

FOOD INSECURITY IS A SCHOOL
READINESS AND SCHOOL
ACHIEVEMENT ISSUE


FOOD INSECURE KIDS FIGHT
MORE


The cheap foods that make
adults fat starve children of
absolutely essential nutrients.
Children who do not receive
protein and other nutrients
during early development are
damaged for the rest of their
lives.
Dr. Margaret Chan WHO

The Problem to Address:
Food Insecurity: Highest Since
1995Overall, households with
children (<18) had nearly twice
the rate of food insecurity (21.3
percent) as those without
children (11.3 percent).
Families with the youngest children are most at risk for food insecurity.25.4 percent of households with children under six are food insecure in the U.S. That translates to 9, 647. 000 American kindergarteners, preschoolers, toddlers, and infants.
(USDA data,2009)

Gap between Thrifty Food Plan Price & Maximum SNAP (Food Stamp) Benefit with
American Recovery & Reinvestment Act Increase
877.45848.5819.68
0
100
200
300
400
500
600
700
800
900
1000
Boston Philadelphia Average of Boston and Philadelphia
24% increase in
maximum benefit
needed
$685 (maximum monthly
benefit based on
ARRA)
*Adjusted for 2009
Prices* *
*
Children’s HealthWatch

What is the connection between
food insecurity and obesity?


Puzzle of Poverty and Obesity
• Cyclical food deprivation/overeating
• Need to minimize per calorie cost
• Lack of access to fruits and vegetables in
low income neighborhoods : “Food
Deserts”
• Lack of opportunity for safe exercise in low
income neighborhoods
• ? Stress hormones

Brownell K and Frieden T. N Engl J Med 2009;360:1805-1808
Relative Price Changes for Fresh Fruits and Vegetables, Sugars and Sweets, and Carbonated
Drinks, 1978-2009

Real Cost of a Healthy Diet
Can parents afford to purchase healthy food?
$1.33 $2.79880 calories880 calories
Tight budgets limit food choices;
cheap calories provide little nutritional value. Drewnowski 2004
Stop and
Shop Price
Check Sept
2010

The cheap foods that make
adults fat starve children of
absolutely essential nutrients.
Children who do not receive
protein and other nutrients
during early development are
damaged for the rest of their
lives.
Dr. Margaret Chan WHO

Economic
Hardship
Food Insecurity
Housing Insecurity
Energy Insecurity

Public Policies and Economic
Conditions are Written on the
Bodies of Babies


Can We Fix It?

Fixing Hunger and Hardship
Long-Term is a
Political Issue

Which Programs Promote Healthy
Height and Weight?
• WIC
• CHILDCARE
FEEDING
• LIHEAP
• HOUSING SUBSIDY

Which Programs Decrease Poor
Health/Hospitalizations?
• WIC
• SNAP
• LIHEAP
• CHILDCARE
FEEDING

Which Programs Decrease
Developmental Risk?
• WIC
• SNAP (in school age)


Cut SNAP
funding by
$127 billion
(almost 20%)
in the next
ten years
Convert
SNAP to a
block grant
• Cuts in eligibility: Up to 8 million low-income
people could lose benefits and/or
• Cuts in benefits: benefits could be reduced to
as low as 88% of the Thrifty Food Plan
• Family of four would have their monthly
benefit cut by $147 each month
• Increase in Hunger and Poverty with Worse
Health and Slower Development in children.
Proposed Change Likely Impact
• Make SNAP less likely to respond to increased
need during an economic downturn
• Likely allow states to shift funds away from
SNAP to be used for other purposes
• Eliminate ability to increase service to working
poor families—one of the most significant issues
today
Impact of Proposed Changes to SNAP in 2012
Source: Center on Budget and
Policy Priorities, 2011

Business will Suffer too
• Every $5 in SNAP benefits generates
$9.00 in total community spending
• Every additional dollar’s worth of SNAP
benefits generates 17 to 47 cents of new
spending on food
• On average, $1 billion of retail food
demand by SNAP recipients generates
close to 3,000 farm jobs
Source: Hanson, Kenneth. (2010). The Food Assistance National Input-Output Multiplier (FANIOM) Model and Stimulus Effects of SNAP. Washington,
DC: U.S. Department of Agriculture, Economic Research Service. Available at http://www.ers.usda.gov/Publications/ERR103/ERR103.pdf . Note:
Economic effect of increasing food stamps measured for the whole U.S. economy. It may vary by location.


“There is no finer investment for
any community than putting milk
into babies.”
- Winston Churchill

Thank You!
www.childrenshealthwatch.org
88 E. Newton Street | Vose Hall 4th Floor | Boston, MA 02118 | tel: 617.414.6366 |