hunger, agricultural production, and government...
TRANSCRIPT

Hunger, Agricultural Production, and
Government Policies
Edited by
Dr. Alok Kumar and Abdullah Al Mahmood Mosfeq
Department of Economics,
University of Victoria
i
Table of Contents
Table of Contents.............................................................................................................................ii
List of Contributors........................................................................................................................iii
Preface............................................................................................................................................iv
1 Food Crisis: How High Food Prices Continue to Impact the Poorest.................................1
Justin Valente, Bryan Andrews, Jerid Leigh, and Phil Currie
2 The Current State of Food Security in sub-Saharan Africa, Southeast Asia and Latin
America & the Caribbean................................................................................................ 21
Jennifer Giesbrecht, Peter Moorman and Carys Pinches
3 Economic Development as a Means to Poverty Reduction in Uganda: Binding Constraints
and Agriculture as a Key Sector for Growth..............................55
Conor Murphy, Jason Sparrow, and Michael Tomalty
4 Post War Redevelopment of Sierra Leone.........................................................................70
Brianne Knox, Nathan Stewart, and Jake Ilnicki
5 BRICS: A Significant Economic Force in Today‟s World Economy...............................93
Mitchel Blais, Genna Purcell, and Michael Caldwell
6 Child Labour and Gender Bias in Developing Countries: The Missing Link.................110
Emma Underhill
ii
List of Contributors
Andrews, Bryan: Undeclared
Blais, Mitchel: Geography: GEAM
Caldwell, Michael: Pre-Business
Currie, Phil: Pre-Business
Giesbrecht, Jennifer: Geography: GEAM
Ilnicki, Jake: Undeclared
Knox, Brianne: Geography
Leigh, Jerid: Economics
Moorman, Peter: Pre-Business
Murphy, Conor: Economics
Pinches, Carys: Anthropology
Purcell, Genna: Business
Sparrow, Jason: Undeclared
Stewart, Nathan: Pre-Physical Education
Tomalty, Michael: Undeclared
Underhill, Emma: Economics
Valente, Justin: Economics: ECAM
iii
Preface
In the past few years, food price have increased rapidly, greatly undermining progress made in
the food security situation all over the world. The FAO (2006) defines food security as a state
when “all people, at all times, have physical and economic access to sufficient, safe and
nutritious food that meets their dietary needs and food preferences for an active and healthy life”.
Food security depends on many things such as availability and affordability of food items,
distributional network, and food habits. Food prices play an extremely important role in
determining the affordability of food items.
There are many reasons for price increases including drought, an inefficient food distribution
system, civil wars, and a rapidly increasing population, but two important factors with long-run
implications are the changing consumption pattern due to rising per-capita income and the
diversion of food-grains and agricultural land to produce bio-fuels. In recent years, many
developing countries such as China and India have witnessed a rapid increase in the demand for
meat, poultry and dairy products, with demand for these products forecast to increase more
rapidly in the future. Increasing production of meat, poultry and dairy products has resulted in
large-scale diversion of food crops to feed. Similarly, there is increasing trend to divert
agricultural land away from food-grains to produce bio-fuels and other commercial crops.
The increasing food prices have adversely affected poor in general, particularly poor and
marginalized people in African countries. This book is an attempt to analyze the main causes of
increasing food-prices, its consequences, how different countries are coping with this
phenomenon, and draws policy implications. It examines the experiences of many countries and
clearly distinguishes between the global factors and the local factors. Various studies point out
that the effects of increasing food prices on poverty, malnutrition, and human capital investment
depend on the interaction of these two sets of factors. Policy makers and development agencies
need to take into account both set of factors in designing policies.
This book is based on group projects undertaken by students of Development and Economics as
a part of their course-work at the University of Victoria, Canada. Broadly, these studies can be
divided into sets. The first set of studies analyzes the effects of increasing food prices on poverty,
malnutrition, and human capital investment in different countries. The second set of studies
iv
analyzes the development experience of BRICS countries. The rapid growth of these countries
has greatly benefited the world and the inhabitants of these countries in particular. However, one
adverse consequence of this phenomenon is the rising food prices.
The first chapter examines the effect of increasing food prices in both developing and developed
countries. It correctly points out that this phenomenon affects families in both developing and
developed countries. Even in the developed countries, a significant proportion of families spend
more than half of their income on food. Increasing food prices coupled with stagnant or even
declining income due to recent financial crisis, have adversely affected the poor households.
These households have been forced to reduce their expenditure on other essential items and
increasingly buy cheap but nutritionally poor food items. The reduction in the government
support and social programs due to declining tax revenue has aggravated the problem.
The second chapter studies the issue of food security in four regions of the world: Sub-Saharan
Africa, Southeast Asia, and Latin America & the Caribbean. While all countries in these regions
are categorized as developing countries, there are big differences across these regions in terms of
food security and their capacity to cope with rising food prices. Sub-Saharan Africa in particular
is especially vulnerable to increasing food prices. Poor access to food results in malnutrition and
a subsequent reduction in human capital, one of the barriers to structural change. The nature of
food security in a given region, therefore, is indicative of its overall health, social and economic
development.
The third chapter examines the performance of the Ugandan economy, which is one of the
poorest countries in the world. The persistent poverty in Uganda has induced a number of
international organizations such as the IMF and the World Bank to introduce and implement a
number of important poverty reduction strategies (PRSPs) in cooperation with the Ugandan
government. These organizations have identified underinvestment in agricultural sector, poor
infrastructure, inefficient financial services, and poor public sector management as some of the
major factors constraining economic development in Uganda. The main focus of this chapter is
to examine the effects of PRSPs. It finds that these strategies have helped jump-start the
development in the economy, but it has a long way to go.
v
Chapter four studies the effects of civil war which ravaged Sierra Leone from 1991 to 2002 and
left the country‟s infrastructure and economy decimated. It finds that while some post war
redevelopment efforts have been successful, there is still a great deal of work to be done. It
argues that it is important to consider the development process in the historical context while
taking into account the demographic composition of the nation. Sierra Leone‟s internal economy
relies upon informal business practices while its position in the global economy is reliant on
natural resources, most famously, diamond deposits but also titanium ore, bauxite, iron ore and
chromites. The situation is beginning to improve as demonstrated by social programs
administered by both Sierra Leone‟s government and foreign NGOs and charitable organizations.
Chapter five examines the trend and consequences of the rapid development witnessed in five
countries: Brazil, Russia, India, China, and South Africa together known as the BRICS countries.
This paper studies how individual characteristics of these countries have led them to become a
significant economic force in the world economy. It finds that each country is unique with its
own development trajectories, opportunities, and challenges. For example, Brazil, Russia and
South Africa are abundant in natural resources and their development is largely based on
exploiting these natural resources. On the other hand, India and China are endowed with a large
labor force. Their development is largely based on using their abundant labor force. These
countries differ greatly in terms of the role of the government in the development process. In
China and Russia the government plays leading role, while in other countries the private sector is
much more salient.
Chapter six examines the effect of child labor on human capital investment. Child labor is a
manifestation of poverty and poor families use it to augment their income and cope with adverse
circumstances such as rising food prices. It links the two strands of theoretical literature, namely,
the models of child labour and the models of gender bias. In particular, it analyses the
implications for the relative work loads of children of different gender in the presence of parental
gender bias. There is an extensive empirical literature which suggests that parental gender bias,
particularly in favour of male children, is wide-spread in many regions of the world. This
chapter analyzes the effects of parental gender bias on savings, bequests, and child labor. In
addition, it examines the implications for child labor due to other forms of gender bias, such as
differential quality of schools and labor market discrimination.

vi
The Editors

1
1 Food Crisis: How High Food Prices Continue to Impact the
Poorest
Justin Valente, Bryan Andrews, Jerid Leigh, and Phil Currie
Introduction
The food price crisis is having an increasingly adverse effect on nations around the world,
especially to those in a developing state. The UN Food and Agriculture Organization (FAO)
have released many publications to raise awareness and to help discover the roots of the
causation of the global hunger and malnutrition issues, especially for the many starving children.
According to the State of Food Insecurity in the World (2011) report released by FAO, high and
volatile food prices are predicted to continue. The report claims that because the world‟s
population is grwoing, there are increases in demand from consumers in rapidly growing
economies and natural resources are becoming increasingly scarce in regions where supply is
needed. The volatility of food prices is predicted to increase due to the greater rate of natural
disasters and weather shocks, so the impact on crop production will only worsen. Between 2006
and 2008 the average world price for rice rose by 217%, wheat by 136%, corn by 125% and
soybeans by 107% (Haugh, G., Hammond, K., Vakenier, K., & Hong, R, N.D). The UN Food
and Agriculture Organization have also stated the rise in production of biofuels to be a
contributing factor to the volatility of food prices. The most troubling truth of the food price
crisis is that it affects the poorest nations the most. High food prices are a problem for
developing nations because many have to import a lot of the food that feeds their population.
As food prices increase and incomes are stagnant, families have to adjust accordingly to
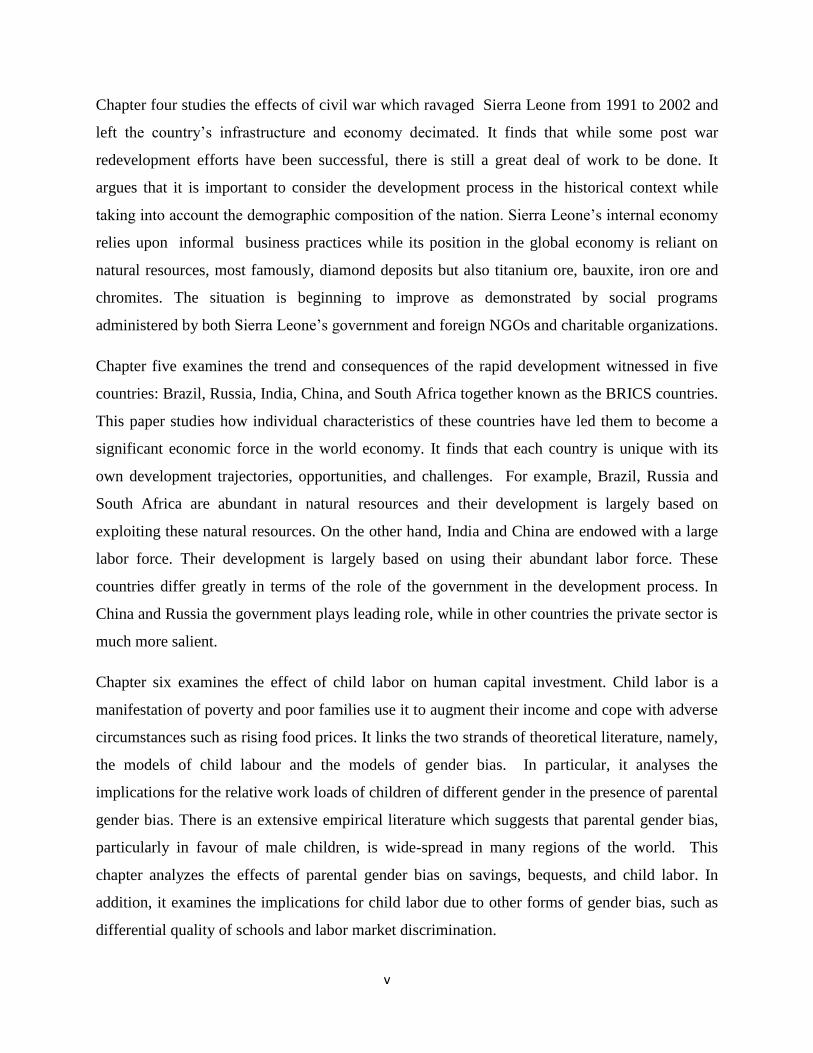
be able to afford to feed their households. The World Food Programme (2012) has stated that in
countries where they provide support some households have to spend up to sixty to eighty
percent of their total income on only food. Figure 1 shows how many different developing
nations, no matter which continent they are located on, spend a large portion of their income on
food. When food prices rise, there is not much room for these families to adapt. These
households, especially in developing nations where government support and social programs are
at a bare minimum to non-existent, have to now buy alternative cheaper foods that are often
much less nutritious.
2
Figure 1
Source: Recent Trends in world food commodity prices: costs and benefits.
http://www.fao.org/docrep/014/i2330e/i2330e03.pdf
Along with cutting back on healthier foods, poor families are forced to spend less on
public services like schooling and medical services. Not only do these high and volatile food
prices have short-term effects on these families‟ lives but, now a child‟s development is put in
jeopardy as a derivative of this issue. Consequences can affect everyone, but possibly the most
hurt by rising food prices are families in developing nations, in particular their children.
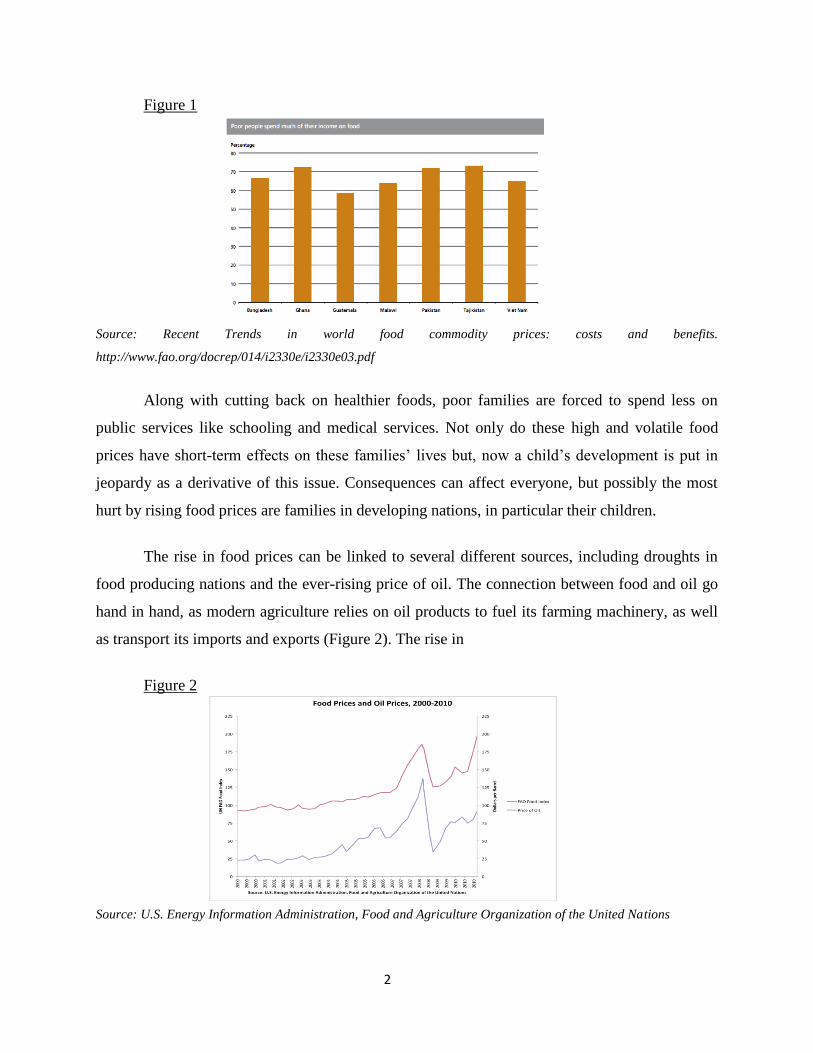
The rise in food prices can be linked to several different sources, including droughts in
food producing nations and the ever-rising price of oil. The connection between food and oil go
hand in hand, as modern agriculture relies on oil products to fuel its farming machinery, as well
as transport its imports and exports (Figure 2). The rise in
Figure 2
Source: U.S. Energy Information Administration, Food and Agriculture Organization of the United Nations
3
oil prices represents a direct link towards the rise in transportation costs, since fuel represents as
much as 50-60% of total shipping operation costs (Carbon, P, 2011). To add to the relationship
between food and oil prices; as oil prices rise, so does the demand for biofuels, which are the
only non fossil fuel able to replace petroleum products in existing combustion engines and motor
vehicles. The issue with this is that bio fuels are often made from corn and other agricultural
products, hence the demand for these alternative fuels increasing the demand and price of
crops. Powerful companies come into these poor nations with the promise to boost their
economy with jobs and provide greater incomes for those in poverty. Studies show otherwise
that they are in fact, doing quite the opposite. Biofuels production is added to the ever growing
difficulties policy makers have to combat the high rise of these food prices.
The difficulty of finding a median between economic prosperity and human rights and
development is often very difficult for these developing nations. Be it struggles within the
household to produce a sufficient diet for the family or competition outside the household to
produce an income or find employment, families in developing countries are finding themselves
stuck in the poverty cycle.
The Effects of Food Prices on Children and Poverty
Food is a necessity of life and must be purchased, no matter the cost. Unfortunately the
opportunity costs of attaining food for millions of people around the world are very severe. In
America where they spend, on average, less than 10% of their income on food, the rise in prices
of food is more of an inconvenience due to the possibility of adapting to higher prices (Carbon,
P., 2011). Food in North America is accessible and often taken for granted, but in countries
where many live in poverty, it is a different case. In most developing countries, the poor can
spend up to 70% of their income on food (International Monetary Fund, 2012). The social
implications of rising food prices hold severe consequences for the poor. In some countries the
lack of quantity and quality of food has caused many riots. These actions display the urgency of
people to gain more affordable and applicable access to quality food for themselves and their
families.
4
The quality and quantity of food in these underdeveloped nations has suffered, which
contributes to the already struggling overall per capita health and wellness. Undernourishment
increases disease and mortality, which lowers productivity and can have severe lifelong effects,
particularly for children. Childhood is a stage of life that will affect and influence a person‟s well
being for the rest of their lives. The period of childhood is arguably the most important time in a
human's life, as it is when children can develop and grow, physically and mentally, in order to
properly adapt to everyday life for years to come. The time period is short and finite, so a missed
opportunity to properly develop as a child may be difficult to overcome and may hold
irreversible effects later in life. A recommended healthy diet for kids is one with variety. This
includes plenty of water, enough protein for growth and repair, adequate carbohydrates, and
enough iron, calcium and vitamin D to strengthen bones and blood. Zinc and magnesium are also
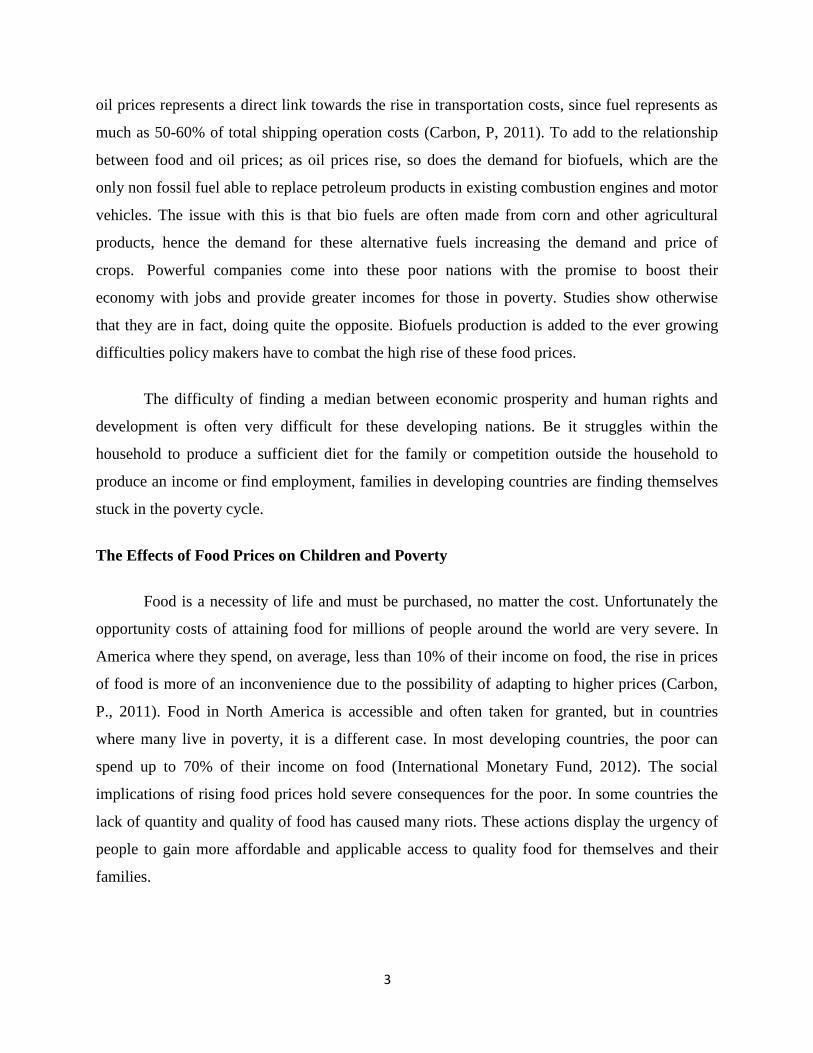
important to strengthen the immune system. The struggle for many kids to meet these nutritional
guidelines will have a profound effect on their development. When the price of simple foods rise,
such as rice, it is hard to follow an acceptable diet (Figure 3).
Figure 3
Source: The Rising Price of Rice. (Cyclone fuels rice price increase, 2008).
The impact of food prices on developing nations runs deeper than the obvious struggle to
provide enough food for everyone. Price spikes will limit the ability of poor households to meet
important non-food expenses, such as education and health care. The right to be educated at a
5
young age is important to the development of a human. However, the education one obtains in
school does not necessarily determine whether or not one will survive. Food and water are the
most important things for a human to live, therefore food and water become the primary priority
for all people even if the cost prevents other important aspects of life. The opportunity costs of
food are what poor families must endure every day, which will have a profound effect on their
children.
When food is unaffordable, families will do what it takes to put food on the table. Both
parents often will seek employment and may be required to work longer hours to bring in more
money. The additional income may be beneficial in many ways for children. Young children are
often not properly breastfed, and a lack of proper supervision may occur. As food becomes more
affordable a child in the family will become healthier and better nourished. However, this also
means less time for childcare and other domestic responsibilities that will not be fulfilled, as both
parents are spending their time working. The quantity and quality of caring time for children is
very important in a child's development. Higher food prices may have important effects on a
parent's time as they try and compensate for an increased household expenditure on food. The
time a parent spends on providing an income to supply the meal is time that will not be spent
caring for the children, and taking the necessary steps to help develop them with the likes of
school and healthcare centers.
An unfortunate reality in many parts of the world is the gender bias towards men, and the
desire of having a son rather than a daughter. In many cultures the daughter will come second to
the son, and will be deprived of many beneficial things that can disrupt development. The
daughter of a family will often take on extra responsibilities; motherly duties such as household
chores and childcare in order to help the parents as they provide an income. These added
responsibilities will prevent girls from participating in important developmental activities such as
schooling. Girls are often not able to receive an equal opportunity to an education as males are.
Of the 140 million children in the world who do not attend school, two thirds of them are girls
(Osita-Oleribe, 2007). A lack of education will often deny a girl of the knowledge and applicable
skills needed to live her life to her full potential. Educated women will have the necessary tools
to live a more productive life and will in turn help them raise a healthier family. The fact that
many poor families must spend their money on food, leaving little to no money on education is a
6
major problem in developing nations. Education provides tools for individuals in helping benefit
society and bringing positive contributions to developing nations.
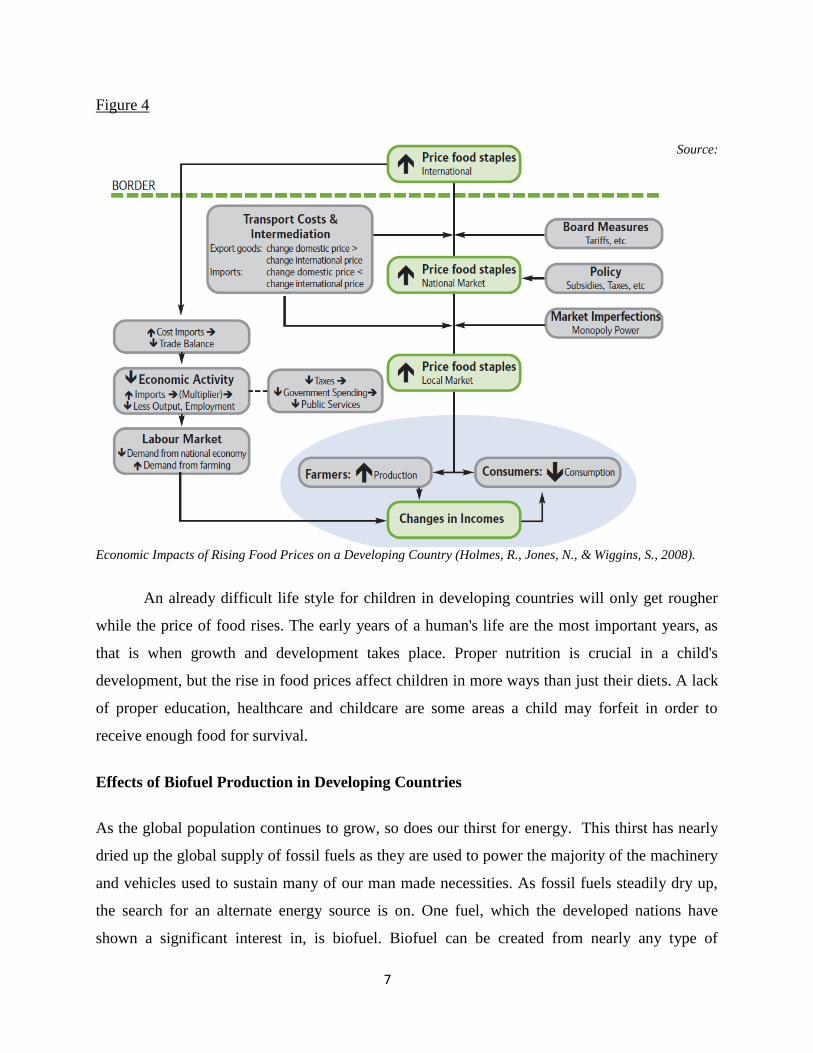
The higher cost of food leads to trade-offs that depress the level of activity in the
economy. The higher costs potentially lead to lower government revenues that can result in less
money spent on public services (Figure 4). Many children are already deprived of an education,
but for the fortunate few who are not, they often receive a less than acceptable education. With
less government revenue, teachers and school supplies become harder to pay for and will have a
large impact on the citizens of its jurisdiction. The lack of revenue dollars will prevent a child
from more than an education; healthcare will also take a major hit. As discussed earlier, the rise
in price in food will potentially hinder a child's health and development, meaning that healthcare
could potentially be vital to a child's survival. Most developing nations already lack hospitals and
clinics to provide for their citizens, as money for trained doctors, nurses and necessary medical
equipment is just not available. The fact that many children are indeed malnourished is very
discouraging and the lack of proper medical care needs to be accounted for by individual states.
More than 200 million children worldwide under the age of 5 do not receive basic healthcare,
leading to 10 million deaths annually from treatable ailments (Associated Press, 2008). Basic
healthcare interventions such as prenatal care, skilled assistance during birth, immunizations and
treatment, are not being provided to many children in developing nations. This can be partially
attributed to the result of the opportunity costs of food as it corners families and governing
bodies into investing their money towards the best allocation for survival, so rising prices of food
will limit their spending power for buying alternative goods and services.
7
Figure 4
Source:
Economic Impacts of Rising Food Prices on a Developing Country (Holmes, R., Jones, N., & Wiggins, S., 2008).
An already difficult life style for children in developing countries will only get rougher
while the price of food rises. The early years of a human's life are the most important years, as
that is when growth and development takes place. Proper nutrition is crucial in a child's
development, but the rise in food prices affect children in more ways than just their diets. A lack
of proper education, healthcare and childcare are some areas a child may forfeit in order to
receive enough food for survival.
Effects of Biofuel Production in Developing Countries
As the global population continues to grow, so does our thirst for energy. This thirst has nearly
dried up the global supply of fossil fuels as they are used to power the majority of the machinery
and vehicles used to sustain many of our man made necessities. As fossil fuels steadily dry up,
the search for an alternate energy source is on. One fuel, which the developed nations have
shown a significant interest in, is biofuel. Biofuel can be created from nearly any type of

8
vegetable oil, including oils that have already been used to fry food. This recycled fuel is loved
by environmental enthusiasts alike, as there are no significant environmental disadvantages to
using this product. While the idea that using these fuels in developed nations may seem to be a
prosperous one, both environmentally and economically, the disadvantages often fall on the
developing nations through the process of production of biofuel.
The market for biofuel has grown immensely and the supply of recycled fuel is unable to
keep up with the demand. When there is high demand for a product, producers will often create
as much supply as possible because money is now allocated to be spent on said product. This
has lead to biofuel producers moving and creating many of their operations to developing nations
due to the low cost of producing biofuel in these countries. Biofuel can be manufactured using a
variety of different grains but two of the more popular sources are soybeans and corn. Soybeans
and corn just so happen to be two important food sources that feed many in poverty, especially in
developing nations. When these products are seen to be more profitable as a fuel source than a
food source, the use is inevitably transferred. Each farm that is handed over for biofuel
production leaves one less contributor to the already struggling food market. Lower supply often
results in a higher price. This higher price then becomes unaffordable to a mass majority of the
population in these developing nations.
In developing nations prioritizing certain issues over others often is deemed to be very
subjective. Developing and maintaining human rights such as the right to food and water can
often be a less convenient option when trying to increase and economical gains and prosperity.
Brazil is one example that has taken to biofuel production on a large scale in an effort to
jumpstart their economy. Soybean plantations in Brazil have been growing at a rate of 15
percent annually (Trigona, 2007). The insertions of large companies taking over farms are
resulting in a loss for local farms, which are now too small to compete to provide. In Argentina,
the local governments seem to be in support of these evictions as they allow new companies
coming into the country. When farmers fought against their evictions they were arrested and put
in jail (Trigona). At an economical standpoint many of the large companies intruding into the
local farmlands appear to be boosting the economy and helping the people in these countries.
However, they are causing more harm than good by causing a disadvantage to the local farmers.
This was apparent when farmers and other locals were seen protesting outside of biofuel
9
conferences in Argentina. The Argentinian people had a strong case too, as food prices are now
estimated to rise 15 percent annually, a depleting and terrifying result for a country that has 30
percent of its population under the poverty line (Trigona). Job creation is produced through
these companies coming in and producing, but the production they are creating is not beneficial
to the locals. Although they are creating higher income per capita, the local foods that were
brought from these farms before provided for low costs. The opportunity cost of allowing these
companies to take over farming land is much higher for those in poverty and makes their lives
much more difficult.
Ethanol, created from corn, is an example of a biofuel that has caused significant
problems in the way of raising food prices and taking over land opportunities. The increased
demand for corn as a fuel product has driven many farmers to convert and quit producing food.
This has in turn made the price of corn increase, causing the diets of numerous citizens in
developing countries to fluctuate. The increase in demand for ethanol provides local farmers
profits to increase in corn production solely. This then results in the local farmers allocating the
majority of their farmland to the production of corn and are in turn abandon their production of
other grown goods. With now a low supply of these other grown goods and the demand the
same, the prices of these foods now increase and often become unaffordable for local citizens to
purchase. The Association of American Physicians and Surgeons released a warning that the
U.S. and European policy to increase ethanol usage passed what was consumed in 2004 could
lead to nearly 200, 000 deaths.
Moving passed the levels shown in 2004 (Figure 5) will drive roughly 35 million people
into absolute poverty in developing countries (Rice, 2011). With the direct transfer of corn from
food to fuel it is becoming more and more difficult for these struggling countries to find
nourishment. In one year the price of corn nearly doubled with the demand for biofuel still
growing (Rice 2011). Some advocate the idea that the increase in incomes for local workers from
these plantations will eventually offset the poverty level and give more money back to the people
who are currently unable to afford proper nourishment. While this argument cannot really be
disputed completely, it is clear that when these impoverished people are spending eighty percent
of their income on food, the answer and action taken to this issue needs to be supportive of
current conditions as well (Rice 2011).
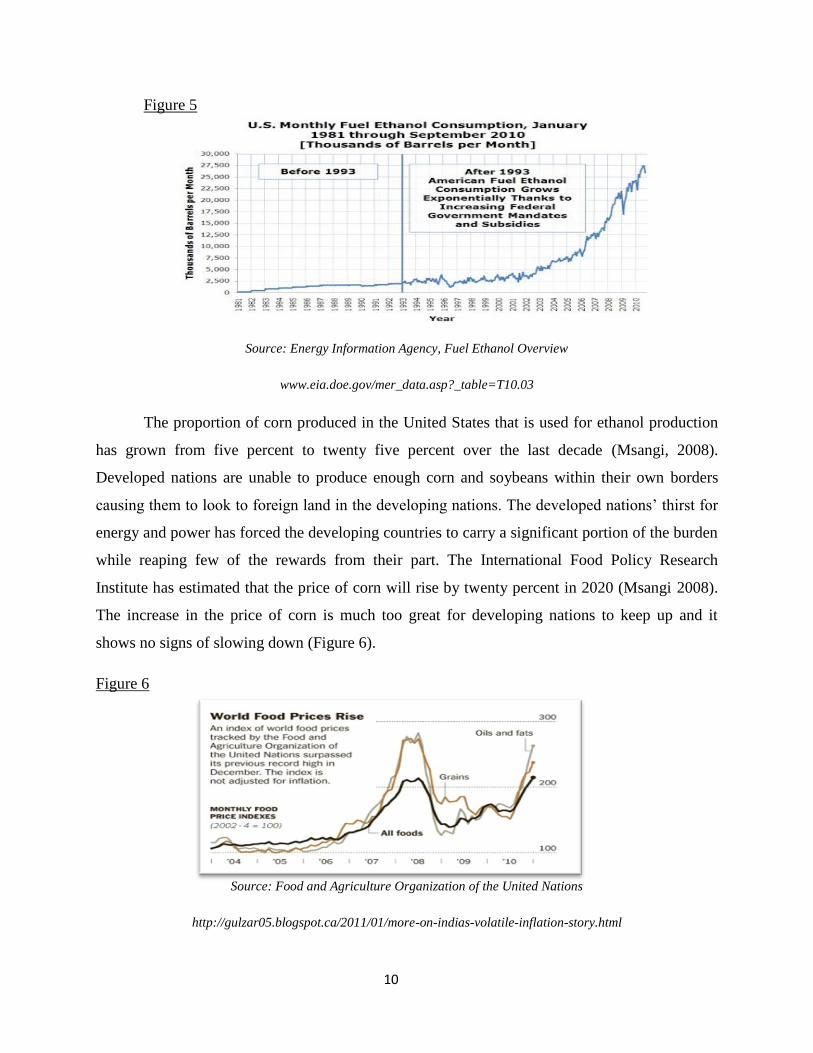
10
Figure 5
Source: Energy Information Agency, Fuel Ethanol Overview
www.eia.doe.gov/mer_data.asp?_table=T10.03
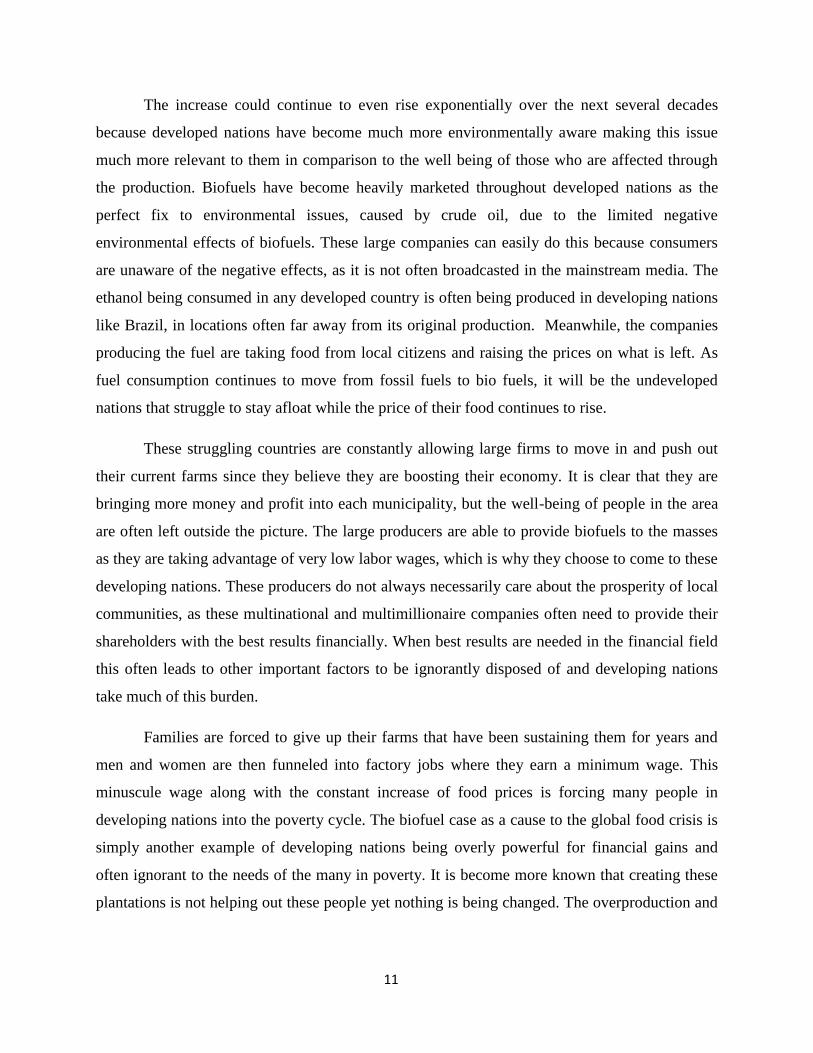
The proportion of corn produced in the United States that is used for ethanol production
has grown from five percent to twenty five percent over the last decade (Msangi, 2008).
Developed nations are unable to produce enough corn and soybeans within their own borders
causing them to look to foreign land in the developing nations. The developed nations‟ thirst for
energy and power has forced the developing countries to carry a significant portion of the burden
while reaping few of the rewards from their part. The International Food Policy Research
Institute has estimated that the price of corn will rise by twenty percent in 2020 (Msangi 2008).
The increase in the price of corn is much too great for developing nations to keep up and it
shows no signs of slowing down (Figure 6).
Figure 6
Source: Food and Agriculture Organization of the United Nations
http://gulzar05.blogspot.ca/2011/01/more-on-indias-volatile-inflation-story.html
11
The increase could continue to even rise exponentially over the next several decades
because developed nations have become much more environmentally aware making this issue
much more relevant to them in comparison to the well being of those who are affected through
the production. Biofuels have become heavily marketed throughout developed nations as the
perfect fix to environmental issues, caused by crude oil, due to the limited negative
environmental effects of biofuels. These large companies can easily do this because consumers
are unaware of the negative effects, as it is not often broadcasted in the mainstream media. The
ethanol being consumed in any developed country is often being produced in developing nations
like Brazil, in locations often far away from its original production. Meanwhile, the companies
producing the fuel are taking food from local citizens and raising the prices on what is left. As
fuel consumption continues to move from fossil fuels to bio fuels, it will be the undeveloped
nations that struggle to stay afloat while the price of their food continues to rise.
These struggling countries are constantly allowing large firms to move in and push out
their current farms since they believe they are boosting their economy. It is clear that they are
bringing more money and profit into each municipality, but the well-being of people in the area
are often left outside the picture. The large producers are able to provide biofuels to the masses
as they are taking advantage of very low labor wages, which is why they choose to come to these
developing nations. These producers do not always necessarily care about the prosperity of local
communities, as these multinational and multimillionaire companies often need to provide their
shareholders with the best results financially. When best results are needed in the financial field
this often leads to other important factors to be ignorantly disposed of and developing nations
take much of this burden.
Families are forced to give up their farms that have been sustaining them for years and
men and women are then funneled into factory jobs where they earn a minimum wage. This
minuscule wage along with the constant increase of food prices is forcing many people in
developing nations into the poverty cycle. The biofuel case as a cause to the global food crisis is
simply another example of developing nations being overly powerful for financial gains and
often ignorant to the needs of the many in poverty. It is become more known that creating these
plantations is not helping out these people yet nothing is being changed. The overproduction and
12
overconsumption of developed nations has become much greater than harm to simply developed
nations, it has now become a burden on developing nations as well.
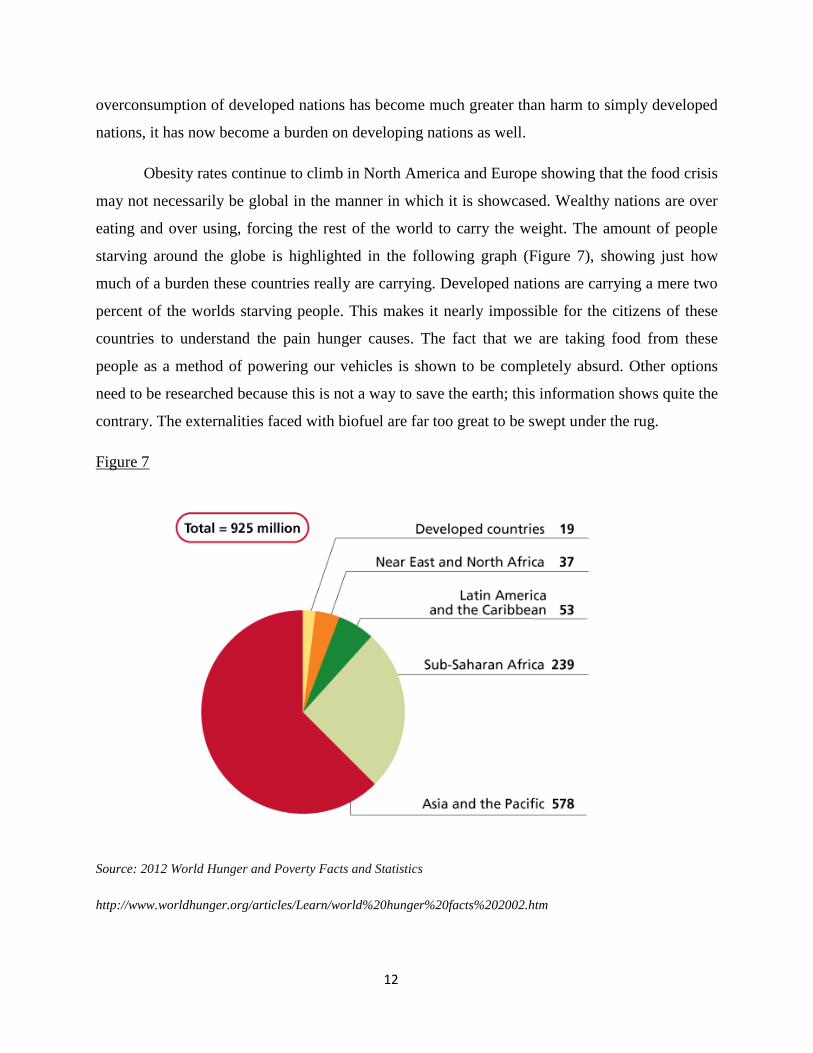
Obesity rates continue to climb in North America and Europe showing that the food crisis
may not necessarily be global in the manner in which it is showcased. Wealthy nations are over
eating and over using, forcing the rest of the world to carry the weight. The amount of people
starving around the globe is highlighted in the following graph (Figure 7), showing just how
much of a burden these countries really are carrying. Developed nations are carrying a mere two
percent of the worlds starving people. This makes it nearly impossible for the citizens of these
countries to understand the pain hunger causes. The fact that we are taking food from these
people as a method of powering our vehicles is shown to be completely absurd. Other options
need to be researched because this is not a way to save the earth; this information shows quite the
contrary. The externalities faced with biofuel are far too great to be swept under the rug.
Figure 7
Source: 2012 World Hunger and Poverty Facts and Statistics
http://www.worldhunger.org/articles/Learn/world%20hunger%20facts%202002.htm
13
The developed nations have exhausted the majority of their resources and their land. This
has led them to expand into developing nations, forcing these countries to carry the burden of
sustaining our luxuries.
The Contrast between Developed and Developing Countries
The distributional impacts of rising food prices can often be serious in countries where the
balance of payments have not been adversely affected. While some people benefit from higher
prices, most are harmed from the effects. This is dependent on whether they are net producers or
consumers of the food staple (the dominant portions of regular diet consisting of corn, wheat and
rice) and the extent to which wages adjust to higher food price inflation. The World Bank
warned that a total of thirty-three nations across the world were at severe risk of social unrest due
to the rising food prices in 2008. Not only were the poor nations faced with greater problems as a
result of the global food crisis, developed nations were also faced with unaffordable food prices.
For developing nations, the rise in food prices meant the possibility of mortality rates
increasing because of diseases caused by hunger and malnutrition. Countries that mainly
imported goods such as Haiti and West Africa were among those to first feel the devastating
effects. The price of bread doubled in one year making it even more difficult for those families
living on less than $1 a day (Singapore, 2008). The poorest households, which included many
female-headed households, were now in trouble because the family income was solely dependent
on that of the mother (or any single parent household) and the majority of the money would go to
buying food. This deeply affects overall credit and savings that the family may have had.
According to an article in the New York Times, 73% of Nigerian and 65% of Vietnamese total
budgets were spent on food. Using a sample of household data for eight different developing
nations, Ivanic and Martin (2008), analyze the impacts of higher food prices on poverty. They
take into account impacts from changes in commodity prices, and impacts through changes in
wage rates for unskilled labor. Results show that in six of the eight countries looked at, between
2005 and 2007 price increases for staple foods were directly associated with a rise in poverty. It
is estimated to have increased by three percent (Ivanic and Martin 2008). Analysis using an
alternative price index weighted according to the consumption patterns of the poor in Latin
America suggests that in most countries of the region, the effective inflation rate faced by the
poor is higher than the official rate, by three percent (World Bank, 2012).
14
Some developing nations began to ban exports to other countries in fear of starvation of
the people. India and Egypt both banned certain rice exports; Vietnam, the third largest rice
producer-halted exports to try and slow inflation. China, the world‟s number one producer of
grain also stopped exports.
Rising food prices also affect the richer, developed nations. According to a New York
Times Article there was a large increase in the number of working adults who were no longer
able to financially support their families. These people can be classified as “the working poor.”
With food being as expensive as it has become, some families are often faced with having to
choose between the need to eat and the need to heat their homes. A total of sixteen percent of
income in the United States goes towards food as well as a shocking twenty-eight percent in
China and thirty-three percent in India (New York Times, 2008). According to a survey done by
the Overseas Development Institute, almost all households that took part in the survey reported
that they had been cutting back on various expenditure items as well as eating cheaper and less
nutritious food. Urban households consumed more food off “the street” than at home due to
economies of scale. Some families began to pawn off valuables or took on extra work in order to
protect their assets and make ends meet (Singapore, 2008). New York City reported a seventy-
three percent increase in the number of full time workers that required help with food at the food
bank (Singapore 2008). Many families were left with no support and had to cope on their own
with the rising food prices as support from the community and government declined. In 2008
United States export prices rose from $375/ton in January to $440/ton in March and Thai rice
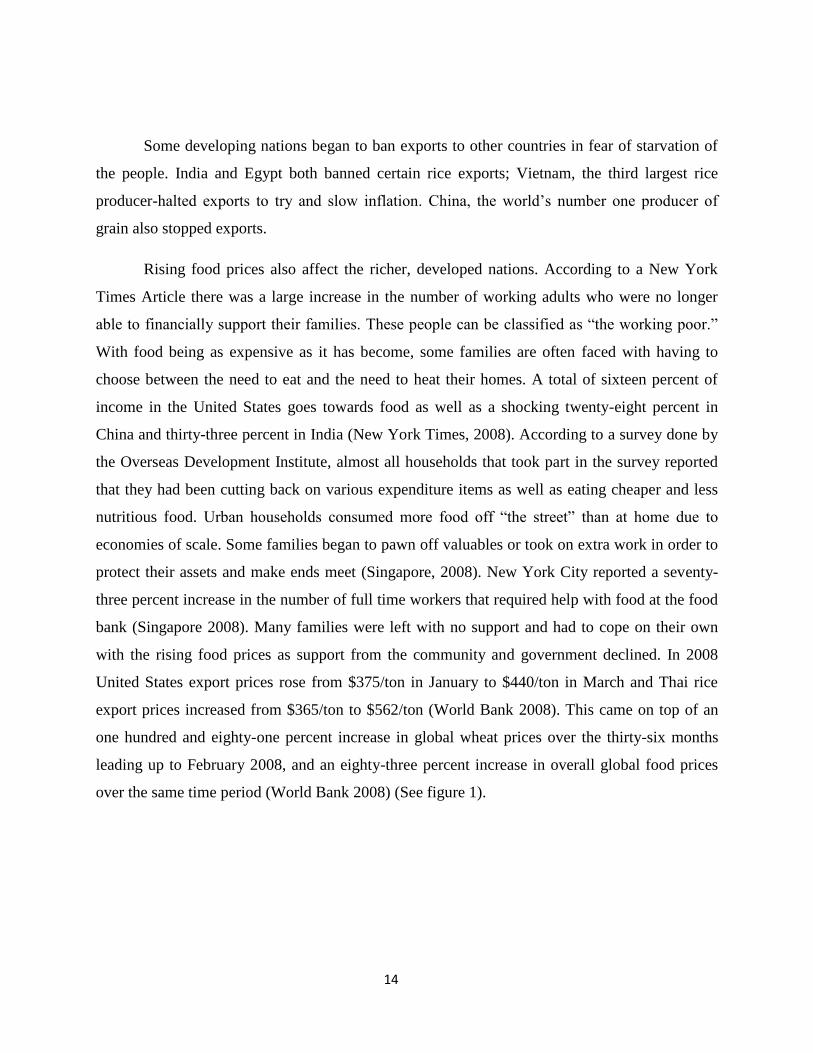
export prices increased from $365/ton to $562/ton (World Bank 2008). This came on top of an
one hundred and eighty-one percent increase in global wheat prices over the thirty-six months
leading up to February 2008, and an eighty-three percent increase in overall global food prices
over the same time period (World Bank 2008) (See figure 1).
15
Figure 1
Source: http://siteresources.worldbank.org/NEWS/Resources/risingfoodprices_backgrou ndnote_apr08.pdf
To help these struggling families in both developing and developed nations food-work
programs have been established. School feeding programs have also been implemented to
improve the overall food intake of school-aged children. However, mainly in developing nations
this typically does not address the problem of child malnutrition, as the most critical point is
when the child is still an infant. For developed nations where infants tend to receive better care
and do not grow up malnourished, the school feeding programs benefits those students who go to
school hungry. To try and stop the problem of food price increases, agricultural productivity
must significantly in developing nations. Richer countries financing a “green revolution” to
increase overall productivity and raise crop yields could do this. The assistance needed by these
underdeveloped nations is severely lacking as developed and industrial nations have become
significantly less generous. An article in The New York Times reported that overseas aid by
developed nations had decreased by approximately eight percent. In 2008, The World Food
Program said rising grain costs put a costly hole of $500 million in its food budget in order to
help victims suffering of hunger worldwide.
16
Even with the vast number of current international food aid programs nations are still
greatly affected by the global food crisis, with developing nations being much worse off.
Continued growth of the middle class, the continuous push for renewable resources and fuels,
along with anticipated damage to agricultural production due to global warming mean that food
prices are likely to remain high. People in developing nations will continue to need aid in order
to avoid malnutrition.
Conclusion
The food crisis is a matter of helping the people of now, as well as providing a system to help
stabilize an affordable healthy diet in the long run. The causes of the rise of high food prices will
only help raise the prices even more if correct policy and regulations are not set to provide aid to
the less fortunate. Global Food Security released a policy report Price Volatility in Food and
Agricultural Markets: Policy Responses released in June 2011 that stated, “G20 leaders at their
summit meeting in November 2010 requested FAO, IFAD, IMF, OECD, UNCTAD, WFP, the
World Bank and the WTO to work with key stakeholders „to develop options for G20
consideration on how to better mitigate and manage the risks associated with the price volatility
of food and other agriculture commodities, without distorting market behaviour, ultimately to
protect the most vulnerable.” A viable effort is being made by developing and developed nations
alike to combat this issue, but until these considerations are put into action the foreseeable future
entails higher food prices. The World Food Programme 2012 offers one of the best and simple
ways to help vulnerable countries with rising food prices and to provide stable long-term food
production with their “Five Point Action Plan on Food Prices” , which includes:
1. Develop emergency food reserves systems. This can be done by
scaling up WFP's existing advance purchase and pre-positioning facilities,
allowing access for WFP to national and regional food stocks during crisis,
and building up small regional food reserve systems under WFP
management.
2. Scale up social protection safety nets. Such as mother/child nutrition,
school meals, and job creation programs – whether food- or cash-based,
depending on market conditions – to protect the most vulnerable people.
17
3. Support smallholder, women farmers. To reduce their vulnerability
and help smallholders become a bigger part of the supply solution to food
security, including by leveraging local purchases by WFP (P4P) to
promote smallholder production and build local market infrastructure.
4. Strengthen commitments made at 2009 Rome summit to exempt
humanitarian food from export bans, restrictions or extraordinary taxes. A
code of good conduct which explicitly allows exemptions for WFP food
purchases.
5. Set up a multilateral mechanism to improve analysis of food prices,
production and stocks to support the G20 efforts to enhance transparency
of food markets.
Through this program the major issues are covered and a plan to overcome these issues is
strategically laid out to not only provide results short-term, but also more importantly for long-
term. There continues to be hope for all nations around the world that food prices will someday
decrease. Until then families continue to be faced with un-settling uncertainty, when and where
their next meal will come from.

18
References
Associated Press (2008). 10 Million Children Die From Lack of Health Care. Retrieved March
27, from http://www.msnbc.msn.com/id/24482102/ns/health-childrens_health/t/million-children-
die-lack-health-care/
Carbon, P. (2011). How Oil Prices Affect the Price of Food. Retrieved March 27, from
http://oilprice.com/Energy/Oil-Prices/How-Oil-Prices-Affect-the-Price-of-Food.html
Compton, Julia., Wiggins, Steve., Keats, Sharada. (2008). Impact of the Global Food Crisis on
the Poor: What is the Evidence? London, UK: Overseas Development Institute
Cyclone fuels rice price increase (2008). Retrieved March 27, 2012, from
http://news.bbc.co.uk/2/hi/7387251.stm
Food and Agriculture Organization of the United Nations (2011). The State of Food Insecurity in
The World 2011. FOA. Retrieved from http://www.fao.org/publications/sofi/en/
Haase, C. (2011, April). Study: Biofuels could cause more than 192000 deaths due to effect on
food prices [Web log post]. Environmental Health and Safety News.
Haugh, G., Hammond, K., Vakenier, K., & Hong, R. (N.D). Food Prices in Agricultural Markets.
The world food crisis, background and implications for exporter policy. Retrieved March
27, from http://are.berkeley.edu/~sberto/foodCrisis.pdf.
Holmes, R., Jones, N., & Wiggins, S. (2008). Understanding the Impact of Food Prices on
Children. How rising food prices affect poor families, what can be done to protect
children in the developing world. Retrieved March 27, from http://www.e-
alliance.ch/fileadmin/user_upload/docs/Plan_UnderstandingImpactFoodPricesChildren_
EN.pdf.
International Monetary Fund (2012). Impact of High Food and Fuel Prices on Developing
Countries. Retrieved March 27, from http://www.imf.org/external/np/exr/faq/ffpfaqs.htm.
19
Ivanic, M., & Martin, W. (2008). Implications of Higher Global Food Prices for Poverty in
Low-Income Countries. Development and Research Group, World Bank.
Msangi, S. (2008). The Developing World: In Depth Case Studies. Biofuels & the Poor.
Retrieved from http://biofuelsandthepoor.com/case-studies/
New York Times. (2008). The World Food Crisis. Retrieved April 1, from
http://www.nytimes.com/2008/04/10/opinion/10thu1.html
Osita- Oleribe, O (2007). Neglect of girl child education: bridging the gap. A case study of a
Nigerian Agrarian northern community. International NGO journal, 2, 30-31. Retrieved
from http://www.academicjournals.org/ingoj/pdf/Pdf2007/Feb/Osita-Oleribe.pdf
Rice, T. (2011). Biofuels are driving food prices higher. The Guardian. Retrieved
http://www.guardian.co.uk/global-development/poverty-matters/2011/jun/01/biofuels-
driving-food-prices-higher.
Security, G. F. (2011). Price Volatility in Food and Agricultural Markets: Policy Responses. Risk
Management,(June)1-68.Retrievedfromhttp://www.ifad.org/operations/food/
documents/g20.pdf
Singapore, Terence Yap. (2008). Rising Food Prices. Retrieved April 2, 2012, from
http://terenceyap07.hubpages.com/hub/Rising-Food-Prices
Trigona, M. (2007). Biofuels: A Danger for Latin America. Scitizen. Retrieved from
http://scitizen.com/future-energies/biofuels-a-danger-for-latin-america_a-14-707.html
Woods Institute (2006). The Impacts of Large-Scale Use of Biofuels on Food, Agriculture, and
Trade. Stanford University. Retrieved from http://woods.stanford.edu/docs/biofuels
/Biofuels3a.pdf
World Bank. (2008). Rising Food Prices: Policy Options and World Bank Response. Retrieved
April2,2012fromhttp://siteresources.worldbank.org/NEWS/
Resources/risingfoodprices_backgroundnote_apr08.pdf

20
World Food Programme (2011). Five Point Action Plan on Food Prices. WFO. Retrieved from
http://usa.wfp.org/news-story/five-point-action-plan-food-prices
World Food Programme (2012). High Food Prices. WFO. Retrieved from
http://www.wfp.org/stories/rising-food-prices-10-questions-answered
21
2 The Current State of Food Security in sub-Saharan Africa,
Southeast Asia and Latin America & the Caribbean
Jennifer Giesbrecht, Peter Moorman and Carys Pinches
Introduction
The issue of food security is an extremely relevant issue in current development discourse, and
will be the focus of our study. The FAO (2006) defines food security as a state when “all people, at all
times, have physical and economic access to sufficient, safe and nutritious food that meets their dietary
needs and food preferences for an active and healthy life”. The motivation behind choosing this topic
stems from the fact that food security is, and will increasingly become, an important aspect of structural
change within developing regions. With rising population numbers, and threats of intensified extreme
events due to climate change, access to food will become ever more difficult for many impoverished and
marginalized people. Poor access to food results in malnutrition and a subsequent reduction in human
capital, one of the barriers to structural change. The nature of food security in a given region, therefore, is
indicative of its overall health, social and economic development. We will be exploring the nature of
these problems by comparing three different regions of the world that are currently struggling to
ameliorate their status of food security. These regions are: sub-Saharan Africa, Southeast Asia, and Latin
America & the Caribbean. The parameters of this study fall into three categories: availability,
accessibility and utilization of food. FAO (2006) defines food availability as access to sufficient
quantities of food of appropriate quality, supplied through domestic production or imports”. Food
accessibility refers to “access by individuals to adequate resources (entitlements) for acquiring
appropriate foods for a nutritious diet. Entitlements are defined as the set of all commodity bundles over
which a person can establish command given the legal political economic and social arrangements of the
community in which they live” (FAO, 2006, p.1). Utilization can be defined as ensuring that
physiological needs are met through “nutritional well-being” (FAO, 2006, p.1). The purpose of using
these three categories is to provide a basis for comparison between each different region.
22
Availability
Sub-Saharan Africa
The precarious nature of food availability contributes greatly to food insecurity in sub-Saharan
Africa. Although 44.6% of the region‟s land base is available for agricultural use (World Bank, 2009),
crop failure due to climate conditions and environmental degradation is prevalent. Not only is the region
prone to notable rainfall variability, it is also subject to El Nino conditions which result in “extreme
weather events such as drought and floods” (Haile, 2005, p. 2169). It has been suggested that climate
change will further exacerbate these existing extreme weather conditions. Furthermore, Hansen, Mason,
Sun & Tall (2011) suggest that poor seasonal forecasting mechanisms in sub-Saharan Africa contribute to
crop failure. A lack of forecast gives farmers minimal warning in the event of extreme weather, thus
limiting time for farmers to take necessary precautions to protect crops. In terms of long-term preparation,
the lack of weather forecasting also disadvantages farmers in the region as they have inadequate
information about future weather and climate conditions for upcoming growing seasons.
In addition to unfavorable climate conditions, land degradation is another issue that has notable
ramifications for food availability in sub-Saharan Africa. Early development initiatives in the 1950s and
1960s sought to industrialize the agricultural sector. The promotion of large-scale farming resulted in
overproduction on the land and contributed greatly to loss of soil fertility. Consequently, farmers are
forced to grow crops on marginal lands, which in turn further diminishes the quality of the soil.
Agriculture on increasingly degraded land is one of the primary reasons for declining crop productivity in
sub-Saharan Africa (Sileshi, Akinnifesi, Legesse, Beedy, Oluvede & Mong‟omba, 2010). According to
Sileshi et al. (2010), maize contributes to over 50% of local crops. However, due to poor soil conditions,
production is not able to satisfy local consumption rates. Given the extensive local demand for maize,
farmers are forced to continuously grow the crop, mining organic soil matter, further reducing soil
23
fertility. Although fertilizer is an appropriate means to improve soil conditions, it is largely unavailable to
sub-Saharan African farmers due to rapid price increases (Sileshi et al., 2010).
Population growth is another condition that further facilitates land degradation. The regional
population is increasing at a rate of 2.5% a year, significantly increasing pressure for farmers to produce
high yield crops (World Bank, 2010). In addition, expanding populations further deplete agricultural land
as they encroach on “marginal lands, fallows and protected areas” (Drechsel, Kunze & Vrise, 2001).
Given that 62.2% of the population in sub-Saharan Africa lives in rural areas, crop failure is particularly
devastating as a significant proportion of the population relies on subsistence farming as a primary food
source.
Southeast Asia
The persistence of climactic extremes in Southeast Asia is a significant determinant of food
availability at both the regional and the sub-national level. This is due to more hostile environments being
far less likely to foster the growth of sufficient quantities of food than those that maintain a relatively
stable climate. The United Nations Economic and Social Commission for Asia and the Pacific have
referred to communities that are particularly vulnerable to fluctuations in food availability as "arable
margin areas". Some regional examples of arable margin areas include North Eastern Thailand, which is
highly prone to droughts, and coastal areas of Vietnam and the Philippines, which are prone to typhoons
(UNESCAP, n.d). During extreme climactic events, such as droughts and typhoons, there is a sufficient
reduction in the amount of goods produced in the area, thereby prolonging the "hungry season", the
period before harvest. Studies from different regions have found that droughts have implications beyond
the one season, for if the farmer has inadequate access to food for one season; this can reduce their
capacity to work the following season due to poor nutritional status. This reduction in human capital
could have a domino effect on reducing yields on a seasonal basis, which proves worrisome for the future
status of food availability (Hlanze et al., 2005).
24
The intensity of such extreme events is likely to increase in the future with climate change
projections, which also calls for innovations to help curb the impact on agriculture in Southeast Asia.
Implications that stem from climate change are already being experienced, and prove to be detrimental to
agriculture in the region. In Indonesia, for example, rainfall during the monsoon season has been
especially high, while rainfall during the dry season has decreased significantly. Additionally, "the
number of floods and storms increased; [the] number of hot days and warm nights increased [and the]
intensity and frequency of heat waves and forest fires increased" (Baxter, 2012, p.38). A reduction in
rainfall and an intensification of extreme events have also been prevalent in Thailand and Vietnam
(Baxter, 2012). Therefore, there is an irrefutable relationship between climate and food production, which
seems to suggest that future yields will decrease dramatically (Singh et al., 2011).
Similar to Sub-Saharan Africa, the population in Southeast Asia is continuing to increase
steadily, which has important implications for food availability in the region. For, as the number
of mouths to be fed increases, farmers are forced to produce more food on the same land. This
often results in more intensive farming, which has implications for land degradation, as seen in
the other regions. As a result, these different factors can turn into a vicious cycle whereby as
population increases, so too does soil degradation, which decreases the amount of food available
(Douglas, 2006).
What is more, as a middle class has begun to emerge in the middle-income countries of
Southeast Asia, spending power has increased; resulting in an increase in demand for different
types of food (see Figure 1). The creation of a middle class has been mostly a consequence of
structural change in these countries away from farming and towards more manufacturing and
service sector employment. Implications from this shift have occurred in Thailand in a somewhat
negative way. Structural changes within the country's economy suggest that the country's GDP
has increasingly become shaped by the export of material goods and services rather than
25
agricultural products. As a result, younger generations have become less likely to enter the
agricultural sector for employment due to it being less lucrative than newer employment
opportunities. Thus, not only are issues surrounding food availability linked to climactic or
biological factors, but there is also a necessity for adequate numbers of farmers to grow crops
(Supaphol, 2010). In an effort to counter this trend of urbanization, the Faculty of Agriculture at
Kasetsart University implemented programs to encourage younger generations to consider
agriculture as a career choice. Continued employment in the agriculture industry is crucial now
and into the future to ensure continued, sustainable food production (Supaphol, 2010).
During the mid-1960s, in an effort to improve the production of staple foods in more
volatile regions, intensive research took place in Southeast Asia to develop a crop that would be
less vulnerable to climactic and biological extremes. One such development was the invention of
high yield variety (HYV) rice and wheat, which promised much higher yields than traditional
strains. The adoption of HYV crops grew with force across Southeast Asia, at a rate one and half
times that of the rest of the world. This had a significant impact on the availability of some of the
most important foods consumed by the people of Southeast Asia (see Figure 2). Between 1980
and 2000, for example, production per hectare rose by 114% in Vietnam, a country that before
had been struggling to feed its ever-increasing population (UNESCAP, n.d.). Additionally, other
sectors, such as poultry, became more adept at producing higher quantities of meat. While in the
past poultry was farmed on a relatively small scale, in recent years there has been a structural
change from "horizontal to vertical integration" (UNESCAP, n.d., p.40). What this means is that
there is now a link between "farms growing animal feeds, to feed mills, to slaughterhouses, to
processing plants and to food stores", making the production more efficient and increasing
availability (UNESCAP, n.d., p.40).
26
Latin America & the Caribbean
The high abundance of arable land and the constant growth that Latin America & the
Caribbean have experienced in their agricultural sectors have resulted in an increased availability
of food. This rise in food production is crucial for its capacity to grow the economic sector of the
region by providing more job opportunities and greater exports. Furthermore, it serves the role of
decreasing food insecurity by easing pressure on food systems brought on by an increase in
population size. With an estimated 576 million hectares of arable land, the region has the biggest
of such reserves in the world (UNEP, 2002). Latin America & the Caribbean have been able to
capitalize on their natural resources, surpassing many developing regions in their ability to
provide food for their population as a whole. Relative to other developing regions, Latin America
& the Caribbean has experienced the highest growth rate in agricultural productivity, with a
1.9% increase between 1961 and 2007 (Ludena, 2010). This increase not only has direct impacts
within the region itself, by being able to provide food security to more people, but also creates
significant economic exporting opportunities due to excess food.
Of all agricultural growth in Latin America & the Caribbean, the vast majority is
accounted for by technological change and not by efficiency changes in production (see Figure
3). These gains in agricultural productivity are associated with the implementation of cost-saving
technologies such as genetically modified crops (GMC‟s), zero tillage, and the use of Global
Positioning Systems (GPS‟s) for more productive fertilizing and harvesting (Ludena, 2010).
Although these intensive food practices yield significant increases in food production, as seen in
Figures 4 and 5, there are still many health concerns and other consequences associated with
these technological innovations.
27
Availability of food is not solely in the present context of supplying food, but also the
future use of agricultural land and other food production systems. The consequences of climate
change could have a dramatic impact on future production growth in agriculture, as
repercussions could include melting glaciers, increased precipitation, and more sporadic extreme
weather events, as in Southeast Asia (Nelson, 2009). The Caribbean is especially vulnerable to
such changes as agricultural production only grew at an annual rate of 0.5% between 1961 and
2007 (Ludena, 2010). This is due to its agricultural production being aggravated by changes in
the rain cycles and higher temperatures. As an example, an increase of 10% to 20% in
precipitation, and of only 1 or 2 degrees in temperature, would reduce the production of broad
beans, rice, and maize by 10% (Martinez, Palma, Atalah & Pinheiro, 2009). These climactic
changes, coupled with a slow growth rate in their agricultural sector, would result in a severe
reduction of food in the region and an increase in food insecurity.
Climate change is not only projected to negatively impact the agricultural sector, but also
many other food production systems, including forestry, aquaculture and fisheries. The rising
temperature and other effects caused by climate change could significantly alter the present
physicality of the land, which would impact future production of food for its population. Figure 6
shows the projected trends of climate change and its effect on primary production in Latin
America & the Caribbean. Increased salinization and desertification of agricultural lands,
additional wildfires in forests, and reduction of water availability from shrinking glaciers all
contribute to the reduction of primary production of food. Studies have also suggested that
agricultural productivity in South America would fall between 12% and 50% by 2100 due to
climate change (UNCSD, 2011 p. 96). In addition, climate change affects more then just the
availability of food by reducing production capacities, but also it reduces the accessibility of

28
food. For example, an 18% of drop in agricultural productivity in Brazil would increase the rural
poverty by 3.2% (UNCSD, 2011 p. 96).
Accessibility
Sub-Saharan Africa
As previously discussed, subsistence farming is the primary means of food production in sub-
Saharan Africa. However, as food availability is a very precarious issue, the region is prone to a high
prevalence of household poverty. The widespread unemployment and vulnerability severely limits
available social security and coping mechanisms for families in the event of famine, conflict or market
shocks. Furthermore, as local food production is relatively unreliable, households in sub-Saharan Africa
are forced to supplement food supply with foreign imports. This reliance on imports is particularly
evident in the weeks previous to harvest before local crops have been cultivated, the aforementioned
“hungry season”. However, this dependence on foreign food imports is problematic as it exposes the
vulnerable region to fluctuating global food prices and inflation. For instance, as previously mentioned,
maize production is unable to meet local demands and consequently many sub-Saharan African countries
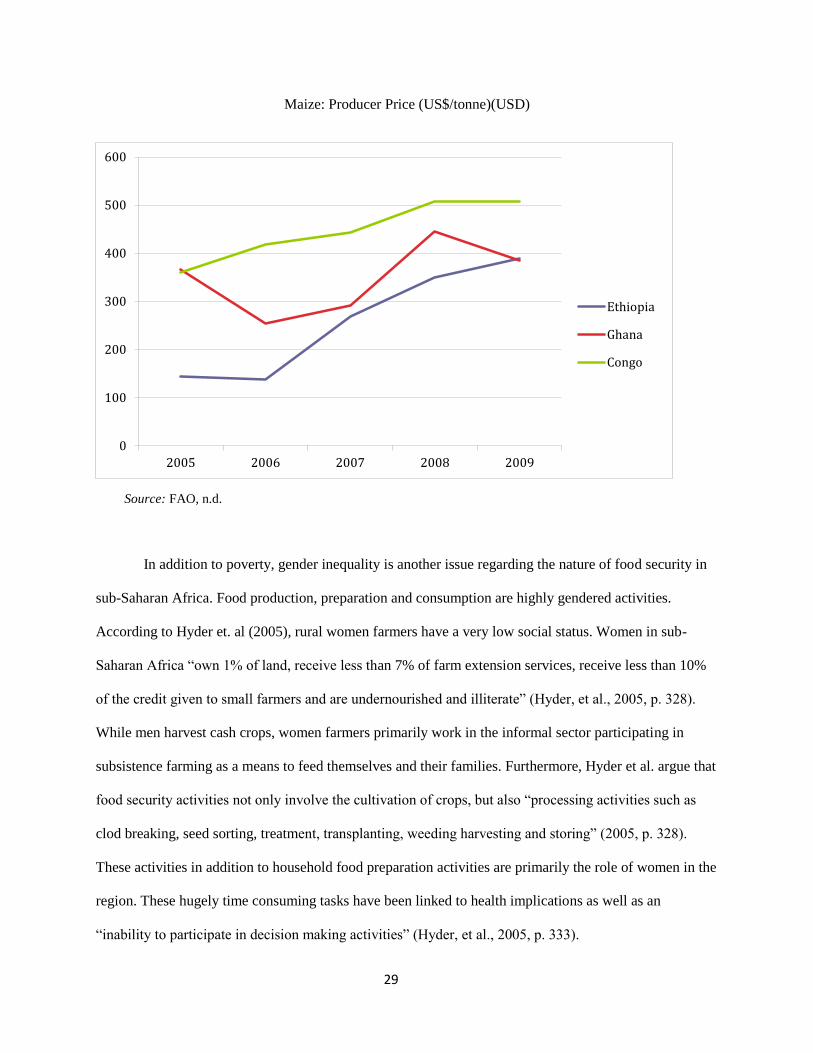
are forced to import up to ten million tonnes each year. As shown in the following diagram, the cost of
maize has been steadily increasing, reducing the quantity of maize that can be purchased for a set price.
Inflation combined with unemployment and minimal income greatly limits the ability of many households
to purchase food. Moreover, it is challenging for sub-Saharan African farmers to sell crops on global
markets as developed economies have established protectionist policies such as tariffs and subsidies on
agricultural sectors (Kandiero & Rando, 2004). Arguably, the nature of food insecurity in sub-Saharan
Africa demonstrates how the cycle of poverty operates in the agricultural population. Sub-Saharan
African farmers are unable to penetrate foreign food markets, severely limiting income-earning ability.
Additionally, the insecure nature of local food availability often forces farmers to rely on foreign imports.
However, inflation and lack of income limits household food accessibility.
29
Maize: Producer Price (US$/tonne)(USD)
In addition to poverty, gender inequality is another issue regarding the nature of food security in
sub-Saharan Africa. Food production, preparation and consumption are highly gendered activities.
According to Hyder et. al (2005), rural women farmers have a very low social status. Women in sub-
Saharan Africa “own 1% of land, receive less than 7% of farm extension services, receive less than 10%
of the credit given to small farmers and are undernourished and illiterate” (Hyder, et al., 2005, p. 328).
While men harvest cash crops, women farmers primarily work in the informal sector participating in
subsistence farming as a means to feed themselves and their families. Furthermore, Hyder et al. argue that
food security activities not only involve the cultivation of crops, but also “processing activities such as
clod breaking, seed sorting, treatment, transplanting, weeding harvesting and storing” (2005, p. 328).
These activities in addition to household food preparation activities are primarily the role of women in the
region. These hugely time consuming tasks have been linked to health implications as well as an
“inability to participate in decision making activities” (Hyder, et al., 2005, p. 333).
0
100
200
300
400
500
600
2005 2006 2007 2008 2009
Ethiopia
Ghana
Congo
Source: FAO, n.d.
30
Southeast Asia
Poverty is a particularly significant indicator of groups or areas that have poor food accessibility.
For example, in Indonesia it is estimated that by increasing the price of rice by 10%, the spending power
of the poorest 10% of the population is reduced by 2% (UNESCAP, n.d.). There are several sections of
the population in Southeast Asia that are particularly impoverished, and therefore have trouble accessing
adequate quantities of good quality food. Firstly, those living in rural areas are much more vulnerable to
food inaccessibility than those in urban areas. Inhabitants of rural areas, especially children, are
significantly more likely to be underweight than those of urban areas due mostly to economic and
physical barriers to the market place (UNESCAP, n.d.). That is to say, people living in rural regions earn
much less than urban inhabitants and may have transportation difficulties in getting to market. Therefore,
they cannot afford as much food, and what food they can afford is often of poor nutritional value. What is
more, families living in rural areas tend to be much larger than those in urban areas, which means that
they must support more people on a lower wage and less food. People, therefore, end up eating
significantly less, which can cause a myriad of problems in later life (Rosegrant et al., 2001).
A second particularly vulnerable group to food inaccessibility in Southeast Asia is migrant
workers. Migrant workers are extremely common in Thailand from Lao PDR and Myanmar, as well as in
Malaysia from lower-income countries in the region. The majority of migrant workers coming to these
middle-income countries work in the informal sector, and are therefore not protected by labor regulations.
As a result, they are often paid much less than other formal employees in the cities, which makes this
section of society particularly vulnerable to increases in food prices. Increases in food prices are
particularly common in years where climactic extremes have impacted food production. Thus, the food
they can afford is very little, and is often not of sufficient nutritional value (UNESCAP, n.d.)
Minority or tribal groups are vulnerable to food inaccessibility due to political barriers. In
addition, these populations reside mostly outside of urban centres, and therefore experience many of the
same problems as rural populations. Historically, these groups relied on traditional land for food
collection and hunting; however, when dominant groups came to power, they lost these areas and have
31
become extremely marginalized. Most tribal groups are not employed formally and therefore have low
wages, which is compounded by the inability to grow crops or hunt for subsistence due to deforestation.
The underlying theme for each of these groups is not that there is a lack available food, but rather that
they are the most impoverished, marginalized sections of the society and therefore cannot afford what
food is available. Some families are forced; as a result, to take children out of school to work, to sell any
assets they may own or to marry daughters, so that they don't have to feed so many people. Poverty and
food insecurity, as demonstrated here, therefore go hand in hand (UNESCAP, n.d.).
Finally, gender is an important factor that impacts food accessibility in Southeast Asian
communities. Generally, homes headed by a female often have less accessibility to food than those
headed by males. It is important to note that Southeast Asia does not have as prevalent gender biases
within the home as in South Asia; however, on a national scale women continue to be paid much less than
males. As a result, households with women as the predominant worker are less likely to have access to
food because they simply cannot afford adequate quantities of food, let alone those of sufficient quality.
Female-headed households often occur as a result of men and sons leaving their rural villages in order to
find work elsewhere (UNESCAP, n.d.). In the meantime, women care for the agricultural land, and it is
estimated that women, "contribute to about 65% of total food production" in rural areas. However,
because they have poor access to "resources such as credit, land, agricultural inputs and extension
services and employment", women are often left with poor accessibility because they cannot expand crops
to increase yields or sell surplus at the market (UNESCAP, n.d., p. 33).
Latin America & the Caribbean
A huge barrier in a population‟s access to food is the market conditions of the economy.
With high inflation and increasing prices of commodities, a low-income family may not be able
to afford the commodities they need. The 2006 to 2008 global financial crisis can be used as an
analogy for the ongoing price inflation crisis in Latin America & the Caribbean. During the
crisis, a main factor that caused widespread food insecurity was the speed at which the price of
32
commodities rose, making it difficult for the governments to implement policy adjustments in
time (Pinheiro, Bianchi, Uzquiza & Trucco, 2010). For example, during the crisis, the price of
wheat, maize, beef, and bananas increased 152%, 122%, 20%, and 24% respectively (Pinheiro, et
al., 2010). These high inflation rates on basic commodities resulted in families having to spend
more income on food, and less on other basic amenities, such as shelter, clothes, and health
commodities. For example, the average proportion of income spent on food ranges from 22.5%
in Chile, which is comparable to developed countries, to 57.5% in Haiti. This food crisis had
heavy political impacts, as it gave awareness to the fact that food security is closely associated to
food production and food supply (Pinheiro, et al., 2010).
Although the 2006 to 2008 food crisis presented the highest inflation rates seen in the
past decades, commodity prices are continually rising and presenting similar constraints on
families in the region. As Figure 7 illustrates, the increasing prices of food and other
commodities have been steadily rising even after the food crisis. For example, in the last year the
price of cereals, being the main source of calories for the population, were 36% higher as of
August 2011, compared to August 2010. In addition, the two most important crops, wheat and
maize, experienced price increases of 62% and 104% respectively within the past year alone
(FAO, 2011). With rising inflation prices of basic commodities, there has been an increase in the
number of households that can no longer afford to provide their families with these commodities,
making them fall into food insecurity.
With the increasing inflation rates of commodities, many families have been unable to
afford the basic commodities that they need. To help combat against food insecurity, many
governments in Latin America & the Caribbean have introduced a wide variety of food
programs. These programs seek ensure proper nutrition and access to food, and cost more than
33
US $1.6 billion annually to subsidize or provide food for people at risk of malnutrition
(Musgrove, 1993 p. 31). There are a large number of food programs in the region, with varying
sizes, which can be broken up into 3 categories: take-home programs, direct-feeding programs,
and subsidy programs (Musgrove, 1993 p. 31). Figure 8 shows the amount of programs per
country and the total amount of beneficiaries receiving care from these programs. Although these
food programs help elevate pressure on families, in many countries where food insecurity is
especially problematic, the food programs actually do not cover very many beneficiaries. In
Haiti, where the food shortage and malnutrition levels are very high, only 9% of children under
the age of 5 receive care, compared to a 96% coverage rate in Chile (Musgrove, 1993 p. 31).
Also, only 7% of children in the Dominican Republic receive food programs at school, compared
to almost 100% of school children in Brazil. These fluctuations between countries show that
although many children and families are helped, it is the more well off countries in the region
that benefit most. This problem is tied with governance and political policies, as well as resource
endowment, with only around 0.2% of these countries‟ GDP going towards putting in place such
programs.
Utilization
Sub-Saharan Africa
In sub-Saharan Africa widespread hunger and malnutrition are the two primary concerns
regarding food utilization. Hunger is generally associated with a lack of energy, while malnutrition refers
to an imbalance of nutrients (A. Kumar, personal communication, March, 2012). According to FAO,
approximately 218 million people, or 30% of the population in Africa are suffering from chronic
conditions of hunger and malnutrition (2009). This number is projected to increase to 300 million by 2020
34
(Rukuni, 2002). Furthermore, undernutrition contributes to 3.5 million child deaths every year (WHO,
2009).
The following table demonstrates that generally, many countries in sub-Saharan Africa appear to
be fulfilling the required caloric intake. However, people in sub-Saharan Africa seem to be consuming the
minimum, in comparison to developed countries, such as Canada, where people generally greatly
exceeding daily requirements. Chronic hunger can generally be attributed to previously discussed
circumstances such as a lack of availability and access to food.
Dietary Energy (kcal/person/day)
Required Consumed
Uganda 1710 2220
Sudan 1780 2280
Sierra Leone 1750 2120
Rwanda 1710 2090
Canada 1950 3530
As shown in the following chart, diet in sub-Saharan Africa is primarily carbohydrate based with
starches making up over 70% of food intake. This is unsurprising given the high production of
carbohydrates grown in the region and the relatively low cost. The chart demonstrates that developed
regions generally show a greater balance between carbohydrates, proteins and fats. While carbohydrates
are effective in alleviating hunger concerns, they do not ensure that individuals are obtaining all required
nutrients.
Source: FAO, 2007
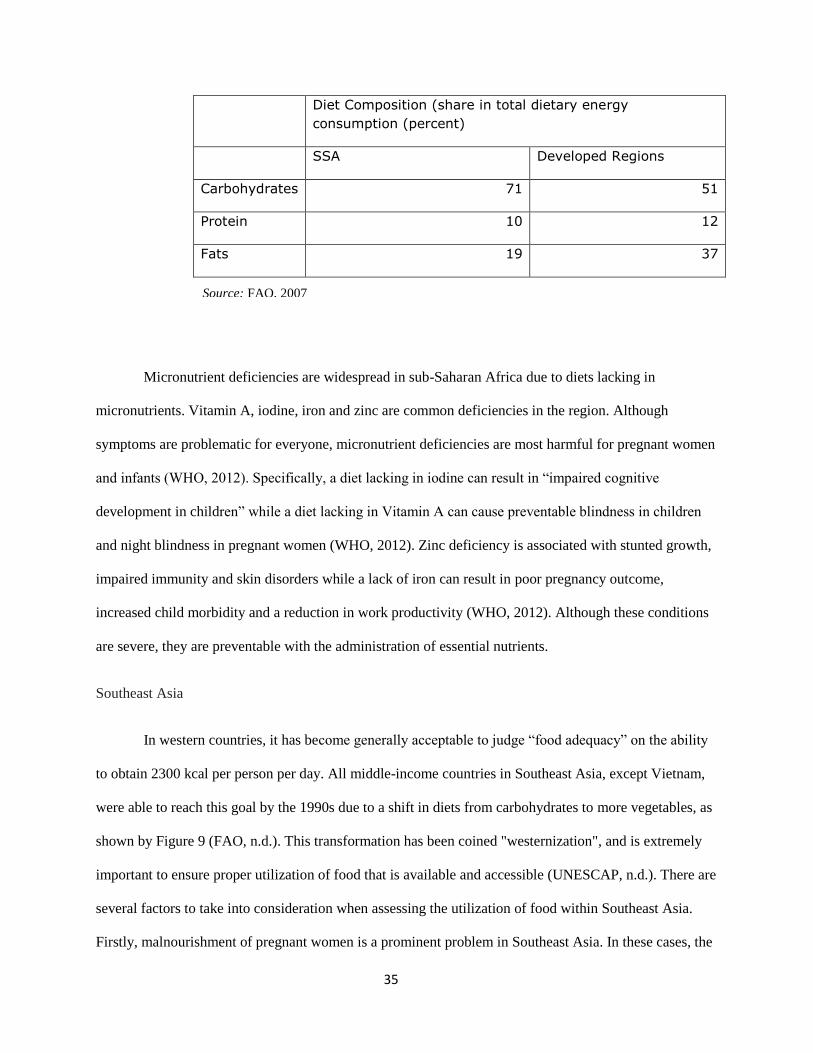
35
Diet Composition (share in total dietary energy
consumption (percent)
SSA Developed Regions
Carbohydrates 71 51
Protein 10 12
Fats 19 37
Micronutrient deficiencies are widespread in sub-Saharan Africa due to diets lacking in
micronutrients. Vitamin A, iodine, iron and zinc are common deficiencies in the region. Although
symptoms are problematic for everyone, micronutrient deficiencies are most harmful for pregnant women
and infants (WHO, 2012). Specifically, a diet lacking in iodine can result in “impaired cognitive
development in children” while a diet lacking in Vitamin A can cause preventable blindness in children
and night blindness in pregnant women (WHO, 2012). Zinc deficiency is associated with stunted growth,
impaired immunity and skin disorders while a lack of iron can result in poor pregnancy outcome,
increased child morbidity and a reduction in work productivity (WHO, 2012). Although these conditions
are severe, they are preventable with the administration of essential nutrients.
Southeast Asia
In western countries, it has become generally acceptable to judge “food adequacy” on the ability
to obtain 2300 kcal per person per day. All middle-income countries in Southeast Asia, except Vietnam,
were able to reach this goal by the 1990s due to a shift in diets from carbohydrates to more vegetables, as
shown by Figure 9 (FAO, n.d.). This transformation has been coined "westernization", and is extremely
important to ensure proper utilization of food that is available and accessible (UNESCAP, n.d.). There are
several factors to take into consideration when assessing the utilization of food within Southeast Asia.
Firstly, malnourishment of pregnant women is a prominent problem in Southeast Asia. In these cases, the
Source: FAO, 2007
36
baby will not get enough nutrients in the womb and will be born with a compromised immune system,
poor cognitive development and low weight. "Low birth-weight babies tend to have persistent health
problems and their development is impaired" (UNESCAP, n.d., p. 51). After birth, children should be
breast-fed for approximately six months in order to ensure they have essential nutrients and a strong
immune system to counter disease after birth. In such a case that a child is deprived of essential nutrients
in the womb and during the first 6 months of life, it is probable that intergenerational undernourishment
will occur, entrenching families in the cycle of poverty (Burgess et al., 2004).
Issues surrounding poor drinking water quality and sanitation practices in Southeast Asia are
significant barriers to food utilization, for they can "reduce the quality of food or make it hazardous"
(UNESCAP, n.d., p.51). Diseases and infections contracted from poor sanitation practices or poor
drinking water quality can inhibit children especially from being able to absorb nutrients due to excessive
expulsion through diarrhea or vomit (UNESCAP, n.d). Additionally, the contamination of food can be a
result of poor sanitation practices in the region due to processing and transportation techniques. One
country with particular contamination problems is Thailand, which means that even if food is available it
is not very useful in both the short and long term owing to the fact that it could potentially cause problems
related to health (Supaphol, 2010).
Contamination occurs in a variety of different ways. First, it can be a result of being in contact
with unhygienic equipment used for production or transport. Second, it can be caused from coming into
contact with chemical contaminants such as "heavy metals, hazardous chemicals from soil, water, food
containers, pesticides and some prohibited food additives and veterinary medicines" (Supaphol, 2010,
p.40). Lastly, "microbiological hazards and pathogenic microorganisms" can be of great concern due to
the fact that they can cause serious infections such as salmonella or listeria (Supaphol, 2010, p.40). In
order to reduce the risk of food-borne illnesses and contaminants, the government in Thailand has begun
to implement "a food safety policy to ensure strict food safety monitoring and control system in the
country by focusing on food production and processing throughout the food chain" (Supaphol, 2010,
p.40). This process has included a number of government and private stakeholders, all of which have been
37
given the responsibility to inspect and monitor any contaminants that may have entered the food
(Supaphol, 2010, p.41).
Latin America & the Caribbean
One indicator that portrays the relevance, scope, and status of food security in a region is
the amount and severity of undernourishment in children. Undernutrition, caused by the
insufficient food intake, both quality and quantity, comes as a direct result of lack of access and
availability of food (Robles, Torero, 2010). In Latin America & the Caribbean, more then 52
million people - approximately 10% of the region‟s population - suffer from malnutrition or
hunger, which although large, doesn‟t stand up to the large global undernourishment problem
(see Figure 10). The main cause of this high rate of undernutrition is not the lack of food-
production capacity, as the region is the biggest exporter of food on the planet, but rather it is a
poor distribution of- and access to food (FAO, 2008). This not only portrays the insufficient
political policies regarding distribution of food, but also the severity of food security throughout
the region, with 10% of the population not having the resources to attain the basic level of
nutrition.
Undernutrition as a consequence of food insecurity also has many severe indirect
economic impacts. The region‟s undernutrition in the last few decades has resulted in the loss of
1.7 million individuals - approximately 6% of the working age population (ages 15-64). The
greatest economic loses in the region due to deaths attributed to undernutrition take the form of
lost human capital, thereby failing the population to reach its productive potential (Martinez, et
al., 2009).
Numerous factors contributing to undernutrition become a public health concern in
developing regions. As Figure 11 illustrates, there are three main factors that can both increase or
38
diminish biomedical and productive vulnerabilities which can affect the quantity and quality of
nutrients and food ingested (Martinez, et al., 2009). They also affect the availability and
accessibility of food for the population to sustain themselves. These three factors can greatly
affect production processes, and in doing so can contribute to the autonomy of a country‟s supply
of food, which can cause increasing food insecurity (Martinez, et al., 2009).
One important aspect of food security is the sustainable use of agricultural land, to ensure
further productivity for future generations. Latin America & the Caribbean have been unable to
narrow the productivity gaps that exist in relation to developed countries. Specifically, in terms
of reorganizing its productive system, it still relies heavily on natural-resource-intensive sectors.
Due to this lack of advancement towards more sustainable agricultural practices, it will be
difficult for Latin America & the Caribbean to establish a growth trend without severe
environmental degradation (UNCSD, 2011). Environmental damages and impacts caused by
stock-raising activities such as irrigated cropland, livestock, and aquacultures include
deforestation, soil degradation, loss of biodiversity, and greenhouse gas emissions. These
damages are a result of intensive food production systems, which rely on many technological
advancements, such as using high yield fertilizers and pesticides to ease pressure from growing
populations and higher demands for food. Intensive production systems are mitigating
deforestation and the degradation of pasturelands by relieving some of the pressure on the
environment in the short term, by allowing high yields of food of smaller amounts of land.
However, the long term sees the potential for unsustainable air and water quality problems due to
excess nutrient accumulations in concentrated production systems (UNCSD, 2011).
Another problem that has arisen as a result of unsustainable practices for future food
production is the contamination of existing food and watersheds in the environment. However,
39
the use of intensive food production in Latin America & the Caribbean is an integral part of their
economy, and not easily transferable to more sustainable methods. The livestock sector in Latin
America & the Caribbean comprises 45% of the regional GDP, which accounts for 13% of
global production. The use of intensive food production has allowed the livestock growth rate to
double the global livestock growth rate, which is an important part of their economy. Exports
account for approximately 42% of global beef exports, and 42% of global poultry exports.
Additionally, from 2006 to 2009, Latin America & the Caribbean‟s share of world agricultural
exports reached 14%, up from 11% from 1995 to 1999 (World Bank, n.d.). This shows that while
Latin America & the Caribbean rely on an unsustainable high-intensive food production system,
it is essential to their economy and to forgo this system would result in widespread food
insecurity.
Comparison
Availability
The capacity for a region to secure adequate food availability for its population is a
prominent indicator for the level of food security found in each. Food availability can be defined
as the availability of sufficient quantities of appropriate quality, supplied through domestic
production or imports (FAO, 2006). The comparison between the three regions, sub-Saharan
Africa, Southeast Asia, and Latin America & the Caribbean, illustrates that different food
production capacities implicates the level of food security.
The share of agricultural land found in each region can demonstrate the status of food
availability in the region, as it depicts the amount of land under permanent crops and pastures.
With increased share of agricultural land, there is an increased production capacity for each
region to supply food to its population, thus reducing the prevalence of food insecurity and
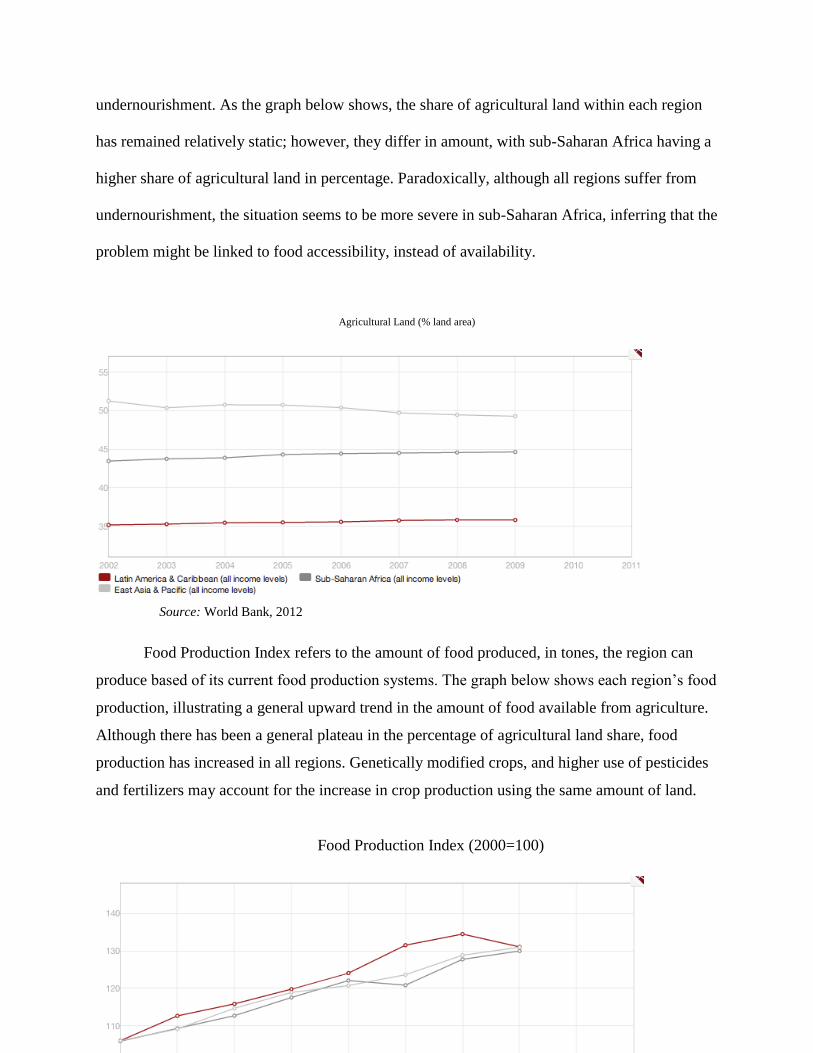
40
undernourishment. As the graph below shows, the share of agricultural land within each region
has remained relatively static; however, they differ in amount, with sub-Saharan Africa having a
higher share of agricultural land in percentage. Paradoxically, although all regions suffer from
undernourishment, the situation seems to be more severe in sub-Saharan Africa, inferring that the
problem might be linked to food accessibility, instead of availability.
Agricultural Land (% land area)
Food Production Index refers to the amount of food produced, in tones, the region can
produce based of its current food production systems. The graph below shows each region‟s food
production, illustrating a general upward trend in the amount of food available from agriculture.
Although there has been a general plateau in the percentage of agricultural land share, food
production has increased in all regions. Genetically modified crops, and higher use of pesticides
and fertilizers may account for the increase in crop production using the same amount of land.
Food Production Index (2000=100)
Source: World Bank, 2012

41
This intensive use of food production systems may be a consequence of strains on food
systems facilitated by an increase in population (as seen in Figure 12). Although all regions face
increase in population, in sub-Saharan Africa food insecurity may be more prevalent due to their
higher population growth. An increase in production due to high intensive food systems may
help attain regional food security in the short-term; however, as a result of these unsustainable
practices, future food insecurity will affect all three regions.
Accessibility
As mentioned above, food accessibility is defined by the FAO (2006) as "access by individuals to
adequate resources (entitlements) for acquiring appropriate foods for a nutritious diet. Entitlements are
defined as the set of all commodity bundles over which a person can establish command given the legal,
political, economic and social arrangements of the community in which they live" (FAO, 2006, p.1).
Gender inequality in Southeast Asia, sub-Saharan Africa and Latin America & the Caribbean is an
extremely important factor when considering food inaccessibility in developing states. The discrimination
of women on both the regional and sub-national scales has resulted in females having poorer access to
adequate quantities of good quality food in comparison to males. In order to explore this theory, this
paper uses the Gender Inequality Index (GII) to compare gender inequality across the three regions. In
sub-Saharan Africa, Ghana has a GII score of 0.729, Mozambique of 0.718 and Rwanda of 0.638. In
Southeast Asia, Thailand has a GII score of 0.586, Indonesia of 0.680 and Vietnam of 0.530. Lastly, in
(World Bank, 2012)
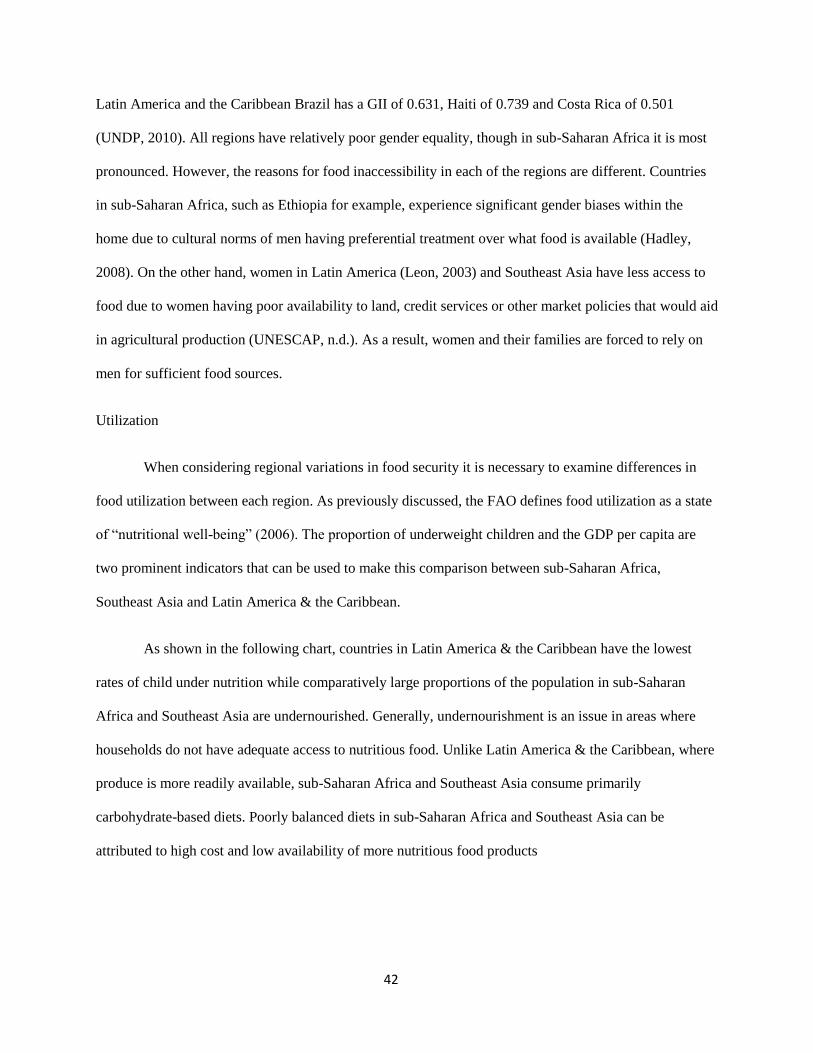
42
Latin America and the Caribbean Brazil has a GII of 0.631, Haiti of 0.739 and Costa Rica of 0.501
(UNDP, 2010). All regions have relatively poor gender equality, though in sub-Saharan Africa it is most
pronounced. However, the reasons for food inaccessibility in each of the regions are different. Countries
in sub-Saharan Africa, such as Ethiopia for example, experience significant gender biases within the
home due to cultural norms of men having preferential treatment over what food is available (Hadley,
2008). On the other hand, women in Latin America (Leon, 2003) and Southeast Asia have less access to
food due to women having poor availability to land, credit services or other market policies that would aid
in agricultural production (UNESCAP, n.d.). As a result, women and their families are forced to rely on
men for sufficient food sources.
Utilization
When considering regional variations in food security it is necessary to examine differences in
food utilization between each region. As previously discussed, the FAO defines food utilization as a state
of “nutritional well-being” (2006). The proportion of underweight children and the GDP per capita are
two prominent indicators that can be used to make this comparison between sub-Saharan Africa,
Southeast Asia and Latin America & the Caribbean.
As shown in the following chart, countries in Latin America & the Caribbean have the lowest
rates of child under nutrition while comparatively large proportions of the population in sub-Saharan
Africa and Southeast Asia are undernourished. Generally, undernourishment is an issue in areas where
households do not have adequate access to nutritious food. Unlike Latin America & the Caribbean, where
produce is more readily available, sub-Saharan Africa and Southeast Asia consume primarily
carbohydrate-based diets. Poorly balanced diets in sub-Saharan Africa and Southeast Asia can be
attributed to high cost and low availability of more nutritious food products

43
Children Aged < 5 Years Underweight for Age (2004-2007)
SSA
Congo 28.20%
Ethiopia 34.60%
Ghana 13.90%
SEA
Indonesia 19.70%
Thailand 7.00%
Vietnam 20.20%
LA & C
Haiti 18.90%
Mexico 3.40%
Brazil 2.20%
Furthermore, levels of poverty can help to explain the differing rates of undernourishment
between regions. As shown by the following graph, Latin America & the Caribbean have the highest
levels of Gross Domestic Product (GDP) per capita and the lowest levels of child undernourishment.
Similarly, of the three regions, countries in sub-Saharan Africa suffer from the highest rates of under
nutrition as well as have the lowest GDP per capita. It can be inferred that levels of poverty and
nutritional attainment are correlated.
Source: UN Data, n.d.
44
GDP per Capita (Current US$)
Conclusion
The results from this study demonstrate that food insecurity is a widespread issue in many
developing regions across the globe. Despite regional disparities, underlying similarities persist in sub-
Saharan Africa, Southeast Asia and Latin America & the Caribbean. The availability, accessibility and
utilization of food are important components of food security, which serve as strong indicators pertaining
to health, economic and social development. Recommendations to relieve food insecurity should assess
local conditions and be grassroots in nature. The distribution of vitamin supplement pills is a good
strategy for short-term relief for under nutrition. Other short-term initiatives to improve food security
include micro-credit and the provision of tools and services. In order to improve long-term food security
conditions, all three regions require more sound governance and greater institutional capacity and
research in agricultural sectors. Additionally, better coping mechanisms and social security would provide
farmers with better means of responding to future concerns. Further research should address region-
specific initiatives to ameliorate food security concerns.
45
Bibliography
Burgess, A., & Glasauer, P. (2004). Family nutrition guide. Rome: Food and Agriculture Organization of
the United Nations.
Douglas, I. (2006). The Local Drivers of Land Degradation in South-East Asia. Geographical Research,
44(2), 123-134. Retrieved April 8, 2012, from the Wiley Online Library database.
FAO.(1998). Annex 2: Food Security in Southeast Asia - Achievements and the Unfinished Tasks.
Bangkok, Thailand: Regional Office for Asia and the Pacific. Retrieved February 14, 2012, from:
http://www.fao.org/docrep/004/ab981e/ab981e0b.htm#bm11
FAO. (2006). Food Security. FAO. Downloaded April 2, 2012, from
ftp://ftp.fao.org/es/esa/policybriefs/pb
FAO, 2008. Freeing Latin America and the Caribbean from hunger. Retrieved March 30, 3012,
from http://www.fao.org/newsroom/en/focus/2008/1000780/index.html
FAO. (2011). Panorama of Food and Nutrition Security in Latin America and the Caribbean
2011. 4-20. Retrieved March 16, 2012, from
http://www.rlc.fao.org/fileadmin/content/publicaciones/pfnslac2011_en.pdf
Food and Agriculture Organization. (2009). The special challenge for sub-Saharan Africa. High
Level Export Forum. Retrieved March 26, 2012 From
http://www.fao.org/fileadmin/templates/wsfs/docs/Issues_papers/HLEF2050_Africa.pdf
Hadley, C. (2008). Gender Bias in the Food Insecurity Experience of Ethiopian Adolescents. Social
Science and Medicine, 66(2), 427-438. Retrieved April 2, 2012, from the NIH Public Access database.
Haile, M. (2005). Weather patterns, food security, and humanitarian response in sub-Saharan Africa.
Philosophical Transactions of The Royal Society B, 360, 2169-2182. Retrieved February 25, 2012 from
http://www.ncbi.nlm.nih.gov/pmc/articles/PMC1569582/
Hansen, J., Mason, S., Sun, L. & Tall, A. (2011). Review of seasonal climate forecasting for agriculture in
sub-Saharan Africa. Experimental Agriculture, 47(2), 205- 240

46
Hyder, A., Maman, S., Nyoni, J., Khasiani, S., Teoh, N., Premji, Z. & Sohani, S. (2005). The pervasive
triad of food security, gender inequality, and women‟s health: exploratory research from sub-Saharan
Africa. African Health Sciences, 5(4), 328-334.
Hlanze, Z., Gama, T., & Mondlane, S. (2005). The Impact of HIV/AIDS and Drought on Local
Knowledge Systems for Agrobiodiversity and Food Security. FAO. Downloaded April 8, 2012, from
ftp://ftp.fao.org/docrep/fao/009/ag251e/ag251e00.pdf
Kandiero, T. & Randa, J. (2004). Agricultural exports: important issues for sub-Saharan Africa. African
development review, 16(1), 1-35
Leon, M. (2003). The Gender Asset Gap: Land in Latin America . World Development, 31(6), 925-947.
Retrieved April 3, 2012, from the Science Direct database.
Ludena, C. E. (2010). Agricultural Productivity Growth, Efficiency Change and Technical Progress in
Latin America and the Caribbean. Retrieved March 22, 2012.
Martinez, R., Palma, A., Atalah, E., & Pinheiro, A. C. (2009). Food and Nutrition Insecurity in
Latin America and the Caribbean, 12-78. Retrieved March 15, 2012.
Mugwagwa, J., Wamae, W. & Outram, S. (2010). Agricultural innovation and food security in Sub-
Saharan Africa: tracing connections and missing links. Journal of International Development, 22(3), 283-
288.
Musgrove, P. (1993). Feeding Latin America's Children. The World Bank Research Observer,
8(1), 23-45. Retrieved March 16, 2012, from http://wbro.oxfordjournals.org/
Nelson, C. G., (2009). Climate Change: Impact on Agriculture and Costs of Adaption. International Food
Policy Research Institute. Retrieved March 15, 2012.
Pineiro, M., Bianchi, E., Uzquiza, L., & Trucco. (2010). New Trends With Certain Results. Food Security
Policies in Latin America, 1-26. Retrieved March 23, 2012.
47
Robles, M., Torero, M. (2010). Economia. Understanding the Impact of High Food Prices in Latin
America. Retrieved March 22, 2012.
Rosegrant, M., & Hazell, P. (2001, May 1). TRANSFORMING THE RURAL ASIAN ECONOMY: THE
UNFINISHED REVOLUTION. International Food Policy Research Institute. Downloaded April 8,
2012, from www.ifpri.org/sites/default/files/pubs/202
Rukuni, M. (2002). Africa: Addressing Growing Threats to Food Security. The Journal of Nutrition,
132(11), 3443S.
Singh, N. P., S. Bantilan, M. C., Kumar, A. A., Janila, P. and R. Hassan, A. W. (2011) Climate Change
Impact in Agriculture: Vulnerability and Adaptation Concerns of Semiarid Tropics in Asia, in Crop
Adaptation to Climate Change (eds S. S. Yadav, R. J. Redden, J. L. Hatfield, H. Lotze-Campen and A. E.
Hall), Wiley-Blackwell, Oxford, UK. doi: 10.1002/9780470960929.ch9
Thompson, H., Berrang-Ford, L. & Ford, J. (2010). Climate Change and Food Security in Sub-Saharan
Africa: A Systemic Literature Review. Sustainability, 2(8), 2719-2733.
Ugwuanyi, JU & Obinne, C. (1998) Promoting food security in sub-Saharan Africa. Outlook on
Agriculture, 27(1), 47-52.
UNCSD. (2011). Sustainable developmetn in Latin America and the Caribbean 20 years on from
the Earth Summit: progress, gaps and strategic guidelines. Retrieved March 15, 2012, from
http://www.uncsd2012.org/rio20/content/documents/eclac.pdf
UNDP. (2010). Gender Inequality Index. UNDP. Downloaded April 6, 2012, from
hdr.undp.org/en/media/HDR_2010_EN_Table4_reprint.pdf
UNEP. (2002). Land: Latin America and the Caribbean. Global Environment Outlook 3, 79-81. Retrieved
March 24, 2012, from http://www.centrogeo.org.mx/unep/documentos/Geo-3/Chapter2Land.pdf
UNESCAP - United Nations Economic and Social Commission for Asia and the Pacific. (n.d.)
Sustainable Agriculture and Food Security in Asia and the Pacific. UN Commission. Retrieved February
14, 2012, from: http://www.unescap.org/65/documents/Theme-Study/st-escap-2535.pdf
Veiga, Pedro, and Jean Lévesque. Trading food food security policies in Latin America, Southeast Asia
and Southern Africa and their implications for trade and regional integration. Winnipeg, Man.:
International Institute for Sustainable Development, 2010. Print.
48
World Bank. (2012). Data: Indicators. Retrieved February 27, 2012 from,
http://data.worldbank.org/indicator
The World Bank. (n.d.). Latin America and Caribbean - Latin America and the Caribbean
Regional Brief. (n.d.). Retrieved March 30, 2012, from http://go.worldbank.org/EVLP8KXOU0
World Health Organization Regional Office for Africa. (2012). Food Safety and Nutrition Overview.
Retrieved March 29, 2012 from http://www.afro.who.int/en/clusters-a-programmes/hpr/food-safety-and-
nutrition-fan/overview.html
World Health Organization (2012). Nutrition. Retrieved March 29, 2012 from
http://www.who.int/nutrition/topics/micronutrients/en/index.html
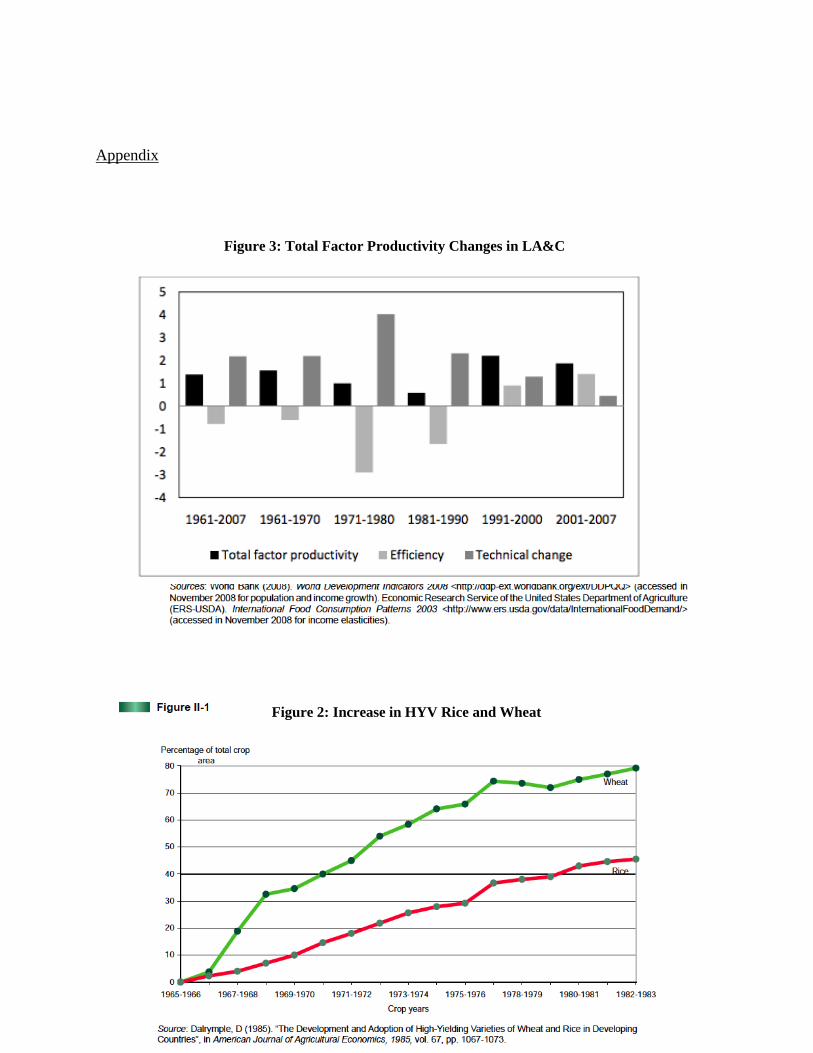
49
Appendix
Figure 1: Population Growth and Spending Power
Figure 2: Increase in HYV Rice and Wheat
Figure 3: Total Factor Productivity Changes in LA&C
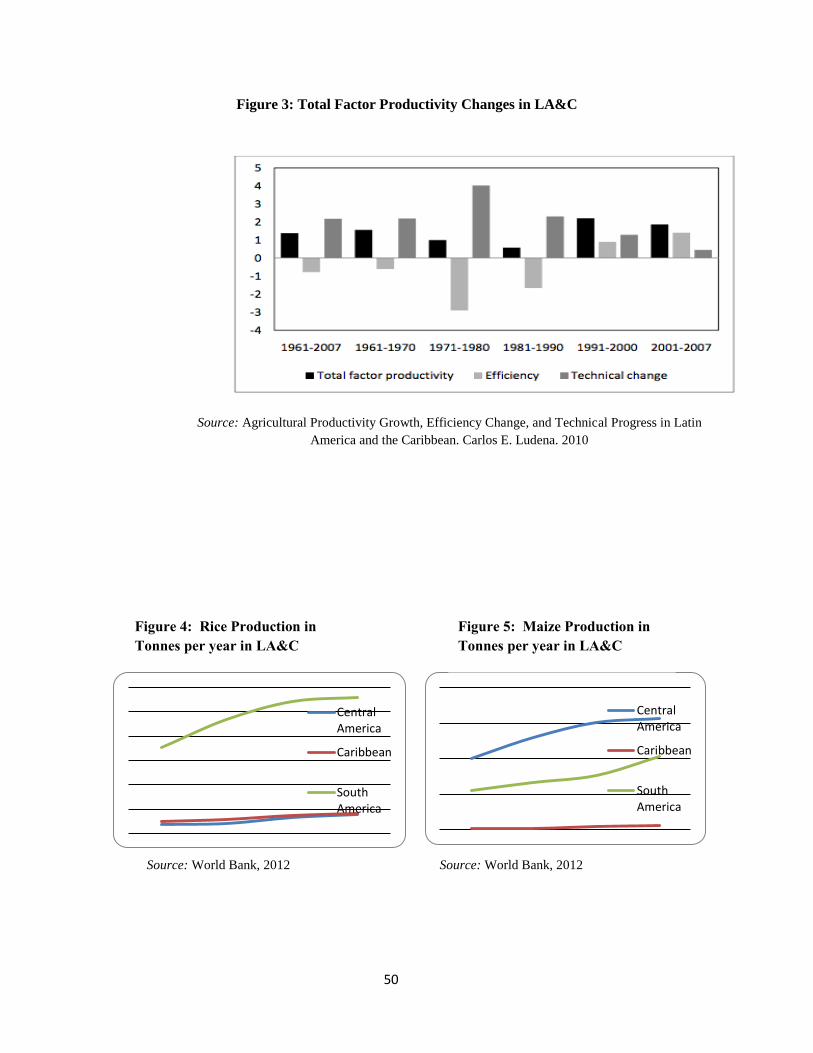
50
Figure 3: Total Factor Productivity Changes in LA&C
CentralAmerica
Caribbean
SouthAmerica
CentralAmerica
Caribbean
SouthAmerica
Figure 4: Rice Production in
Tonnes per year in LA&C
Figure 5: Maize Production in
Tonnes per year in LA&C
Source: World Bank, 2012 Source: World Bank, 2012
Source: Agricultural Productivity Growth, Efficiency Change, and Technical Progress in Latin
America and the Caribbean. Carlos E. Ludena. 2010
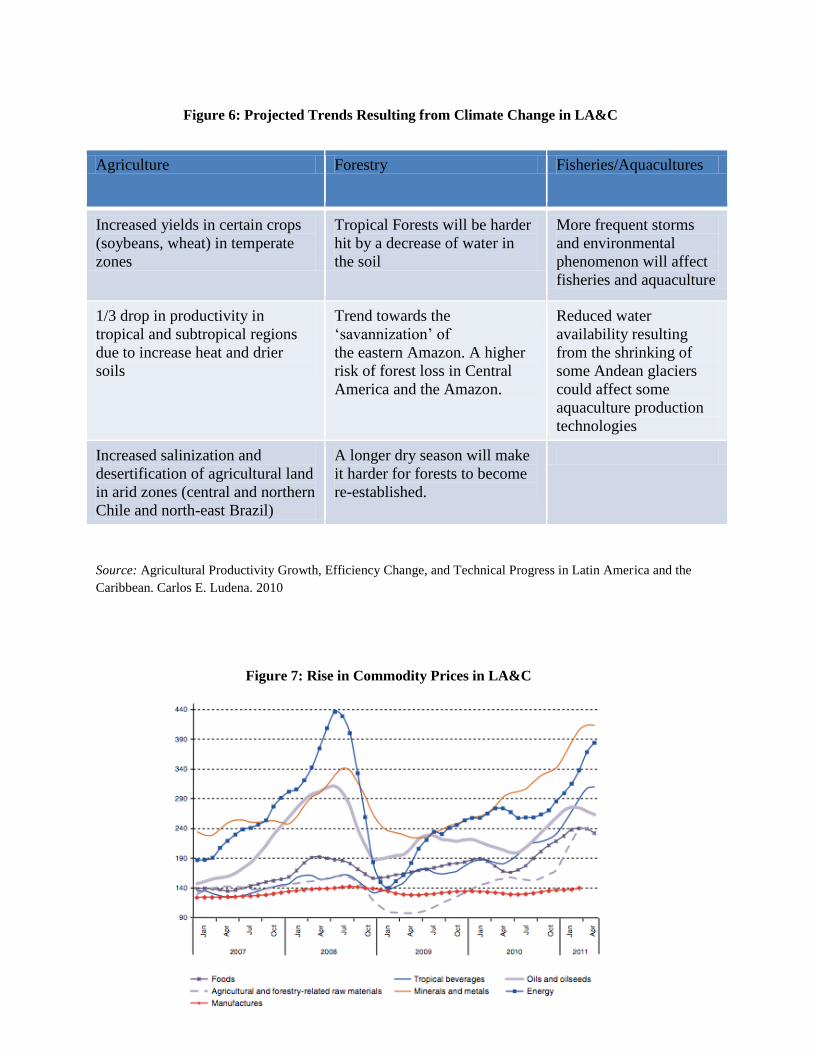
51
Source: Agricultural Productivity Growth, Efficiency Change, and Technical Progress in Latin America and the
Caribbean. Carlos E. Ludena. 2010
Agriculture Forestry Fisheries/Aquacultures
Increased yields in certain crops
(soybeans, wheat) in temperate
zones
Tropical Forests will be harder
hit by a decrease of water in
the soil
More frequent storms
and environmental
phenomenon will affect
fisheries and aquaculture
1/3 drop in productivity in
tropical and subtropical regions
due to increase heat and drier
soils
Trend towards the
„savannization‟ of
the eastern Amazon. A higher
risk of forest loss in Central
America and the Amazon.
Reduced water
availability resulting
from the shrinking of
some Andean glaciers
could affect some
aquaculture production
technologies
Increased salinization and
desertification of agricultural land
in arid zones (central and northern
Chile and north-east Brazil)
A longer dry season will make
it harder for forests to become
re-established.
Figure 6: Projected Trends Resulting from Climate Change in LA&C
Figure 7: Rise in Commodity Prices in LA&C
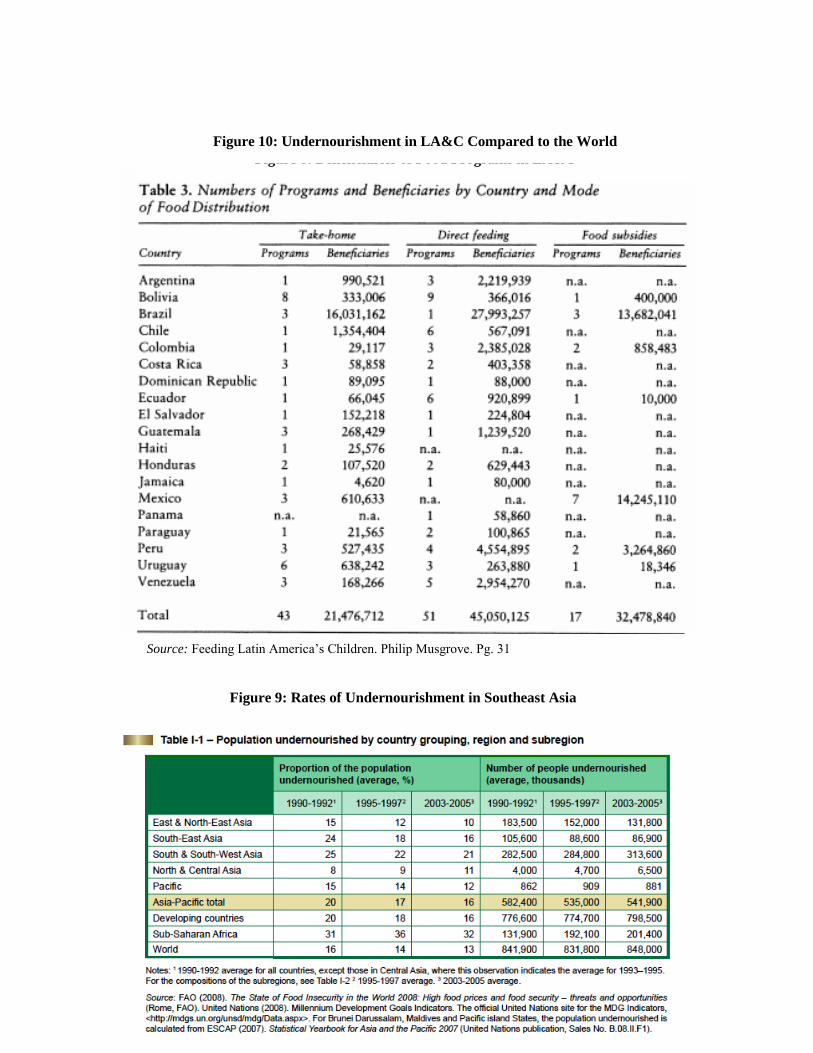
52
Source: Economic Commission for Latin America and the Caribbean (ECLAC)
Figure 8: Beneficiaries of Food Programs in LA&C
Source: Feeding Latin America‟s Children. Philip Musgrove. Pg. 31
Figure 10: Undernourishment in LA&C Compared to the World
Figure 9: Rates of Undernourishment in Southeast Asia

53
Figure 10: Undernourishment in LA&C Compared to the World
Source: Food and Agriculture Organization of the United Nations (FAO), Panorama of Food and
Nutrition Security in Latin America, 2010, Santiago, Chile, 2010
Figure 11: Factors that Attribute to Undernutrition
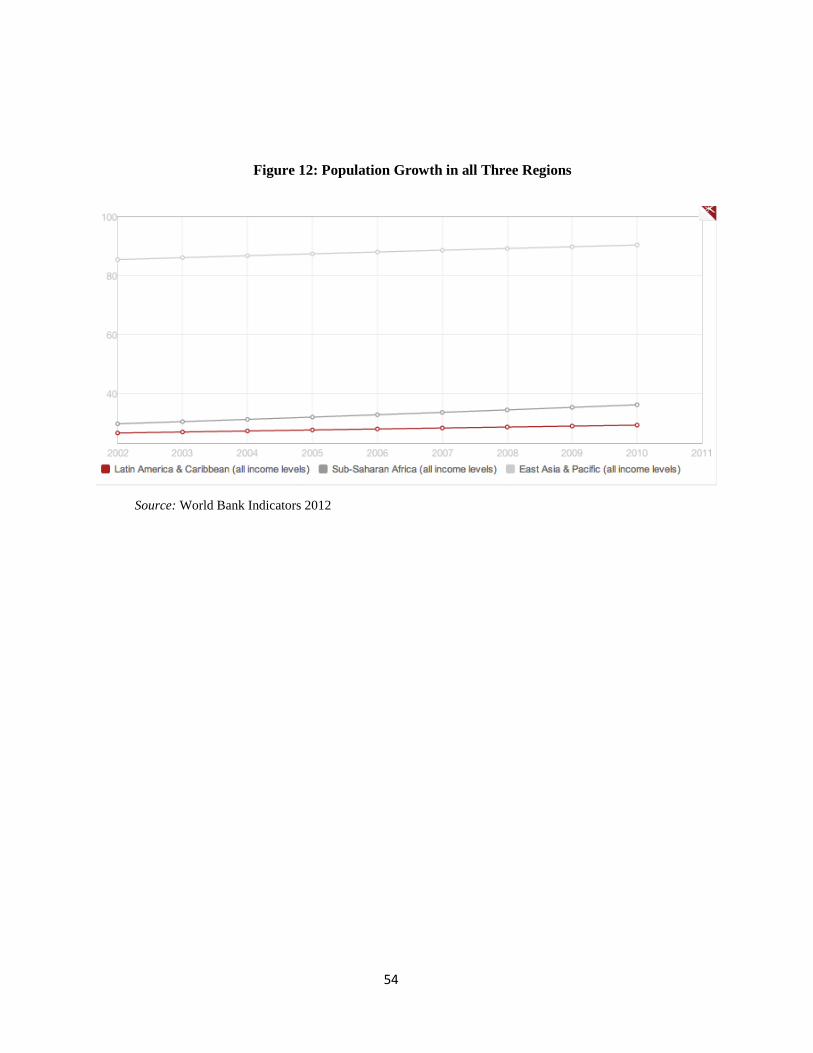
54
Figure 12: Population Growth in all Three Regions
Source: World Bank Indicators 2012

55
3 Economic Development as a Means to Poverty Reduction in
Uganda: Binding Constraints and Agriculture as a Key Sector for
Growth
Conor Murphy, Jason Sparrow, and Michael Tomalty
Introduction
Since President Yoweri Museveni‟s election in 1986 Uganda has experienced substantial
economic growth as well as increased political and social stability. However, while overall
average growth rates have been impressive, there remains a plethora of constraints hindering the
full capacity of the Ugandan economy. Constraints such as poor infrastructure, a faulty political
process, widespread institutional corruption, and an inefficient agricultural sector have all been
identified as imperative to the future of Uganda and its economy. International organizations
working in conjunction with the Ugandan government have developed a number of important
poverty reduction strategy plans in order to foster better economic growth. The most notable of
these are the NDP (National Development Plan), the PMA (Plan for Modernization of
Agriculture) and the PEAP (Poverty Eradication Plan). These poverty reduction strategy plans
have all been created within the context of a nation attempting to move from a peasant to a
modern and prosperous country within 30 years. By targeting sectoral growth, employment,
socio-economic transformation and improvements in human development indices such as
employment, GDP per capita, income level, and gender equality, it is believed that Uganda‟s
competitiveness and goal to graduate to the middle-income segment in the future will be
possible. While economic growth has positive effects for all, the focus of the overall economic
growth strategy in Uganda largely focuses on its poor. With 86% of the nation living in poor
rural areas, it is the consensus belief among economists and government officials that poverty is
best addressed through the Agricultural sector. The PMA, created in 2000, aims to improve
agricultural productivity and alleviate poverty through modernization and commercialization.
Agriculture as a sector faces a number of challenges, with an inefficient financial sector,
technological gaps, lack of institutional cohesiveness and poor supply chain communication, it
will be essential for the government, private sector and civic organizations to work effectively
together in order to implement the proposals of the PMA and other poverty reduction strategy
plans.
56
Constraints to General Development
There are several key constraints to general development of the Ugandan economy, which the
Ugandan government, the IMF, and other involved parties (through the NDP) have identified,
and that require immediate attention. Though development in Uganda remains a vastly complex
subject, it is evident that alleviating these constraints will lead to significant improvement of the
working and living conditions of the country, and contribute heavily to poverty reduction. These
constraints are also very interconnected, which suggests that the unlocking of a single constraint
will have positive effects on others. For example, improvement in the financial sector may lead
to greater private sector investment in physical infrastructure, and may reduce the costs of
critical inputs such as cement, steel, and fertilizer.
The first constraint is weak public sector management and administration. Problems such
as: weak policy, underdeveloped legal and regulatory frameworks, underdeveloped institutional
structures and systems, weak civil society and civic participation, inadequate data, and poor
information collection, have been used to explain the past inefficiencies of the public sector. In
fact, over 70% of government sectors are currently using obsolete, non-existent, or weak policy
frameworks (IMF, 2010). For example: inappropriate organizational structures and systems,
understaffing, limited strategic oversight, and duplication of roles, have been used to account for
the absorption of public funds and the ineffective delivery of public services.
Despite past efforts to limit corruption within the Ugandan public sector, the problem is
far from solved. Corruption negatively affects public service delivery in many areas, particularly
in the administration of public expenditure and the management of government revenue. As it
stands, the citizenry does not yet hold the power to engage in negotiations or demands for better
public services. Economic development will be a key condition for the social and political
empowerment of the Ugandan people. Uganda also compares poorly on an international scale in
terms of corruption: it has been ranked 130 out of 180 countries on Transparency International‟s
Corruption Perception Indices for 2008/09 (IMF, 2010). In 2009, Uganda scored 2.5 out of 6 on
the World Bank‟s CPIA transparency, accountability, and corruption in the public sector rating
(1=low to 6=high) (World Bank Indicators, 2009).
57
The second major constraint to development is inadequate access to financial services.
The lack of availability of funds within the private sector makes it difficult for individuals to start
businesses, invest in education, acquire farming equipment, et cetera. The private banking
system does not penetrate very deeply into the population. Only 16% of Ugandans have bank
accounts, of which the majority resides in urban areas (IMF, 2010). The capital and money
markets are severely underdeveloped: few financial instruments are available, and the framework
for the issuance of bonds is inadequate. Additionally, the nominal interest rates (for borrowing)
are very high: between 17% and 23% per annum (IMF, 2010). This discourages investment and
makes borrowing particularly burdensome. The interest rates in the microfinance sector are even
higher, ranging from 24% to 36%. As a result, few people make use of microfinance institutions:
8 per 1000 adults (World Bank Indicators, 2010). The low savings culture of the country and the
lack of proper financing makes raising domestic capital for investment expensive and risky. It
will be important in the future for the government and financial institutions to target lower
interest rates in order to promote savings for individuals, especially in rural areas.
The third major constraint is the inadequate quantity and quality of human resources.
Uganda possesses a very fast-growing, and young labour force. Proper training and education for
these people has been identified as crucial for the organizational success of the nation. Despite
government efforts to provide training at various levels, large deficits of skilled human labour
and capital currently exist. This is demonstrated by: wide wage differentials, and a large number
of empty posts in technical areas. The quality of primary and secondary education is also an
issue; low completion rates are typical for these institutions.
The current vocational and technical training institutions in Uganda have very limited capacity.
With few people getting into these higher education programs, it will be difficult for technology-
dependent sectors of the economy to move foreword (for example: telecommunications). „Brain
drain‟ (a phenomenon where the smarter and more educated people in a country tend to leave) is
very common in Uganda, as there is often inadequate incentive for the educated to remain in the
country. The health sector also suffers from a lack of human capital. In 2010, the ratio of doctors
to patients was 1: 24, 725, and the ratio of nurses to patients was 1: 1634 (IMF, 2010).
The fourth major constraint is inadequate physical infrastructure. The movement of final
goods and services in Uganda is both logistically difficult, and expensive. This in turn constrains

58
production within many sectors of the economy. The most common method of moving cargo
freight is by road, which accounts for 96.4% of the total. However, only 4% of the roads in
Uganda are actually paved (IMF, 2010). The rail system (which is about 3 times cheaper than
road for shipping) accounts for just 3.5% of the total cargo freight and only 26% of the existing
railway is currently operational. It will be very important in the future for the government to
improve this railroad system in order to foster trade and growth. Moreover, a high export tax,
between 25% and 50%, accounts for another significant barrier to shipping goods out of the
country (IMF, 2010).
There is very limited electrical infrastructure in Uganda. A poor distribution system is
used, and the country has very weak generation capacity. As a result, only 11% of the population
has access to electricity (IMF, 2010).
Uganda‟s communication infrastructure has improved significantly in recent decades
since the liberalization of the sector, and the hefty private investment that followed. However,
the medium is still constrained by the high costs of access/usage, limited coverage, and limited
diversity of mediums (IMF, 2010).
The consumptive use of water in Uganda is much lower than the world average. In
Uganda, the average person will consume 21 cubic meters of water per year. This is compared
with 599 cubic meters per year for the average person on earth. Lack of water is very
problematic in agriculture, as irrigation, and thereby crop yield are negatively affected. Many
industrial processes are also limited because of the limited water supply. In terms of personal
usage, 63% of the rural population and 72% of the urban population has access to safe water for
domestic needs. This means that approximately 30% of the population has no access to a safe
water source (IMF, 2010).
The fifth major constraint to development is gender issues, negative attitudes, mind-set, cultural
practices and perceptions. Currently, women are often left out of important political, social, and
economic decisions within the household and wider society. Furthermore, as a result of cultural
mindset over time, many women‟s rights are not protected under the law.
The sixth major constraint to development is the low application of services, technology,
and innovation. Uganda is known for poor quality products and service delivery. The percentage

59
of manufactured to primary goods for export was 4.2% of the total in 2008/09 (IMF, 2010).
Encouraging high value exports is high on the government‟s list of priorities.
A lack of research and development has also held back the Ugandan economy.
Approximately 1 in 1000 Ugandans are research and development personnel; this is compared
with about 5-18 per 1000 in OECD countries. Additionally, on average only 3 patents per year
are issued in Uganda. This is partly due to an underdeveloped legal system, and partly due to
underinvestment. In 2005/06, 0.3% of Uganda‟s GDP was designated towards research and
development. The Ugandan government and the IMF have identified that funding for this crucial
area must increase in the future (IMF, 2010).
The final key constraint to development is the inadequate supply and limited access to
critical inputs. These inputs include raw materials such as: fertilizers, water, human and financial
resources, and physical capital. Fertilizer use in Uganda has recently increased from 0.37Kg per
hectare in 2000 to 1 Kg per hectare. However this is quite small compared with neighboring
countries: in Tanzania 6 Kg per hectare is used, 16kg per hectare in Malawi, and 31.3Kg per
hectare in Kenya. This is largely due to the high and volatile cost of fertilizer in Uganda. In
January 2007 fertilizer was 252$ (USD) per metric ton, whereas in January 2008 it cost 752$ per
ton (IMF, 2010).
Lack of irrigation is a further constraint on agricultural output. In Uganda, 14, 418
hectares are currently irrigated. However, 400, 000 hectares in the country have the potential for
irrigation, this translates into 3.6% exploitation. Securing further sources of water is critical for
Uganda‟s agricultural industry. Substantially increased irrigation is also a direct way to alleviate
the poverty of the numerous subsistence farmers in Uganda (IMF, 2010).
The lack of physical infrastructure can be partially attributed to the lack of critical inputs.
The price of cement in Uganda is 15$/Kg (USD), compared to 3$ in Malaysia, and 10$ in Kenya.
Additionally, Uganda‟s steel production only meets 9% of the countries demand for steel.
Uganda has 4 steel mills, which produce an average of 7000 metric tons of steel per year, using
scrap metal as their primary input. The national demand for steel is on average, 60,000 to 80,000
metric tons per year. By comparison, Kenya produced 220, 000 tons in 2003 (IMF, 2010).
60
With the above constraints in mind, the Ugandan government, working in conjunction
with the International Monetary Fund, through the National Development Plan (NDP), has
outlined several strategic goals and interventions for the future. The vision of the NDP is “A
transformed Ugandan society from a peasant to a modern and prosperous country within 30
years.” The report identifies 8 strategic goals for the country: 1). Increased household income
and equity (specifically gender equity). 2). Improved availability and quality of employment. 3).
Improved amount and quality of economic infrastructure. 4). Increased access to quality social
services. 5). More science, technology, and innovation promoted to enhance domestic and
international competition. 6). Improved education, training and other human capital
development. 7). Strengthening the country‟s defense and security, while providing good
governance. 8). Promoting a sustainable population, and sustainable usage of the environment
and natural resources (IMF, 2010).
In terms of pursuing the above goals, a quasi-market approach is recommended. By this
methodology, the private sector is expected to remain the primary instrument of development
and growth. The government is to play a facilitating role through the implementation of a
conductive policy. In other words, the government is expected to provide smooth regulatory and
institutional frameworks for the private sector to operate within. Other roles of the government
include: pursuing productive private-public relationships, encouraging foreign investment
through outward-directed policies, encouraging high-value exports, as well as sound
macroeconomic policy and management (e.g. monetary and fiscal policy). It is further
recommended that a „business approach‟ mentality be adopted for the country: both the public
and private sectors should view Uganda as a business in which they share ownership, and
therefore stewardship (IMF, 2010).
Many of the Uganda‟s binding constraints to development can be unlocked by improving
the country‟s financial sector. The government has identified such goals as: a low inflation rate, a
competitive exchange rate, and continued strict regulation of the financial sector. Additionally, it
has been proposed that increasing innovation and product development as to put more financial
instruments on the market, will greatly improve Uganda‟s underdeveloped money markets. The
capital markets are also in need of innovation, as well as a better framework for the issuance of
bonds (e.g. infrastructure bonds). The liberalization of pension plans, and related retirement
61
benefits, will likely increase Uganda‟s investor base. This will also encourage retail investment,
and promote collective investment schemes such as mutual funds. The bottom line is that
development Uganda requires a significant increase in total investment.
Another goal of the financial sector is to increase intermediation in a manner that will reduce the
interest rate spread (reflecting a generally lower risk for investors). The microfinance sector is
also in need of improvement as it is of direct relevance to poverty alleviation in both rural and
urban areas. The government‟s goal in this regard is to support existing establishments by
strengthening, expanding, and consolidating microfinance institutions.
Agriculture as a Strategic Sector
Agriculture plays a very unique and important role in the Ugandan economy. While it represents
approximately 23.5% of GDP, it employs nearly 73% of the population (UBOS, 2005). Not only
does it provide significant labour opportunities, but also, it is a major contributor in the broader
macro economy. Agriculture represents 47% of total exports, which has made it instrumental in
helping improve Uganda‟s balance of payments as well as maintaining the value of the Ugandan
shilling. Agriculture also plays a vital role in the Ugandan economy as a feeder sector; its
prosperity helps maintain growth in the manufacturing and services sector (UBOS, 2008).
Because of agriculture‟s strategic importance to the broader Ugandan economy, and the
significant majority of individuals living within rural agricultural areas (86% of the population),
continued growth and increased investment in the sector is imperative to future poverty reduction
initiatives. If the current growth rate of 2.8% for the sector is maintained, it is predicted that by
2015, the poverty rate will be reduced to 26.5% by the year 2015 (Benin et al, 2007).
Alternatively, if there is increased financial and infrastructural investment in the sector, it is
believed that growth could reach an average of 5.9% and reduce poverty by an additional 8.6%,
which would reduce the overall number of individuals living in poverty to approximately 6.9%
(Benin et al, 2007).
While a vast majority of rural Ugandans live off of subsistence farming, there still remain
significant issues in regards to food security. The country‟s average caloric intake per person per
day improved from 1,494 in 1992 to 2,193 in 1999 but declined to 2,066 in 2002 and to 1,971 in
2005. Although the decline is marginal, the average intake is still less than the World Health

62
Organization (WHO) recommended daily intake of 2,300 per adult per day (UBOS 2008).
Governments and civic organizations have been promoting the growth of local markets and co-
operative farming operations instead of the subsistence model which often leaves individual
farmers and their families heavily exposed to weather and other uncontrollable economic
conditions.
Analysis of Ugandan crop production statistics has revealed a mixed picture in terms of
overall agricultural growth. While some crop sub sectors have expanded and increased yields,
many have decreased in terms of production capacity. Successful crops cite land saving
technologies such as seeds, fertilizers and better agronomic practices as their reasons for success.
Those with poorer growth or declining output have identified weather changes, crop pests, poor
soil management, disease epidemics and global commodity price changes as reasons for failure.
Although agriculture will remain somewhat exposed to various unavoidable natural variables, it
is apparent that increased investment in land saving technologies and cooperative land usage can
help hedge against future risks (MAAIF, 2008).
Livestock inventories have significantly grown over the last decade. This can be
attributed largely to the privatization of the Dairy Corporation in 2006. While not a significant
market yet, with proper utilization of new technologies and necessary inputs, there is potential
for a large export market in dairy and meat (MAAIF, 2008).
The PMA
The Plan for Modernization of Agriculture (PMA), introduced in 2000, aims to significantly
reduce poverty through agricultural modernization and commercialization. The creators of the
plan, mostly economists and government officials, believe that poverty reduction in Uganda will
be most effectively addressed by focusing on the transformation of subsistence farming to a
commercial and market based agricultural sector (MAAIF & MFPED, 2000).
The 4 main objectives of the PMA are: (i) increase incomes and improve the quality of
life of poor subsistence farmers through increased agricultural productivity and increased share
of marketed production. (ii) Improve household food security through the market rather than
emphasizing self-sufficiency. (iii) Provide gainful employment through the secondary benefits of
PMA implementation such as agro-processing factories and services. (iv) Promote sustainable
63
use and management of natural resources by developing a land use and management policy and
promotion of environmentally friendly technology (MAAIF & MFPED, 2000). In order to
achieve these objectives, a number of intervention areas were identified, most notably, research
and technology development, agricultural advisory services, rural finance, agro-processing and
marketing, agricultural education, supportive infrastructure, and sustainable natural resource use
and management (MAAIF & MFPED, 2000).
Agriculture: Potential Growth Constraints
Despite significant concentrated and mandated efforts to promote expansion and productivity
growth in the agricultural sector, there remain many significant barriers to growth. While the
PMA provides a solid framework for strategy implementation, communication between the
government and institutions responsible for the delivery or resources and services has been poor.
This has lead to inefficient policy implementation and inadequate improvement of crucial aspects
of the mandated poverty reduction strategy as outlined in the PMA.
Access to capital has been a major issue in recent years. Due to the high administrative
costs of agricultural loans and extremely high interest rates, farmers are unable or uninterested in
applying for financial assistance. This has lead to inadequate levels of capital investment, which
is essential to the commercialization and modernization of the sector (MFPED, 2001).
Lack of human resource capacity is also a major concern. With technical staff in high
demand, low education rates, as well as brain drain have combined to create a damaging shortage
of technically skilled workers. These workers are needed in key agricultural areas such as
research, disease control, extension services and soil science. Disease out breaks in recent years
have contributed to depleted crop stocks in many parts of the nation and killed millions of
valuable livestock. While education and human capital levels will increase with decreased
poverty, education and resource accumulation must be aggressively pursued in Uganda
immediately as a means to bolster current and medium term growth (MAAIF, 2008).
As the population grows, land tenure disputes and decreased access to farmland have
become increasingly detrimental to agricultural growth. Cultural and traditional norms have left
peasant farmers accustomed to inefficient farming practices, while overlapping lands and refusal
to farm cooperatively have significantly hurt current and future hopes for commercialization and
64
modernization in the sector. One of the PMA‟s most imperative and immediately necessary
objectives is to promote food securitization through market exchange rather than subsistence
farming. This goal can only be accomplished by increasing cooperation between local farmers,
and productivity increases created by greater input investment and economies of scale (MAAIF
& MFPED, 2000).
While there are major problems in terms of production efficiency and capacity, there are
also issues with the marketing and transportation of agricultural products once brought to market.
Food safety and quality assurance are often neglected which has hurt Agricultural products in
regional and international export markets. Also, production, processing and marketing are poorly
coordinated. Poor infrastructure and market information leads to most produce being sold in raw
form and processed on a smaller scale. This is highly inefficient and is partially responsible for
high and volatile food prices seen across Uganda (Benin et al, 2007).
Future Strategies
In order to properly address the constraints to Agricultural growth, the Ugandan government
must work effectively with the private sector to implement effective strategies. Enhancing
agricultural production and productivity will require significant investment in R&D, improved
technological inputs, better access for farmers to advisory services and an increased role in
technological development, among others. Issues such as disease and pest concerns remain a
significant issue for farms of all sizes in Uganda. In order to address this there must be visible
improvements in early detection of crop pests, weeds and diseases. Local governments must
improve their ability to deal with all types of disease and pest controls, and definite policies and
regulations must be created in order to keep track of possible outbreaks.
Water supply for agricultural productions is inadequate and must be improved as well. By
rehabilitating government irrigation systems, establishing a water supply monitoring framework
and building capacity in the irrigation subsector, water capacity can be significantly improved
and could contribute extensively to improved agricultural productivity (MAAIF & MFPED
(2000).
Labor saving technologies and mechanisms will also be imperative in increasing
agricultural productivity and promoting poverty reduction. While economies of scale,
65
improvements in agro-processing, and increased mechanization of the agricultural process will
help reduce costs and improve efficiency, these labor saving technologies have much broader
economic implications. Decreased time spent on labor, would enable individuals to spend more
time on education and human capital building (Benin et al 2007). This in turn would pay
dividends to other sectors of the economy and boost overall growth in Uganda.
Inefficiency has plagued the sustainability of Agricultural markets in Uganda. In order to
address this there must be major improvements in value chain linkages. Farmers must have better
and quicker access to market information, agro-processing and value added products must be
promoted as a means to higher incomes and tax regimes must incentivize farming, marketing,
and production (Benin et al, 2007). Ensuring that all aspects of agricultural farming, production
and marketing operate in an informed and cohesive manner is essential to modernization and
commercialization of the agricultural sector.
Finally, creating a competitive business and investment environment will be essential for
Agricultural success. By improving quality assurance, moving towards national regulation,
international food safety standards and creating more homogeneous final products, Ugandan
goods will become more competitive domestically and internationally.
Agriculture is and will remain a key strategic sector in order to improve employment,
reduce poverty, bolster other sectors of the economy and provide consistent export income,
however, longer-term strategies would have large-scale movement of subsistence farmers into
other sectors of the economy. Increases in Agricultural productivity and income should be seen
as a medium term strategy to enable subsistence farmers to have more time to engage in human
capital building and income diversification as a means to modernizing the economy as a whole.
Monitoring and Evaluation
Monitoring and evaluation the progress of poverty eradication strategies for Uganda will be
deeply tied with their success. Strong political will, and commitment to transparency is crucial to
the limitation of public-sector corruption. A central goal of results oriented initiatives, such as
the poverty eradication strategies, is to promote the most promising sectors of a country while
eliminating inefficiencies. Such a system relies on reliable feedback from all sectors of the
country in order to be effective. Currently the feedback and information mechanisms in Uganda
66
are weak, making it difficult to locate any system breakdowns. Therefore, any improvement is
unlikely under the current system. A new Ugandan monitoring system would facilitate
transparency as well as accountability to make identifying sources of breakdowns as specific as
possible (IMF, 2010).
To achieve an outcome worthy of capturing public imagination, the Ugandan government
must develop a currently lacking monitoring and evaluation system to strengthen management of
government activities within ministries and local government. To help aid the system, the
Ugandan government needs to acknowledge accountability within civil society and parliament.
The glaring problem is that both information management and decision making is centered on
the administrative aspects instead of on the outcomes and impacts of goals. Further deficits of the
system include short sighted focus of planning, budget, and incentives on immediate outputs as
opposed to longer term, and often more important outcomes. Improved efficiency would see that
recurrent and development expenditures are reviewed. A more efficient system would focus on
policies, programs, and project efforts. The current monitoring apparatus needs to be diverted
from entrenched government bureaucracy to more outcome-based strategies. Furthermore, public
servants who are burdened with large volumes of paperwork, tend to lack systematic monitoring
systems for evaluating the effectiveness of public service delivery. Another improvement is
possible in the form of comprehensive goals and government wide accountability instead of the
current narrow focus on specific departmental responsibilities. Decentralization continues to be a
concern as there is also a lack of institutional and human resources. Responsibilities are
gradually being decentralized to districts and front line services; however, the bulk of resources
and expenditures still remain with the central government. Further efforts would see alignment of
the Medium Term Expenditure Framework (MTEF) budget format, which would help public
service conditions as well the decentralization efforts. Other obstacles include inspections and
audits where there is public capital involved; however, there is insufficient coordination,
reporting and follow ups. Under the current framework used to apply the poverty action fund,
conditional grants are under strong control. This disables local governments from deciding
specifically what is best for them. Finally, ministerial information systems cannot currently
provide frontline delivery records that are vital to the success of the monitoring and evaluation
objectives (IDA & IMF, 2010).
67
The current Ugandan monitoring and evaluation system evolved from the Poverty
Eradication Action Plan (initiated in 1997). A goal of the PEAP is for sector and management
efforts to be guided by precise medium-term goals and targets. Continuous monitoring of service
delivery will need to be used to establish base-line goals, to target and inform work planning, and
improve budgeting and managerial performance (IDA & IMF, 2010).
Harmonization of reporting needs to be expanded to include a uniform format for project
progress reports, and should include harmonization of reports pertaining to broader sector and
poverty programs. Finalization of the poverty monitoring strategy will include a draft of national
poverty monitoring strategy to close gaps in the existing system (IMF, 2010).
The results oriented management of these poverty reduction strategies will produce
output based budgeting systems that will rely heavily on accountability. Performance contracts
for permanent secretaries and accounting offices will also increase efficiency. Further, adoption
of budget framework papers and ministerial policy statements will mandate sectors to clearly
state objectives, targets, outputs and outcomes. Uganda will also try to establish an early warning
system for potentially problematic areas to improve efficiency. Further, the National Planning
Forum will regularly assess the various poverty reduction strategies performance, making
important interventions when necessary. This forum will be chaired by the Ugandan president
and will be assisted by ministries, private sector level management, development partners, as
well as local and community level governments (IMF, 2010).
More specific responsibilities lead to higher accountability and efficiency. Resource
mobilization at the ground level will be overseen by the Ministry of Finance, Planning, and
Economic Development. They will also be responsible for the formation of national budgets
which are crucial to controlling the monetary markets. The Ministry of Public Service will
delegate the provision of human labor to certain sectors and intervene when sectors are not
absorbing proper amounts of labor. Further, local governments will be responsible for
monitoring the frontline service delivery and accountability for the results. All sectors will report
quarterly to Office of the Prime Minister on key expenditures, actions, outputs, and progress
towards outcomes. Local government will report quarterly to the Ministry of Financial Planning
and Economic Development, which will result in six month budget performance reports. These
reports will be shared in the National Government performance reports, which come out every
68
six months and will be quality assured by the TICC1 and the cabinet. The performance-based
reports include: Annual national development report, annual strategic development report, annual
fixed performance, and annual state of affairs. These reports will be reviewed by the NPA2,
Office of the Prime Minister, MOFDEP 3, and the Bank of Uganda
4 respectively. An important
mid-term review will provide an in-depth view of progress and will be a pivotal point in the
general process. This review will be conducted two and half years into the implementation being
led by the National Planning Authority and will measure intended objectives against key outputs.
The final evaluation of the NDP will assess overall performance and provide insight into how the
next NDP initiative should be conducted. This will take place four and half years in, and will be
provided by the Office of the Prime Minister (IMF, 2010).
Conclusion
Development and poverty in Uganda are multifaceted social and economic problems; they are
currently being combated in a variety of ways operating within the context of the poverty
reduction strategy papers. The focus of these medium term strategies is mostly focused on
infrastructural development, improved institutional cohesiveness, financial sector reform and
agricultural investment. By addressing these binding constraints Uganda has and will continue to
improve the fundamentals of its economy and in doing so reduce poverty and increase the
incomes of its citizens. It will be particularly important to effectively monitor the implementation
of these poverty reduction strategies in order to gain new insights and ensure that the future
course of action is based on tangible results. While achieving middle-income status will be
difficult for Uganda, current initiatives have provided a solid foundation for short and medium
term growth.
References
1 Technical Implementation Coordination Committee
2 National Planning Authority
3 Ministry of Finance, Development, and Economic Planning
4 The BoU is Uganda‟s central bank
69
Benin, et al., December 2007. “Draft Report on Agricultural Growth and Investment
Options for Poverty Reduction in Uganda”
IDA & IMF (2010), Uganda National Development Plan advisory note, International
Development Association and International Monetary Fund.
Gapminder. (2012). http://www.gapminder.org/world/ In Gapminder World. Retrieved Apil
4th, 2012.
International Monetary Fund (2010), National Development Plan, IMF Country Report
No.10/141
Ministry of Agriculture Animal Industry and Fisheries, 2008. “Development Strategy and
Investment Plan (DSIP) 2009/10-2015/16”
MAAIF & MFPED (2000). Plan for modernization of agriculture: Eradicating poverty in
Uganda. Ministry of Agriculture, Animal Industry and Fisheries and Ministry of
Finance,
Planning and Economic Development, Kampala
Uganda Bureau of Statistics, 2005. “Statistical Abstracts”
World Bank. (2012). http://data.worldbank.org/indicator. In World Bank Indicators.
Retrieved Apil 4th, 2012.
70
4 Post War Redevelopment of Sierra Leone
Brianne Knox, Nathan Stewart, and Jake Ilnicki
Introduction
Sierra Leone presents a particularly interesting case study of development due to the recent civil
war and the vast natural resources contained within the nation. Although it has been ten years
since the violence has ended, Sierra Leone is experiencing ongoing issues that impede
development and redevelopment. These issues are compounded by demographic complexities
that include ethno-regionalism, population instability due to refugees from other nations and
those returning from exile, and the substantial number of unemployed and disenfranchised
youths. Economic instability is magnified through the extensive reliance on the informal
economy, stripping the government of the potential for funding through taxation and
limiting the ability to supply needed infrastructure. Sierra Leone relies heavily on natural
resources for economic production on a global scale, while this can temporarily increase
economic benefit the outcome is short lived, can be environmentally damaging, is often
controlled by foreign entities, and can lead to conflict as seen in the civil war. While there
was an influx of foreign aid immediately after the cessation of violence this funding has become
more limited throughout the years. Although the government provides some modest social
services they are insufficient and the focus remains with a detrimental emphasis and reliance on
foreign aid programs. Statistical data from reports like the Human Development Index
illustrate that minimal progress is currently being obtained. In order to maintain and continue this
progress Sierra Leone‟s government must encourage economic development and formalization
of the economy. Through these means it would be possible to accumulate the wealth needed for
development and thus continue the cycle of poverty escape.
History of Civil War of Sierra Leone
The civil war in Sierra Leone started on March 23, 1991 when the Revolutionary United Front
(RUF), with support from the special forces of Charles Taylor‟s National Patriotic Front of
Liberia (NPFL) entered Sierra Leone in attempt to overthrow the Joseph Momoh government
and take the diamond fields for themselves. This civil war would last eleven years and would
envelope the country while killing more than 50,000 people.
71
In the first year of the war the RUF took control of the east and south parts of Sierra
Leone which was the richest part of the country for harvesting diamonds. The lack of
government interest to respond to the threat of the RUF lead to a coup d‟état in 1992 by the
National Provisional Ruling Council. By the end of 1993 Sierra Leone‟s army succeeded in
pushing the RUF and the NPFL rebels back to the Liberian borders. Shortly after this the RUF
recovered from the onslaught and the fighting continued.
In 1996 Sierra Leone installed an elected civilian government. This government forced
the RUF to sign the Abidjan Peace Accord and under UN pressure this government terminated
its contract with a South African private military group before the accord could be finished. The
RUG saw this and resumed hostiles since they did not have to fight the private military group.
In 1997 some disgruntled members of the Sierra Leone army staged a coup d‟état and
established the Armed Forces Revolutionary Council (AFRC). The RUF joined the AFRC to
capture Freetown the capital of Sierra Leone and put leader Johnny Paul Koroma in charge of the
country. Koroma declared the war over and this was followed by looting, rape, and murder
which lead to many people fleeing the country.
In 1999 the Lome Peace Accord was signed giving Foday Sunkuh, commander of the
RUF, the vice presidency and the control of Sierra Leone‟s diamond mines. In return the RUF
would stop the fighting and the deployment of UN peacekeeping force would head into the
country to support this accord. The only problem was that the RUF compliance was sluggish
again and in May, two thousand rebels advanced on Freetown. The British intervened to stop the
force approaching Freetown. They also went to Sierra Leone to save the failing UN mission and
the weak government of President Ahmand Tejan Kabbah.
The war finally ended when the help from the UN mandate and the Guinean Air Force
joined with the British forces in the British operation Palliser. This operation would finally put a
stop to the RUF and in 2002 President Kabbah declared the Sierra Leone civil war over.
Demographic Overview
Sierra Leone continues to experience issues related to population fluctuations and the refugee
situation stemming from the civil war. The country currently has a population of 5 485 998 and
as illustrated by graph, post civil war population recovery is currently taking place.
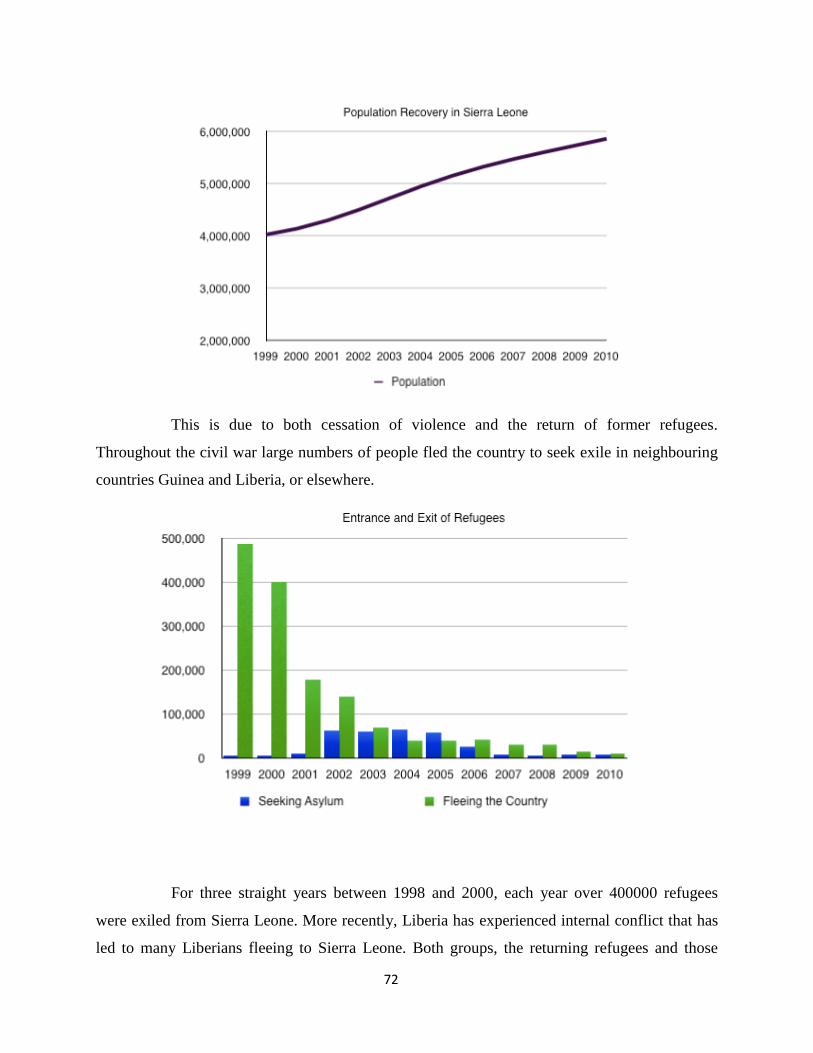
72
This is due to both cessation of violence and the return of former refugees.
Throughout the civil war large numbers of people fled the country to seek exile in neighbouring
countries Guinea and Liberia, or elsewhere.
For three straight years between 1998 and 2000, each year over 400000 refugees
were exiled from Sierra Leone. More recently, Liberia has experienced internal conflict that has
led to many Liberians fleeing to Sierra Leone. Both groups, the returning refugees and those
73
fleeing conflict elsewhere, have added stress to post-war redevelopment efforts by reviving
concerns about widespread poverty among the displaced, access to health care, and the
availability of employment in an already limited job market.
Current levels of urbanization appear relatively low at 38% (World Bank, 2010),
however the manner in which this urbanization has manifested is problematic. Compounding
refugee displacement issues internal displacement has also deeply impacted societal structure in
Sierra Leone. Driven by poverty, lack of opportunity in rural areas, and the threat posed by civil
war millions of people, both those who had been displaced by violence and those simply seeking
economic opportunity, have converged in the capital, Freetown. This influx in population is
associated with the creation of peripheral slum areas that pose increased health risks, pressures to
government infrastructure and, since they are largely populated by disenfranchised and
unemployed youth, concerns have been raised about the prevalence of criminal activity and the
potential for renewed unrest.
The age structure of Sierra Leone reveals a very high percentage of young people,
with those 0-14 comprising 41.8% of the population (Dumbuya, 2011). The poorest sector of
Sierra Leone‟s population was (and still is) those between the ages of 15-24. This is largely due
to the previously mentioned widespread unemployment among youth; it is estimated that
approximately 70% of young people in Sierra Leone are unemployed (Dumbuya, 2011). The
presence of such high numbers of unemployed youth has the potential to pose serious security
threats. This has been illustrated by the civil war which some feel was caused, in part, due to
youth uprisings. While Richard Fanthorpe and Roy Maconachie discuss this phenomena and
point to the collapse of “public services [that] left many young people unable to complete an
education, find paid work, marry, and set up a family” (Fanthorpe & Maconachie, 2010, p. 252)
as probable causes for the unrest amongst youth they also recognize that in post-civil war Sierra
Leone youth are “leading a [...] resurgence of horizontal and interest-based associational life”
(Fanthorpe & Maconachie, 2010, p. 256). This assertion that youth are a potentially revitalizing
force in the redevelopment efforts highlights the importance of mitigating disenfranchisement
through support and programs.
Another aspect of demographics that is central to both social and economic
representation in Sierra Leone is the prevalence of ethnic division (Dumbuya, 2011). 20 different

74
African ethnic groups reside in the country, but the two major ones are the Temne comprising
35% in the North and the Mende comprising 30% in the South (World Bank, 2010). These
demographies of ethnicity are important in Sierra Leone due to ethno-regional political patterns
that deeply effect the reestablishment of democracy by distorting political representation. This
division between the Temne and the Mende has deep colonial roots and it should be noted that
the politicizing of identities extends into government institutions such as police, military, and
civil service (Dumbuya, 2011). More than simple need for electoral reform is needed in order to
disengage from potentially discriminatory ethnic associations.
While demographics are often thought to simply represent straightforward facts
about a region, it is important to analyze and contextualize the data. In the case of Sierra Leone
this investigation has the potential to uncover some of the underlying causes of past conflict and
point towards possible solutions.
Informal Economy
Activities of economic generation by percentage of Gross Domestic Product (GDP)
in Sierra Leone are divided with services accounting for 30%, industry for 21%, and agriculture
for 49% (World Bank, 2010).
75
Although GDP is an acceptable measure of national economy in most cases, the
informal economy of Sierra Leone skews this data. The International Conference of Labour
Statisticians defines the informal economy as:
“The informal sector is regarded as a group of household enterprises or unincorporated
enterprises owned by households that includes: informal own-account enterprises, which may
employ contributing family workers and employees on an occasional basis ; and enterprises of
informal employers, which employ one or more employees on a continuous basis.” (Employment
Sector International Labour Office, 2002)
An excellent example of this issue is in the agricultural sector. While agriculture is central to
GDP production in Sierra Leone at nearly 50%, economists estimate that the majority of the
agricultural industry transpires in the informal sector. This is a reflection of various
developmental dilemmas including the widespread participation in subsistence farming whereby,
if there is crop surplus it is traded with other subsistence farmers or sold at market. Due to the
diamond boom, many agricultural workers abandoned rice fields for diamond mines, this led to
importation of staple foods and a significant jump in food prices (Dumbuya, 2011) (Fanthorpe &
Maconachie, 2010). Subsequently, many people recognize that due to the expense of food they
may be better off practicing subsistence agriculture. This movement back to farming paired with
increased mechanization is hoped to revitalize Sierra Leone‟s agricultural sector; not only
making it internally viable, but increasing the potential exportation to the international market.
Fanthorpe and Maconachie acknowledge that this “new sense of self reliance” has the potential
to “represent a more durable basis for democratic change” evoking the knowledge that economic
stability begets political stability (Fanthorpe & Maconachie, 2010).
The informal economy in Sierra Leone is estimated to comprise approximately 45
percent of the GDP (Dumbuya, 2011) and The Census of Business Establishments estimates that
two-thirds of businesses are not registered with any government agency. While it is often
essential to survival in impoverished nations, wide-spread participation in Sierra Leone‟s
informal sector can actually continue the cycle of poverty. This is effectuated through loss of
taxation revenue for governments that thus renders infrastructure and programs funding less
feasible. It is also detrimental to foreign investments as the lack of statistically relevant economic
activity may discourage outside investors. While the costs of the informal economy are obvious
on at a national level, the social costs to individuals cannot be overlooked. Informality can lead
76
to job insecurity, lack of access to financing, being barred from participation in government
funded business incentive schemes, and difficulty promoting growth due to the complications of
training and expanding staff.
The process of economic development and growth in Sierra Leone begins with the legitimization
of small businesses.
Where Sierra Leone fits into the global economy?
Sierra Leone is a country that has been troubled by economic problems throughout history and
has had a very difficult time recovering from the civil war and the resulting financial problems.
Sierra Leone is ranked very low in both the world and the Sub-Saharan Africa region by the
Index of Economic Freedom. Sierra Leone‟s Gross Domestic Product (GDP) is also low at 4.7
billion (Index of Economic Freedom, 2012). This initially appears high but in comparison to
developed nations, like Canada whose gross domestic product is 1.3 trillion, the undevelopemen
of Sierra Leone is put into perspective. It has been estimated that the GDP will rise over the next
few years, but only time will tell.
Throughout the world, Sierra Leone is considered to have a very low economic status.
Overall Sierra Leone is ranked 152 out of 179 countries (Index of Economic Freedom, 2012). Of
note is the fact that all the countries in the world are not ranked however Sierra Leone still holds
a very low position on the index. The Index of Economic Freedom has given Sierra Leone an
economic score of 49.1; a score that has fallen by half a point since last year. This is, in part,
caused but the structural and infrastructure problems Sierra Leone is currently facing. The
economic rank is also lower than the global average which has a score of 59.5 (index of
Economic Freedom, 2012). Out of the 46 countries comprising the Sub-Saharan region of Africa
Sierra Leone is ranked at 34 making it obvious that Sierra Leone is having economic troubles
both globally and on a local scale.
In another survey done by International Finance Corporation, Sierra Leone was rated in
eleven different categories. All these categories are designed to measure the ease of doing
business in the respective countries. In this survey 184 countries were ranked and evaluated.
Sierra Leone rated in the bottom bracket of the rankings except a couple of the categories such as
starting a business and protecting investors (Ease of Doing Business in Sierra Leone, 2012). Out
of all the countries rated, Sierra Leone was in the bottom twenty for getting electricity around the
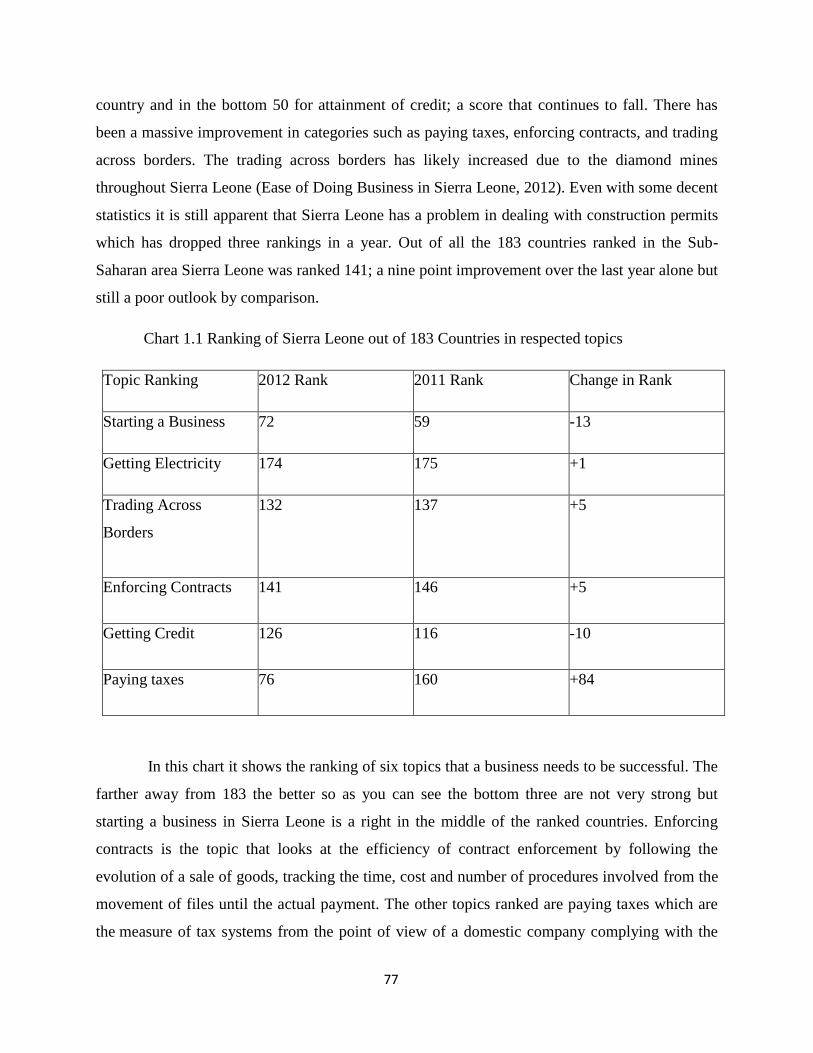
77
country and in the bottom 50 for attainment of credit; a score that continues to fall. There has
been a massive improvement in categories such as paying taxes, enforcing contracts, and trading
across borders. The trading across borders has likely increased due to the diamond mines
throughout Sierra Leone (Ease of Doing Business in Sierra Leone, 2012). Even with some decent
statistics it is still apparent that Sierra Leone has a problem in dealing with construction permits
which has dropped three rankings in a year. Out of all the 183 countries ranked in the Sub-
Saharan area Sierra Leone was ranked 141; a nine point improvement over the last year alone but
still a poor outlook by comparison.
Chart 1.1 Ranking of Sierra Leone out of 183 Countries in respected topics
Topic Ranking 2012 Rank 2011 Rank Change in Rank
Starting a Business 72 59 -13
Getting Electricity 174 175 +1
Trading Across
Borders
132 137 +5
Enforcing Contracts 141 146 +5
Getting Credit 126 116 -10
Paying taxes 76 160 +84
In this chart it shows the ranking of six topics that a business needs to be successful. The
farther away from 183 the better so as you can see the bottom three are not very strong but
starting a business in Sierra Leone is a right in the middle of the ranked countries. Enforcing
contracts is the topic that looks at the efficiency of contract enforcement by following the
evolution of a sale of goods, tracking the time, cost and number of procedures involved from the
movement of files until the actual payment. The other topics ranked are paying taxes which are
the measure of tax systems from the point of view of a domestic company complying with the
78
different tax laws and regulations and getting credit which is the effectiveness of collateral and
bankruptcy laws that facilitate lending.
Throughout the country property ownership rights are highly limited and pervasive
corruption is still a heavy drag on private–sector developments. Sierra Leone is heavily
dependent on their agricultural sector of economy and the dominance of the agricultural
economy leads to a lack of economic dynamism (Ease of Doing Business in Sierra Leone, 2012).
Additionally the infrastructure in Sierra Leone is very poor and impedes the expansion and
diversification of a productive base for Sierra Leone to make future improvements to existing
infrastructure.
Ever since the civil war in Sierra Leone various government financial programs have be
weak. The Gross National Income (GNI) is $340 US which is dreadfully low and renders it
difficult for individuals to attain economic independence (Index of Economic Freedom, 2012).
The poor GNI compounds credit issues; the government lacks capacity to provide sufficient
credit for growing businesses which simply contributes to the cycle of unemployment and
poverty.
Even thought the economy of Sierra Leone looks very bleak at this time there has been
thought that it will improve. The Index of Economic Freedom believes that, within a year, Sierra
Leone‟s economy will rise by 5.2% and in two years rise by 6%. In addition to this Sierra Leone
has invested in improving its legal and physical infrastructure and has also taken steps to
advance the tax administration process and public debt management.
Where natural resources fit into Sierra Leone economy?
Sierra Leone is a country that is surrounded by some of the wettest rain forests in the world and
some of the rich deposits of diamonds, titanium ore, bauxite, iron, ore and chromite (Powlick,
2005). Although it is easy to imagine these resources as a blessing, the reality in Sierra Leone
has been quite opposite. This is particularly relevant in the case of diamond mining in Sierra
Leone, as the diamond boom was a source of the tensions that brought on civil war.
The main resource in Sierra Leone is the alluvial diamonds, and since their discovery in 1932,
the country has shipped out over 32 million carats of these diamonds (Powlick, 2005). It is quite
79
apparent that exportation of diamonds is the main source of economic generation for Sierra
Leone in the global economy. Even though these diamonds are sought by wealthy elite
throughout the world, the diamond mining industries does not offer many jobs. This is because
the diamonds are alluvial, meaning they are dispersed throughout the ground, and this dispersion
renders them easy to find and extract with the use of minimal technology. The most used method
to find these diamonds is simply sifting through dirt from the river bottoms. An individual miner
can unearth several carats in one day‟s works. Due to the ease of labour and minimal technology
involved the wage for this work remains low making it very difficult for diamond miners escape
the cycle of poverty. To add on to this, not all the diamonds that are unearthed can be used for
export, totalling onto the stress of the workers not meeting a minimum wage (Powlick, 2012).
Additionally, most of the money that is earned mining these diamonds is extorted by the middle-
men and paid to large multi-national corporations instead of to the individuals performing the
manual labour (Powlick, 2012). It is impossible to miss the irony that Sierra Leone is one of the
poorest country in the world all while it has a rich set of natural resources and minerals,
including diamonds.
When it comes to the timber, there is no industry because logging in Sierra Leone has
being banned to conserve the forests and to prevent degradation (Kilbery, 2011). If logging did
occur in Sierra Leone it would have substantial and negative impacts on the environment. To
support this thought President Koroma declared that to export timber from Sierra Leone would
be illegal. Unfortunately, even with this law in place there has been many documented times of
people illegally logging (Kilberg, 2011). To export these illegally logged trees one just has to
get the cash to the right people and, like in the past, money is speaking larger than words
(Kilbery, 2011). To make things worse the massive logs that come from the forests of Sierra
Leone are in high demand in China making the illegal trade even more profitable. At the rate that
China wants these logs there is fear conflict may be renewed if the price of timber increases. It is
thought that if this happens timber might become the next “blood resource in Sierra Leone
(Kilbery, 2012). If Sierra Leone could gain and maintain control of the timber resource that is
being illegal exported there is a possibility to produce an industry and create jobs effectively
strengthening the economy.

80
The oil industry in Sierra Leone has been burgeoning since the discovery of oil in West
Africa. Sierra Leone is hopeful that the oil industry could develop their mining and energy
industries after years of conflict that basically destroyed investments from other countries and
left their infrastructure in ruins (The Cocorioko, 2012). The only problem with the oil that has
been discovered are the bureaucratic processes that will delay the extraction and sale of oil by
five to seven years. Even though nobody will see the oil from these new oil patches for some
time, Sierra Leone‟s President believes that this oil will produce on economic boom for his
country and leading them into economic prosperity (The Cocorioko, 2012).
Overall the natural resources for Sierra Leone have being a blessing and a curse for the
country. The Diamonds are some of the best in the world but contributed to the civil war and
continued the war into some of the bloodiest days in Sierra Leone‟s history. The timber in Sierra
Leone is illegal to log but many rebels log it regardless due to the high demand in China and
around the world. This illegal logging has lead to small conflicts with the leaders of Sierra Leone
and some people fear that illegal logging of the timber could lead to timber being the next
“blood” resource in Sierra Leone. When it comes to oil Sierra Leone is doing very well. They
just discovered a new oil patch just off their shores of the country and the President is expecting
an economic boom when their oil industry starts to take off. This will lead to many new jobs for
the people of Sierra Leone. In general Sierra Leone‟s natural resources have lead the country to
being one the poorest in the world but with this new oil they may be capable of overcoming
hardships and perhaps one day the world can look at them as a developed country and not a poor
country that is only good for “blood diamonds”.
Sierra Leone’s Redevelopment In Relation To The HDI
Sierra Leone continues to be afflicted from the past by the catastrophic civil war which was
waged from 1991 to 2002. The war has left its mark by contributing to the deaths of many people
in the country, more than a third of the population has been displaced as a result (Country
profile: Sierra Leone, 2010). The country‟s infrastructure was also decimated by the conflict .
For these reasons and many more Sierra Leone has been placed as one of the lowest ranking
countries in the United Nations Development Programme‟s Human Development Index,
positioned at 180 out of 187 countries and territories (International human development
indicators, 2011).
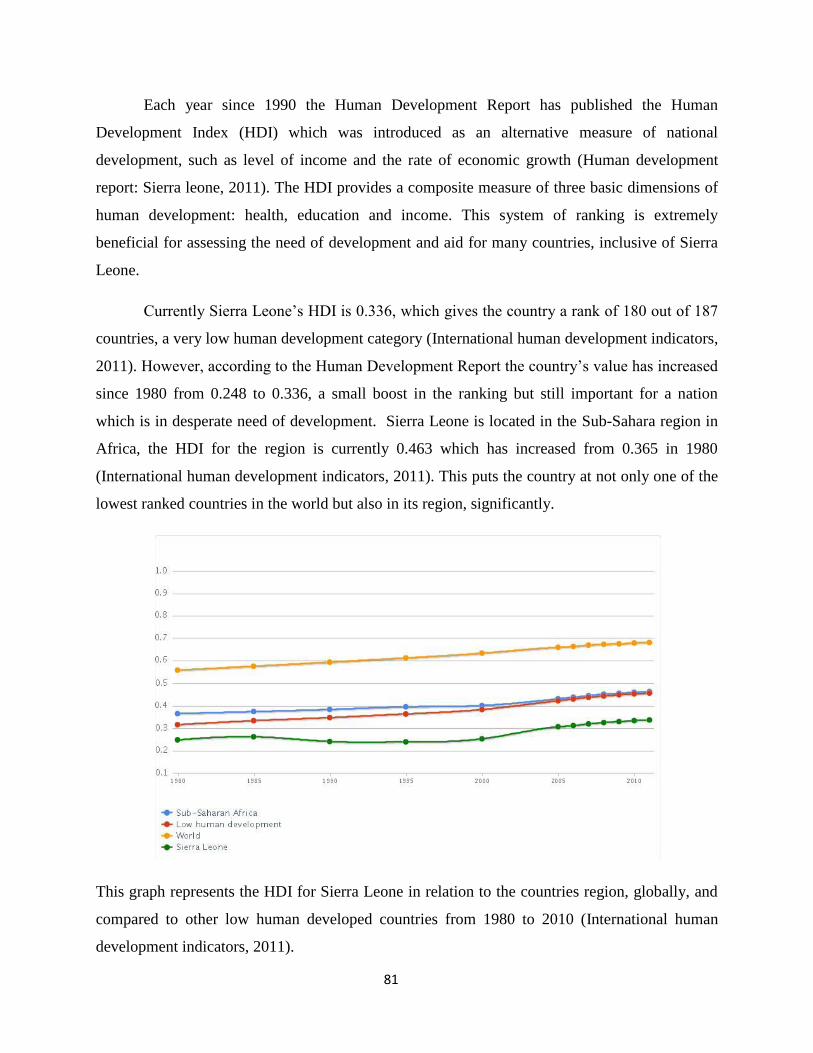
81
Each year since 1990 the Human Development Report has published the Human
Development Index (HDI) which was introduced as an alternative measure of national
development, such as level of income and the rate of economic growth (Human development
report: Sierra leone, 2011). The HDI provides a composite measure of three basic dimensions of
human development: health, education and income. This system of ranking is extremely
beneficial for assessing the need of development and aid for many countries, inclusive of Sierra
Leone.
Currently Sierra Leone‟s HDI is 0.336, which gives the country a rank of 180 out of 187
countries, a very low human development category (International human development indicators,
2011). However, according to the Human Development Report the country‟s value has increased
since 1980 from 0.248 to 0.336, a small boost in the ranking but still important for a nation
which is in desperate need of development. Sierra Leone is located in the Sub-Sahara region in
Africa, the HDI for the region is currently 0.463 which has increased from 0.365 in 1980
(International human development indicators, 2011). This puts the country at not only one of the
lowest ranked countries in the world but also in its region, significantly.
This graph represents the HDI for Sierra Leone in relation to the countries region, globally, and
compared to other low human developed countries from 1980 to 2010 (International human
development indicators, 2011).

82
Certainly Sierra Leone‟s past civil war has affected the country greatly, this outcome can
be seen clearly in the above graph where the time while the civil war was in effect, for just over a
decade, is apparent. This can actually be seen in other forms of data as well, specifically, it is
apparent in the table below.
Table: Sierra Leone‟s HDI trends based on consistent time series data (Human development
report: Sierra Leone, 2011).
The above table reviews Sierra Leone‟s progress in each of the HDI indicators. Between
1980 and 2011, Sierra Leone‟s expected years of schooling increased by 2.5 years, life
expectancy at birth increased by 4.7 years and mean years of schooling increased by 1.9 years.
However, Sierra Leone‟s GNI per capita has decreased by about 2.0% between 1980 and 2011
(Human development report: Sierra leone, 2011).
83
Graph for Sierra Leone‟s current rankings in relation to Health, Education, Income, which in turn
represent the countries HDI (International human development indicators, 2011).
The civil war not only left the physical resources of the country in disrepair but also the
human resources. Before the war, Sierra Leone had quite average standards for a country with
lower development. Although the country was, no-doubt, in need of certain types of development
the situation was not dire. The war quickly changed this. Two-thirds of the population were
illiterate, life expectancy dropped drastically to became one of the worst in the world, and the
country‟s quality of income severely dropped (Human development report: Sierra leone,
2011).The country has been in a slow process of regaining its original standards and surpassing
them; working towards overall betterment and redevelopment for the country. Sierra Leon‟s
redevelopment can be seen within the trends of data in the Human Development Report of the
country‟s HDI. While certain indicators of the country‟s health have been rising slowly, for
example school attendance and life expectancy, every small step aids in the country becoming a
better place to live for the people.
Social Programs
Social assistance programs are a necessity for Sierra Leone. The people are certainly in need for
any help they can receive and though the government attempts to do its part by providing such
programs, the majority is provided by outside agencies such as Non-Government Organizations
(NGOs) and charitable agencies. Social insurance exists within the country for the people
offering them old age, disability, survivor, and even work injury benefits to those that qualify
(Country profile: Sierra Leone, 2010). It is great that the country has these programs, although
the monetary compensation that the people receive is very little.
A great programme that the country offers is Cash for Work, a youth employment
scheme. The programme aims to provide employment to consolidate the peace process (Country
profile: Sierra Leone, 2010). It targets ex-combatants, unemployed youth, returnees and refugees
by offering them work. This work includes cleaning streets, data clerks and even work in
agriculture where they receive payment of Le 150,000 per month (approximately $46 US a
month, or $2 US a day) (Country profile: Sierra Leone, 2010). A great programme to provide
some work but those that work receive little money and the programme lacks a vision for long-
term sustainability as there is no link with long-term skills and poor employment structures.
84
Sierra Leone‟s government also offers a social safety net programme. This provides
support to the poorest among the vulnerable groups, where they are not being reached by existing
interventions (Country profile: Sierra Leone, 2010). Those that can receive the benefits from the
program are those that are either disabled, widows, aged 60 and over, and orphans/separated
children. Other determinations for the programme are that the person qualifying must have
either, no regular means of support, inability to work, aged 60 years and above, or have no
regular income. Those that receive the aid from the programme are given either $10 US per
person, monthly, or food with the worth of $10 US is distributed to those living where markets
may not be available (Country profile: Sierra Leone, 2010). The social safety net programme has
been found to increase enrolment in schools, increase access to medical facilities, reduce the
depth of poverty, as well as ensure food security (Country profile: Sierra Leone, 2010).
Unfortunately, there are concerns that this programme does not directly support economic
activity and that the process of identifying the most vulnerable people is very costly.
There is concern that the people will become too dependent on the government‟s post
conflict assistance programmes, especially those that are simply seen as easy handouts. Such as
the direct cash transfer programme that targets the elderly and most vulnerable who have no
other means of support (Country profile: Sierra Leone, 2010). A simple programme to receive
coverage for, those that do qualify receive Le200, 000 ($62 US) every six months and others can
receive that pay every three months (Country profile: Sierra Leone, 2010). However, there are
those people who will never be able to support themselves and need so-call handouts in order to
develop sustainable livelihoods and survive.
The country itself can only do so much from within the government, for this reason
Sierra Leone relies on much aid from out of country sources. One such out of country aid group
called Restore Hope Sierra Leone. Restore Hope works with the Sierra Leone people through
unified strategies and other international partners to improve infrastructures, social responsibility
and capacity for development (Restore hope, 2011). The group currently has 10 projects active
within the country which all have shown great successes. Restore Hope Sierra Leone has great
initiative and provides great social assistance to help redevelop the country.
Another social program that has had great success in providing Sierra Leone with aid is
the National Social Action Project (NSAP). The NSAP was designed to provide an immediate
85
and tangible response to the gaps in basic service availability, with the priority on the areas and
populations most affected by the war (Sierra leone: National social action project, 2011). NSAP
has achieved great results by helping over 700,000 people gain access to health facilities,
360,000 children to educational facilities, and over 115,000 people to economic infrastructures
such as markets.
Sierra Leone experienced an influx of external subsidies after the civil war, however this
funding is dwindling. In order for the country to continue to develop and maintain what little
social programs they have, the focus on economic growth is essential.
Sierra Leone’s Special Court
The Special Court for Sierra Leone is an independent judicial body set up to "try those who bear
greatest responsibility" for the war crimes and crimes against humanity committed in Sierra
Leone after November 30th
, 1996 during the Sierra Leone Civil War (Kamara, 2009). On January
16th
, 2002, the UN and the Government of Sierra Leone signed an agreement to establish the
court. The first staff members arrived to begin their duties in July 2002. Located in the country‟s
capital, Freetown, the special court has made its mark in redevelopment for Sierra Leone
significantly by putting those held responsible for their crimes within the country to justice.
The Special Court is the first in history to find an accused person guilty of the crime of
conscripting children and forcing them to participate in hostilities (CITE). The court is also the
first in world history where all three accused Revolutionary United Front (RUF) leaders were
convicted for the crime of “forced marriage” as a separate “crime against humanity”, recognizing
the particular suffering inflicted upon women through conscription as “bush wives” during the
conflict in Sierra Leone (Kamara, 2009). The special court has also put those to justice for sexual
slavery and any other form of sexual violence, and for intentionally directing attacks against
Peacekeepers (Kamara, 2009).
Sierra Leone‟s Special Court has put many individuals to justice for their crimes against
humanity including Alex Brima, a member of the AFRC, one of the most notorious and serving
the longest sentence of 50 years imprisonment in Rwanada (Kamara, 2009). Morris Kallon,
Brima Kamara, and ten more individuals have been successfully tried and serving sentences for
war crimes and crimes against humanity. There are currently eight on trial at the Special Court.
86
As Sierra Leone is currently in a redevelopment phase since the tragic rebellion that
caused the civil war, those held responsible need to be convicted for their crimes. It has been a
slow process but extremely necessary for the country to continue on its steps in redevelopment.
Conclusion
Overall Sierra Leone is a country in dire need of redevelopment and support from the global
community. The country is rich in natural resources and provided these resources are well
controlled, Sierra Leone has the potential to derive extensive wealth. The most economically
important, and easily the most famous resource, diamonds, has lead to military conflicts and a
civil war which lasted ten years. People in Sierra Leone believe that the next resource which is
lumber, may one day also lead to bloody fight over the rights to log. This would represent the
worst possible outcome for the country that already has one of the lowest world economy
rankings. Even in Sub – Saharan Africa they are ranked low in many different categories like
getting electricity to the people and producing small businesses. In order to increase their world
ranking in economics, the internal economy must be formalized and the resources which play
such an important role in global exports must be regulated. The current economy in Sierra Leone
relies heavily on informal transactions that do not yield taxable results. In turn, this means that
the government is limited in revenue sources. These limitations lead to a lack of government
supported programs and infrastructure. There is specific data that shows the effect of the civil
war on Sierra Leone, this is particularly apparent in the HDI report. This has been able to give a
statistical point of view for Sierra Leone in relation to its improvement and redevelopment since
the civil war. With what money the government has available, the country is able to provide
some social assistance programs to the people of Sierra Leone. Despite the great intentions of the
programs, they only offer little benefits to the public and there are concerns that they are not
truly supporting the economy but rather simply offering handouts. Although economic realities
are essential to redevelopment, the Special Courts of Sierra Leone have been important step
towards the social aspect of redevelopment. The court has been able to convict those guilty for
war crimes and crimes against humanity during the civil war and making huge progress for the
country in relieving the people of their horrific past.
87
References
African Economic Outlook, (2011). Sierra Leone country summary. Retrieved from
website:http://www.africaneconomicoutlook.org/fileadmin/uploads/aeo/Country_Notes/2
011/Full/Sierra%20Leone.pdf
Country profile: Sierra Leone. (2010). Retrieved from http://epri.org.za/wp-
content/uploads/2011/03/43-SierraLeone.pdf
Denney, L. (2011). Reducing poverty with teargas and batons: The security–development nexus
in Sierra Leone. African Affairs, 110(439), 275-294.
Dumbuya, P. (2011). Post-Conflict Reconstruction, Stabilization, and Nation Building in an
African State: the 2007 presidential and parliamentary elections in Sierra Leone. Journal
Of Third World Studies, 28(2), 143-159.
Ease of Doing Business in Sierra Leone. (2012). Retrieved March 10, 2012, from
www.doingbusiness.org
Employment Sector International Labour Office, (2002). Women and men in the informal
economy: A statistical picture. Retrieved March 27th
2010, from International Labour
Organization website: http://www.ilo.org/dyn/infoecon/docs/441/
F596332090/women%20and%20men%20stat%20picture.pdf
Fanthorpe, R., & Maconachie, R. (2010). Beyond the „Crisis of Youth‟? Mining, farming, and
civil society in post-war Sierra Leone. African Affairs, 109(435), 251-272.
Foreign Investment Advisory Service, (2006). Survey analysis report of sources of
informal economic activity in sierra leone. Retrieved from International Finance
Corporation
website:http://www.ifc.org/ifcext/fias.nsf/AttachmentsByTitle/Sierra+Leone+Informality+
survey/$FILE/Sierra+Leone+Informality+Survey+part+1.pdf
Human development report: Sierra leone. (2011). Retrieved from
http://hdrstats.undp.org/images/explanations/SLE.pdf

88
International Finance Corporation. Sub-saharan africa reports. Retrieved from IFC
website: http://www1.ifc.org/wps/wcm/connect/REGION__EXT_Content/Regions/
Sub-Saharan +Africa/
International human development indicators. (2011). Retrieved from
http://hdrstats.undp.org/en/countries/profiles/SLE.html
Kamara, J. (2009). Preserving the Legacy of the Special Court for Sierra Leone: Challenges and
Lessons Learned in Prosecuting Grave Crimes in Sierra Leone. Leiden Journal of
International Law, 22 , pp 761-777 doi:10.1017/S0922156509990215
Kilberg. K. (2011, December 28). Timber: The Next “Blood” Resource in Sierra Leone. (Web
log post). Said by Red. Message posted to www.saidbyred.com
Powlick, K.M (2005, November). Natural Resources and Conflict: Diamonds in Sierra Leone.
RUF Mining in Yengema. 1-50.
Restore hope . (2011). Retrieved from http://www.restorehopeproject.org/about.html
Statute of the Special Court Sierra Leone. (2007, May 23). Retrieved from http://www.sc-
sl.org/LinkClick.aspx?fileticket=uClnd1MJeEw=&
Sierra Leone: 2012 Index of Economic Freedom (2012). Retrieved March 12, 2012, from
www.hertiage.org/index/country/SierraLeone
Sierra Leone Hopes for Economic Boom, as President Koroma Expresses Delight with Oil Rig
and Drilling of Second Well. (2012, March 28). The Cocorioko, p 1.
Sierra leone: National social action project. (2011). Retrieved from
http://web.worldbank.org/WBSITE/EXTERNAL/COUNTRIES/AFRICAEXT/SIERRALE
ONEEXTN/0,,contentMDK:22702093~menuPK:50003484~pagePK:2865066~piPK:2865
079~theSitePK:367809,00.html
World Bank. Indicators. Retrieved from http://data.worldbank.org/indicator
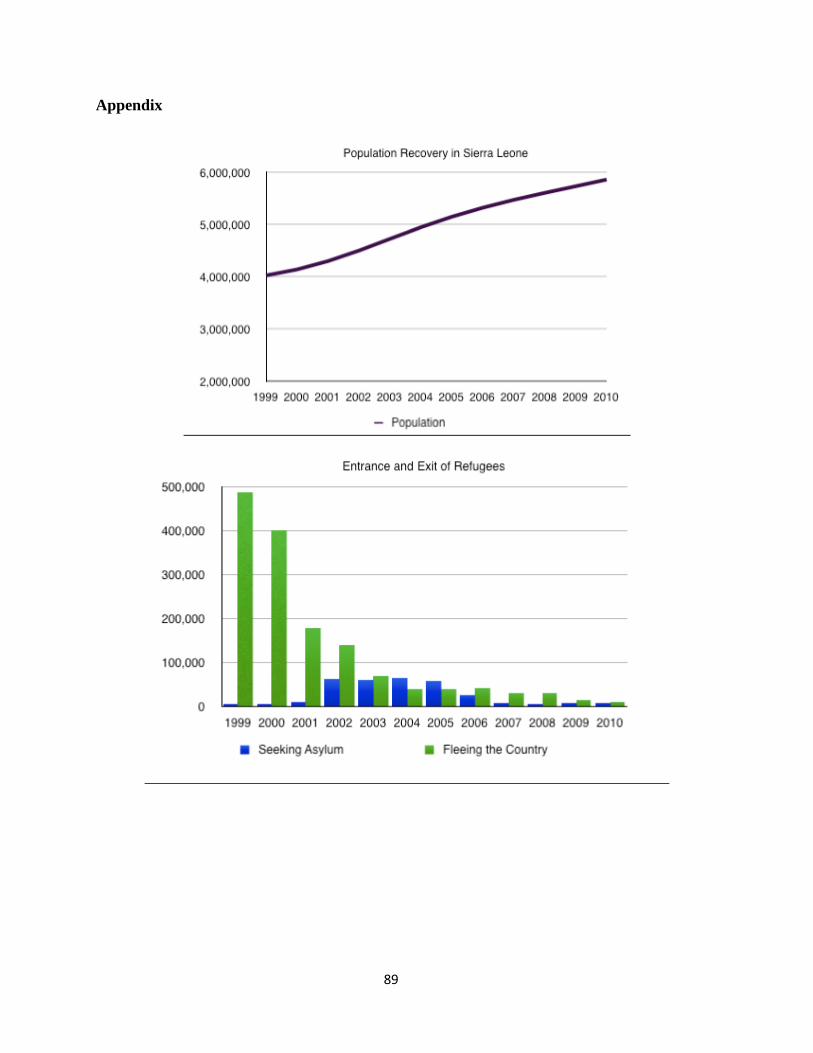
89
Appendix
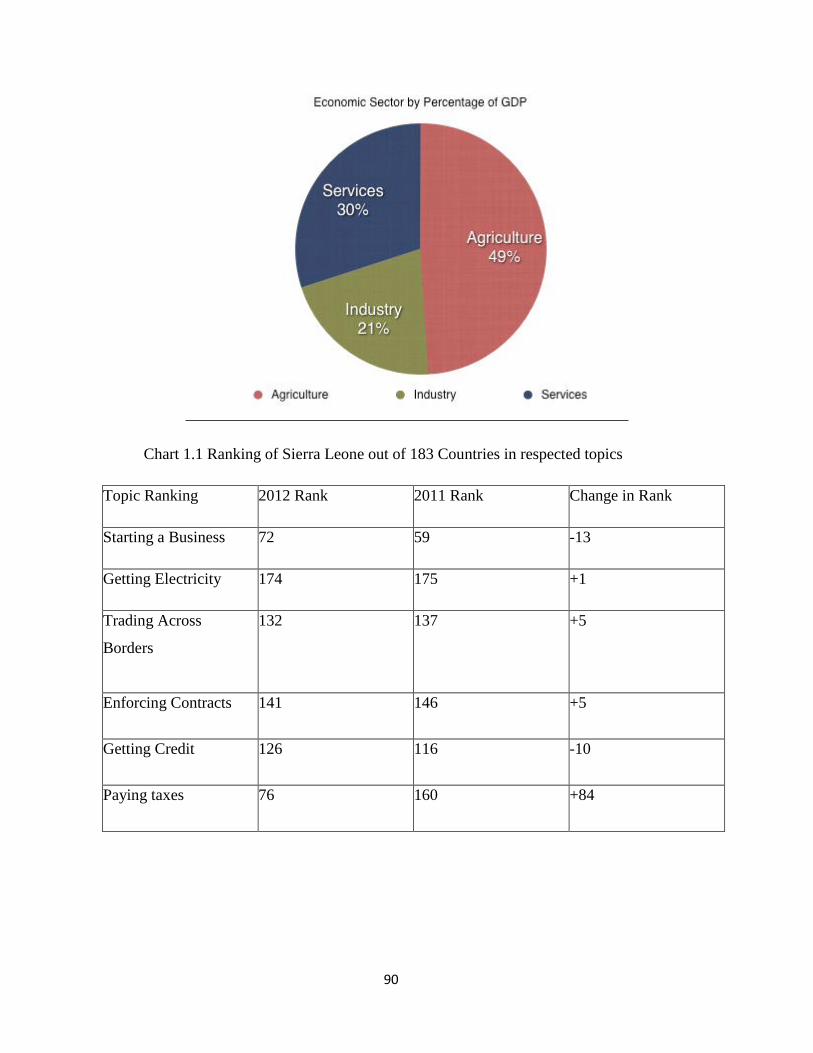
90
Chart 1.1 Ranking of Sierra Leone out of 183 Countries in respected topics
Topic Ranking 2012 Rank 2011 Rank Change in Rank
Starting a Business 72 59 -13
Getting Electricity 174 175 +1
Trading Across
Borders
132 137 +5
Enforcing Contracts 141 146 +5
Getting Credit 126 116 -10
Paying taxes 76 160 +84
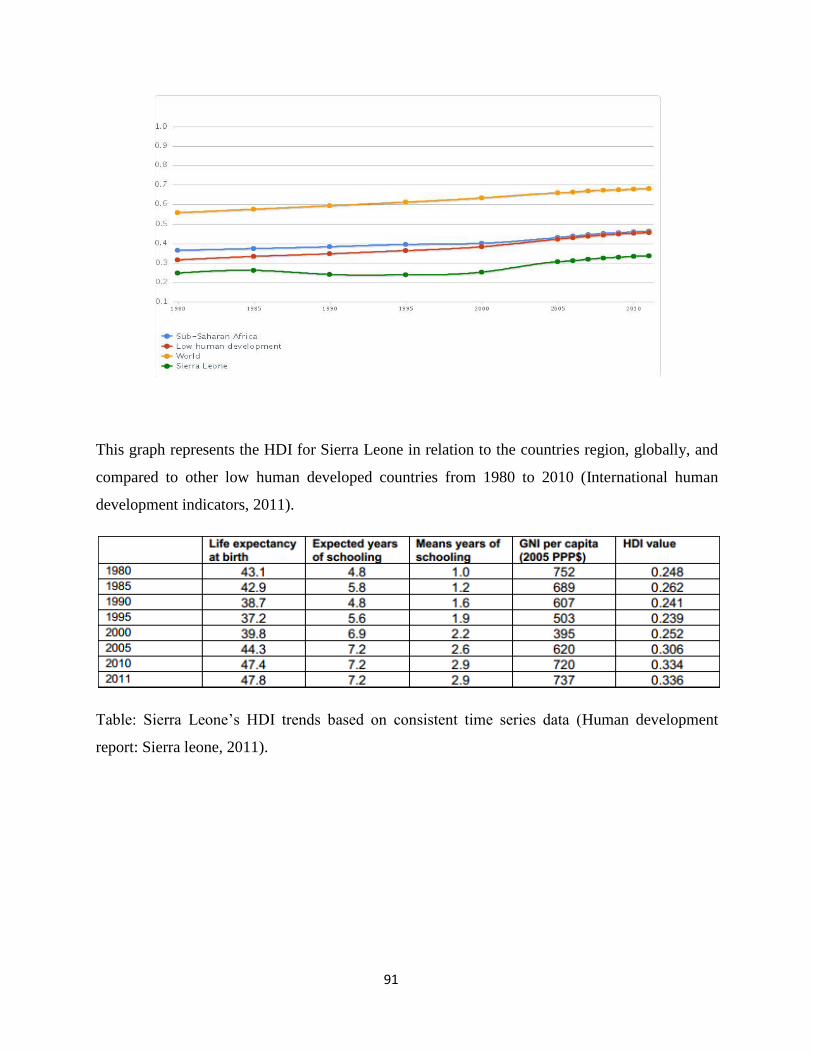
91
This graph represents the HDI for Sierra Leone in relation to the countries region, globally, and
compared to other low human developed countries from 1980 to 2010 (International human
development indicators, 2011).
Table: Sierra Leone‟s HDI trends based on consistent time series data (Human development
report: Sierra leone, 2011).
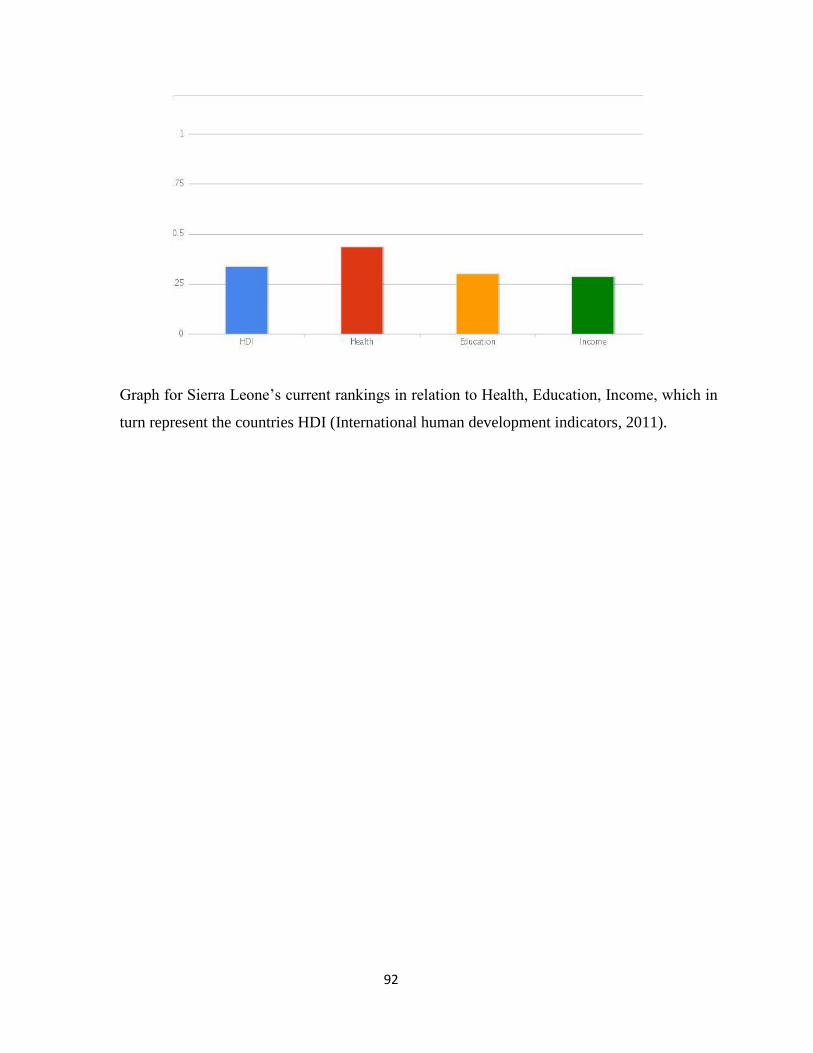
92
Graph for Sierra Leone‟s current rankings in relation to Health, Education, Income, which in
turn represent the countries HDI (International human development indicators, 2011).
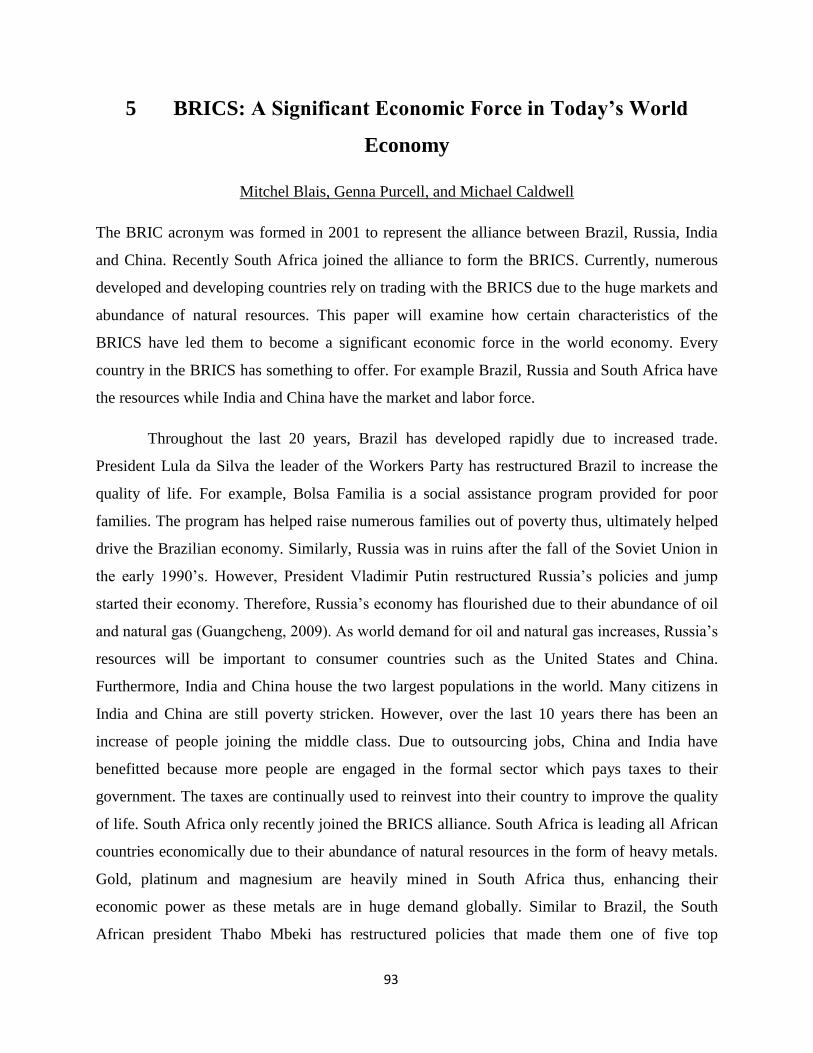
93
5 BRICS: A Significant Economic Force in Today’s World
Economy
Mitchel Blais, Genna Purcell, and Michael Caldwell
The BRIC acronym was formed in 2001 to represent the alliance between Brazil, Russia, India
and China. Recently South Africa joined the alliance to form the BRICS. Currently, numerous
developed and developing countries rely on trading with the BRICS due to the huge markets and
abundance of natural resources. This paper will examine how certain characteristics of the
BRICS have led them to become a significant economic force in the world economy. Every
country in the BRICS has something to offer. For example Brazil, Russia and South Africa have
the resources while India and China have the market and labor force.
Throughout the last 20 years, Brazil has developed rapidly due to increased trade.
President Lula da Silva the leader of the Workers Party has restructured Brazil to increase the
quality of life. For example, Bolsa Familia is a social assistance program provided for poor
families. The program has helped raise numerous families out of poverty thus, ultimately helped
drive the Brazilian economy. Similarly, Russia was in ruins after the fall of the Soviet Union in
the early 1990‟s. However, President Vladimir Putin restructured Russia‟s policies and jump
started their economy. Therefore, Russia‟s economy has flourished due to their abundance of oil
and natural gas (Guangcheng, 2009). As world demand for oil and natural gas increases, Russia‟s
resources will be important to consumer countries such as the United States and China.
Furthermore, India and China house the two largest populations in the world. Many citizens in
India and China are still poverty stricken. However, over the last 10 years there has been an
increase of people joining the middle class. Due to outsourcing jobs, China and India have
benefitted because more people are engaged in the formal sector which pays taxes to their
government. The taxes are continually used to reinvest into their country to improve the quality
of life. South Africa only recently joined the BRICS alliance. South Africa is leading all African
countries economically due to their abundance of natural resources in the form of heavy metals.
Gold, platinum and magnesium are heavily mined in South Africa thus, enhancing their
economic power as these metals are in huge demand globally. Similar to Brazil, the South
African president Thabo Mbeki has restructured policies that made them one of five top
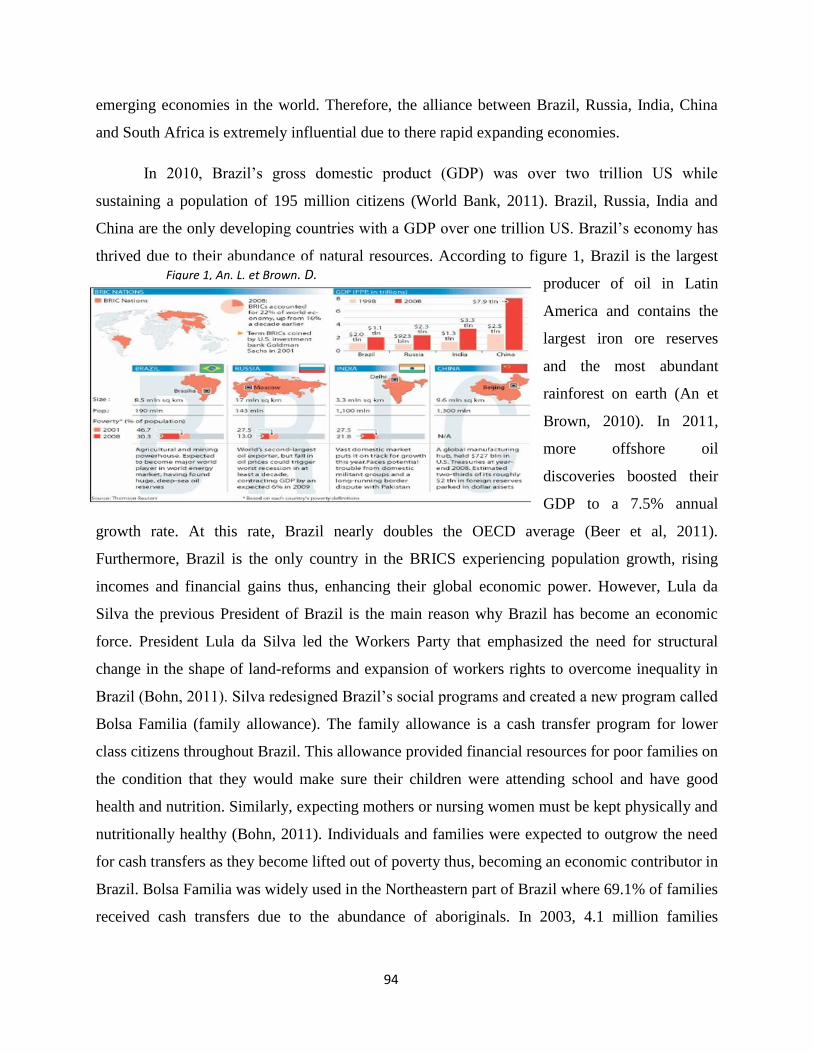
94
emerging economies in the world. Therefore, the alliance between Brazil, Russia, India, China
and South Africa is extremely influential due to there rapid expanding economies.
In 2010, Brazil‟s gross domestic product (GDP) was over two trillion US while
sustaining a population of 195 million citizens (World Bank, 2011). Brazil, Russia, India and
China are the only developing countries with a GDP over one trillion US. Brazil‟s economy has
thrived due to their abundance of natural resources. According to figure 1, Brazil is the largest
producer of oil in Latin
America and contains the
largest iron ore reserves
and the most abundant
rainforest on earth (An et
Brown, 2010). In 2011,
more offshore oil
discoveries boosted their
GDP to a 7.5% annual
growth rate. At this rate, Brazil nearly doubles the OECD average (Beer et al, 2011).
Furthermore, Brazil is the only country in the BRICS experiencing population growth, rising
incomes and financial gains thus, enhancing their global economic power. However, Lula da
Silva the previous President of Brazil is the main reason why Brazil has become an economic
force. President Lula da Silva led the Workers Party that emphasized the need for structural
change in the shape of land-reforms and expansion of workers rights to overcome inequality in
Brazil (Bohn, 2011). Silva redesigned Brazil‟s social programs and created a new program called
Bolsa Familia (family allowance). The family allowance is a cash transfer program for lower
class citizens throughout Brazil. This allowance provided financial resources for poor families on
the condition that they would make sure their children were attending school and have good
health and nutrition. Similarly, expecting mothers or nursing women must be kept physically and
nutritionally healthy (Bohn, 2011). Individuals and families were expected to outgrow the need
for cash transfers as they become lifted out of poverty thus, becoming an economic contributor in
Brazil. Bolsa Familia was widely used in the Northeastern part of Brazil where 69.1% of families
received cash transfers due to the abundance of aboriginals. In 2003, 4.1 million families
Figure 1, An. L. et Brown. D.
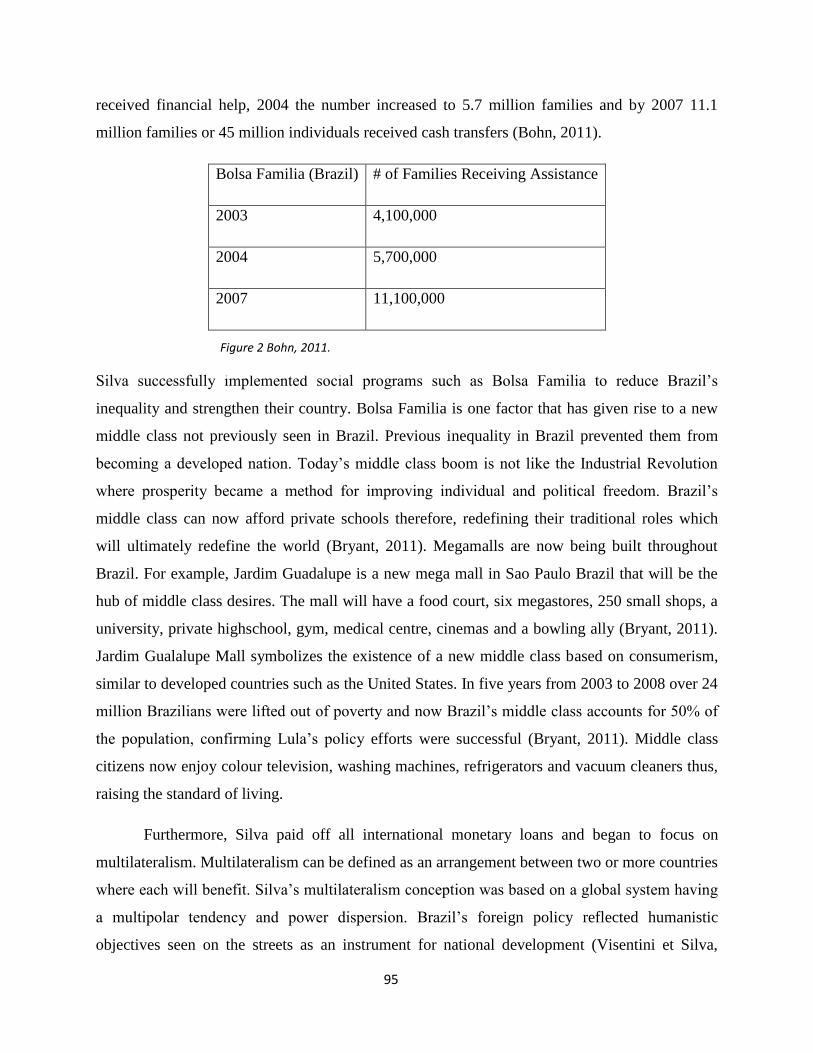
95
received financial help, 2004 the number increased to 5.7 million families and by 2007 11.1
million families or 45 million individuals received cash transfers (Bohn, 2011).
Bolsa Familia (Brazil) # of Families Receiving Assistance
2003 4,100,000
2004 5,700,000
2007 11,100,000
Silva successfully implemented social programs such as Bolsa Familia to reduce Brazil‟s
inequality and strengthen their country. Bolsa Familia is one factor that has given rise to a new
middle class not previously seen in Brazil. Previous inequality in Brazil prevented them from
becoming a developed nation. Today‟s middle class boom is not like the Industrial Revolution
where prosperity became a method for improving individual and political freedom. Brazil‟s
middle class can now afford private schools therefore, redefining their traditional roles which
will ultimately redefine the world (Bryant, 2011). Megamalls are now being built throughout
Brazil. For example, Jardim Guadalupe is a new mega mall in Sao Paulo Brazil that will be the
hub of middle class desires. The mall will have a food court, six megastores, 250 small shops, a
university, private highschool, gym, medical centre, cinemas and a bowling ally (Bryant, 2011).
Jardim Gualalupe Mall symbolizes the existence of a new middle class based on consumerism,
similar to developed countries such as the United States. In five years from 2003 to 2008 over 24
million Brazilians were lifted out of poverty and now Brazil‟s middle class accounts for 50% of
the population, confirming Lula‟s policy efforts were successful (Bryant, 2011). Middle class
citizens now enjoy colour television, washing machines, refrigerators and vacuum cleaners thus,
raising the standard of living.
Furthermore, Silva paid off all international monetary loans and began to focus on
multilateralism. Multilateralism can be defined as an arrangement between two or more countries
where each will benefit. Silva‟s multilateralism conception was based on a global system having
a multipolar tendency and power dispersion. Brazil‟s foreign policy reflected humanistic
objectives seen on the streets as an instrument for national development (Visentini et Silva,
Figure 2 Bohn, 2011.

96
2010). For example, promoting free trade, building up advanced technology and searching for
productive investments was Lula‟s main objective as these are the tools in national development.
Technology plays a key role as it raises citizen‟s standards of living. Brazilian‟s now have
appliances such as refrigerators and washing machines whereas before appliances were unheard
of because there was a lack of electrical lines connected to houses. Free trade is very important
as the flow of capital is what drives the Brazilian economy. Therefore, the alliance between the
BRICS is extremely vital as resources flow from one country into the other. The BRICS trade
freely between on another and hold forty percent of the worlds total reserves. One sixth of their
reserves are the total size of the International Monetary Fund exemplifying the sheer power of
the BRICS (Economist, 2010).
Brazil settled many disputes against developed countries to increase their multilateral
policies. For example, Brazil took Canada to the World Trade Organization (WTO) and won the
dispute over subsidies concerning the sale of Bombardier airplanes in 2001. In addition, Brazil
took the United States to the WTO over cotton subsidies. Brazil argued the United States
purposely inflated the market with subsidies to provoke a decrease in price on cotton fiber
(Visentini et Silva, 2010). The developed countries continually suppress developing countries by
subsidizing commodities thus, becoming very competitive on the world markets. Therefore,
countries such as Brazil are not able to compete with developed countries low prices. Lula has
also focused his policies on environmental multilateralism. In 2009, at the UN General
Assembly, Lula pushed for more research and investment on renewable resources. According to
Brazil, developed countries have more responsibilities in environmental issues than developing
countries (Visentini et Silva, 2010). Lula is raising awareness that climate change is everyone‟s
fault. Pointing the finger at developing countries will not reverse climate change; Lula wants to
see a joint effort between countries in reducing emissions. The environment is the third objective
on Lula da Silva‟s agenda behind poverty and hunger. Lula took interest in the Clean
Development Mechanism (CDM) which allows for investment in projects that reduce
greenhouse gases. The environment is amongst Brazil‟s top priorities whereas the environment is
not as important for developed countries such as Canada. Investing in the environment is
extremely important for Brazil as the country relies on their natural resources. This will
ultimately re-enforce Brazil‟s global economic power due to the creation of new technology and
jobs in environmental research and development.
97
Throughout the 1990‟s, Russia was politically and economically instable. Today, Russia
has become a major influence due to their stable government and abundance of resources. Russia
has the world‟s largest mineral and natural gas reserves, second largest coal reserves and the
seventh largest oil reserves. In addition, Russia houses the largest fresh water reserves on earth
(Guangcheng, 2009). Similar to Brazil, Russia‟s economy relies on their abundance of natural
resources. Their fresh water reserves provide hydroelectric power to neighboring countries thus,
enhancing their influence as many countries rely on Russia for electricity. Russia‟s oil and gas
reserves are becoming increasingly important as the global demand for oil and gas is increasing.
Russia is one of the top producers and exporters of oil and gas. However, they rank seventh in
proven oil reserves behind Saudi Arabia, Iran, Iraq, Kuwait, United Arab Emirates and
Venezuela (Bahgat, 2010). In 1988, the Soviet Union produced 12.5 million barrels of oil a day.
During the 1990‟s oil production dropped by 50% due to political and economic instability.
However, during the period from 1998 to 2008 Russia saw a huge increase in production due to
global demand (Bahgat, 2010). In 2008, oil prices drastically fell thus, Russia‟s oil production
remained stagnant. In the long term, the decline in oil production symbolizes the aging Siberian
Field Reserves; therefore, they must invest more money in exploration to sustain their economic
power. Russia is the world‟s natural gas superpower, the largest producer and exporter and
holding 27.3% of the world‟s proven reserves (Bahgat, 2010). Russia is located in between
Europe and Asia, two extremely large markets. Therefore, Europe and Asia‟s dependence on oil
and gas only enhances their economic power. In 2008, the Russian government implemented an
energy strategy to increase production by 2030. Oil production is expected to rise from 400
million tons to 535 million tons a year. Similarly, gas production is estimated to increase from
664 billion cubic meters to 940 billion cubic meters by 2030 (Bahgat, 2010). Global demand for
oil and gas is continually rising thus; countries such as China are reliant on Russia for their
abundant of resources which will increase their economic strength.
Currently, Russia has a population of over 141 million people and a GDP of 1.5 trillion
US (World Bank, 2010). Russia‟s natural resources are extremely important for their expanding
economy. With the fall of the Soviet Union in the late 1980‟s and early 1990‟s, Russia had
virtually zero dollars in foreign exchange. However, by 2010 Russia had a foreign exchange
worth $420 billion US (Economist, 2010). The BRICS alliance is very important for Russia as
they are now associated with some of the most dynamic economies in the world, China, India,
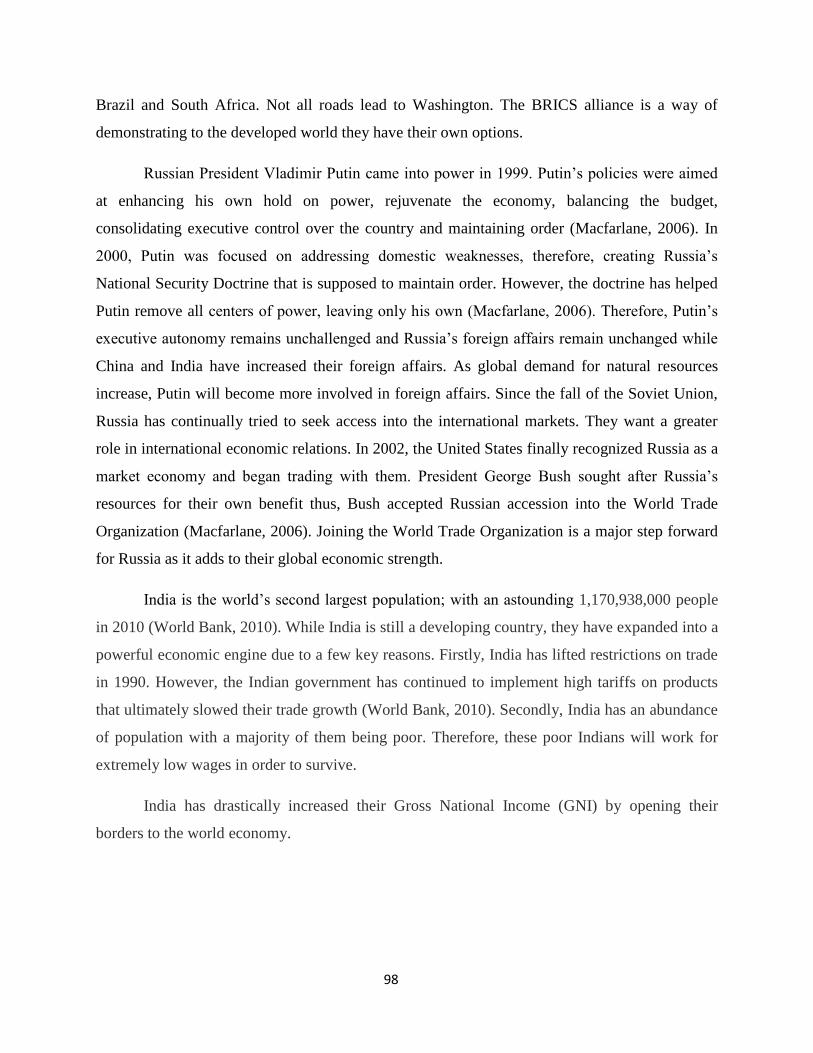
98
Brazil and South Africa. Not all roads lead to Washington. The BRICS alliance is a way of
demonstrating to the developed world they have their own options.
Russian President Vladimir Putin came into power in 1999. Putin‟s policies were aimed
at enhancing his own hold on power, rejuvenate the economy, balancing the budget,
consolidating executive control over the country and maintaining order (Macfarlane, 2006). In
2000, Putin was focused on addressing domestic weaknesses, therefore, creating Russia‟s
National Security Doctrine that is supposed to maintain order. However, the doctrine has helped
Putin remove all centers of power, leaving only his own (Macfarlane, 2006). Therefore, Putin‟s
executive autonomy remains unchallenged and Russia‟s foreign affairs remain unchanged while
China and India have increased their foreign affairs. As global demand for natural resources
increase, Putin will become more involved in foreign affairs. Since the fall of the Soviet Union,
Russia has continually tried to seek access into the international markets. They want a greater
role in international economic relations. In 2002, the United States finally recognized Russia as a
market economy and began trading with them. President George Bush sought after Russia‟s
resources for their own benefit thus, Bush accepted Russian accession into the World Trade
Organization (Macfarlane, 2006). Joining the World Trade Organization is a major step forward
for Russia as it adds to their global economic strength.
India is the world‟s second largest population; with an astounding 1,170,938,000 people
in 2010 (World Bank, 2010). While India is still a developing country, they have expanded into a
powerful economic engine due to a few key reasons. Firstly, India has lifted restrictions on trade
in 1990. However, the Indian government has continued to implement high tariffs on products
that ultimately slowed their trade growth (World Bank, 2010). Secondly, India has an abundance
of population with a majority of them being poor. Therefore, these poor Indians will work for
extremely low wages in order to survive.
India has drastically increased their Gross National Income (GNI) by opening their
borders to the world economy.

99
According to the figure 3, India‟s GNI per capita has increased steadily since 1995. Between
2000 and 2010 the GNI per capita almost tripled proving India is an emerging economy thirsty
for more. Increasing per capita GNI allows many Indians the ability to afford luxury goods they
could not afford fifteen years earlier. Trade between countries will occur as the demand for
manufactured goods increase thus, expanding their economy. As the demand for goods increases,
the opportunity for private entrepreneurs arises because they are required to meet the demand by
supplying the goods, which will allow them to turn a profit. As demand grows so does local
business and this growth aids in lowering the unemployment rate that fuels growth.
Gross Domestic Product rises as the economy grows. India‟s economic growth is due to
the expansion of investments in local business. In addition, new infrastructure such as roads and
bridges throughout India has helped support their expanding economy by enabling faster
shipment of goods.
GNI per capita, Atlas method (current US$)
1990 1995 2000 2005 2010
390 380 450 750 1330
GDP per capita (current US$)
1990 1995 2000 2005 2010
374 382 453 762 1475
Figure 3- GNI per capital in India
Figure 4: GDP Per Capita
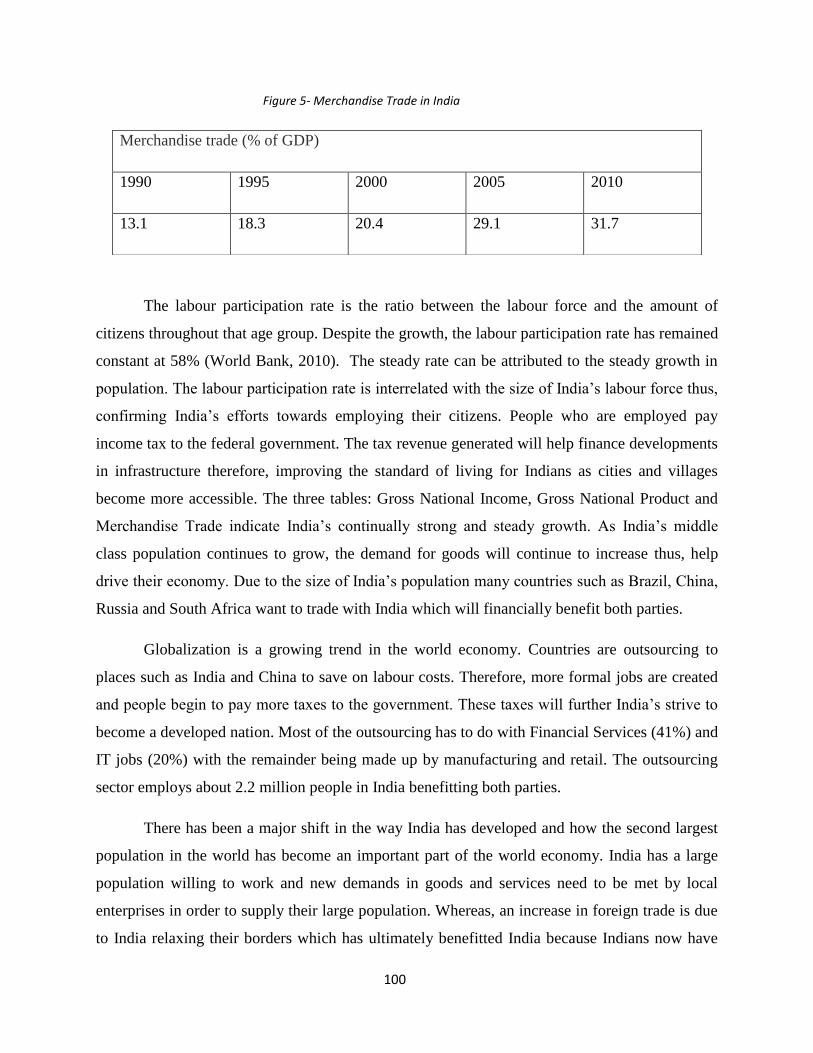
100
The labour participation rate is the ratio between the labour force and the amount of
citizens throughout that age group. Despite the growth, the labour participation rate has remained
constant at 58% (World Bank, 2010). The steady rate can be attributed to the steady growth in
population. The labour participation rate is interrelated with the size of India‟s labour force thus,
confirming India‟s efforts towards employing their citizens. People who are employed pay
income tax to the federal government. The tax revenue generated will help finance developments
in infrastructure therefore, improving the standard of living for Indians as cities and villages
become more accessible. The three tables: Gross National Income, Gross National Product and
Merchandise Trade indicate India‟s continually strong and steady growth. As India‟s middle
class population continues to grow, the demand for goods will continue to increase thus, help
drive their economy. Due to the size of India‟s population many countries such as Brazil, China,
Russia and South Africa want to trade with India which will financially benefit both parties.
Globalization is a growing trend in the world economy. Countries are outsourcing to
places such as India and China to save on labour costs. Therefore, more formal jobs are created
and people begin to pay more taxes to the government. These taxes will further India‟s strive to
become a developed nation. Most of the outsourcing has to do with Financial Services (41%) and
IT jobs (20%) with the remainder being made up by manufacturing and retail. The outsourcing
sector employs about 2.2 million people in India benefitting both parties.
There has been a major shift in the way India has developed and how the second largest
population in the world has become an important part of the world economy. India has a large
population willing to work and new demands in goods and services need to be met by local
enterprises in order to supply their large population. Whereas, an increase in foreign trade is due
to India relaxing their borders which has ultimately benefitted India because Indians now have
Merchandise trade (% of GDP)
1990 1995 2000 2005 2010
13.1 18.3 20.4 29.1 31.7
Figure 5- Merchandise Trade in India

101
formal jobs paying taxes to their government. Therefore, the government has improved basic
necessities such as infrastructure thus, improving India‟s standard of living.
China is the largest country in the world in terms of population (1,338,299,512) and this
very important economically because China has a massive market and labour force. Therefore,
many countries want to trade with China to increase their foreign investments. China is currently
seen as a developing country with a massive labour force. However, China continues to try and
get many citizens out of poverty to increase their citizen‟s quality of life. Companies are paying
their workers minimal wages thus, making it hard for the Chinese government to increase the
standard of living. However, access to cheap labour has fueled one of the fastest growing
economies in the world by outsourcing jobs.
Exports of goods and services (% of GDP)
1990 1995 2000 2005 2010
16 20 23 37 39
GDP growth (annual %)
1990 1995 2000 2005 2010
3.8 10.5 8.4 11.3 10.4
GNI, Atlas method (current US$)
1990 1995 2000 2005 2010
370,018,692,061 643,556,124,502 1,168,792,749,887 2,265,626,738,147 5,720,811,453,834
Figure 6- GDP Growth in China
Figure 7- GNI in China
Figure 8- Exports of goods and services in China
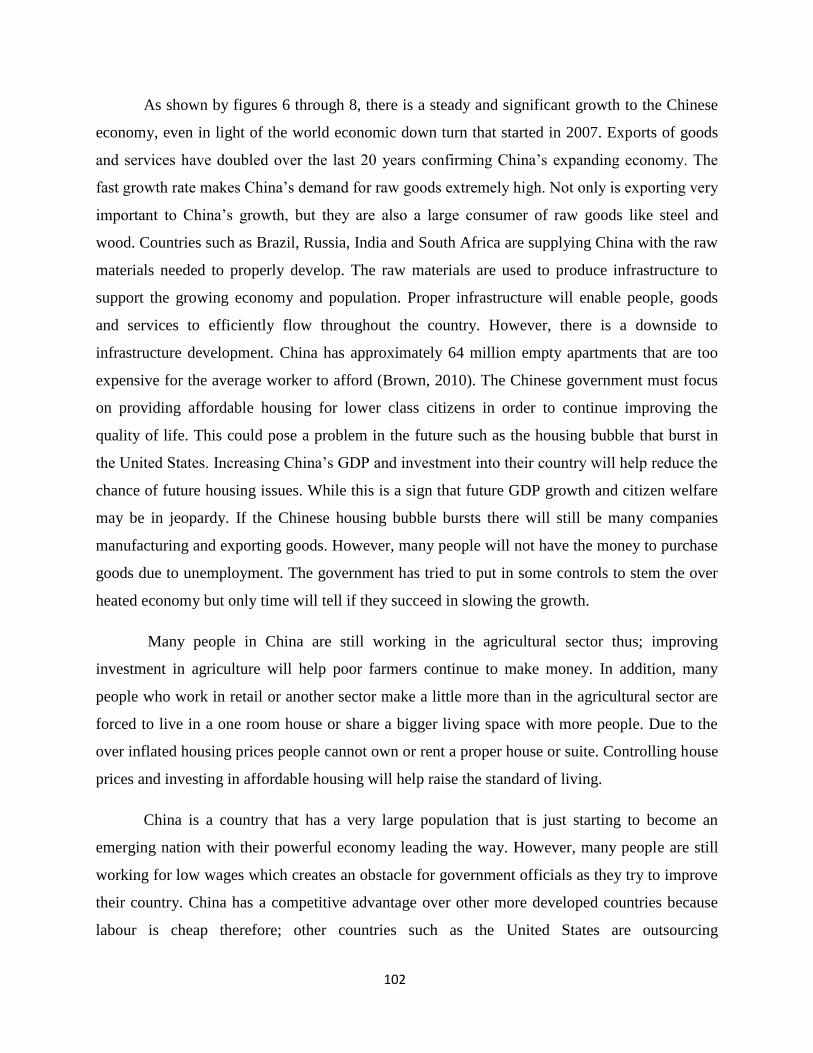
102
As shown by figures 6 through 8, there is a steady and significant growth to the Chinese
economy, even in light of the world economic down turn that started in 2007. Exports of goods
and services have doubled over the last 20 years confirming China‟s expanding economy. The
fast growth rate makes China‟s demand for raw goods extremely high. Not only is exporting very
important to China‟s growth, but they are also a large consumer of raw goods like steel and
wood. Countries such as Brazil, Russia, India and South Africa are supplying China with the raw
materials needed to properly develop. The raw materials are used to produce infrastructure to
support the growing economy and population. Proper infrastructure will enable people, goods
and services to efficiently flow throughout the country. However, there is a downside to
infrastructure development. China has approximately 64 million empty apartments that are too
expensive for the average worker to afford (Brown, 2010). The Chinese government must focus
on providing affordable housing for lower class citizens in order to continue improving the
quality of life. This could pose a problem in the future such as the housing bubble that burst in
the United States. Increasing China‟s GDP and investment into their country will help reduce the
chance of future housing issues. While this is a sign that future GDP growth and citizen welfare
may be in jeopardy. If the Chinese housing bubble bursts there will still be many companies
manufacturing and exporting goods. However, many people will not have the money to purchase
goods due to unemployment. The government has tried to put in some controls to stem the over
heated economy but only time will tell if they succeed in slowing the growth.
Many people in China are still working in the agricultural sector thus; improving
investment in agriculture will help poor farmers continue to make money. In addition, many
people who work in retail or another sector make a little more than in the agricultural sector are
forced to live in a one room house or share a bigger living space with more people. Due to the
over inflated housing prices people cannot own or rent a proper house or suite. Controlling house
prices and investing in affordable housing will help raise the standard of living.
China is a country that has a very large population that is just starting to become an
emerging nation with their powerful economy leading the way. However, many people are still
working for low wages which creates an obstacle for government officials as they try to improve
their country. China has a competitive advantage over other more developed countries because
labour is cheap therefore; other countries such as the United States are outsourcing

103
manufacturing jobs to China. Over the last 20 years China has been rapidly expanding their
economy providing more jobs for lower class citizens. If China succeeds in stemming it‟s over
active growth by controlling investments and move to an efficient rate that will reduce inflation;
China will continue to be a strong economic power throughout the world.
The country of South Africa contributes to 24% of Africa‟s total gross domestic product
and is the leading economic force in Africa. Over the past decade South Africa‟s efforts to
pursue peace, stability, economic growth and top-notch economic policies has triumphed; and as
of December 2010, South Africa became one of the top five leading emerging economies in the
world. Due to its abundant amount of natural resources, large agricultural sector and top notch
economic policies the South African rand is the most actively traded market currency in the
world and the best performing currency against the US dollar in both 2002 and 2005.
Since the 2000 election of President Thabo Mbeki, the government of South Africa has
changed their economic policies focusing on growth, foreign investment, privatization and
cutting unneeded government spending (Hervieu, 2011). Before 2000, South Africa‟s most
significant problems were high unemployment and inequality, both economically and socially.
South Africa has been able to diversify its economy by managing substantial: mining, industry,
service, agriculture and finance industries. South Africa has been able to establish a comparative
advantage in its tertiary economy, which accounts for 60% of South Africa‟s GDP or 230 billion
dollars nominally ("Southafrica.info," 2012). Not only does South Africa produce nearly every
essential commodity (except Petroleum), but also they are the largest supplier of gold, platinum,
manganese and other industrial minerals. Also, South Africa is the lead producer in minerals
that form stainless steel; this has proven to be very beneficial with the increase in demand for
automobiles, and as a result, South African steel exports have risen 14%. Not only are their
natural resources appealing, but their tourism, construction and live stock development (up 297%
at 4 million dollars in 2006) industries/exports are increasing rapidly. South Africa has been able
to abolish their old economic system of high tariffs, high government intervention and taxes;
making way for a new contemporary economic system. This modern system has lowered taxes,
decreased government intervention, eliminated non-resident taxes, reduced secondary taxation
on dividends and has essential made foreign and domestic investments equal ("Southafrica.info,"
2012). South Africa is now able to foster and maintain International relationships. Foreign
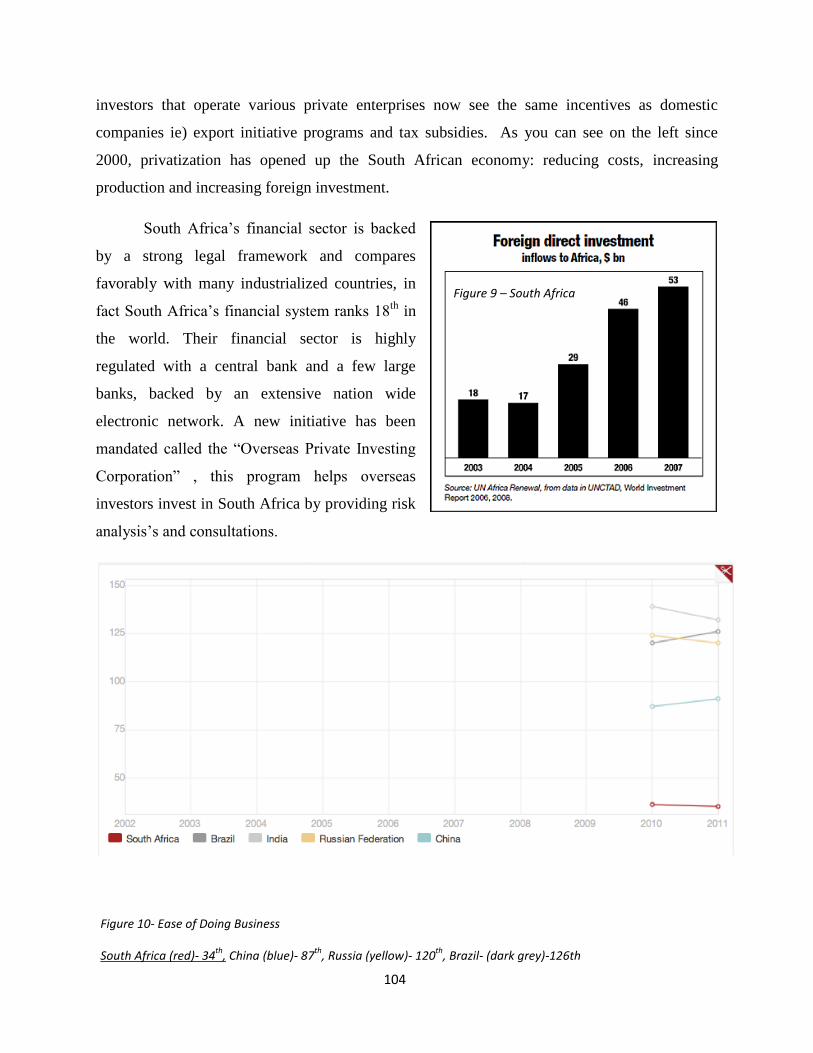
104
investors that operate various private enterprises now see the same incentives as domestic
companies ie) export initiative programs and tax subsidies. As you can see on the left since
2000, privatization has opened up the South African economy: reducing costs, increasing
production and increasing foreign investment.
South Africa‟s financial sector is backed
by a strong legal framework and compares
favorably with many industrialized countries, in
fact South Africa‟s financial system ranks 18th
in
the world. Their financial sector is highly
regulated with a central bank and a few large
banks, backed by an extensive nation wide
electronic network. A new initiative has been
mandated called the “Overseas Private Investing
Corporation” , this program helps overseas
investors invest in South Africa by providing risk
analysis‟s and consultations.
Figure 10- Ease of Doing Business
South Africa (red)- 34th
, China (blue)- 87th
, Russia (yellow)- 120th
, Brazil- (dark grey)-126th
Figure 9 – South Africa
105
In fact, as of 2011, the World Bank ranked South Africa as the 34th
“Easiest Country to
do business in” in the world. As you can see in the graph above, South Africa ranked number one
compared to the other BRICS countries. As a result of these various initiatives South Africa is
seen as an “E Commerce” hub of that hemisphere.
As the government of South Africa‟s economic policies has become more progressive so
have their spending habits. The government is focusing on more long term investment, spending
their budget on infrastructure such as: power stations, road networks, dams, water supply
pipelines, schools and hospitals. Not only is the government creating more short/long term jobs
but also they are paying greater attention to planning and budgeting directly targeting poorer
municipalities. An increasing percentage of their budget (20%) is going towards education,
fixing up classrooms and improving wages for its teachers. In fact, South Africa has one of the
highest rates of public investment in education in the world. South Africa has over a million
students, eleven universities and six comprehensive institutions ("Southafrica.info," 2012). With
these figures the government has been able to develop strong educational policies, dividing
educational standards into two categories: basic education and higher development. Today, the
government is working towards abolishing the apartheid legacy that still remains within the
education system. Approximately nine million adults in South Africa are completely illiterate,
teachers in poorer districts are poorly trained and the pass rate in these regions remains low. Fee
free schools; which receive all their funding form the state, are being built throughout South
Africa. These schools are specifically targeting poverty stricken areas (making educational
attainment equal for all citizens) and make up 40% of all schools in South Africa
("Southafrica.info,"2012). The government implicated various Nation Nutrition programs and
has planted approximately 2100 school gardens.
The Countries of BRICS are all developing or newly industrialized countries,
characterized by the enormous economies and significant influence on the worlds economy; in
fact, the five BRICS countries represent almost half of the entire worlds population. . Their
entry into the BRICS has exponentially increased their economic growth (South Africa‟s trade
with other BRICS countries accounts for 20% of their foreign trade volume).

106
As a result, by the end of 2010 trade activity between China and South Africa totaled
25.6 billion USD and South Africa‟ s exports to China reached 14.8 billion USD (Hong'e, 2011).
South Africa‟s largest exports to China are primary products, which prove to be and many
economists are saying that their entry into the BRICS has taken South Africa from the edge of
the World‟s economies to the center and is now the gateway to Africa in its entirety (Hervieu,
2011).
Alliances such as the BRICS have been established throughout the world. The North
American Free Trade Agreement (NAFTA) is similar to the BRICS alliance. Many countries are
trying to expand their economies by opening their borders and allowing free trade. However, the
BRICS are far more powerful than any other alliance due to their sheer size in population and
resources. Brazil, Russia and South Africa economically thrive off of extracting their resources.
Oil, natural gas, timber, gold and platinum are some of the many resources extracted. These
resources are bought by countries such as India and China where the market is enormous and
demand is high. Brazil, Russia, India, China and South Africa are still considered developing
countries, although they are emerging. Inequality has been reduced over the last decade which
has given rise to a new middle class throughout the BRICS. People can now afford to purchase
luxurious goods for themselves and still have money to survive. New mega-malls such as the one
Figure 11- South Africa’s top exports to China
107
being built in Sao Paulo Brazil are becoming the norm as more middle class citizens emerge.
These mega malls represent the emerging middle class based on consumerism similar to current
developed countries such as the United States. The BRICS governments must maintain stability
by implementing social programs such as Bolsa Familia to increase the quality of life and further
their economic power. At the current rate of growth, the BRICS will eventually further become
major players in foreign affairs as well as foreign investment. For example, China helped finance
the bailout of Greece which illustrates how times have changed (Beer et al, 2011). The BRICS
will continue to help finance countries such as Greece because they are becoming more
influential. Due to their massive economies developed countries are becoming more passive
towards the BRICS because they are increasingly becoming more powerful as resources are
scarce. Developed countries must acknowledge the BRICS leverage in world trade as they are a
very important market in maintaining the flow of global capital and goods.
Appendix
Figure 1, An. L. et Brown. D………. Page 3
Figure 2 Bohn, 2011………………... Page 4
Figure 3- GNI per capital in India…... Page 10
Figure 4. ………………………………Page 11
Figure 5………………………………. Page 11
Figure 6 ……………………………… Page 3
Figure 7 ……………………………… Page 13
Figure 8. ………………………………Page 14
Figure 9. ………………………………Page 17
Figure 10 ………………………………Page 18
Figure 11.……………………………… Page 20

108
References
An, L., and Brown, D. (2010). Equity market integration between the US and BRIC countries:
Evidence from unit root and co integration test. Research Journal of International Studies,
(16), 15-24. Retrieved from Academic Search Premier, March.3.2011.
Bahgat, G. (2010). Russia's Oil and Gas Policy Gawdat Bahgat Russia's Oil and Gas Policy.
OPEC Energy Review, 34(3), 162-183. doi:10.1111/j.1753-0237.2010.00178.x
Beer, J., Castaldo, J., Lim, J., McClearn, M., McCullough, M., Melonson, T., Watson, T. (2011).
The BRIC Bloc Builds Up Its Influence. Canadian Business, 84(21), 37-37.
Bohn, S. R. (2011). Social policy and Vote in Brazil. Latin American Research Review, 46(1),
54-79.
Brown, Adrian. “China‟s Ghost Cities” http://www.sbs.com.au/dateline/story/watch/id/601007/n
/China-s-Ghost-Cities. 2010 SBS Dateline.
Bryant, C. C. (2011). Surging BRIC Middle Classes are Eclipsing Global Poverty. Christian
Science Monitor, , N.PAG.
Education in South Africa." Southafrica.info. Big Media Publishers, n.d. Web. 28 Mar 2012.
<http://www.southafrica.info/about/education/education.htm>.
“GDP Growth (annual %)“ (2010). The World Bank, http://data.worldbank.org/indicator
/NY.GDP.MKTP.KD.ZG. 2012 The World Bank Group.
“GDP per capita (current us $)” (2010). The World Bank, http://data.worldbank.org/indicator
/NY.GDP.PCAP.CD. 2012 The World Bank Group.
“GNI per capita, Atlas method (current US$)” (2010). The World Bank,
http://data.worldbank.org/indicator/NY.GNP.PCAP.CD. 2012 The World Bank Group.

109
Guangcheng, X. (2009). Becoming BRICS. Beijing Review, 54(15), 14-15.
Hervieu, Sébastien . "South Africa gains entry into the BRIC club." Guardian 19 04 2011.
http://www.guardian.co.uk/world/2011/apr/19/south-africa-joins-bric-club.
Web. 28 Mar. 2012.
Hong'e, Mo . "China becomes South Africa's biggest export destination: ambassador." Forum on
China-Africa Cooperation . Ministry of Foreign Affairs, the People's Republic of China ,
21/08/2011. Web. 22 Mar 2012. <http://www.focac.org/eng/z&/t850828.htm>.
MacFarlane, S. N. (2006). The 'R' in BRICs: Is Russia an Emerging Power? International Affairs
(Royal Institute of International Affairs 1944-), 82(Perspectives on Emerging Would-Be
Great Powers), pp. 41-57.
“Management trends in outsourcing” Outsource to India,
http://www.outsource2india.com/why_outsource/articles/management_trends.asp
.2012 Flat world Solutions.
“Merchandise trade (% of GDP)” (2010). The World Bank, http://data.worldbank.org/indicator
/TG.VAL.TOTL.GD.ZS. 2012 The World Bank Group.
"South Africa's Financial Sector." Southafrica.info. Big Media Publishers, n.d. Web. 28 Mar
2012.<http://www.southafrica.info/business/economy/sectors/financial.htm>.
The Trillion-Dollar Club.(2010). Economist, 395(8678), 64-66. Retrieved from Academic Search
Premier, March.3.2011.
Visentini, Fagun Des et Silva, Luiz Reis. (2010). Brazil and the Economic, Political, and
Environmental Multilateralism: The Lula Years (2003-2010). Revista Brasileira De Política
Internacional, 53, 54-72.
110
6 Child Labour and Gender Bias in Developing Countries: The
Missing Link
Emma Underhill
Introduction
The issue of child labour has received a great deal of attention in both theoretical and empirical
research. Child labour is a significant issue with 15.8% of the world‟s 5-14 year old children
economically active in 2004 (IPEC 2006). The incidence of child labour is much higher than this
in developing countries. The prevalence and forms of child labour tend to differ significantly by
gender. Edmonds (2007), who is an eminent researcher in this area, concludes “bifurcating data
by gender seems a reasonable default position” (p.18).
Despite an extensive empirical literature documenting gender differences in child labour,
most of the existing theoretical models on child labour treat children as a homogeneous entity
(e.g. Basu and Van (1999), Baland and Robinson (2000)). We are aware of just one theoretical
model which allows for heterogeneous children (Horowitz and Wang (2004)). In their model,
children differ in terms of their ability to acquire human capital.
While economic theories of child labour do not seem to analyze the implications of gender
differences, there is a large economic literature which examines the effects of gender biases on
children. This literature is primarily focused on studying the effects of gender biases on parental
investments in their children‟s human capital (e.g. Behrman et al (1986), Davies and Zhang
(1995)), sex selective abortion and fertility (e.g. Ben-Porath and Welch (1976), Leung (1991),
Chamarbagwala and Ranger (2007)), and health and nutritional outcomes of children.
This essay attempts to link the two strands of theoretical literature, namely, the models of
child labour and the models of gender bias. In particular, it analyses the implications for the
relative work loads of children of different gender in the presence of parental gender bias. There
is an extensive empirical literature which suggests that parental gender bias, particularly in
favour of male children, is wide-spread in many regions of the world. In this essay, we analyze
the effects of parental gender bias on savings, bequests, and child labour. This essay also studies
the efficiency aspects of child labour. In addition, the implications for child labour due to other

111
forms of gender bias, such as differential quality of schools and labour market discrimination, are
analysed.
This essay contributes to the literature by explicitly introducing gender bias into child labour
theory. This is important since there is a great deal of evidence which suggests that children of
different gender have different experiences of child labour. Separating children by gender in our
model allows us to analyze the causes and consequences of gender differentials in child labour.
Such an analysis is important in order to devise, implement, and effectively target child labour
policy.
To analyse the gender differentials in child labour, we extend the model of Baland and
Robinson (2000), which is one of the most influential models of child labour. This model is
widely used to analyze the effects of savings and bequests on child labour as well as the
efficiency of child labour. Baland and Robinson (2000) develop a two-period model in which
parents are altruistic. Parents‟ utility depends not only on their own consumption, but also on the
utility enjoyed by their children. In their model, children are identical and parents put identical
weights on their children‟s utilities. Parents choose levels of child labour, bequests and savings
to maximise their own utility, where bequests and savings are constrained to be non-negative. In
the model, parents face a trade-off between child labour and human capital acquisition for their
children. A higher level of child labour in the first period leads to a lower level of human capital
(earnings opportunities) in the next period.
We introduce parental gender bias in the Baland and Robinson (2000) model. We assume
that each family has two children: one male and one female. Parents are altruistic, but they put
more weight on the utility of their male child. The rest of the model is identical to Baland and
Robinson (2000), except discounting is introduced and market rates of return are not normalised
to one. Similarly to their model, children have identical human capital functions (earnings
opportunities). Parents decide the levels of child labour and bequest for each child and their own
savings.
We find that the parents choose the same level of child labour for each child, when they can
give strictly positive bequest to both. We also find that when both bequests and savings are
interior, the levels of child labour are efficient. In the model, the bequest received by the male
112
child is always greater than or equal to the bequest received by the female child. We find that if
the bequests (for one or both children) are at the corner, then the female child works more than
the male child. In addition, the child labour allocation is inefficiently high for the child who does
not receive bequests. If on the other hand, savings are at the corner, then the child labour
allocation is inefficiently high for both children. All these results are new to the literature.
The mechanism for these results is as follows. Parental bias towards their male child implies
that parents want to provide him with greater consumption (utility) than the female child. When
parents can give each child a bequest, they can provide their male child with higher consumption
by giving him a greater bequest. Thus, they choose same level of child labour for both the male
and female child, but give more bequests to the male child. However, when bequests (one or
both) are at a corner, it is not possible for parents to make all the adjustments through bequests.
The male child must work less than the female child in order to ensure that he has greater human
capital and consumption in the second period.
Regarding efficiency, when savings are at the corner the marginal utility of parents of first
period consumption becomes relatively high compared to the marginal utility of consumption of
their children. Thus, parents choose an inefficiently high level of child labour in the first period.
Similarly, a child does not receive a bequest, when the marginal utility of consumption of parents
in the second period exceeds the marginal utility of consumption of the child in the second
period. In this case as well, parents choose an inefficiently high level of child labour.
In this essay, we also analyze the effects of other forms of gender bias such as differential
quality of schooling and labour market discrimination. Such gender biases can be captured by
differential human capital functions or earnings opportunities. We only analyze the case in which
bequests and savings are interior. In a model with no parental bias but in which a male child has
superior earnings opportunities, the male child works less than the female child. However, they
have equal consumption levels and the male child receives fewer bequests than the female child.
Intuitively, parents would like the male child with better earnings opportunities to work less
and study more. However, with no parental gender bias, parents would also like to give the same
level of consumption to both children. This they can achieve by giving lower bequests to the
male child compared to the female child.
113
These results are in sharp contrast to our previous model, in which both the male and the
female child work at the same level and the male child has a greater bequest and consumption.
Our analysis shows that not only the existence of gender bias, but also its form is important for
children‟s outcomes.
Our analysis has several important policy implications. Firstly, we find that a higher public
investment in schooling and a greater provision of scholarships for studying reduce the incidence
of child labour. A lower interest rate has the similar effect. In the case where child labour is
inefficiently high, partial banning of child labour improves welfare. Income transfers to poor
families can also reduce the incidence of child labour, particularly for the female child. Finally,
affirmative action in favour of women and policies designed to eliminate labour market
discriminations can reduce the incidence of child labour for girls.
The remainder of this paper is structured as follows. Section 2 reviews the empirical
evidence on child labour across genders. Section 3 surveys the existing empirical and theoretical
literature on the implications of gender bias for human capital acquisition, fertility, etc. Section 4
reviews the existing models of child labour. Section 5 presents the basic model and its results.
Section 6 analyzes the implications of other forms of gender bias on child labour. We also
discuss a model in which human capital accumulation functions (or earnings opportunities)
depend not only on time spent studying, but also on capital invested. Section 7 discusses the
policy implications of our analysis and Section 8 concludes.
Gender aspects of child labour
The term “child labour” is often used to cover a multitude of situations: from bonded labour to
part-time work on the family farm. It is useful to clarify who classifies as a “child” and what
activities count as “labour”. Neither of these turns out to be simple. Basu (1999) explains that the
International Labour Organisation‟s Convention No. 138 specifies 15 years of age as the age at
which a person, under normal circumstances, may participate in economic activities. Most
studies therefore define children as individuals of less than 15 years of age. It is presumed that
children of less than 5 years are unable to work productively and so statistics often show child
labour for 5-14 year olds. However, in some cases individuals under the age of 18 years also
114
count as children and the ILO sets more specific thresholds for some types of work e.g. light
work from the age of 12 years is permissible in a developing country context (IPEC 2006).
The International Labour Organisation (ILO) and in particular the International Programme
on the Elimination of Child Labour (IPEC) are the main international bodies for dealing with
child labour. Their definitions are used by many researchers. The IPEC (2006) defines “working
children” as those engaged in “economic activity” which includes: market production (paid
work) and certain types of non-market work (un-paid work) e.g. working in a market-orientated
establishment run by a relative. Children working in another household are also considered to be
economically active, but children undertaking domestic work in their own household are not
included, nor are children who are unemployed and looking for work.
The IPEC distinguishes between working children and child labour. In particular, unlike
much of the economic literature, it does not classify all economically active children as child
labourers. It defines child labourers as a subgroup of “working children”. Child labour is “work
that deprives children of their childhood, their potential and their dignity, and that is harmful to
physical and mental development”, (IPEC website). The ambiguity of the term “child labour”
poses issues for measurement and assessing its impacts. We use a broader definition of child
labour that consists of all time children do not spend in education. This encompasses market and
domestic work, since both may adversely affect the time spent on education and result in a loss
of earnings capacity.
The presence of working children is by no means trivial with around 190 million children of
5-14 years estimated to be economically active world-wide in 2004 which is 15.8% of the
world‟s population of this age group. 87% of these children are categorised as participating in
child labour (IPEC (2006)). In our analysis, we treat all economically active children as child
labourers.
Data clearly shows different patterns of child labour between girls and boys in most
developing countries. Edmonds (2007) suggests that boys tend to have higher participation rates
in market work and girls tend to have higher participation rates in domestic work. Gender
differences are often very sensitive to definition since domestic work often goes unaccounted for
in child labour classification. If domestic work is included, in some countries girls‟ labour is
likely to outstrip that of boys.
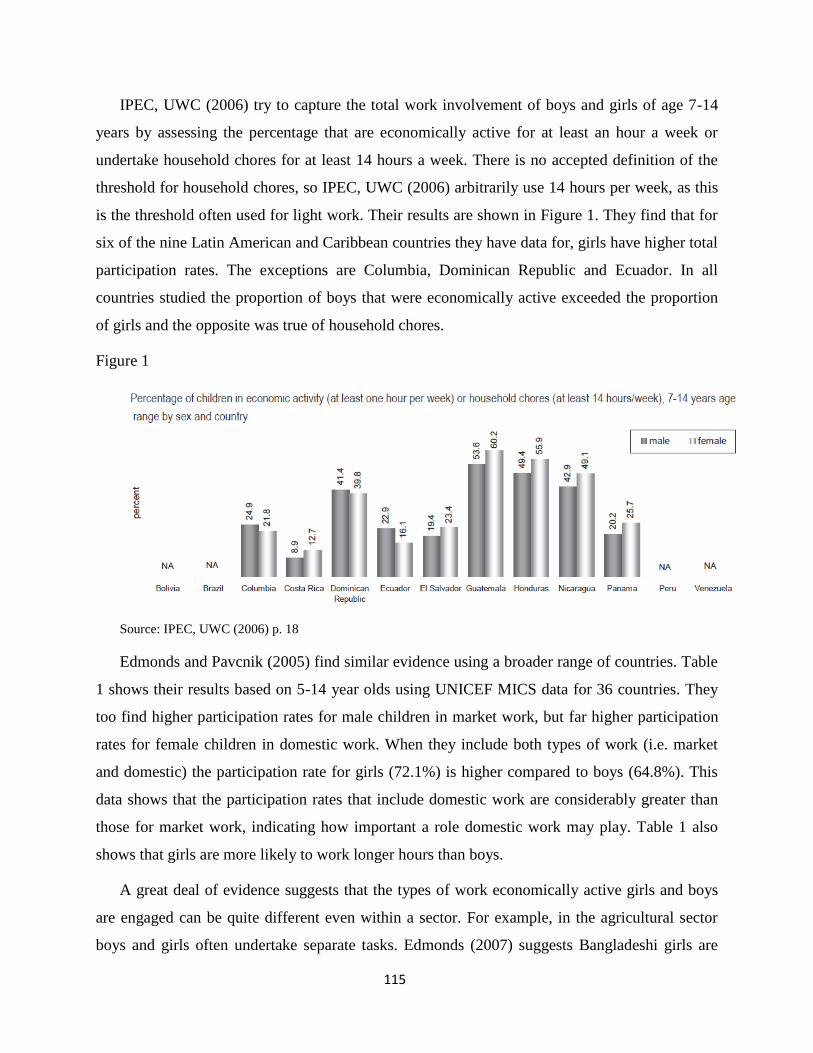
115
IPEC, UWC (2006) try to capture the total work involvement of boys and girls of age 7-14
years by assessing the percentage that are economically active for at least an hour a week or
undertake household chores for at least 14 hours a week. There is no accepted definition of the
threshold for household chores, so IPEC, UWC (2006) arbitrarily use 14 hours per week, as this
is the threshold often used for light work. Their results are shown in Figure 1. They find that for
six of the nine Latin American and Caribbean countries they have data for, girls have higher total
participation rates. The exceptions are Columbia, Dominican Republic and Ecuador. In all
countries studied the proportion of boys that were economically active exceeded the proportion
of girls and the opposite was true of household chores.
Figure 1
Source: IPEC, UWC (2006) p. 18
Edmonds and Pavcnik (2005) find similar evidence using a broader range of countries. Table
1 shows their results based on 5-14 year olds using UNICEF MICS data for 36 countries. They
too find higher participation rates for male children in market work, but far higher participation
rates for female children in domestic work. When they include both types of work (i.e. market
and domestic) the participation rate for girls (72.1%) is higher compared to boys (64.8%). This
data shows that the participation rates that include domestic work are considerably greater than
those for market work, indicating how important a role domestic work may play. Table 1 also
shows that girls are more likely to work longer hours than boys.
A great deal of evidence suggests that the types of work economically active girls and boys
are engaged can be quite different even within a sector. For example, in the agricultural sector
boys and girls often undertake separate tasks. Edmonds (2007) suggests Bangladeshi girls are
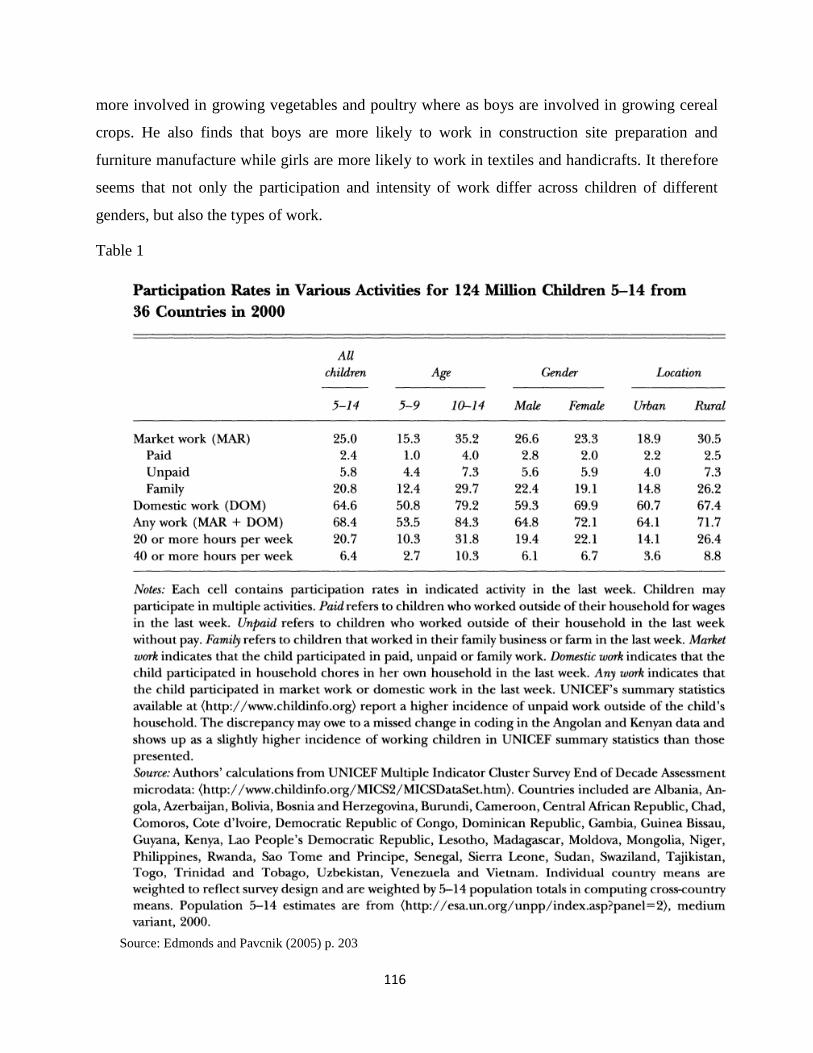
116
more involved in growing vegetables and poultry where as boys are involved in growing cereal
crops. He also finds that boys are more likely to work in construction site preparation and
furniture manufacture while girls are more likely to work in textiles and handicrafts. It therefore
seems that not only the participation and intensity of work differ across children of different
genders, but also the types of work.
Table 1
Source: Edmonds and Pavcnik (2005) p. 203
117
Child gender and its implications for human capital, fertility and welfare
As seen in section 2, children of different gender tend to have different experiences of child
labour. It is also the case that, in many countries boys and girls have differential school
attendance rates, or in fact attend separate schools. Women may have a different status than men
and so may play a lesser role in family decision making. In addition if wages for women are
lower or if women leave the family upon marriage there may be lesser incentives to invest in
girls. There is also the well noted phenomenon of skewed sex-ratios, possibly owing to sex
selective abortion, which shows gender bias in its starkest form. Parents may prefer a male child
either because of their own gender preference, or because they observe outside factors that would
disadvantage a female child.
The majority of the economic literature on child gender bias focuses on either its relation to
human capital investments or fertility, notably not on child labour. We shall focus on the work
relating to human capital, as this links more closely with child time allocation decisions.
Behrman et al (1986) outline three conceptually distinct ways that optimising parents may
allocate human capital investments in their children unequally across genders. Firstly, parental
preferences may favour one gender, in the sense that they value the same outcome more highly
for one gender. Secondly, parents may respond to systematic differences by gender in the price
of human capital investments. Thirdly, parents might expect gender wage differentials in the
labour market. There is considerable evidence for all three types of gender bias.
It is widely believed that in some cultures there is a bias by parents towards their sons. For
example, Tarozzi and Mahajan (2007) state “preference for sons over daughters and gender
inequality are well-know and widespread realities in India, particularly in the North-West; they
are reflected in such phenomena as sex-selective abortion and female disadvantage” (p.442).
Davies and Zhang (1995) suggest that “gender bias often appears to be an integral part of
religion and culture,” (p. 795) and may have connections to Hinduism and Islam.
There is a considerable amount of empirical evidence which indicates that preference in
favour of one gender is quite widespread. For example, Koohi-Kamali (2008) finds evidence of
gender bias towards boys in Ethiopia. This is based on analysis of budget shares of four adult
goods in families with different proportions of girls and boys. Gangadharau and Maitra (2000)
118
analyse child mortality data for boys and girls in Pakistan and find higher child mortality for girls
of age 1-5 years compared to boys of the same age. Davies and Zhang (1995) examine household
data for a number of Philippine villages and find evidence of pure sex preference towards boys
based on their greater bequests.
As discussed earlier, there may be gender difference in earnings functions. This could come
through a number of mechanisms. Firstly, different prices of human capital investments i.e. the
opportunity cost of gaining the same level of human capital could differ for boys and girls,
especially if they attend separate schools with different levels of access or quality. This could
result in different human capital accumulation functions for boys and girls.
Lloyd et al (2005) provide evidence for this phenomenon. They find that there are
substantive differences in schooling for boys and girls in Pakistan. Public primary schools are
segregated by gender. There is anecdotal evidence that for a long time the government would
build one girls school for every two boys schools. This is reflected by a higher proportion of
sampled villages with no primary school access for girls than is the case for boys. The type and
quality of schools, where available, also differ with girls being more likely to be taught in Urdu
and teachers in girls schools being more likely to have less training and have a higher rate of
absenteeism.
Differential returns to human capital investment could also come through conditions in the
labour market. There is considerable evidence for differential wages across genders in many
countries. Behrman et al (1986) state “in many societies female earnings are found to be less
than male earnings even after controlling for differences in work experience, hours worked, and
human capital investments in schooling,” (p. 33). For example, Singh (1996) finds average daily
real wages in agriculture for females were lower than those for males in all 16 states studied.
Although they find declining average wage differentials over the 1970s and 1980s, the wage
differentials were in some cases quite large. For example, female wages were only 64% of male
wages in Tamilnadu.
There is also a large theoretical literature which studies the effects of parental preference of
one child on human capital, with or without other types of gender bias. The literature suggests
that in the presence of parental preference for one child, the parent will value the utility of the
119
favoured child more than that of any other, i.e. it will hold a greater weight in the parent‟s utility
function. If children gain utility from consumption then the parent will want a greater level of
consumption for the favoured child compared to other children. This happens because they need
to equate the marginal utilities they receive from giving consumption to each child to optimise
their allocation. The greater weight on the favoured child‟s utility ensures a greater marginal
utility for the parent from the favoured child‟s consumption of an equal amount to another child.
Davies and Zhang (1995) set up a two period model where parents live for one period and
can decide the level of investment in each of their children‟s education and the level of bequest
for each child. A parent‟s utility is a function of their own consumption in the first period, their
children‟s consumption in the second period when they become adults and the number of
children of each gender they have. If the son‟s and daughter‟s consumption do not enter the
parental utility function symmetrically there is said to be pure sex preference. They find that
“with pure preference for sons and no differential earnings opportunities for children, parents
invest the same human capital in sons and daughters but give more physical capital to sons in the
form of bequests,” (p.801). This happens because parents equate marginal returns on investment
for both children. Since earnings functions are identical, they spend the same amount on
education for all children. Given that consumption must be greater for sons, they find it must be
the case that sons get a greater bequest.
Davies and Zhang (1995) also analyse the implications of differential earnings opportunities.
A child is said to have better earnings opportunities if their average and marginal payoff to
human capital investment are greater than for the other child. They examine cases where non-
negative bequests bind and where they do not, plus cases where there is pure sex preference or
not.
In an unconstrained, no pure sex preference situation, consumption is equal across children.
The child with greatest earning opportunities gets more human capital investment and the child
with less favourable earnings opportunities receives a greater bequest. Human capital
investments in this case are privately efficient and do not depend on wealth. When bequest
constrains are binding, the gender with better earnings opportunities consumes more, but
receives no bequest and relative human capital investments are ambiguous. Human capital
investments can then depend on wealth and the child with better earnings opportunities may
120
receive less education. When pure preference for boys is introduced, son‟s relative consumption
and bequests tend to rise and their human capital investments will also rise if they were initially
inefficiently low. Davies and Zhang (1995) suggest that in societies where bequest constraints do
not bind gender differentials in schooling are linked to non-taste factors, but where constraints do
bind they can be attributed, in part, to pure sex preference.
These issues of gender bias can also be explored in a bargaining framework. Pasqua (2005)
outlines a unitary model, a non-cooperative model and a cooperative model of household
decision making to explain lower education for girls compared to boys in developing countries.
The latter two move away from the unitary model traditionally used and allow for parents to
have different preferences. In the non-cooperative model parents have separate spheres based on
traditional gender roles. Each parent chooses their contribution to each child‟s education given
their spouse‟s contribution. The Nash-Cournot equilibrium is where best response functions are
solved simultaneously. In the cooperative model, each parent takes the non-cooperative separate
spheres outcome as their threat point and spouses Nash bargain from here. Pasqua (2005)
concludes that household investment favours boys since investment in boys is less costly and
more productive, due to market factors. Moreover, they suggest traditional women‟s roles and a
parental preference for boys could widen the educational disparity. Clearly, in bargaining
frameworks decision making power of the husband and wife could be important if they have
different preferences towards their children, for example, wives may favour daughters.
The effect of gender bias on fertility has also been studied widely. In developing countries
children are often seen as a means of old age insurance for parents (Ray (1998)). If parents are
determined to have a boy survive to support them, then they will need to have more children than
they would otherwise have done to have a good chance of any child surviving. The additional
children will put extra strain on parental resources. This means there is a greater chance that
some of the children will have to work to meet subsistence needs than is the case without gender
bias regarding fertility.
While there is a large literature on the implications of gender bias on children, there do not
seem to be any studies that link this into a child labour framework.
121
Theories of child labour
There are a large number of theories of child labour. Basu (1999) and Edmonds (2007) provide a
comprehensive summery of these theories. From their analysis it is clear that there are many
factors which can influence the occurrence of child labour.
If one takes a simple cost-benefit approach to a parent‟s decision over their child‟s time
allocation, then assuming a school of the right grade exists and education and work are the two
possible uses of a child‟s time, then the decision can be simply described as follows. Attending
school imposes direct costs on the family, for example, transportation costs to get to school and
the purchase of educational materials. These direct costs will obviously depend largely upon how
close the nearest school is and the infrastructure or transport available. There are also indirect
costs of schooling through the child‟s foregone wage income or use by the family. The indirect
costs could depend upon a number of factors. For example they can depend on: the child‟s
ability; the job opportunities available to them in the market; or their use on the family farm
which could depend upon land size and crop seasonality amongst other things.
The benefits on the other hand can be seen as the return to schooling. This can differ
according to the level of education undertaken; the quality of the school or the teachers; what is
taught; and the impact on job opportunities or marriage opportunities as a result. In summary,
there are a wide number of factors that are likely to be important. In particular children are more
likely to work if there is not a school nearby, or the wage differential for educated compared to
less well educated children is low. If the return to schooling is very low then there will be very
little incentive to send children to school.
Social norms may underlie many of these factors and so the effects of particular features will
differ across countries and even across regions of the same country. In some areas there may be
a stigma attached to having children work. Basu (1999) suggests this stigma can reduce the
parent‟s utility when their child works. However, the loss of utility will be smaller if many other
children work, since the stigma cost is lower. This, Basu (1999) suggests, can yield the result that
if all parents send their child to work then it is worth-while for each parent to send their child to
work; and if no one sends their child to work each parent may not find it worth-while to send
their child to work, as the stigma cost is so high.

122
Importantly, there are a number of gender issues which can come into play. Traditional
gender roles may, for example, make it more likely that girls will be depended upon for
undertaking domestic chores or providing childcare for younger siblings. If there is gender
discrimination in the labour market, so earnings for females are lower, then this can have two
affects: it reduces the opportunity cost of schooling a girl now, but it also reduces the return to
their education. The balance of these effects will depend upon the degree of discrimination in
wages for children and adults. Cultural practices over marriage may be significant too. If a girl
joins her husband‟s family upon marriage then her own parents may find little return to their
investment in her education.
Many explanations of child labour are based on the prevalence of poverty and suggest that
increased incomes may reduce the existence of child labour. Edmonds and Pavcnik (2005)
outline four ways improvements in family incomes can potentially affect child labour. Firstly,
child labour may be a bad in the family‟s welfare function, so as incomes improve, parents will
choose to have their children work less. Secondly, with diminishing marginal utility of income,
the value of the marginal contribution made by the child will fall. Thirdly, higher family incomes
may facilitate the purchase of substitutes to child labour e.g. agricultural machinery, which
would lower the return to child labour within the household. Fourthly, children‟s productivity in
schooling may increase if increased income allows the purchase of more educational materials.
Children may be sent to work, because their family needs their contribution of income. If
parents would prefer their children did not work, but cannot manage this in their economic
environment, then credit may greatly affect children‟s outcomes. This situation could arise for
many reasons. A family‟s permanent income may be too low, so they may have few assets to
borrow against. Alternatively, there may be a lack of institutions that allow families to borrow.
One situation where access to credit could be particularly useful is when there is a temporary
shortfall in income, e.g. due to crop failure or the household head being made unemployed.
Access to credit could have implications beyond an increase in current children being
allowed to attend school. Basu (1999) illustrates a dynamic model which has two stable steady
state equilibria: one where a poor parent makes their child work full-time, the child gains few
skills and so earns little as an adult and also has to send their children to work – a child labour
trap; and one where the child goes to school and earns an adequate amount as an adult to be able
123
to send their child to school – a virtuous cycle. This explanation suggests that action is required
to reach the tipping point and then child labour should decline rapidly without further action.
One other important intergenerational effect is that of fertility. Ray (1998) explains many
reasons why the number of births chosen by parents can exceed the socially optimum number. In
particular the private choice of fertility by parents is likely to be high to ensure children survive
until adulthood to support parents in old age. It is possible that the number of births is to some
extent endogenous and follows from the actions of previous generations, as with the child labour
trap. The large number of children born can stretch a family‟s resources further and so make it
more likely some of the children will need to work.
We shall now focus on a few of the most prominent models of child labour which capture
some of these arguments formally and could potentially be extended to consider gender issues.
The first of these is Basu and Van (1998) who develop a model with the possibility of multiple
equilibria in the labour market and show the implications of this for a ban on child labour. They
make two essential assumptions: the luxury axiom, that there is a critical adult wage such that the
household will send its children to work only if the prevailing market wage is less than the
critical level; and the substitution axiom, that child and adult labour are perfect substitutes after
an equivalence correction is made. These are sufficient to give a model with the potential for
multiple equilibria. Adults always work and if the wage for adults is below a critical level then
children will also work.
They show that there can be more than one stable equilibrium; one where children work and
one where they do not. In this case of two equilibria, a total ban can jolt the labour market from
the bad equilibrium to the good equilibrium. If the withdrawal of child labour raises adult wages
so that they exceed the previous adult wages plus child wages then households will be better off.
There can be cases where there is only one equilibrium; that where it is necessary for children to
work. This is possible in very poor countries where labour is very unproductive. In this case a
total ban can worsen the situation for working households. In either case, Basu and Van (1998)
show partial bans are likely to cause a deterioration in labour conditions. They note that the
response of boy and girl labour to changes in labour market conditions can be very different, so
possible extensions to their model may be worthwhile.
124
Baland and Robinson (2000) develop a model to consider the efficiency implications of
parents‟ decisions regarding their children‟s time allocation. They set out a two period model
where parents are altruistic towards their identical children and choose levels of child labour,
bequests and savings to maximise their parental utility. In the model, bequests and savings are
constrained to be non-negative.
They find that if savings and bequests are interior then the utility maximising level of child
labour is efficient. However, if bequests or savings are at a corner solution then the level of child
labour is inefficiently high. They conclude that “child labour is inefficient when it is used by
parents as a substitute for negative bequests (to transfer income from children to parents) or,
because of capital market imperfections, as a substitute for borrowing (to transfer income from
the future to the present)” (p.678). This model treats children as identical and therefore cannot, at
present, pick up the impacts of gender difference.
Horowitz and Wang (2004) extend Baland and Robinson (2000)‟s model to allow for
specialisation among heterogeneous children. They give each child a “talent” parameter, where a
more talented child acquires a larger second period human capital stock for a given investment
than a less talented child (where human capital is a function of just education time and talent).
They consider bilateral altruism and allow borrowing.
Horowitz and Wang (2004) show that efficiency requires the equalisation of marginal rates
of return to education across children. This implies that the more talented child receives more
education since, with increasing and concave human capital functions, the more talented child
will have a higher rate of return for a given level of investment. This, they argue, could be
beneficial for both children by the rationale of comparative advantage in the presence of suitable
transfers. However, they find that if bequests are at corner solutions then efficiency does not
hold, since if parents are not able to balance second period utilities through bequests, they adopt
a second-best strategy of adjusting their children‟s human capital stocks. They therefore equalise
marginal utility returns to education, which creates a more egalitarian distribution of human
capital than is efficient. Horowitz and Wang (2004) state that if the more talented child‟s
absolute advantage in human capital accumulation is sufficiently large they may actually receive
less education than their less talented sibling i.e. there could be reverse specialisation.
125
All the above models employ a unitary household structure, in which there is only one
decision maker or parents have identical preferences. A number of bargaining models have also
been developed to explain household decision making. These can allow for more than one
decision maker and different preferences of individuals. As seen in Section 3 bargaining models
can involve two parents with different preferences. In the area of child labour there are also
models where a parent and a child bargain (intra-household) or a parent bargains with a child‟s
employer (extra-household).
Basu (1999) develops such a model with a parent and a child, based on Moehling (1995)‟s
collective model. A person‟s bargaining power here depends on the wage they can earn or how
much income they bring into the household. Child labour supply is thus a function of the adult
and child wage rates available in the market.
In all the above models, parents are altruistic. Gupta (2000) develops a model in which
parents are selfish and do not care about their child‟s welfare. This is the model‟s striking
difference from the majority of theories of child labour. The parent bargains with the child‟s
employer over the child‟s wage and the fraction of the wage that is paid in the form of food to
the child. The wage component is assumed to be spent by the parent for their own gain. The
parent and the employer Nash bargain using the income they would receive if the bargain failed
as their threat point. While this model is likely to be applicable for some cases, it is not likely to
generalise well, since parents are often shown to care for their children. Bargaining between the
employer and parent also wouldn‟t translate well to the case where children work on their family
farm or within their home which are common cases, as shown in Table 1. Even in the child
participated in market work, the parent is unlikely to have this much influence on employers in
many cases.
To summarise, there are many models of child labour which capture different aspects of the
problem, but none of these models analyse gender difference in child labour. To do so, we
extend the model of Baland and Robinson (2000), as this captures the parent‟s decision of child
time allocation, bequests and savings and allows for evaluation of the efficiency of the resulting
allocation.

126
The model
The model consists of two periods; , one good and a large number of identical families.
In the first period there are parents, , with one male child, , and one female child, . Parents
live for both periods and in the second period children become adults. In both periods parents
supply labour inelastically; providing efficiency units of labour. In the first parents allocate
each of their children‟s single unit of time between two activities: labour and schooling. and
represent the fraction of the child‟s time allocated to work for the male and female child
respectively, with and . As well as deciding the children‟s time allocation,
parents also decide how much to save, , in the first period. It is assumed that parents cannot
borrow, so . This is appropriate for very poor parents who have no collateral or who live in
areas where credit markets are weak, both of which could hold in a developing country context.
In the second period parents receive interest on their savings with a gross interest rate of
and can decide how much to give each of their children as a bequest, and for the male and
female child respectively. Bequests are required to be a transfer towards children from parents
not vice versa so and , i.e. there is one sided altruism. In the second period
children are now adults and supply their labour inelastically. The units of efficiency labour an
adult possesses, i.e. their human capital, depend on the fraction of their time endowment they
worked as a child. In particular a male has human capital of and a female has human
capital of . functions are assumed to be the same between males and females and are
strictly decreasing and strictly convex in and respectively.
It is assumed that labour markets are competitive and so wages represent marginal products.
Production technology is assumed to be linear and male and female child labours are assumed to
be perfect substitutes. Linear technology implies constant marginal products, and perfect
substitution implies equal wages across genders. We normalise wages to one. Linear technology
also implies that partial equilibrium effects are also representative of general equilibrium effects.
Parents‟ utility depends on their consumption in both periods and the utility enjoyed by their
children in the second period. Children derive utility from their own consumption in the second
period. Parents have a joint utility function over their consumption in both periods and
,

127
and the welfare of their children in the second period, and , where and
are identical functions. For simplicity, the consumption of children in the first period is not
included. Its addition would not alter the first order conditions and main results.
Diverging from Baland and Robinson (2000), parents can place a different weight on each
child‟s welfare and . These reflect the level of parental altruism to each child and are such
that and . It shall be assumed that so there is parental gender
bias and parents prefer the male child, as supported by evidence in Section 3. Utilities in the
second period are discounted by a discount factor, , to reflect their present value and is
assumed to be separable so that:
( ) (
) ( ) (1)
where , and are twice continuously differentiable, strictly increasing and strictly
concave.
Parents maximise their inter-temporal joint utility by choosing , , , , and
subject to the following four budget constraints, taking prices (wages and interest rate) as given:
(2)
(3)
(4)
( ) (5)
Equation (2) states that parents can consume in period one an amount equal to the sum of
labour incomes from their own and their child‟s work less the amount they choose to save for the
next period. (3) indicates that parents can consume in the second period an amount equal to their
total income, comprising their own labour income plus their saved income and interest on this,
minus the amount they choose to give in bequests to their children. (4)/(5) indicate that the
male/female child‟s second period consumption is equal to their second period total income from
their bequest and the return on their second period labour. The return is the amount of human
capital they possess since wages are normalised to one.
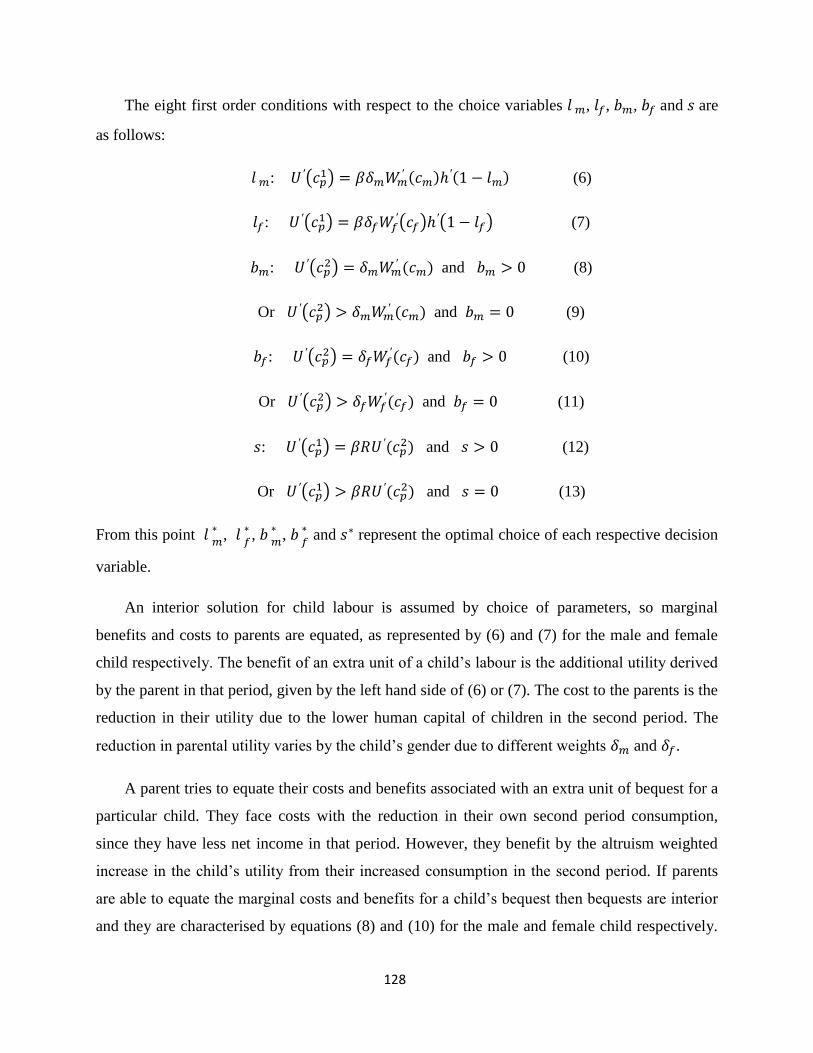
128
The eight first order conditions with respect to the choice variables , , , and are
as follows:
: ( )
(6)
: ( )
( ) ( ) (7)
: ( )
and (8)
Or ( )
and (9)
: ( )
and (10)
Or ( )
and (11)
: ( )
and (12)
Or ( )
and (13)
From this point
, ,
,
and represent the optimal choice of each respective decision
variable.
An interior solution for child labour is assumed by choice of parameters, so marginal
benefits and costs to parents are equated, as represented by (6) and (7) for the male and female
child respectively. The benefit of an extra unit of a child‟s labour is the additional utility derived
by the parent in that period, given by the left hand side of (6) or (7). The cost to the parents is the
reduction in their utility due to the lower human capital of children in the second period. The
reduction in parental utility varies by the child‟s gender due to different weights and .
A parent tries to equate their costs and benefits associated with an extra unit of bequest for a
particular child. They face costs with the reduction in their own second period consumption,
since they have less net income in that period. However, they benefit by the altruism weighted
increase in the child‟s utility from their increased consumption in the second period. If parents
are able to equate the marginal costs and benefits for a child‟s bequest then bequests are interior
and they are characterised by equations (8) and (10) for the male and female child respectively.
129
If however, the marginal costs for a particular child‟s bequest exceed the marginal benefits to the
parent then a corner solution results, with bequest for that child at zero. This is represented by
equations (9) and (11) for the male and female child respectively. The bequest for a child is most
likely to be at a corner solution when the parents‟ second period income is low or the altruism
weight for that child is low.
The benefit to a parent from an extra unit of saving is the discounted marginal utility from
the returns on their savings they obtain in the second period. The cost of this extra unit of saving
is the marginal utility they forego through reduced consumption in the first period. If parents can
equate the marginal costs and benefits to saving then equation (12) will hold and savings will be
positive. If, however, marginal costs to savings exceed the marginal benefits a corner solution
will result with savings at zero. It is clear that savings are more likely to be at a corner solution if
is small. That is if parents discount the future heavily.
Analysis of these first order conditions yields interesting results as to the possible
differential treatment of children by gender. The condition implies that the male child
must consume more than the female child, i.e. , if parents‟ utility is to be maximised. It
is clear that is not consistent with parental utility maximisation since the marginal
utility for the male child would be at least as great as for the female child
.
Together with , this implies
. That is that the marginal parental
benefit of switching one unit of consumption from the female child to the male child would
exceed the marginal parental cost.
Turning to efficiency, the child time allocations are efficient if no one can be made better off
without someone else being made worse off. In the model there are three types of agents:
parents, children and, implicitly, firms. As will be discussed in Section 7, the level of child
labour for child is efficient if . In this case it is not possible to increase
one agent‟s utility without lowering another agent‟s utility. However, when there
is the possibility to increase the utility of child without reducing the welfare of parents and
firms. In this case child ‟s labour is inefficiently high.

130
The child labour and bequest decisions by parents and the efficiency of these decisions can
be analysed by utilising a number of important cases.
Case 1: ,
and
When all choice variables have interior solutions the optimisation is characterised by
equations (6), (7), (8), (10) and (12). From equations (8) and (10) it is clear
which when substituted into (6) and (7) and rearranged yields the result
( ). From this it can be seen that child labour allocations must be equal across genders,
, since functions are identical. To ensure it must therefore be the case that
. This is a striking result: parents with gender bias towards their son will have each child
work an equal amount, but ensure greater consumption for their son by providing him with a
greater bequest when bequests and savings are all interior.
Combining (6), (8) and (12) yields the result . Thus the level of child labour
for the male child is efficient. Since (
) the same is true for the female
child. Therefore, all child time allocation decisions are efficient. These findings are summarized
in proposition 1.
Proposition 1: If and are all at interior solutions then
,
and and
are
efficient.
Case 2: ,
and
The second possible case is that where bequests are interior but savings are at a corner
solution. This is characterised by equations (6), (7), (8), (10) and (13). Following the same
method as in the first case equations (6), (7), (8) and (10) can be used to show that
( ) and
. Since it must still be the case that it is necessary again that
.
Combining (6), (8) and (13) yields the result . Since
( )
it must be that ( ) as well. Hence, the levels of male and female child labour are both
inefficiently high. Positive bequests to each child, but zero savings does not alter the result from

131
Case 1; that children of different genders work equal amounts, and the male child receives a
greater bequest. However, the lack of savings makes the level of child labour for both children
inefficiently high, since the inefficiency result comes straight from (13). The reason for this
inefficiency is that the marginal utility of consumption for parents in the first period is high
relative to the second period marginal utility of consumption. Parents therefore want to obtain
more income in the first period, so their children work an inefficiently great amount. These
results are summarized in proposition 2.
Proposition 2: If are at interior solutions, but is at a corner solution then
,
, but
and are inefficiently high.
Case 3:
and
The third possible case is that both children‟s bequests are zero, but savings are interior.
This case is characterised by (6), (7), (9), (11) and (12). Since must hold and bequests
are equal to zero, it must be true that
. This ensures that the male child has higher second
period income and consumption.
Combining (6), (8) and (12) yields the result that the male child‟s level of child labour is
inefficiently high, . Since the level of female labour supply exceeds that of the
male child, it must be the case that the female child‟s labour supply is inefficiently high as well.
The reason for inefficiency is that parents value their second period consumption higher than the
consumption of their children. These findings are summarized in proposition 3.
Proposition 3: If
and then
and both and
are inefficiently
high.
Case 4:
and
The fourth case is where the male child receives a positive bequest, but the female child
does not. With interior savings this corresponds to equations (6), (7), (8), (11) and (12).
Combining (6), (7), (8) and (11) yields the result (
). This implies that
, since is strictly decreasing and convex in and . This result shows that having a
zero bequest for just one child is sufficient to generate the unequal allocations of child labour.

132
Combining (6), (8) and (12) yields the result that the male child‟s level of child labour is
efficient, . Since,
( ) and level of male child labour is
efficient, it must be that marginal return to human capital accumulation of the female child
exceeds the market rate of return. Hence, more human capital accumulation and less child labour
is needed for efficiency for the female child. That is the female child‟s level of child labour is
inefficiently high. The reason for this inefficiency is that parents value their second period
consumption higher than the consumption of their female child. These results are summarized in
proposition 4.
Proposition 4: If
and then
and is efficient and
is inefficiently
high.
There are four remaining cases one can conceptualise. However, these do not add to our
results significantly. Firstly, if savings and bequests are at corner solutions then it follows that
the level of child labour of the female child will exceed that of the male child and child labour
will be inefficiently high. Similarly, in the case of zero savings with a positive bequest for the
male child and a zero bequest for the female, the same results would occur. The final two cases
one can consider involve the bequest for the female child exceeding that for the male child, with
either zero of positive savings. Using the first order conditions we can show that in our model,
this cannot happen.
Overall, we see that as long as parents can provide each child with a positive bequest it is
optimal for parents to have each child work the same fraction of their time, and ensure the
greater consumption of the male child in the second period through a greater bequest. If the
bequest for at least one child is zero then the female child is expected to work a greater fraction
of her time than the male child, given the assumption of preference towards boys. These are
striking results.
These results have flavour of some of the findings of Davies and Zhang (1995). They
propose that if children have the same earnings opportunities (which we have assumed so far)
then parents invest the same human capital in sons and daughters, but give a greater bequest to
the son (the preferred gender in their model). There are, however, important differences between
our model and that of Davies and Zhang (1995). Firstly, the issue in question is different. Child
133
labour is at the forefront in our model. Child labour arises, in part, due to poverty. Children are a
seen as a potential source of income and their contribution to family income in the first period is
very important. This is not captured in models of human capital without child labour. Secondly,
in our model parents live for two periods and can save for the second period.
In our model, corner solutions are associated with inefficient levels of child labour. This is
also true in Baland and Robinson (2000), who state that inefficient allocations can occur when
parents fail to fully internalise the negative effects of child labour. This occurs when bequests are
zero or capital markets are imperfect, which implies savings cannot be negative when this would
be optimal. This model extends the efficiency results of Baland and Robinson (2000) and shows
that the level of child labour for one child may be efficient compared to the market return while
the other is not. This can occur if one child has a positive bequest and the other does not.
It is worth noting that the factors that cause gender difference in child labour are different
from the factors which cause inefficiency of child labour. In particular, the gender difference
comes purely from a lack of bequests whereas inefficiency of child labour is linked to corner
solutions for bequests or savings. The model implies that if policy makers are interested in
resolving gender differences in child labour, focusing on the bequest to the female child is most
sensible. If ensuring efficiency is also a goal then facilitating saving may also play a role. The
model also shows that even if child time allocations are equal across genders there may be
discrimination, since the female child may receive less bequest and have less consumption
(utility).
Discussion
This section discusses how our model links with other relevant theories and how the results
compare. It also outlines potential extensions to the model. Firstly, our model assumes parental
gender bias, but homogeneous earnings functions across genders i.e. male and female children
have the same human capital accumulation functions and earn the same wage per efficiency unit
of labour. The gender bias literature (as summarised in section 3) also highlights two other forms
of gender bias: differential prices of human capital accumulation and labour market
discrimination. Both of these types of gender bias cause differences in earnings functions across
134
genders. One can use Horowitz and Wang (2004) to analyse the implications of such gender
biases.
Secondly, our model uses just the input of education time into human capital accumulation.
However, some of the human capital literature on gender bias focuses on physical investments.
For example, Davies and Zhang (1995) assume that human capital accumulation depends on the
investment of physical capital. One can imagine physical capital investments such as in books
and uniforms could indeed be inputs to human capital accumulation. We outline here how the
two approaches could be combined into a more general human capital accumulation function.
Differential earnings functions
In our model the earnings function for adult in the second period is .
To this point wages have been identical and normalised to one, so the earnings function has
simply been the human capital accumulation function. We shall first consider the possibility of
different prices/cost of human capital accumulation. Price/cost differentials could occur when
children of different gender attend separate schools. In this case the child who attends the poorer
quality school must put in more time to education to achieve the same results, effectively raising
the cost of education through foregone income.
This case can be analysed using the model of Horowitz and Wang (2004) now dividing
children by gender. The "talent" parameter may be interpreted as a measure public
investment in schooling for gender or the quality of their school. Human capital accumulation
functions are now denoted ) where is education time, which as before is assumed to be
time not spent in work i.e. . functions are assumed to be the same across children,
are increasing in and strictly increasing and strictly concave in .
Efficiency requires ( ) . That is the marginal returns to
investment must be equal across possible investments. If one now assumes better schooling for
boys, as supported by evidence from Lloyd et al (2005) then . This case is depicted in
Figure 2. It is clear that at the same amount of education time for each child, say , the marginal
return would be greater for the male child. Say that the marginal return to the female child's
education at is equal to , then for efficiency to hold the male child must undertake more

135
education until the point at which his marginal return to education equals that of his sister and
the market rate of return. This level is shown at in Figure 2. If the male child undertakes more
education it must be the case that he undertakes less work than his sister. This produces an
entirely different result to our model of preference based gender bias.
Figure 2
Comparing results across models for interior solutions where efficiency holds shows this
neatly. In our model with only parental preference for boys, Case 1 showed that ,
and . Boys consumed more as a result of parental preference towards them, but
child labour allocations were equal across genders, since parents were able to ensure
consumption differentials through adjusting bequests. In the present case with only differences
across schools, not parental preferences, the efficient result is , and .
Consumption levels are equal across genders, since parents value utility to each child equally.
If one child had more consumption, and a correspondingly lower marginal utility of
consumption, parents would raise their own utility by shifting consumption from the child with
more consumption to the other child until marginal utilities across children are equalised.
Consumption levels would therefore be equalised. Since boys gain a greater rate of return to any
particular level of education than girls, it is optimal for them to work less, so as to increase their
education time until marginal rates of return are equalised across genders. To allow equal
𝑒 𝑒
𝑒
𝑎𝑓 𝑒𝑓
𝑎𝑚 𝑒𝑚
𝑒′(𝑎𝑓 𝑒𝑓) 𝑅
𝑒′ 𝑎𝑚 𝑒𝑚 𝑅
′ 𝑎𝑚 𝑒𝑚 𝑅
136
consumption given boys gain greater human capital in the first period, it must be the case that
female children are given a greater bequest in the second period.
Testing which of these results are present in real life is an empirical matter. There is evidence
that our model is appropriate in at least some regions. Davies and Zhang (1995) analyse data
from five villages in the Philippines. They find the difference in years of schooling is not
significantly different across genders and on average sons received 60% more inheritance than
daughters. They conclude this is evidence of fairly strong pure sex preference. It is also strong
evidence to support our model.
Difference in earnings functions through labour market discrimination produces identical
results to the case presented above. One can assume that human capital accumulation functions
are identical and there is no parental gender bias, but and are different. This means that
children of different gender earn a different wage per efficiency unit of capital. In particular we
shall assume in line with the empirical evidence presented in Section 3. Earnings
functions are now for . Essentially, this is the same situation as with
different prices of human capital accumulation: the male child yields a greater return to any level
of education. The results from the previous case therefore apply again and it will be efficient for
the male child to work less than the female child, but receive a smaller bequest to ensure equal
consumption levels across children.
Parental gender bias and physical capital investment in education
So far human capital accumulation has depended on the child's input of time to education.
However, our model could be generalised to include spending on education e.g. on books, as
well as investment of time to education. Suppose that the human capital accumulation function
depends on physical capital investment and education time , so . Also
suppose that is strictly increasing and strictly concave in and and that is homogeneous
of degree one, so constant returns to scale exists. The same parental utility function (14) would
then be maximised subject to budget constraints (15), (16), (17) and (18) with and
becoming additional choice variables.
( ) (
) ( ) (14)
137
(15)
(16)
(17)
( ) (18)
Parents can pay for their children's educational inputs in the first period and children will
receive higher incomes in the second period based on this investment. It is now possible that
children can pay for their own education through child labour which is a useful addition since
some authors have suggested some level of child labour may actually help children attend
school. Patrinos and Psacharopoulos (1997), for example, question "whether working actually
makes it possible for the children to go to school," (p.398). It is possible that working children
earn enough to cover incidental expenses such as uniforms and books, which could enable them
to stay in school.
One can conjecture that efficiency in this extended model will be characterised by
( ) and
( ) . That is that the marginal rate
of return to physical capital investments will be equal across children and equal to the market
rate of return; and that the marginal rate of return to education time will be equal across children
and equal to the market rate of return. Obviously, the marginal rates of return on physical capital
investments and time investments will also be equal. This suggests that in an interior, efficient
case the following should result: , and therefore . Intuitively, if parents
favour the male child then to ensure his greater consumption they would give their children
differential bequests rather than different levels of education.
Policy implications
This model provides implications as to how policy can tackle two potential goals: achieving
efficiency in the case of inefficiently high child labour; and reducing gender differences in child
labour. We shall first consider efficiency.
A marginal ban on child labour could increase efficiency. Baland and Robinson (2000) show
that when child labour is inefficiently high a marginal ban on child labour leads to Pareto

138
improvement. Horowitz and Wang (2004) derive the same result with heterogeneous children.
The reason is that a marginal ban does not affect parents‟ or firms‟ welfare, but increases child
welfare.
Parents equate the marginal costs and benefits of child labour, so a one unit reduction in child
labour does not affect them. It would, however, affect the child if their level of child labour was
inefficiently high. If inefficiency arose due to bequests being at a corner for child then
. A reduction in due to a marginal ban raises the consumption of child . When
bequests are at a corner parents cannot lower bequests to compensate for the reduction in child
labour. If inefficiency arose due to savings being at a corner then . There is no
longer a link between parents‟ first period actions and their second period income. Parents will
therefore not adjust bequests in the second period in light of the marginal ban in the first period,
so child consumption will rise.
Targeted income transfers may also play a role by affecting parental consumption. The
source of the inefficiency is important in this case. If inefficiency arises due to bequests at the
corner then providing parents a transfer in their old age will be the most effective. This is seen
from equation (9) or (11) for the male or female child respectively. The marginal utility loss to
parents from their reduced second period consumption exceeds the marginal benefits of
providing a bequest, so no bequest is given. Raising parents‟ second period consumption will
reduce their marginal cost of bequest towards the marginal benefit, so changing the outcome
towards the efficient level.
On the other hand, if inefficiency arises due to savings at the corner, as characterised by (13),
then a transfer to parents in the first period when they have young children would be most useful.
(13) shows that the marginal utility of first period consumption for parents is too high for relative
to the second period. If the first period consumption could be raised by a transfer then the
marginal utility of first period consumption would fall.
Income transfers would need financing. Lump sum taxation would not change the efficient
level of child labour, so the transfers described would reduce child labour towards the efficient
level. External aid can also be used to finance such income transfers. However, financing
transfers through distortionary taxation would alter the first order conditions and change the
optimal response of parents. In this case, the efficient level of child labour would change and it is
not clear whether child labour would increase or decrease.
139
The efficient level of child labour for each child could itself be changed by policy. For
example, anything that reduces the market rate of return, , will reduce the efficient level of
child labour for each child. This can be seen from the condition for efficiency:
for . If falls then must also fall to maintain efficiency. This means
must increase, hence
must decrease. That is that for the return to education to fall, children
must be undertaking more education and working less.
The efficient level of child labour will also vary with changes in the marginal return on
human capital. If say the quality of schools improves through public expenditure on education
(financed by lump sum taxation or external aid) then the marginal return, , increases.
This means children gain a greater rate of return for each unit of education. For a given level of
children must now undertake more education and less work for an efficient allocation.
In terms of gender difference, our model with parental preference for the male child suggests
girls will work more than their brothers if parents do not have enough income to give their
daughter a bequest. If the bequest for the male child is positive, but the bequest for the female
child is at a corner then the model implies an increase in parental income will reduce female
child labour.
Recently the ILO has been focusing a lot on reducing child labour particularly among girls
(IPEC (2009)). One way of achieving this goal is to provide a (proportional) scholarship to
female children. Such a scholarship would increase the net cost of child labour and so reduce
child labour for female children.
In the case that male children having better earnings opportunities, which we considered in
Section 6, female children are expected to work more than their brothers in the efficient case.
This can be due to either labour market discrimination or a lower price/cost of human capital
accumulation for male children. Any measure that reduces the earnings function differential will
reduce the difference in child labour across genders. For example, labour market measures or
possibly wider measures that improve the importance of women in society could raise the
relative wages of women. If the price of human capital accumulation differs by gender, measures
to improve the quality of education for girls will be important.
Finally, measures to reduce preference for male children, for example through cultural
change and education, would raise the welfare of female children.

140
Conclusion
The model developed in this essay generalises a theory of child labour to treat children of
different gender separately. This is something which has not been done previously despite its
benefits in improving understanding of gender differences in child labour. The model assumes
parental bias towards one gender which is supported by consumption and child health data for
many societies. The model predicts that if bequests are positive, the amount of child labour for
each child should be equal. However, if at least one child does not receive a bequest then the less
favoured child will work more. These findings could be tested empirically using household level
survey data, including information on child work hours and bequest level, for families with a boy
and a girl child.
We find that child labour allocations are inefficiently high for a child if their bequest is at a
corner or parental savings are at a corner. A partial ban on child labour or income transfers to
parents could improve efficiency. The source of inefficiency is important, as it affects the
appropriate timing of any transfer. The efficient level of child labour itself can be altered, for
example, by increasing public investment in schooling. Gender differences in child labour can
also be tackled. In particular, increases in parental income or scholarships for girls are likely to
improve the situation for the female child.
We have compared the results of our model to those that would arise in the efficient case
with other forms of gender bias. The form of gender bias turns out to have very important
implications. The model could be extended to nest other forms of gender bias, so different
combinations of gender bias could be considered together, since it is likely different forms could
occur at the same time. The model could also take on different forms of human capital
accumulation function e.g. including physical capital. Fully solving this extension is left for
further work. It should also be possible to further extend the model to include bilateral altruism.
There are a number of complex factors which are linked with gender differences in child
labour. Not all of these can be studied from the current model. Family composition, for example,
may play an important role. Edmonds (2007) indicates many studies suggest that having an older
sister increases a boy or girl‟s chances of going to school (Parish and Willis (1993), Edmonds

141
(2006) and Morduch (2000)). Therefore, younger and older girls in the same family may have
different experiences of child labour.
A parent‟s activities or income may impact upon children differently. Basu (1999) cites
evidence of an inverted-U relation between adult female wages and child labour, especially for
the female child. As a mother‟s wages start to rise she may find it worthwhile to start work
outside the household and the daughter may be taken out of school to cover childcare or
domestic responsibilities. As wages rise further, help can be hired. Basu (1999) also notes
differential effects of adult female and male wages on their children‟s outcomes. In a bargaining
framework higher incomes for mothers might lead to different allocations across children than
that of fathers, since each parent has their own preferences. These nuances provide interesting
areas for further research.
142
References
Baland, J. M. and Robinson, J. A. (2000) “Is Child Labour Inefficient?” Journal of Political
Economy, Vol. 108, No. 4, pp. 663-679
Basu, K. (1999) “Child Labour: Cause, Consequence, and Cure, with Remarks on International
Labour Standards” Journal of Economic Literature, Vol. XXXVII, pp. 1083-1119
Basu, K. and Van, P. H. (1998) “The Economics of Child Labour” The American Economic
Review, Vol. 88, No. 3, pp. 412-427
Behrman, J. R., Pollak, R. A. and Taubman, P. (1986) “Do Parents Favor Boys?” International
Economic Review, Vol. 27, No. 1, pp. 33-54
Ben-Porath, Y. and Welch, F. (1976) “Do Sex Preferences Really Matter?” Quarterly Journal of
Economics, Vol. 90, No. 2, pp. 285-307
Chamarbagwala, R. and Ranger, M. (2007) “A Multinomial Model of Fertility Choice and
Offspring Sex-Ratios in India” Center for Applied Economics and Policy Research, Economics
Department, Indiana University Bloomington, Caepr Working Papers: 2007-022
Davies, J. B. and Zhang, J. (1995) “Gender Bias, Investments in Children, and Bequests”
International Economic Review, Vol. 36, No. 3, pp. 795-818
Edmonds, E. V. (2006) “Understanding Sibling Differences in Child Labour” Journal of
Population Economics, Vol. 19, No. 4, pp. 795-821
Edmonds, E. V. (2007) “Child Labour” NBER Working Paper 12926. Now published in Schultz,
T. and Strauss, J. (2008) Handbook of Development Economics, Vol. 4, Ch 11
Edmonds, E. V. and Pavcnik, N. (2005) “Child Labour in the Global Economy” Journal of
Economic Perspectives, Vol. 19, No. 1, pp. 199-220
Gangadharan, L. and Maitra, P. (2000) “Does Child Mortality Reflect Gender Bias? Evidence
from Pakistan” Indian Economic Review, Vol. 35, No. 2, pp. 113-131
Gupta, M. R. (2000) “Wage Determination of a Child Worker: A Theoretical Analysis” Review
143
of Development Economics, Vol. 4, No. 2, pp. 219-228
Hazarika, G. (2000) “Gender Differences in Children‟s Nutrition and Access to Health Care in
Pakistan” The Journal of Development Studies, Vol. 37, No. 1, pp. 73-92
Horowitz, A. W. and Wang, J. (2004) “Favorite son? Specialized child laborers and students in
poor LDC households” Journal of Economic Development, Vol. 73, No. 2, pp. 631-642
IPEC (2006) “Global Child Labour Trends 2000 to 2004” ILO, SIMPOC, Geneva
IPEC, UWC (2006) “Child Labour in the Latin American and Caribbean Region: A Gender
Based Analysis” ILO, Roma
IPEC (2009) “Give girls a chance. Tackling child labour, a key to the future” ILO,
GenevaKoohi-Kamali, F. (2008) “Intrahousehold Inequality and Child Gender Bias in Ethiopia”
World Bank Policy Research Working Paper 4755
Leung, S. F. (1991) “A Stochastic Dynamic Analysis of Parental Sex Preferences and Fertility”
Quarterly Journal of Economics, Vol. 106, No.4, pp. 1063-1088
Lloyd, C. B., Mete, C. and Sathar, Z. A. (2005) “The Effect of Gender Differences in Primary
School Access, Type, and Quality on the Decision to Enroll in Rural Pakistan” Economic
Development and Cultural Change, Vol. 53, No. 3, pp. 685-710
Moehling, C. M. (1995) “The Intra-household Allocation of Resources and the Participation of
Children in Household Decision-Making: Evidence from Early Twentieth Century
America” mimeo, North-western University
Murdoch, J. (2000) “Sibling Rivalry in Africa” American Economic Review, Vol. 90, No. 2, pp.
405-409
Parish, W. And Willis, R. (1993) “Daughters, Education, and Family Budgets: Taiwan
Experiences” Journal of Human Resources, Vol. 28, No, 4, pp. 862-898
Pasqua, S. (2005) “Gender Bias in Parental Investments in Children‟s Education: A Theoretical
Analysis” Review of Economics of the Household, Vol. 3, No. 3, pp. 291-314

144
Patrinos, H. A. and Psacharopoulos, G. (1997) “Family Size, Schooling and Child Labour in
Peru: An Empirical Analysis” Journal of Population Economics, Vol. 10, No. 4, pp. 387-405
Ray, D. (1998) “Development Economics” Princeton University Press
Singh, R. D. (1996) “Female Agricultural Workers‟ Wages, Male-Female Wage Differentials,
and Agricultural Growth in a Developing Country, India” Economic Development and Cultural
Change, Vol. 45, No. 1, pp.89-123
Tarozzi, A. and Mahajan, A. (2007) “Child Nutrition in India in the Nineties” Economic
Development and Cultural Change, Vol. 55, No. 3, pp. 441-486