humidity effects on wire insulation breakdown strengthhumidity effects on wire insulation breakdown...
TRANSCRIPT
SANDIA REPORT SAND2013-7392 Unlimited Release 08/2013
Humidity Effects on Wire Insulation Breakdown Strength Leah N. Appelhans Prepared by Sandia National Laboratories Albuquerque, New Mexico 87185 and Livermore, California 94550
Sandia National Laboratories is a multi-program laboratory managed and operated by Sandia Corporation, a wholly owned subsidiary of Lockheed Martin Corporation, for the U.S. Department of Energy's National Nuclear Security Administration under contract DE-AC04-94AL85000. Approved for public release; further dissemination unlimited.

2
Issued by Sandia National Laboratories, operated for the United States Department of Energy by Sandia Corporation. NOTICE: This report was prepared as an account of work sponsored by an agency of the United States Government. Neither the United States Government, nor any agency thereof, nor any of their employees, nor any of their contractors, subcontractors, or their employees, make any warranty, express or implied, or assume any legal liability or responsibility for the accuracy, completeness, or usefulness of any information, apparatus, product, or process disclosed, or represent that its use would not infringe privately owned rights. Reference herein to any specific commercial product, process, or service by trade name, trademark, manufacturer, or otherwise, does not necessarily constitute or imply its endorsement, recommendation, or favoring by the United States Government, any agency thereof, or any of their contractors or subcontractors. The views and opinions expressed herein do not necessarily state or reflect those of the United States Government, any agency thereof, or any of their contractors. Printed in the United States of America. This report has been reproduced directly from the best available copy. Available to DOE and DOE contractors from U.S. Department of Energy Office of Scientific and Technical Information P.O. Box 62 Oak Ridge, TN 37831 Telephone: (865) 576-8401 Facsimile: (865) 576-5728 E-Mail: [email protected] Online ordering: http://www.osti.gov/bridge Available to the public from U.S. Department of Commerce National Technical Information Service 5285 Port Royal Rd. Springfield, VA 22161 Telephone: (800) 553-6847 Facsimile: (703) 605-6900 E-Mail: [email protected] Online order: http://www.ntis.gov/help/ordermethods.asp?loc=7-4-0#online

3
4
SAND2013-7392 Unlimited Release
08/2013
Humidity Effects on Wire Insulation Breakdown Strength
Leah N. Appelhans Organic Materials
Sandia National Laboratories P.O. Box 5800
Albuquerque, New Mexico 87185-MS0888
ABSTRACT
Methods for the testing of the dielectric breakdown strength of insulation on metal wires under variable humidity conditions were developed. Two methods, an ASTM method and the twisted pair method, were compared to determine if the twisted pair method could be used for determination of breakdown strength under variable humidity conditions. It was concluded that, although there were small differences in outcomes between the two testing methods, the non-standard method (twisted pair) would be appropriate to use for further testing of the effects of humidity on breakdown performance. The dielectric breakdown strength of 34G copper wire insulated with double layer Poly-Thermaleze/Polyamide-imide insulation was measured using the twisted pair method under a variety of relative humidity (RH) conditions and exposure times. Humidity at 50% RH and below was not found to affect the dielectric breakdown strength. At 80% RH the dielectric breakdown strength was significantly diminished. No effect for exposure time up to 140 hours was observed at 50 or 80%RH.

5
ACKNOWLEDGMENTS Thanks to Don Lifke and Brian Rutherford for suggestions and advice on the statistical analyses. Thanks to Sam Lucero and Rob Sorensen for help with humidity testing setup and design. Thanks to Henry Korellis for designing and building the wire twisting device and the twisted wire test apparatus. Thanks to Don Bradley and Garth Rohr for twisted wire sample preparation.

6
TABLE OF CONTENTS
Abstract............................................................................................................................................ 4
Acknowledgments ........................................................................................................................... 5
Introduction ..................................................................................................................................... 7
Results: Part I .................................................................................................................................. 8 Immersion Method .................................................................................................................... 8 Twisted Wire Method .............................................................................................................. 10 Comparison of Methods .......................................................................................................... 12
Conclusions: Part I ........................................................................................................................ 14
Results: Part II ............................................................................................................................... 15 Effect of Humidity ................................................................................................................... 15 Effect of Equilibration Time ................................................................................................... 18
Conclusions: Part II ....................................................................................................................... 22
Wire Insulation Performance ......................................................................................................... 23
Methods ......................................................................................................................................... 25 Wire Stripping ............................................................................................................... 25 Thickness Measurements .............................................................................................. 25 Sample Preparation ....................................................................................................... 25 Humidity Control .......................................................................................................... 27 Dielectric Breakdown Strength Testing ........................................................................ 28
References ..................................................................................................................................... 31
Distribution .................................................................................................................................... 32

7
INTRODUCTION
The ASTM standard method for DC breakdown strength testing of wire insulation, based on ASTM standard D3032-10 “Standard Test Methods for Hookup Wire Insulation” (immersion method) requires immersion of the wire sample in a salt bath and is obviously incompatible with testing under different humidity conditions. An alternative ASTM standard D1676-03 “Standard Test Methods for Film-Insulated Magnet Wire” (twisted pair method) is compatible with variable humidity conditions but is designated only for AC breakdown strength testing. The first part of this study aimed to compare the two test methods to determine if the twisted pair method yielded similar results to the ASTM immersion method and could be used for further DC breakdown studies with confidence that the results would be comparable to standard ASTM methods.
The second part of the study used the twisted pair method to measure the dielectric breakdown strength of twisted pair samples at a range of different relative humidity conditions and exposure times.
8
RESULTS: PART I
In the first part of the study the twisted pair and immersion methods were compared. The dielectric breakdown strengths of 117 wire samples were tested, 75 samples by the immersion method, and 42 samples by the twisted pair method. In addition several variations in sample length and preparation were compared in the process of optimizing the two methods.
Immersion Method The ASTM standard D3032-10 “Standard Test Methods for Hookup Wire Insulation” calls for a
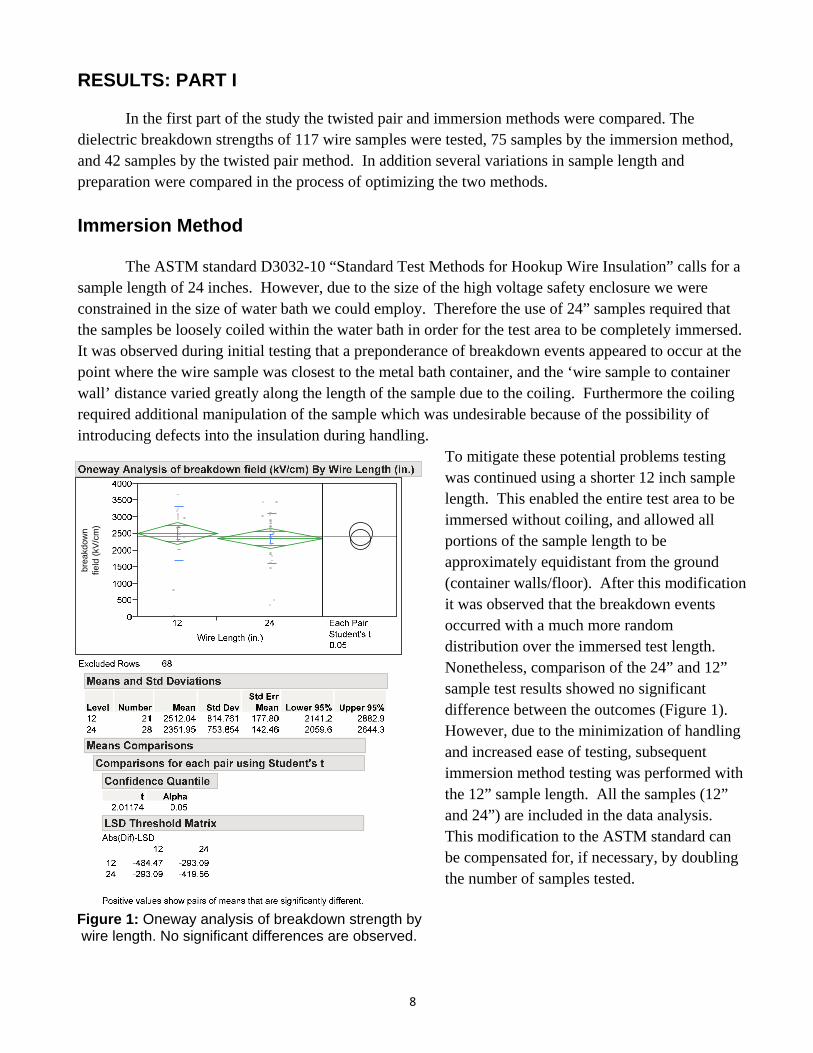
sample length of 24 inches. However, due to the size of the high voltage safety enclosure we were constrained in the size of water bath we could employ. Therefore the use of 24” samples required that the samples be loosely coiled within the water bath in order for the test area to be completely immersed. It was observed during initial testing that a preponderance of breakdown events appeared to occur at the point where the wire sample was closest to the metal bath container, and the ‘wire sample to container wall’ distance varied greatly along the length of the sample due to the coiling. Furthermore the coiling required additional manipulation of the sample which was undesirable because of the possibility of introducing defects into the insulation during handling.
To mitigate these potential problems testing was continued using a shorter 12 inch sample length. This enabled the entire test area to be immersed without coiling, and allowed all portions of the sample length to be approximately equidistant from the ground (container walls/floor). After this modification it was observed that the breakdown events occurred with a much more random distribution over the immersed test length. Nonetheless, comparison of the 24” and 12” sample test results showed no significant difference between the outcomes (Figure 1). However, due to the minimization of handling and increased ease of testing, subsequent immersion method testing was performed with the 12” sample length. All the samples (12” and 24”) are included in the data analysis. This modification to the ASTM standard can be compensated for, if necessary, by doubling the number of samples tested.
bre
akd
ow
nfie
ld (
kV/c
m)
Figure 1: Oneway analysis of breakdown strength by wire length. No significant differences are observed.

9
Immersion samples were tested in three different batches, on different days, with disassembly and setup of the testing apparatus between each batch. Figure 2 shows that there are no significant differences between sample batches indicating that the method is robust and has good reproducibility. Figure 2: Oneway analysis of breakdown strength by immersion method.

10
Twisted Wire Method
In the twisted wire method samples a different method of stripping the wire was introduced and comparisons made to ensure no significant change in dielectric breakdown strength values observed as a result. The two methods used to strip the insulation were blade stripping and flame stripping (see Methods section for details). No significant differences in the mean values are observed (Figure 3). Figure 3: Oneway analysis of dielectric breakdown strength for blade stripping (MCA1-9) versus flame stripping (MCA1-10).
Although the distribution does appear wider for the flame stripped samples (MCA1-10) than for the blade stripped samples (MCA1-9) analysis of the Weibull distribution shows that the shape parameter
() of the two distributions are not statistically significantly different (Figure 4).
brea
kdow
nfie
ld (
kV/c
m)

11
Figure 4: Distributions of dielectric breakdown strength for flame stripped (MCA1-10) versus blade stripped (MCA1-9) samples tested by the twisted wire method.

12
Comparison of Methods
Comparison of the results of the immersion method versus the twisted pair method are shown in Figure 5 and show small but significant differences between the mean values of the two methods. Figure 5: Oneway analysis of dielectric breakdown strength by method.
0
500
1000
1500
2000
2500
3000
3500
4000
Immersed Twisted
Identifier
Each PairStudent's t0.05
ImmersedTwisted
Level7542
Number2471.682748.40
Mean722.300360.438
Std Dev83.40455.617
Std ErrMean
2305.52636.1
Lower 95%2637.92860.7
Upper 95%
Means and Std Deviations
1.98081t
0.05Alpha
Confidence Quantile
TwistedImmersed
-267.1740.76
40.76-199.93
Abs(Dif)-LSDTwisted Immersed
Positive values show pairs of means that are significantly different.
LSD Threshold Matrix
Comparisons for each pair using Student's t
Means Comparisons
Oneway Analysis of breakdown field (kV/cm) By Identifier

13
When the Weibull distributions are considered it is apparent that there is no statistically significant difference between the scale (α) parameters of the two results (Figure 6). However, there is a
statistically significant difference in the shape parameter () between the two. Figure 6: Weibull distribution of breakdown strength for the immersed and twisted pair methods.
The difference in the shape parameter can be attributed to the greater number of low field breakdown events observed in the immersion method. The observation of a higher number of low field breakdown events in the immersion method versus the twisted pair method is readily understood by considering the differences between the two methods.
In the immersion method the entire test area of the wire is in contact with the ground of the circuit, that is the salt bath and the grounded conductive container. In contrast, in the twisted pair method, one wire is the source and one wire is the ground, thus the only contact between source and ground occurs where the two wires are physically touching one another. This means that the total test

14
area (i.e. the total area of insulation that could complete the circuit by undergoing a breakdown event) is much larger in the immersion method than in the twisted pair method. This essentially correlates to having a larger sample size for the immersion method, since more area of insulation is tested for each individual wire sample. The larger the test area, the more likely it is that a flawed area or weak spot is included within the test area, leading to a low breakdown. It is expected that with larger sample sizes some low field breakdowns events would be observed even with the twisted pair method.
In addition, the immersion method requires breakdown of only a single layer of insulating material to complete the circuit, while in the twisted pair method breakdown must occur through two layers of wire insulation, one for each wire of the pair. This is essentially the same as having a double layer of dielectric in a capacitor. As is well known, a double layer provides a greater increase in dielectric strength than a single layer that is twice is thick. This is related to the lowered probability in a double layer for two defects to be coincident. It would be expected that in testing a double layer (twisted pair) versus single layer (immersion) fewer low breakdown events would be observed. Note that the breakdown values are reported as fields (kV/cm) so the difference in the thickness of the dielectric with one versus two layers is accounted for in the calculation.
Finally, the immersed samples are tested immersed in a salt solution. As shown in Part II humidity correlates with a decrease in dielectric breakdown strength. Thus it is likely that some of the decrease in dielectric breakdown strength observed for the immersed samples versus the twisted pair samples is due to the experimental conditions and not only test area and double layer effects.
CONCLUSIONS: PART I
Despite the small differences in dielectric breakdown strength distributions determined by using the twisted pair method versus the immersion method, the twisted pair method will still serve as a satisfactory alternative to the immersion method for DC dielectric breakdown strength testing in conditions of variable humidity. Twisted pair breakdown strength values at different humidity levels can be compared to each other to determine if humidity is detrimental to breakdown performance. It will simply be necessary to take into account, in the use of the results, that the twisted pair method does not satisfactorily detect low breakdown strengths, and, therefore, that results may be used as relative comparisons, but should not be used to determine allowable use parameters or operating limits etc.
Reduced sample length was not observed to create any statistically significant difference in results using the immersion method. If comparison to other results obtained by exactly following the ASTM standard method (24” samples) is required it is recommended that the sample size (n) of 12” samples be doubled to ensure a comparable total test area.
Stripping the contact portions of the wires by the blade or flame method was not observed to create any statistically significant difference in results using the twisted pair method; both methods are acceptable, although the flame method was preferred due to reduced incidence of wire rupturing during the twisting procedure.

15
RESULTS: PART II Effect of Humidity In Part II of this study the twisted wire method was used to compare dielectric breakdown strength of twisted wire pairs measured at different relative humidities and determine if humidity has a significant impact on dielectric breakdown strength. In addition the effect of exposure time to high humidity was studied to determine if time spent at elevated humidity had a significant impact on dielectric breakdown strength. A total of 186 twisted pair samples were tested at four different relative humidity (RH) conditions; ~6% RH, ~27% RH (ambient), ~50% RH, and ~80% RH. The exact humidity at time of testing varied as shown in Table 1. Table 1: Sample size (N) and mean and standard deviations for humidity values. humidity group N mean st. dev.
6 30 6.4 1.9
27 42 27.4 2.5
50 54 51.1 3.5
80 60 82.5 3.2
Analysis of all samples, disregarding equilibration time (that is, how long the samples were exposed to the humidity conditions), shows that dielectric breakdown strength is affected by the relative humidity. Note that the test chamber is equilibrated after loading the sample so all samples have a minimum exposure time to the test chamber humidity of ≥ 15 minutes.
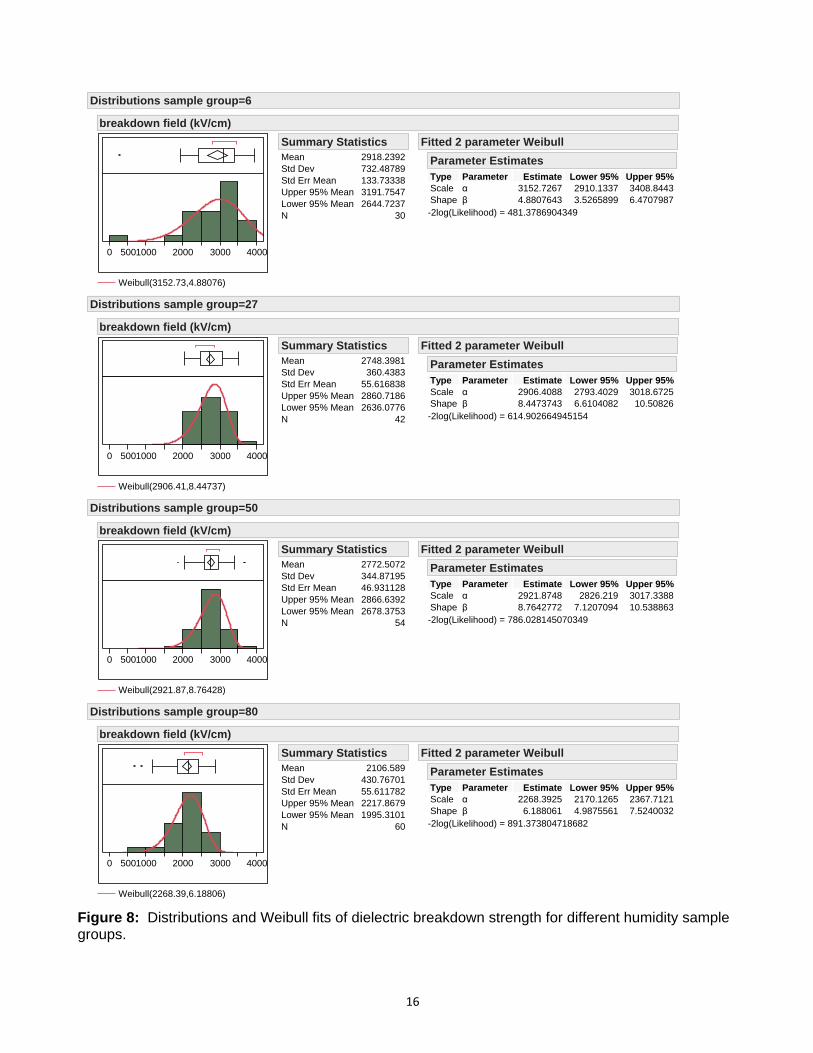
Figure 7: Weibull distributions and Weibull plots for dielectric breakdown strength (field kV/cm) at different humidities, for all equilibration times. The dielectric breakdown strength of the 80% RH test group, defined here as the Weibull α parameter, is statistically significantly lower than the other three test groups. A non-parametric test, the Wilcoxon Group Homogeneity test (Figure 7) also determines the 80% RH group to be statistically significantly different than 6% RH, 27% RH, and 50% RH test groups as shown by the p-value<<0.001 (Prob>ChiSq in Figure 7). Experimental distributions and Weibull fits to each of the humidity test groups are shown in Figure 8.
16
Figure 8: Distributions and Weibull fits of dielectric breakdown strength for different humidity sample groups.
0 5001000 2000 3000 4000
Weibull(3152.73,4.88076)
MeanStd DevStd Err MeanUpper 95% MeanLower 95% MeanN
2918.2392732.48789133.733383191.75472644.7237
30
Summary Statistics
ScaleShape
Typeαβ
Parameter3152.72674.8807643
Estimate2910.13373.5265899
Lower 95%3408.84436.4707987
Upper 95%
-2log(Likelihood) = 481.3786904349
Parameter Estimates
Fitted 2 parameter Weibull
breakdown field (kV/cm)
Distributions sample group=6
0 5001000 2000 3000 4000
Weibull(2906.41,8.44737)
MeanStd DevStd Err MeanUpper 95% MeanLower 95% MeanN
2748.3981360.4383
55.6168382860.71862636.0776
42
Summary Statistics
ScaleShape
Typeαβ
Parameter2906.40888.4473743
Estimate2793.40296.6104082
Lower 95%3018.672510.50826
Upper 95%
-2log(Likelihood) = 614.902664945154
Parameter Estimates
Fitted 2 parameter Weibull
breakdown field (kV/cm)
Distributions sample group=27
0 5001000 2000 3000 4000
Weibull(2921.87,8.76428)
MeanStd DevStd Err MeanUpper 95% MeanLower 95% MeanN
2772.5072344.8719546.9311282866.63922678.3753
54
Summary Statistics
ScaleShape
Typeαβ
Parameter2921.87488.7642772
Estimate2826.219
7.1207094
Lower 95%3017.338810.538863
Upper 95%
-2log(Likelihood) = 786.028145070349
Parameter Estimates
Fitted 2 parameter Weibull
breakdown field (kV/cm)
Distributions sample group=50
0 5001000 2000 3000 4000
Weibull(2268.39,6.18806)
MeanStd DevStd Err MeanUpper 95% MeanLower 95% MeanN
2106.589430.7670155.6117822217.86791995.3101
60
Summary Statistics
ScaleShape
Typeαβ
Parameter2268.39256.188061
Estimate2170.12654.9875561
Lower 95%2367.71217.5240032
Upper 95%
-2log(Likelihood) = 891.373804718682
Parameter Estimates
Fitted 2 parameter Weibull
breakdown field (kV/cm)
Distributions sample group=80

17
When the 80% RH group is excluded there is ‘no-to-borderline’ statistical difference between the 6% RH, 27% RH, and 50% RH groups, depending on which significance level is used. The p-value is 0.0824. For a 0.05% significance level, which is what is used elsewhere in this report, this is not a statistically significant difference.
Note that the 6% RH test group had one very low failure. This failure is similar to several low failures that were observed in the ‘immersion’ group tests and it is not believed that it is an anomaly. This single low failure observed in the twisted wire group and the three low failures (<550 kV/cm) observed in the immersion tests are likely due to an infrequently occurring defect that is more difficult to detect in the twisted wire test setup than the immersion method, due to the much smaller surface area tested in the twisted wire test. In the immersion tests any defect on the entire immersed surface of the wire will be detected, whereas in the twisted wire tests a defect must be on or near the contact area between the two strands of wire to cause a breakdown event that leads to failure. Furthermore the immersion method tests the insulation of only a single wire whereas in the twisted wire test the insulation of both wires must undergo breakdown for a breakdown event to be detected. The twisted wire test is essentially testing a double-layer capacitor, which further reduces the likelihood of a very low failure due to defects because a defect must be present in both layers. It is fairly surprising that even one failure such as this was detected in the twisted wire sample groups.
However, the fact that this failure occurred in the 6%RH group may be coincidental and it is likely that the failure would have occurred at a very low voltage independent of humidity. The low failure skews the Weibull plot significantly leading to a much lower β parameter for the 6% RH group than the other lower humidity groups. In order to give an idea of the effect of the low failure on the 6% RH group 6, 27, and 50% RH groups are re-analyzed, excluding the low failure, to determine if any significant differences exist between the humidity groups in the absence of the potentially ‘defect-induced’ low failure.
If the comparison of the three lower humidity groups is repeated, excluding the low failure from the 6% RH group, then a borderline statistically significant difference between the 6% RH group and the 27% and 50% RH groups is evident (non-parametric Wilcoxon, p-value (Prob>ChiSq) is <0.05 but >0.001), with the 6% RH group having a slightly higher dielectric breakdown strength (see Figure 9 and Table 2).
Figure 9: Weibull plot of 6%, 27% and 50% RH groups and Wilcoxon Group Homogeneity test showing borderline statistical significance when low failure in the 6% group is excluded.

18
The differences between the groups are small with or without the low failure in the %6 RH group. As the exclusion of that data point is based on speculation only, the analysis including the low failure is statistically more sound. The authors include the analysis without the low failure only to show the effects on the Weibull distribution and parameters of the 6% RH group and to aid the qualitative evaluation of differences between the humidity groups. For quantitative classification the complete data set should be used and will be used in the remainder of this report. Table 2: Weibull α and β parameters for humidity test groups. The ‘%6 RH*’ group is with the low failure removed. humidity group Weibull α Weibull β
6% RH 3153 4.9 6% RH* 3232 6.6 27% RH 2906 8.4 50% RH 2922 8.8 80% RH 2268 6.2
The comparison of the different humidity test groups show that humidity does not have a
significant effect at the 5% significance level on dielectric breakdown strength at 50% RH and below, disregarding equilibration time. Humidity of 80% RH does have a statistically significant effect (even at the 0.1% significance level) on dielectric breakdown strength, decreasing it by more than 600 kV/cm compared to ‘ambient’ (27% RH). The next section examines the effect of equilibration time on dielectric breakdown strength.
Effect of Equilibration Time For the 50% RH and 80% RH groups a range of equilibration times ranging from 15 min to >140 hours were studied (Figure 10). Equilibration effects were not studied in the 6% RH group, and equilibration times for the ambient group are difficult to define, since the samples are stored at ambient.
a) b) Figure 10: a) Histograms of equilibration time (in hours) for 50% RH and 80% RH groups. b) More
detailed histograms of 0-20 hrs bin for 50% RH and 80% RH groups.

19
In order to understand the effects of equilibration time on dielectric breakdown strength a number of analyses were carried out. First, the 50 and 80% RH groups were divided into subgroups of ‘equilibration time < 0.5’ (hours) and ‘equilibration time >0.5’. The ‘equilibration time <0.5’ subgroup is then compared to the complete 6% RH and 27% RH groups (in which all samples had an equilibration time <0.5 hrs). The results are shown in Figure 11. There are still statistically significant differences between the 80% RH group and the other three groups (Wilcoxon p-value <0.0001 see Figure 11), and no statistically significant differences between the 50, 27, and 6% RH groups (Wilcoxon p-value = 0.0824).
Figure 11: Weibull plots of 50% RH and 80% RH <0.5 hrs subgroups compared to complete 6% and 27% RH groups.
Figure 12: Weibull plots of 50% RH and 80% RH >0.5 hrs subgroups compared to complete 6% and 27% RH groups.
The 50% and 80% RH >0.5 hrs subgroups are also compared to the complete 6% and 27% RH groups (Figure 12). Again, the 80% RH group remains statistically significantly lower, while no significant differences exist between the other three groups.
Finally, the 50 and 80% RH <0.5 hrs and >0.5 hrs subgroups are compared. If equilibration time has a significant effect on dielectric breakdown strength it would be expected that a statistically significant difference between these two distributions would exist. As can be seen in Figure 13 and Figure 14 no statistically significant difference exists between the subgroups for either 50% RH (p-value = 0.9364) or 80% RH (p-value = 0.1067) at the 5% significance level.

20
Figure 13: Weibull plot of dielectric breakdown strength for equilibration time <0.5 hrs and >0.5 hrs subgroups of 50% RH test group.
Figure 14: a) Weibull plots of dielectric breakdown strength for equilibration time <0.5 hrs and >0.5 hrs subgroups of 80% RH test group. b) The same plots with the parametric (Weibull) 95% confidence intervals plotted, showing the overlap of CI’s for the two distributions. Although these analyses strongly support the conclusion that equilibration time does not affect dielectric breakdown strength, they are comparing arbitrarily grouped subsets of the data. Another method of comparison is a bivariate plot of dielectric breakdown strength versus equilibration time within each humidity range. As can be seen in Figure 15 and Figure 16 linear fits of breakdown field versus equilibration time are not statistically significant (p-value >0.05) for either the 50% RH or the 80% RH groups. Similar bivariate fits were examined for each equilibration time subgroup alone, for both 50% RH and 80% RH, and no statistically significant dependencies were found. The single explanatory variable ‘leverage plots’ in Figure 16 show these conclusions graphically. The red-dotted lines indicate the confidence intervals for the linear least squares fit, the solid line. The horizontal blue-dotted line represents the ‘null hypothesis’ that is, the fit if the parameter of interest has no effect. If the confidence boundaries do not cross the ‘null hypothesis’ line, then the slope parameter is not statistically significantly different from zero, meaning that the explanatory parameter of interest (humidity or equilibration time) does not have a statistically significant effect on the outcome (breakdown strength).
Show Nonparametric CI
Show Parametric CI
0.02
0.04
0.060.08
0.120.16
0.22
0.300.380.480.600.720.820.900.96
1000900800700600 2000 3000
breakdown field (kV/cm)
<0.5>0.5
equilibration
2.601839ChiSquare
1DF
0.1067Prob>ChiSq
Wilcoxon Group Homogeneity Test
Nonparametric Overlay

21
Figure 15: Linear fits of breakdown field vs. equilibration time for 50% RH and 80% RH groups. For both groups the p-value (Prob>F) is >>0.05 indicating no statistically significant correlation between dielectric breakdown strength and equilibration time.
a) b) Figure 16: Leverage plots of a) breakdown strength versus equilibration time at 50% RH b) breakdown strength versus equilibration time at 80% RH c) breakdown strength versus equilibration time for entire data set and d) breakdown strength versus humidity for complete data set.
Leverage plots can also be used to test for interactions between multiple explanatory variables. An interaction exists if the magnitude of effect of an explanatory variable (A) on the outcome is affected by the value of another explanatory variable (B). In this case, for example, the magnitude of the effect of humidity on the dielectric breakdown strength could depend on the equilibration time. In a cross term leverage plot the null hypothesis (blue line) is that there is no interaction. If the fit line is not statistically significantly different than the null hypothesis (confidence interval lines do not cross the null hypothesis line) then there is no interaction between the two explanatory variables modeled in the
2000
2500
3000
3500
brea
kdow
n fie
ld (
kV/
cm)
Leve
rage
Res
idua
ls
0 50 100 150
equilibration timeLeverage, P=0.3067
Leverage Plot
500
1000
1500
2000
2500
3000
brea
kdow
n fie
ld (
kV/
cm)
Leve
rage
Res
idua
ls
0 50 100 150
equilibration timeLeverage, P=0.7691
Leverage Plot

22
cross leverage plot. Cross leverage plots for humidity and equilibration time for the 50% RH and 80% RH groups alone, for the 50%RH and 80% RH groups together, and for the complete data set are shown in Figure 17. These show that there is no interaction between humidity and equilibration time, reinforcing the conclusion that equilibration time does not have any effect on dielectric breakdown strength under these experimental conditions. Note that in these plots the x and y-axes scales do not relate to an experimental value.
a) b)
c) d) Figure 17: Cross leverage plots of humidity*equilibration time for a) 50% RH group b) 80% RH group c) 50 and 80% RH groups combined and d) the complete data set. All show a non-significant interaction.
CONCLUSIONS: PART II In summary, Part II of this study has determined that there is a statistically significant effect of humidity on dielectric breakdown strength, as measured by twisted pair testing. There are no statistically significant effects of equilibration time (time spent at humidity) on dielectric breakdown strength for humidities of 50 and 80% RH. In addition, there is no statistically significant change in the dielectric breakdown strength of twisted wire pairs at or below 50% RH compared to ambient or lower humidity values. Based on these results humidity exposure at ≤50% RH is not expected to have a detrimental effect on dielectric breakdown strength. At 80% RH a decrease in dielectric breakdown strength (as measured by the α parameter of a Weibull distribution) of >600 kV/cm compared to ambient
brea
kdow
n fie
ld (
kV/
cm)
Leve
rage
Res
idua
ls
brea
kdow
n fie
ld (
kV/
cm)
Leve
rage
Res
idua
ls
brea
kdow
n fie
ld (
kV/
cm)
Leve
rage
Res
idua
ls
brea
kdow
n fie
ld (
kV/
cm)
Leve
rage
Res
idua
ls

23
(27%RH) is observed. However, no additional effect on dielectric breakdown strength of continued exposure to 80% RH, or 50 % RH, up to 140 hours was observed. These results suggest that, while exposure to 80% RH does significantly decrease dielectric breakdown strength, the physical changes to the system which result in this change occur quickly (≤15 min) and do not vary over extended exposure to humidity (up to ~140 hrs). It is important to note that these results are for twisted wire samples where there is ample air flow around the wires and no geometric or spatial confinement that could lead to local trapping of humidity. If the wires are in a confined area or complex geometry where many small interstitial spaces exist, the effects of humidity, and particularly of extended exposure, may be different. WIRE INSULATION PERFORMANCE In the combined study, including both immersion testing and twisted wire testing, there were seven sample points which were statistical outliers, meaning that they fell more than 1.5 times the interquartile range below the first quartile (Figure 18). These samples all failed at fields of <900kV/cm (Table 3). These points are of particular importance in determining the overall performance of the wire insulation in that these low failure points will be the ‘weakest links’ in an extended system. It seems likely that these low failures occur at defect sites in the insulation, which may be macroscopic physical defects or microscopic contamination, compositional, or chemical defects. Notably, the majority of these low breakdown events are observed under high humidity (immersion or 80% RH) conditions. These observations suggest two possible explanations; 1) high humidity increases the likelihood of detecting defects or 2) high humidity exacerbates defects that would not cause low failures under ‘normal’ (low humidity) conditions. These two explanations are not exclusive and both could be factors.
Figure 18: Distribution histogram, box plot, and Weibull fit for all data (immersion and twisted wire). In the box plot, red circles (●) are from the “immersion” group, blue open circles (○) are from the “80% RH” group, and blue solid circles (●) are from the “6% RH” group.

24
Table 3: Low failures, all data sets.
sample group breakdown
field (kV/cm) immersed 51.7 6% RH 277.8
immersed 348.1 immersed 516.4 80% RH 670.3 immersed 789.9 80% RH 873.8
From the available data it is not possible to determine if the increased number of low breakdowns observed at high humidities is due to high humidity increasing the number of low breakdowns, or high humidity increasing the likelihood of detecting a low breakdown. However, the existence of one low failure in the 6% RH test group does suggest that there is some population of defects that can lead to low breakdown values regardless of humidity levels. There is not sufficient data to state with confidence whether or not this population is increased at 80% RH.
It is impractical to use the twisted wire data to estimate a defect density due to a number of factors including; the small area tested, the ‘double layer’ nature of the testing, and the variable humidity conditions. However, an estimated defect density can be calculated from the immersion tests. The total length of wire tested in the immersed test group was 665 inches. This consists of 47x12” tests in which the immersed length was 7” and 28x24” tests in which the immersed length was 12”. Four low failures were observed in this test group, giving an estimated defect density of approximately one defect per 166 inches of wire. This may be an overestimate if high humidity does increase the occurrence of low breakdown events as well as the detection of such events, but it can provide a conservative (high) estimate for performance reliability purposes.

25
METHODS Nitrile gloves are worn at all times when handling samples. Samples should be handled gently and bending, kinking, or other activities that may damage the insulation should be avoided. Wire Stripping Two methods were employed for stripping the wires, blade stripping and flame stripping. Blade stripping: The wire is placed on a flat surface between two 0.005” stainless steel shims. A flat edge razor blade was placed with the length of the blade perpendicular to the wire and then scraped along the area to be stripped. The wire was rotated and the process repeated until all the insulation was removed. Flame stripping: A butane lighter is used to char the insulation. The charred insulation is then removed with a ‘Micro-mesh 1800 grit” soft-backed emery paper, particle size 15 microns (equivalent ANSI grit 600) and then wiped with a kimwipe. Thickness Measurements The insulation thickness was measured with a micrometer and with a Measure-It-All LE 1000-2 MT12 low force model with a 10mm diameter flat tip probe. The difference in thickness between stripped and unstripped was divided by two to yield the average insulation thickness. With the micrometer the mean thickness was found to be 20 ± 2 microns and with the Measure-It-All the mean thickness was found to be 24 ± 2 microns. The thickness of 20 microns per layer of insulation was used in the calculations of dielectric breakdown strength as this was in line with the manufacturer reported insulation thickness. For the immersion tests a single ‘layer’ of insulation must breakdown for a breakdown event to be detected, so the thickness used for field calculations was 20 microns. For the twisted pair studies two layers of insulation, one on each wire, must breakdown for a breakdown event to be detected, so a total thickness of 40 microns was used for field calculations. Sample Preparation Immersion Method 24” Samples: A 24” piece of wire is cut. A 1-1 ½” area is stripped on both ends of the sample. The wire sample is shaped into a loop by gently wrapping around a 2” diameter Teflon rod and twisting the stripped ends together. The stripped ends are then placed into the probe tip holder (see breakdown strength testing section). The wire sample is loosely bent up (perpendicular to the direction of the loop) and gently coiled so it will fit inside the salt bath. A gap of approximately 3” is left between the probe tip and the surface of the salt bath. Note that the ASTM standard calls for a 6” gap, but due to the constraints if the HV setup it was not possible to test with a gap this large. However, all samples were observed carefully during testing and no flashovers between the probe tip or stripped portion of the wires and the salt bath were observed. The total immersed sample length is approximately 18”.

26
12” Samples: A 12” piece of wire was cut and 1-1 ½” area at both ends stripped. The wire is shaped into a loop by gently wrapping around a 2” diameter Teflon rod and the stripped ends are twisted together and placed into the probe tip holder. A gap of approximately 2 ½” is left between the probe tip and the surface of the salt bath. No flashovers were observed. The total immersed sample length is approximately 7”. (The ASTM standard calls for an immersed sample length of 12” (24” sample length, 6” gap) so approximately twice the number of 12” samples must be tested to obtain the same total test length). Salt Solution: The salt solution was prepared as described in ASTM D3032-10 using DI water, sodium chloride, and TritonX surfactant. Twisted Wire Method
A wire twisting apparatus was built by Henry Korellis (8226, Sandia CA) (Figure 19 and Figure 20). The weighting and number of twists were determined as per ASTM D1676-03. When using blade stripping, a 25” length of wire is cut and stripped for 3” (11-14”) around the center and additionally for 1.5-2” at a distance of 3” from each end. When using flame stripping the sample length and stripping measurements are identical but are performed after the twisting. Twisted wire sample preparation was performed by Don Bradley (1835). The electrical contacts are made in the stripped portions. The unstripped tails serve as excess to hold the weights during sample and test setup. The wire loop is placed around the winding mandrel as per Figure 8 and each end weighted with a 20g weight. It was found to be much easier to twist the samples if a 3g alligator clip was attached to the weight and then the weight was attached to the wire by the alligator clip. Thus the applied weight during twisting was ~23g on each side.
Figure 19: Wire twisting apparatus.

27
a) b) Figure 20: a) Wire sample placed in twisting mandrel. b) Twisted wire sample in test apparatus.
The wire can then be twisted using a drill with a clutch stop, with the number of twists
determined by the distance of the stops and the threading of the shaft. This setup has 6 threads per inch and the stops were set at 5” to yield 30 twists. The loop at the top of the twisted wire was then cut to form the twisted pair sample. As designed the wire twisting apparatus prepares samples with 30 twists with a length of 4.75 inches for the twisted area that match the ASTM D1676-03 standard (for example see Figure 20b).
It was noted after the first stage of testing that the length of the twisted area in the samples prepared at Sandia, Albuquerque averaged 61±2 mm in length (2.4 inches) rather than 4.75 inches, due to an unintentional modification of the apparatus. See Figure 20b for an example of a twisted wire sample prepared at Sandia, California before the modification and Figure 21 for an example of a twisted wire sample prepared after the modification. The length of the twisted area in the samples prepared with the modified apparatus is shorter than the length prescribed in the ASTM standard, however the number of twists (30) is the prescribed number. It was decided to continue using the modified setup of the wire twisting apparatus for the second stage of testing so that the results of the two rounds would be comparable. However it is important to note that the samples used in the tests do not exactly match the ASTM twisted wire standard specifications. For future testing it would be preferable to use the wire twisting apparatus as originally designed and built to match the ASTM standard. Humidity Control
Dielectric breakdown strength testing under varying humidity conditions was performed using the twisted wire method as described above. The humidity test chamber and controls were built by Sam Lucero (1818). Humidity was controlled by utilizing a small test chamber with controlled air flow from a rotameter, mixing dry and saturated air streams to obtain the desired humidity. After exposure to ambient (sample loading) the chamber was allowed to equilibrate for a period of time, 10 minutes for testing at 50%RH and 20 minutes for testing at 80%RH,

28
prior to testing. The humidity was monitored using a Measurement Computing USB-502-LCD humidity logger.
For all the 80% RH and the majority of the 50%RH tests the humidity in the chamber was logged simultaneously with testing so the exact value at the test time is known. For some of the first 50% RH tests simultaneous logging was not available so the humidity was estimated by using the value for the humidity in the test chamber under identical flow conditions after an identical period of equilibration. It is expected that the ‘estimated values’ do not differ from the ‘true values’ by more than 5% (based on subsequent simultaneous logging).
The ‘ambient’ data was collected without humidity control or monitoring. Humidity measurements in an adjacent lab at the same dates/times as the data was collected were used to estimate the humidity at the time of testing. Dielectric Breakdown Strength Testing CAUTION! These tests involve high voltages. The testing apparatus should be contained within an insulating enclosure and all operators should have appropriate high voltage training.
The voltage source is a Trek High Voltage Amplifier Model 30/20A paired with an Agilent LCR meter (Model E 4980A) as the DC source.
To perform a dielectric strength test the wire sample was placed in the testing setup as described above. A Labview program controlling the LCR meter was started, ramping the voltage at a rate of 500V/s until breakdown occurs. Breakdown was detected by monitoring the current via the internal current detection circuit in the Trek high voltage amplifier.
The Labview program records a voltage and current value every 100 msec. The program detects breakdown and turns off the voltage source when the detected current exceeds 1mA. The time, source voltage, amplified voltage and current data are written to a raw data file for each individual capacitor. The breakdown voltage is the highest voltage recorded prior to the spike in current. It was determined that the breakdown voltage could be accurately selected by simply sorting the raw data file by amplified voltage and selecting the highest value. Alternatively, for confirmation, the value can be manually selected by scrolling through the data until a spike in the
recorded current 1x10⁻⁴ A is observed and selecting the voltage value corresponding to the current spike. A comparison of 50 manually retrieved values versus values obtained by the sort/highest voltage method was made and the values matched in 100% of the samples therefore voltage data is retrieved automatically for all analysis. Immersion Method
A copper plate (approximately 22x20 cm) is placed inside a high voltage safe box (acrylic, 9.5 mm thick). The ground electrode probe is connected to the copper plate by contact. A stainless steel beaker containing the salt solution is placed on top of the copper plate. The

29
source electrode probe is connected to the wire sample and the wire sample is immersed in the salt solution as described above.
Both the ground and source electrode probes are Signatone S-725 micropositioners with BNC connections. The ground probe is equipped with a Signatone SE TB Tungsten 20 mil diameter probe tip. The end of the probe tip is bent around a small diameter pair of needle nose pliers to provide a smooth, curved surface for contact to the ground. Twisted Pair Method A test holder for the twisted wire testing was built by Henry Korellis (8226, Sandia CA) similar to the apparatus found in the literature1 (Figure 4 in reference). The test holder with a wire sample loaded is shown in Figure 21. The twisted wire sample is first secured at the upper two terminals in the stripped portion of the wire. Care should be taken to approximately center the twisted portion of the sample on the test board. Once the top of the sample is clamped the bottom stripped portions of the wires should be placed in the lower terminals and weighted with 20g weights. With the wire tensioned by the attached weights the lower terminals were screwed closed and the weights removed. The wires should be guided around the outer radius of the terminals to maximize the distance between stripped portions of wire and minimize the possibility of arcing.
Figure 21: Twisted wire test apparatus with twisted wire sample loaded and with HV and ground leads attached. Note: the apparatus is placed inside an HV safe box prior to testing!
The loaded sample was then placed into the test setup and attached to the HV source and ground by the isolated terminals at the top of the test board. The test setup with test board is shown in Figure 21.
In a small number of early samples arcing between the stripped segments of the two wires was observed. These samples were not included in the analysis. This was avoided subsequently by making sure the stripped area was a minimum of 1.5” from the beginning of the twist. No arcing was observed prior to breakdown in any portion of the wire sample after this modification was made. Arcing was observed during breakdown in the twisted portion of the sample where the breakdown event occurred, but no arcing to other parts of the test setup was observed, even during the breakdown event.

30

31
REFERENCES 1. Grzybowski, S.; Taylor, C.D; Chalise, S.R.; Electrical Degradation Study of Machine
Winding Insulation, 2008 International Conference on High Voltage Engineering and Application, Chonquing, China, November 9-13, 2008, pp. 321-325

32
DISTRIBUTION 1 MS0888 Jim McElhanon 01835 (electronic copy) 1 MS9106 Sean Stieper 08266 (electronic copy) 1 MS9110 Rob Sorensen 01818 (electronic copy) 1 MS9403 LeRoy Whinnery 08233 (electronic copy) 1 MS0899 Technical Library 9536 (electronic copy)