human settlements, 2013 - national bureau of...
TRANSCRIPT

Basic Facts and Figures, 2012 on Human Settlements in Tanzania Mainland
THE UNITED REPUBLIC OF TANZANIA
TANZANIA MAINLAND
National Bureau of Statistics
Ministry of Finance
Dar-es-Salaam
December, 2013

Basic Facts and Figures, 2012 on Human Settlements in Tanzania Mainland
Tanzania; Regions, Road and Railway Networks

Basic Facts and Figures, 2012 on Human Settlements in Tanzania Mainland
iii
Table of Contents
List of Tables .................................................................................................... vi
List of Figures .................................................................................................... x
List of Maps ..................................................................................................... xii
Preface ............................................................................................................. xiii
Acronyms ......................................................................................................... xv
CHAPTER ONE............................................................................................... 1
Overview of Human Settlements Development ............................................. 1
1.0 Tanzania in Brief .............................................................................. 1
1.1 Background of Human Settlements in Tanzania ............................... 5
1.2 Concepts and Definitions of Human Settlements ............................. 7
1.3 Geographical Concepts ..................................................................... 9
1.4 Categories of Human Settlements by Population Size .................... 11
1.5 Human Settlements Indicators ........................................................ 12
1.5.1 Urbanization Trends ....................................................................... 12
1.5.2 Housing Stock ................................................................................ 13
1.5.3 Housing Facilities Indicators .......................................................... 15
1.5.4 Infrastructure Indicators ................................................................. 16
1.5.5 Social Indicators ............................................................................. 17
CHAPTER TWO ........................................................................................... 21
Population ....................................................................................................... 21
2.0 Population Density.......................................................................... 21
2.1 Rural-Urban Distribution of the Population ................................... 25
2.2 Trends of Urbanization ................................................................... 28
2.3 Child Labour ................................................................................... 29

Basic Facts and Figures, 2012 on Human Settlements in Tanzania Mainland
iv
CHAPTER THREE ....................................................................................... 31
Land Management and Administration ....................................................... 31
3.0 Introduction .................................................................................... 31
3.1 Fundamental Principles of the National Land Policy ..................... 32
3.2 Land Tenure System ....................................................................... 34
3.2.1 Granted Right of Occupancy .......................................................... 34
3.2.2 Customary Right of Occupancy ..................................................... 35
3.3 Land Disputes ................................................................................. 40
3.4 Land Use ........................................................................................ 47
3.4.1 Urban Settlement ............................................................................ 47
3.4.2 Rural Settlements ........................................................................... 47
3.5 Agriculture ..................................................................................... 49
3.5.1 Introduction .................................................................................... 49
3.5.2 Crop Production ............................................................................. 52
3.5.3 Arable Land .................................................................................... 55
3.6 Livestock Production ...................................................................... 57
CHAPTER FOUR .......................................................................................... 62
Housing Characteristics and Facilities ......................................................... 62
4.0 Introduction .................................................................................... 62
4.1 Water Services ................................................................................ 65
4.2 Sanitation ........................................................................................ 69
4.3 Garbage Disposal ............................................................................ 71
4.4 Energy ............................................................................................. 73
CHAPTER FIVE ............................................................................................ 76
Infrastructure and Services ........................................................................... 76
5.0 Introduction .................................................................................... 76
5.1 Surface Transport............................................................................ 76

Basic Facts and Figures, 2012 on Human Settlements in Tanzania Mainland
v
5.1.1 Road Transport ............................................................................... 77
5.1.2 Railway Transport .......................................................................... 81
5.2 Marine Transport ............................................................................ 82
5.2.1 Inland Marine Transport ................................................................. 82
5.2.2 Sea Transport .................................................................................. 84
5.3 Communication .............................................................................. 84
5.4 Education Services.......................................................................... 86
5.5 Health Services ............................................................................... 89
5.5.1 Human Resources for Health (HRH) Profile and Distribution ....... 90
5.5.2 Distribution of Health Facilities ................................................... 100
CHAPTER SIX............................................................................................. 109
Good Governance and Accountability ....................................................... 109
6.0 Crimes Situation ........................................................................... 109
6.1 Introduction .................................................................................. 109
6.1.1 Crime Against Persons ................................................................. 110
6.1.2 Crime Against Property ................................................................ 110
6.1.3 Crimes against Public Tranquillity ............................................... 111
6.2 Road Traffic Accidents ................................................................ 112
6.2.1 Motor Vehicles Accidents by Cause ............................................ 113
6.2.2 Motor Cycle Accidents ................................................................. 114
CHAPTER SEVEN ...................................................................................... 115
Safe Cities Programme ................................................................................ 115
7.0 Safe Cities Approach .................................................................... 115
7.1 Rate of Victimization .................................................................... 116
7.2 Experience of Respondents with the Police .................................. 118
7.3 Opinions about Police Work ......................................................... 119
7.4 Fear of Crime ................................................................................ 121
7.5 Crime Prevention Measures .......................................................... 122

Basic Facts and Figures, 2012 on Human Settlements in Tanzania Mainland
vi
List of Tables
Table 1.1: Selected Basic Human Settlements Information .................. 1
Table 2.1: Population Density Trends by Region 1967, 1978,
1988, 2002 and 2012 .......................................................... 22
Table 2.2: Regional Distribution of People by Rural–Urban
Category, Tanzania Mainland, 2012 ................................... 26
Table 2.3: Percentage Distribution of Population by Area,
Tanzania Mainland, 1967, 1978, 1988, 2002 and
2012 .................................................................................... 27
Table 2.4: Urban Population as Percentage of Total Population
by Region, Tanzania Mainland, 1978, 1988, 2002
and 2012 Censuses ............................................................. 28
Table 2.5: Percentage Distribution of Children Aged 5-17
Years and Residing in Specified Areas By Type of
Work, Tanzania Mainland, 2006 ........................................ 29
Table 3.1: Granted Certificates of Right of Occupancy, Tanzania
Mainland, 2008/09 to 2012/13............................................ 36
Table 3.2: Granted Right of Occupancy and Village Certificates,
Tanzania Mainland, 2008/09 to 2012/13 ............................ 37
Table 3.3: Plots and Farms Surveyed and Approved, Tanzania
Mainland, 2008/09 to 2012/13............................................ 38
Table 3.4: Judgments Passed at Land Disputes Tribunals in Some
Districts, Tanzania Mainland, 2008/09 ............................... 42
Table 3.5: The Resolution of Disputes Over Land and House Districts
from July, 2012 up to April, 2013 ...................................... 44
Table 3.6: Land Dispute Cases Existing and were Determined in
Districts, Tanzania Mainland, 2008/09 to 2012/13 ............ 46

Basic Facts and Figures, 2012 on Human Settlements in Tanzania Mainland
vii
Table 3.7: Number of Villages with Land Use Plans Prepared,
Tanzania Mainland, 2008/09 to 2012/13 ............................ 48
Table 3.8: Small Scale Farms: The Area Planted (000’ha) with Selected
Cereal Crops during the 2007/08 Crop Year by Region and
Type of Cereal, Tanzania Mainland ................................... 50
Table 3.9: Small Scale Farms: The Area Planted (000’ha) with Selected
Oil Seed Crops, Pulse, and Roots and Tubers and Banana
during the 2007/08 Crop Year by Region, Tanzania
Mainland ............................................................................. 51
Table 3.10: Number of Livestock and Livestock Keeping Households by
Type of Livestock, Tanzania Mainland, 2007/08 ............... 58
Table 3.11: Production of Livestock Products, Tanzania Mainland,
2000/01 - 2011/12 ............................................................... 61
Table 4.1: Percentage Distribution of Households in Rural and Urban
Areas by Construction Materials of Dwelling, Tanzania
Mainland, 2010 ................................................................... 64
Table 4.2: Percentage Distribution of Households by Rural and Urban
Areas by Time to Obtain Drinking Water, Tanzanian
Mainland, 2010 TDHS and 2011 THMIS .......................... 66
Table 4.3: Total Number of Boreholes Drilled by Region, Tanzania
Mainland, 2009-2013 ......................................................... 68
Table 4.4: Percentage Distribution of Households in Rural and Urban
by Type of Toilet Facility, Tanzania Mainland, 2010 ........ 70
Table 4.5: Distribution of Households in Rural and Urban Areas by
Means of Garbage Disposal, Tanzania Mainland, 2000/01
and 2007 ............................................................................. 72
Table 4.6: Percentage Distribution of Households in Rural and Urban
Areas by Energy Source for Lighting and Cooking, Tanzania
Mainland, 2011 ................................................................... 74
Basic Facts and Figures, 2012 on Human Settlements in Tanzania Mainland
viii
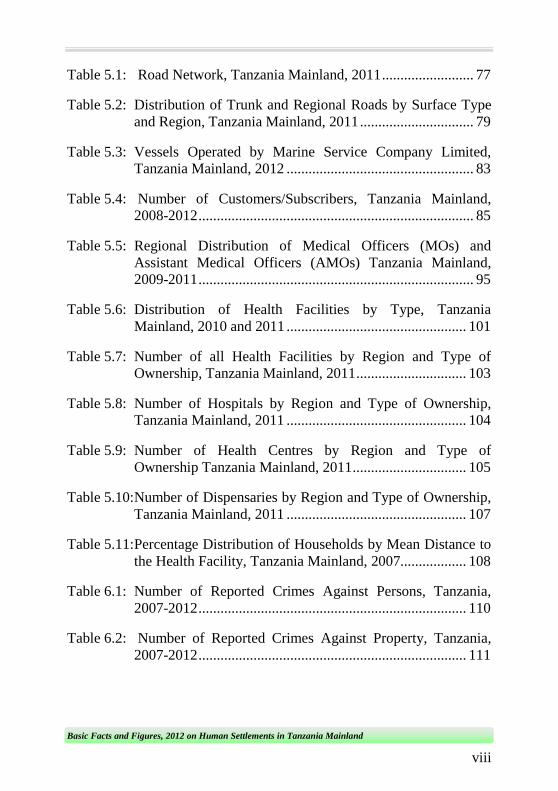
Table 5.1: Road Network, Tanzania Mainland, 2011 ......................... 77
Table 5.2: Distribution of Trunk and Regional Roads by Surface Type
and Region, Tanzania Mainland, 2011 ............................... 79
Table 5.3: Vessels Operated by Marine Service Company Limited,
Tanzania Mainland, 2012 ................................................... 83
Table 5.4: Number of Customers/Subscribers, Tanzania Mainland,
2008-2012 ........................................................................... 85
Table 5.5: Regional Distribution of Medical Officers (MOs) and
Assistant Medical Officers (AMOs) Tanzania Mainland,
2009-2011 ........................................................................... 95
Table 5.6: Distribution of Health Facilities by Type, Tanzania
Mainland, 2010 and 2011 ................................................. 101
Table 5.7: Number of all Health Facilities by Region and Type of
Ownership, Tanzania Mainland, 2011 .............................. 103
Table 5.8: Number of Hospitals by Region and Type of Ownership,
Tanzania Mainland, 2011 ................................................. 104
Table 5.9: Number of Health Centres by Region and Type of
Ownership Tanzania Mainland, 2011 ............................... 105
Table 5.10: Number of Dispensaries by Region and Type of Ownership,
Tanzania Mainland, 2011 ................................................. 107
Table 5.11: Percentage Distribution of Households by Mean Distance to
the Health Facility, Tanzania Mainland, 2007.................. 108
Table 6.1: Number of Reported Crimes Against Persons, Tanzania,
2007-2012 ......................................................................... 110
Table 6.2: Number of Reported Crimes Against Property, Tanzania,
2007-2012 ......................................................................... 111

Basic Facts and Figures, 2012 on Human Settlements in Tanzania Mainland
ix
Table 6.3: Number of Reported Crimes Against Public Tranquillity,
Tanzania, 2007-2012 ........................................................ 112
Table 6.4: Road Traffic Accidents and Persons Killed/Injured,
Tanzania Mainland, 2007 – 2012 ..................................... 113
Table 6.5: Motor Vehicle Traffic Accidents by Cause, Tanzania
Mainland: 2007-2012 ....................................................... 114
Table 6.6: Motor Cycle Accidents, Tanzania Mainland, 2007 - 2012
......................................................................................... .114
Table 7.1: Prevalence of Victimisation during the Year Preceding the
Survey in 2007, Tanzania Mainland ................................. 117
Table 7.2: Percentage of Victims who Reported Crimes to the Police or
Other Authorities, Tanzania Mainland, 2007 ................... 119

Basic Facts and Figures, 2012 on Human Settlements in Tanzania Mainland
x
List of Figures
Figure 2.1: Population Trends in Tanzania Mainland, 1967 – 2012
Censuses (in millions) ........................................................ 22
Figure 3.1: Granted Right of Occupancy , Tanzania Mainland,
2008/09 to 2012/13 ............................................................. 37
Figure 3.2: Granted Village Certificates, Tanzania Mainland,
2008/09 to 2012/13 ............................................................. 38
Figure 3.3: Plots Surveyed and Approved, Tanzania Mainland,
2008/09 to 2012/13 ............................................................. 39
Figure 3.4: Farms Surveyed and Approved, Tanzania Mainland,
2008/09 to 2012/13 ............................................................. 39
Figure 3.5: The Cases Determined and Existing in the Districts
Land and Housing Tribunals, Tanzania Mainland,
2008/09 to 2012/13 ............................................................. 46
Figure 3.6: Village Land Use Plans Prepared, Tanzania Mainland,
2008/09 to 2012/13 ............................................................. 48
Figure 5.1: National Level Human Resources for Health,
Tanzania Mainland, 2009 – 2011 ....................................... 94
Figure 5.2: Distributions of Medical Officers and Assistant
Medical Officers by Region, Tanzania Mainland,
2011 .................................................................................... 97
Figure 5.3: Distribution of Pharmacists by Region, Tanzania
Mainland, 2011 ................................................................... 98
Figure 5.4: Distribution of Clinical Officers by Region, Tanzania
Mainland 2011 .................................................................... 99
Figure 5.5: Distribution of Registered Nurses and Enrolled
Nurses by Region, Tanzania Mainland, 2011 ................... 100
Basic Facts and Figures, 2012 on Human Settlements in Tanzania Mainland
xi
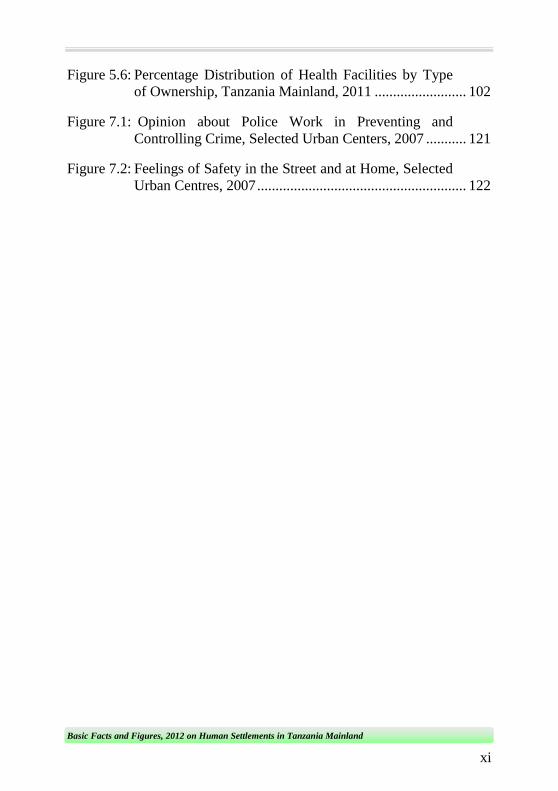
Figure 5.6: Percentage Distribution of Health Facilities by Type
of Ownership, Tanzania Mainland, 2011 ......................... 102
Figure 7.1: Opinion about Police Work in Preventing and
Controlling Crime, Selected Urban Centers, 2007 ........... 121
Figure 7.2: Feelings of Safety in the Street and at Home, Selected
Urban Centres, 2007 ......................................................... 122

Basic Facts and Figures, 2012 on Human Settlements in Tanzania Mainland
xii
List of Maps
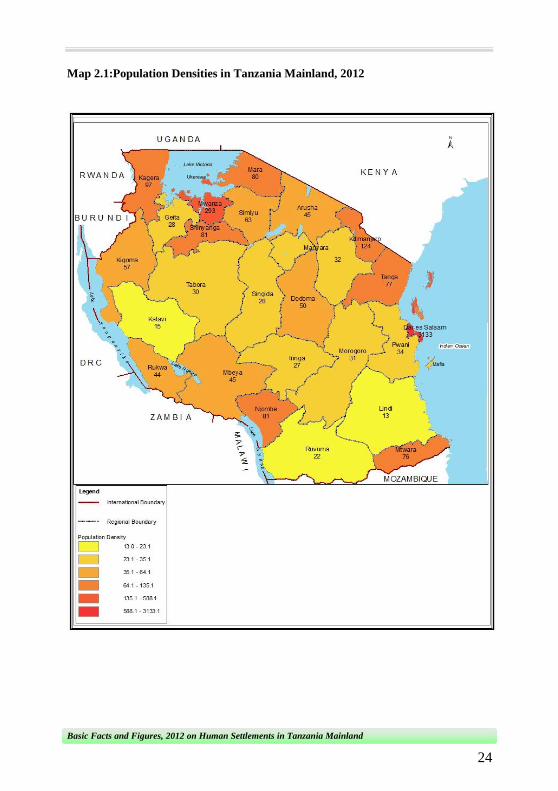
Map 2.1: Population Densities in Tanzania Mainland, 2012 ............. 24
Map 5.1: Map of Tanzania Showing Transport Infrastructure .......... 78
Map 5.2: The Tanzanian Rail Network .............................................. 82
Map 5.3: Primary Schools Net Enrolment Ratio (NER) in
Percentage by Region, Tanzania Mainland, 2012 .............. 87

Basic Facts and Figures, 2012 on Human Settlements in Tanzania Mainland
xiii
PREFACE
The decision by the National Bureau of Statistics (NBS) to form the
Human Settlements Statistics Section aimed at producing and
disseminating statistics relating to human settlements so as to improve
people’s knowledge in that area. This is also in line with the
Government`s initiatives to improve human settlements as defined in
the Human Settlements Development Policy of 2000 whose goals are to
promote development of human settlements that are sustainable and to
facilitate the provisions of adequate and affordable shelter to all income
groups in Tanzania.
The need to develop a National Human Settlements Development
Policy arose from the Government’s commitment to address and reverse
the deterioration of human settlements condition in the country and its
recognition and commitment to the decision by the United Nations
Habitat Agenda II and the Istanbul Declaration. It is also reflected in
Cluster II of the National Strategy for Growth and Reduction of Poverty
or MKUKUTA, which is about the improvement of quality of life and
social well-being. Another goal is to ensure access to clean, affordable
and safe water, sanitation, decent shelter as well as safe and sustainable
environment and reduce vulnerability from environmental risk.
There are also UN-HABITAT initiatives in collaboration with the
Government through Prime Minister’s Office-Regional Administration
and Local Governments (PMO-RALG) on National Strategy on Urban
Crime Prevention in Tanzania among others. Human Settlements

Basic Facts and Figures, 2012 on Human Settlements in Tanzania Mainland
xiv
development and shelter delivery are inseparable and require a coherent
and comprehensive policy that links them in a common framework.
To address all these initiatives, it is important to have data that show the
current status of the human settlements so as to facilitate development
of evidence based development plans and decisions.
The Basic Facts and Figures on Human Settlements in Tanzania
Mainland publication presents basic data from various sources such as
the Population and Housing Censuses, Ministry of Lands, Housing and
Human Settlements Development, Tanzania Police Force, Judiciary
System of Tanzania, Ministry of Works, Ministry of Education,
Ministry of Health and Social Welfare and other stakeholders. This
publication is consistent with the NBS’s initiatives to facilitate planning
and decision making processes within the government and other
stakeholders, through provision of timely and accurate statistics.
This is the second edition that also lays a foundation for future efforts to
produce and disseminate data on Human Settlements for a number of
years to come. Therefore, it is expected that new suggestions will be put
forward to improve future editions.
Dr. Albina A. Chuwa
Director General
National Bureau of Statistics
Basic Facts and Figures, 2012 on Human Settlements in Tanzania Mainland
xv
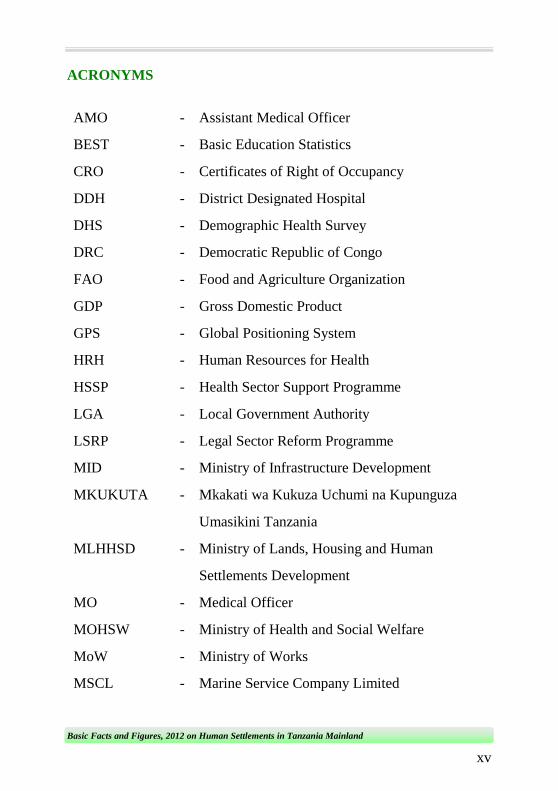
ACRONYMS
AMO - Assistant Medical Officer
BEST - Basic Education Statistics
CRO - Certificates of Right of Occupancy
DDH - District Designated Hospital
DHS - Demographic Health Survey
DRC - Democratic Republic of Congo
FAO - Food and Agriculture Organization
GDP - Gross Domestic Product
GPS - Global Positioning System
HRH - Human Resources for Health
HSSP - Health Sector Support Programme
LGA - Local Government Authority
LSRP - Legal Sector Reform Programme
MID - Ministry of Infrastructure Development
MKUKUTA - Mkakati wa Kukuza Uchumi na Kupunguza
Umasikini Tanzania
MLHHSD - Ministry of Lands, Housing and Human
Settlements Development
MO - Medical Officer
MOHSW - Ministry of Health and Social Welfare
MoW - Ministry of Works
MSCL - Marine Service Company Limited

Basic Facts and Figures, 2012 on Human Settlements in Tanzania Mainland
xvi
NARCO - National Ranching Company
NBS - National Bureau of Statistics
NER - Net Enrolment Ratio
NGO - Non-Government Organization
NHC - National Housing Corporation
NLUPC - National Land Use Planning Commission
NSGRP - National Strategy for Growth and Reduction of Poverty
NSO - National Statistical Office
OCGS - Office of Chief Government Statistician
PCR - Pupil Classroom Ratio
PHCDP - Primary Health Care Development Programme
PMO-RALG - Prime Minister’s Office-Regional Administration
and Local Government
TAZARA - Tanzania and Zambia Railway Authority
THMIS - Tanzania HIV/AIDS and Malaria Indicator
Survey
TPA - Tanzania Ports Authority
TRL - Tanzania Railways Limited
UNDP - United Nations Development Programme
UN-HABITAT - United Nations Centre for Human Settlements
UNODC - United Nations Office on Drugs and Crime
URT - United Republic of Tanzania
WHO - World Health Organization
Basic Facts and Figures, 2012 on Human Settlements in Tanzania Mainland
1
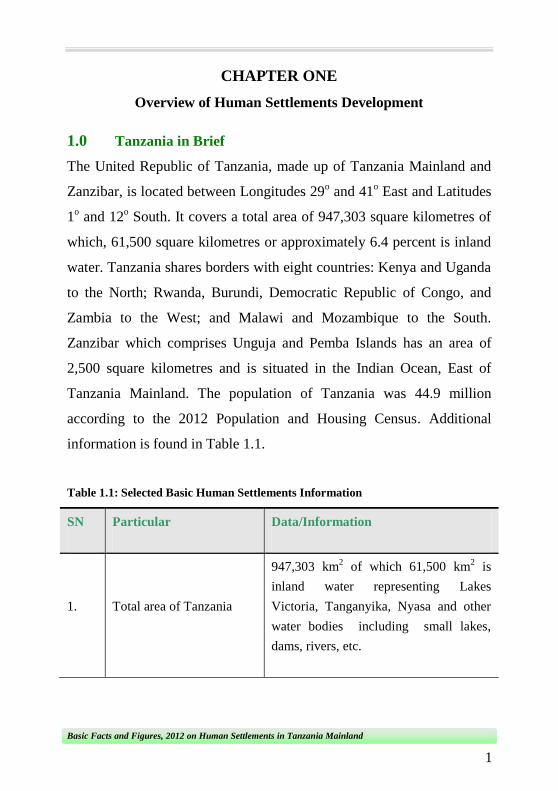
CHAPTER ONE
Overview of Human Settlements Development
1.0 Tanzania in Brief
The United Republic of Tanzania, made up of Tanzania Mainland and
Zanzibar, is located between Longitudes 29o and 41
o East and Latitudes
1o and 12
o South. It covers a total area of 947,303 square kilometres of
which, 61,500 square kilometres or approximately 6.4 percent is inland
water. Tanzania shares borders with eight countries: Kenya and Uganda
to the North; Rwanda, Burundi, Democratic Republic of Congo, and
Zambia to the West; and Malawi and Mozambique to the South.
Zanzibar which comprises Unguja and Pemba Islands has an area of
2,500 square kilometres and is situated in the Indian Ocean, East of
Tanzania Mainland. The population of Tanzania was 44.9 million
according to the 2012 Population and Housing Census. Additional
information is found in Table 1.1.
Table 1.1: Selected Basic Human Settlements Information
SN Particular Data/Information
1. Total area of Tanzania
947,303 km2 of which 61,500 km
2 is
inland water representing Lakes
Victoria, Tanganyika, Nyasa and other
water bodies including small lakes,
dams, rivers, etc.
Basic Facts and Figures, 2012 on Human Settlements in Tanzania Mainland
2
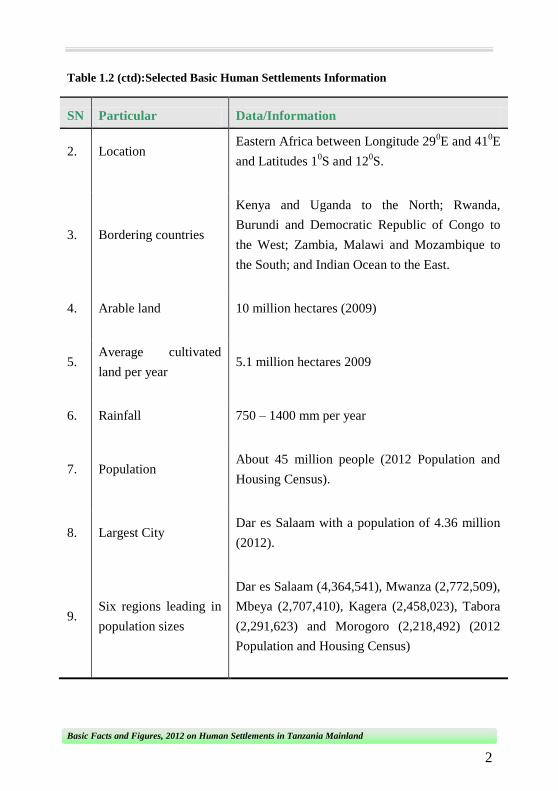
Table 1.2 (ctd):Selected Basic Human Settlements Information
SN Particular Data/Information
2. Location Eastern Africa between Longitude 29
0E and 41
0E
and Latitudes 10S and 12
0S.
3. Bordering countries
Kenya and Uganda to the North; Rwanda,
Burundi and Democratic Republic of Congo to
the West; Zambia, Malawi and Mozambique to
the South; and Indian Ocean to the East.
4. Arable land 10 million hectares (2009)
5. Average cultivated
land per year 5.1 million hectares 2009
6. Rainfall 750 – 1400 mm per year
7. Population About 45 million people (2012 Population and
Housing Census).
8. Largest City Dar es Salaam with a population of 4.36 million
(2012).
9. Six regions leading in
population sizes
Dar es Salaam (4,364,541), Mwanza (2,772,509),
Mbeya (2,707,410), Kagera (2,458,023), Tabora
(2,291,623) and Morogoro (2,218,492) (2012
Population and Housing Census)

Basic Facts and Figures, 2012 on Human Settlements in Tanzania Mainland
3
Table 1.2 (ctd):Selected Basic Human Settlements Information
SN Particular Data/Information
10. Population density of
the country
51 persons per square kilometre (2012
Population and Housing Census)
11.
Range of the
population density of a
region
Dar es Salaam 3,133 persons/ km2 to 13 persons
/km2 in Lindi region (2012 Population and
Housing Census).
12.
Gross Domestic
Product (GDP) at
current prices
TShs. 44,717,663 millions in 2012 (Economic
Survey, 2013)
13.
Gross Domestic
Product (GDP) at 2001
prices
19,155,765 millions in 2012 (Economic Survey,
2013)
14. GDP Growth Rate (at
2001 constant prices)
6.9 percent (2012) Annual Growth Rate
(Economic Survey, 2013)
15. Transport (at 2001
Constant prices)
7.1 percent (2012) (Annual Growth Rate)
(Economic Survey, 2013)
16. Communication (at
2001 Constant prices) 20.6 percent (2012) (Annual Growth Rate)
17. Construction (at 2001
constant prices)
7.8 percent (2012) (Annual Growth Rate)
(Economic Survey, 2013)

Basic Facts and Figures, 2012 on Human Settlements in Tanzania Mainland
4
Table 1.2 (ctd):Selected Basic Human Settlements Information
SN Particular Data/Information
18.
Mining and Quarrying
(at 2001 constant
prices)
7.8 percent (2012) (Annual Growth Rate)
(Economic Survey, 2013)
19. Road Network 86,472 km (2011)
20. Railway Network 3,682 km: TRL (2,707 km) and TAZARA (975
km) (Ministry of Transport, 2011)
21. Number of
Aerodromes
There are 360 aerodromes in Tanzania including
airstrips serving domestic and international
traffic. The government manages 58 of them.
22. Maritime Transport
Three major seaports: Dar es Salaam, Mtwara
and Tanga ports. Smaller seaport facilities:
Kilwa, Lindi, Mafia, Pangani and Bagamoyo;
and four major inland ports are Mwanza,
Bukoba, Musoma and Kigoma.

Basic Facts and Figures, 2012 on Human Settlements in Tanzania Mainland
5
1.1 Background of Human Settlements in Tanzania
The mission of the Ministry of Lands, Housing and Human Settlements
Development is to facilitate and create an enabling environment and
framework for the achievement of equitable, safe, and secure, healthy
and efficient sustainable human settlements in the country.
According to the 1986 Global Report on Human Settlements by UN-
HABITAT as reflected in the National Human Settlements
Development Policy 2002, human settlements are where organised
human activity takes place. Organisation is needed as a reminder that
human settlements are often conceived and invariably developed and
used as systems. Human settlements function as a system at global,
regional, sub-regional, national and sub-national scale-down to the
lowest unit of human habitation.
A human settlement is not simply housing or merely the physical
structure of a city, town, or village. It is a combination of all human
activity processes - residence, work, education, health, culture, leisure,
etc. and the physical structure that supports it.
In Tanzania Mainland, development of human settlements has not been
sustainable because it has not combined socio-economic development
with environmental conservation and protection and thereby
aggravating urban and rural poverty. Rapid urbanization which has
taken place over the last four decades has increased and will continue to

Basic Facts and Figures, 2012 on Human Settlements in Tanzania Mainland
6
increase the proportion of the country’s population living in urban
areas.
This rapid urbanization rate is transforming the country’s settlements
pattern characterised by numerous scattered small villages, large
villages, towns, municipalities and cities. At the same time, the
provision of shelter in urban and rural settlements of Tanzania is
inadequate and lacking infrastructure and services leading to non-
sanitary conditions that threaten the health and productivity of people in
both settings.
In such circumstances, the government therefore, intends to facilitate
availability of shelter and development of sustainable human
settlements in the country. It will be achieved through harnessing
existing and future initiatives and potentials in shelter availability and
infrastructure investment, management and maintenance of such
facilities in partnership with various actors and stakeholders. These
include the public, private and informal sectors, and the national and
international Non-Governmental Organisations (NGOs) such as the
Community Based Organisations (CBOs). In addition, the Ministry of
Lands, Housing and Human Settlements Development will capture the
cross-cutting interrelationships between various actors and sectors in
human settlements development; and streamline their roles and
functions so that human settlements development contributes effectively
and meaningfully to the improvement of the quality of life of all

Basic Facts and Figures, 2012 on Human Settlements in Tanzania Mainland
7
Tanzanians. In order to achieve this, proper planning and correct
decisions based on accurate, reliable and timely statistics is required.
The NBS is prepared to facilitate evidence based planning and decision
making by providing relevant, reliable, timely statistics and quality
statistical services in general.
1.2 Concepts and Definitions of Human Settlements
The definitions of Human Settlements are obtained from the National
Human Settlements Policy document published in January 2000 by the
Ministry of Lands and Human Settlements Development. The other
source is the United Nations Centre for Human Settlements (UN-
HABITAT). These definitions are intended to provide a quick reference
and general information on human settlements statistics for policy
makers, researchers and the general public.
Household
The concept of household is based on the arrangements made by
persons individually or in groups, for providing themselves with food or
other essentials for living.
A Household
Usually consists of a person or a group of persons who live together in
the same homestead/ compound but not necessarily in the same
dwelling unit, have common housekeeping arrangements, and are
answerable to the same household head. It is important to note that

Basic Facts and Figures, 2012 on Human Settlements in Tanzania Mainland
8
members of a household need not necessarily be related by their blood
or by marriage.
Household Head
Is a person among the household members who is acknowledged by
other members of the same household as their head. This individual is
the spokesperson of the household members and is the one who often
makes decisions or is consulted on issues concerning the welfare of the
members of the household.
A One-Person Household
This is a household in which a person makes provision for his or her
own food or other essentials for living without sharing with any other
person to form part of a multi-persons household.
A Multi-Person Household
This is a group of two or more persons living together with common
provision for food or other essentials for living. They may pool their
incomes and have a common budget and to a greater extent or lesser
extent; they may be related or not.
Household Size
It is simply the number of persons who live in a particular household.

Basic Facts and Figures, 2012 on Human Settlements in Tanzania Mainland
9
Average Household Size
An average household size refers to the number of persons per
household. This rate is obtained by dividing the total population by the
number of households.
Dwelling Unit
This is a place of abode or residence occupied by one or more
households with a private entrance. For the purpose of the census a
dwelling unit is a structure that a household uses for sleeping, eating
and entertaining guests.
Habitable Rooms
These are rooms in the dwelling units which are used mainly for living
and exclude stores, granaries, offices, toilets and garage.
Safe Water
Water drawn from improved sources in addition to piped water, water
from protected wells and springs (protected by closing the sources to
prevent contamination).
1.3 Geographical Concepts
Human Settlement
The Geographical definition for Human Settlement has already been
provided above as extracted from the 1986 Global Report on Human
Settlements by UN-HABITAT. However, it is hereby emphasized that,

Basic Facts and Figures, 2012 on Human Settlements in Tanzania Mainland
10
the design, planning, construction and operation of human settlements
should reflect the productivity and competitiveness of the economy, the
quality of life of all citizens and the ecological sustainability of the
environment.
In Tanzania, the criteria for classification of human settlements are
based on the population size, level of services, economic base and the
level of sustenance in the annual budget. Human settlements can be
divided into two broad categories, namely Rural and Urban settlements.
Rural Settlements
These comprise of hamlets and villages. The majority of people in rural
settlements engage themselves in agriculture as their main economic
activity.
Urban Settlements
These are found in minor towns, towns, municipals, cities and mega
cities. The majority of people in urban settlements depend on non-
agricultural activities for living. Urban settlements can be divided into
five categories that is; low, medium, high, mixed density and slums
/squatters.
Low, Medium and High Density Areas
These are surveyed residential areas that are supposed to have modern
services such as tarmac roads, street lights, water supply, sewage and

Basic Facts and Figures, 2012 on Human Settlements in Tanzania Mainland
11
drainage systems and communication networks. High and middle class
people live in such areas which are often supplied with basic socio-
economic services such as schools and health services.
Slums and Squatter Settlements
These are unplanned human settlements sometimes known as informal
settlements which usually have inadequate or lack modern and basic
socio-economic services such as roads, water supply, electricity, solid
waste service, and sewage and drainage systems. These are inhabited
by low income earners with large household sizes.
1.4 Categories of Human Settlements by Population Size
According to the 2000 National Human Settlements Development
Policy of Tanzania, human settlements are classified into six categories
as follows:
Village: Human settlement with less than 10,000 people
Minor Town: Human settlement with between 10,000 and 29,999 people
Town: Human settlement with between 30,000 and 99,999 people
Municipal: Human settlement with between 100,000 and 499,999 people
City: Human settlement with between 500,000 and 3,999,999 people
Mega City: Human Settlement with 4,000,000 or more people
However, such criteria have to be reviewed from time to time in order
to cope with societal changing needs.

Basic Facts and Figures, 2012 on Human Settlements in Tanzania Mainland
12
1.5 Human Settlements Indicators
1.5.1 Urbanization Trends
Urban Population (expressed in numbers)
Urban population refers to people living in urban areas as defined by
National Statistical Offices (NSOs). Urbanization trends involve a
series of estimates and projections of the urban population for each
country, region, and major area over a defined period of time. The term
Urban is as defined in the context of the latest available national census
manual. In Tanzania Mainland the urban population is 12,701,238
according to 2012 Population and Housing Census.
Annual Growth Rate of Urban Population
The average growth rate of the urban population over a year for a given
country, region, and major area. The annual growth rate of urban
population is 5 percent in Tanzania Mainland (2012 Population and
Housing Census).
Level of Urbanization
Estimates and projections of the percentage of population residing in
urban areas for a given country, region, and major area. Level of
urbanization is 29.1 percent as per 2012 Population and Housing
Census.

Basic Facts and Figures, 2012 on Human Settlements in Tanzania Mainland
13
Rural Population (expressed in numbers)
Rural population refers to people living in rural areas as defined by
NSOs. It is calculated as the difference between total population and
urban population estimated and projected over a defined period of time
for a given country, region and major area. In Tanzania Mainland the
rural population is 30,924,116 according to 2012 Population and
Housing Census.
Annual Growth Rate of Rural Population
The average growth rate of the rural population over a year for a given
country, region, and major area. The annual growth rate of rural
population is 2 percent in Tanzania Mainland (2012 Population and
Housing Census).
1.5.2 Housing Stock
Conventional Dwellings
A conventional dwelling refers to a room or suite of rooms and its
accessories in a permanent building or structurally separated part
thereof, which by the way it has been built, rebuilt or converted is
intended for habitation by one household and is not, at the time of the
census or other inquiry, used wholly for other purposes. A conventional
dwelling may be either occupied or vacant.

Basic Facts and Figures, 2012 on Human Settlements in Tanzania Mainland
14
A Room
Is defined as a space in a housing unit enclosed by walls reaching from
the floor to the ceiling or roof with a capacity of at least 4 cubic metres
large enough to hold a bed for an adult.
Average Persons per Sleeping Room (room density)
The average number of persons per room is obtained by dividing the
total number of persons in housing units by the total number of rooms
used for sleeping in the housing units. Total numbers of rooms vary
from one household to another depending on income levels, for
example, high income earners unlike the low income ones; can afford to
have a housing unit with multiple rooms. These may range from few to
several bedrooms, dining-rooms, living–rooms, studies, servant’s
rooms, kitchens, rooms used for professional or business purposes and
other separate spaces used or intended for dwelling purposes as long as
they meet the criteria of walls and floor space.
Average Rooms per Housing Unit
The average number of rooms per housing unit is obtained by dividing
the total number of rooms in all housing units by the total number of
housing units.
Owner Occupied Households
Owner occupant is one who owns the housing unit he/she occupies,
including one who pays loan on a housing unit or one living in a

Basic Facts and Figures, 2012 on Human Settlements in Tanzania Mainland
15
housing unit under mortgage. Owner occupied households is calculated
as a percentage out of the total number of households in a given
geographical area.
1.5.3 Housing Facilities Indicators
Housing Units with Piped Water
Piped water refers to water provided within a housing unit by pipe from
community-wide systems or from individual installations such as
pressure tanks and pumps. With piped water means water supply inside
the housing unit or outside the housing unit but within 100 metres from
the door. Therefore, housing units with piped water is calculated as a
percentage of total number of occupied housing unit in a given
geographical area.
Housing Units with Toilet
Toilet of any type refers to an installation arranged for humans to
discharge their excreta. Housing units with any type of toilet facility is
calculated as a percentage of total number of occupied housing units in
a given geographical area.
Housing Units with Electric Lighting
Housing units with electric lighting are calculated as a percentage of
total number of occupied housing unit in a given geographical area.

Basic Facts and Figures, 2012 on Human Settlements in Tanzania Mainland
16
Housing Units with Kitchen
Kitchen is a room equipped for the preparation of principal meals and
intended primarily for that purpose. Other space reserved for cooking
falls short of the attributes of room, even if equipped for the preparation
of the principal meals and intended primarily for that purpose. Housing
units with kitchen or other space reserved for cooking are expressed as
percentage of total number of occupied housing units in a given
geographical area.
1.5.4 Infrastructure Indicators
Population with access to Safe Water
It is computed as a percentage of population with access to an adequate
amount of safe drinking water located within a convenient distance
from a user’s dwelling of the total number of occupied housing units in
a given geographical area. It is important to note that access, adequate
amount, safe, convenient distance vary from country to country
Population with access to Sanitation
Percentage of population with access to sanitary facility for human
excreta disposal in the dwelling or located within a convenient distance
from the user’s dwelling is computed out of the total number of
occupied housing units. It is important to note that access, sanitary
facility, and convenient distance vary from country to country.
Road network density (km/1000 sq km)
The ratio of the total length of the road network to total area.
Basic Facts and Figures, 2012 on Human Settlements in Tanzania Mainland
17
Railway network density (km/1000 sq km)
The ratio of the total length of the railway network to total area.
Telephones per 100 inhabitants
It is the number of main lines per 100 inhabitants. Main telephone lines
refer to the telephone lines which have a dedicated port on a telephone
exchange.
Motor vehicles per 100 inhabitants
Motor Vehicle per 100 Inhabitants is the number of passenger cars per
100 inhabitants. Passenger cars include vehicles whose seating capacity
does not exceed nine persons (including driver), such as taxis, jeeps and
station wagons. Special purpose vehicles such as two-or three wheeled
cycles and motor cycles, trams, trolley–buses, ambulances, hearses,
military vehicles operated by police or other governmental security
organizations are excluded.
1.5.5 Social Indicators
Housing Expenditure
Percentage of final consumption expenditure of residential houses taken
up for gross rent, water, sanitation, fuel and power.
Population below poverty line
The percentage of population whose income is not enough to afford
minimum nutritionally adequate diet plus essential non-food
requirements.

Basic Facts and Figures, 2012 on Human Settlements in Tanzania Mainland
18
Population with access to health services
It is the percentage of the population that reach appropriate local health
services by local means of transport in no more than one hour.
Population per doctor
Population per doctor refers to the number of people per doctor.
The term Doctor in medical context, it refers to physicians and all
graduates of any faculty or school of medicine in any field (including
practice, teaching, administration and research).
Primary and Secondary School Enrolment Rates or Ratios
Total enrolment in primary and secondary education, regardless of age,
expressed as a percentage of population in age-group corresponding to
the national regulation for these two levels.
Net Primary Enrolment Ratio
This is a ratio obtained by dividing the number of enrolled pupils aged
7-13 years to the number of all children aged 7-13 years in the
population, multiplied by 100. The ratio cannot exceed 100.
Net Secondary Enrolment Ratio
This is a ratio obtained by dividing the number of enrolled pupils aged
14-18 years to the number of all children aged 14-18 years in the
population, multiplied by 100. The ratio cannot exceed 100.

Basic Facts and Figures, 2012 on Human Settlements in Tanzania Mainland
19
Gross Primary Enrolment Ratio
This is a ratio obtained by dividing the number of all enrolled primary
school pupils to the number of all children aged 7-13 years in the
population, multiplied by 100. The ratio can exceed 100.
Gross Secondary Enrolment Ratio
This is a ratio obtained by dividing the number of all enrolled secondary
school pupils to the number of all children aged 14-18 years in the
population, multiplied by 100. The ratio can exceed 100.
Literacy Rate
The percentage of adults (15 years and above) who are literate. The
literate adults are those who can, with understanding, read and write a
short simple statement on their everyday life.
Illiteracy Rate
The percentage of adults (15 years and over) who are illiterate. The
illiterate adults are those who cannot, read and write a short simple
statement on their everyday life.
Child Labour
Child labour is defined as work performed by a person whose age is
from 5-17 years which is exploitative, hazardous or inappropriate for
his or her age. This type of work is detrimental to his or her schooling
and impedes physical, social, mental or spiritual development. These
Basic Facts and Figures, 2012 on Human Settlements in Tanzania Mainland
20
include type of engagements that deny the child an opportunity to
develop him/herself educationally, economically or socially.
Child work:
Child work refers to work performed by a person under 18 years of age
which is not exploitative, not hazardous or appropriate for his or her
age.

Basic Facts and Figures, 2012 on Human Settlements in Tanzania Mainland
21
CHAPTER TWO
Population
2.0 Population Density
The population of Tanzania Mainland
as observed from post- independence
censuses has been increasing (Figure
2.1), but the land area has remained
the same at the size of 883,303 square
kilometres. This means the population
density as defined previously has also
been increasing at different rates both
in urban and rural areas. Rapid
increase of population densities have been observed in urban areas
partly due to rural-urban migration.
High population densities have frequently caused land disputes. In
Tanzania, signs of land disputes have started to be reported in both rural
and urban areas due to rural - urban migration and this is a common
feature in unplanned human settlements.
In rural areas reported cases of conflicts between farmers and livestock
keepers are on the increase due to decreasing land for grazing.

Basic Facts and Figures, 2012 on Human Settlements in Tanzania Mainland
22
Figure 2.1: Population Trends in Tanzania Mainland, 1967 – 2012 Censuses (in
millions)
Source: Population and Housing Censuses 1967, 1978, 1988, 2002 and 2012
Table 2.1: Population Density Trends by Region 1967, 1978, 1988, 2002 and 2012
Region Population Density
1967 1978 1988 2002 2012
Total Tanzania 14 20 26 39 51
Total Mainland 14 19 26 38 49
Dodoma 17 24 30 41 50
Arusha n.a n.a 20 35 45
Kilimanjaro 49 68 83 103 124
Tanga 29 39 48 61 77
Morogoro 10 13 17 25 31
Pwani 13 16 20 27 34
Dar es Salaam 256 605 977 1786 3,133
Lindi 6 8 10 12 13
Mtwara 37 46 53 67 76
Ruvuma 6 9 12 18 22
Iringa 12 16 21 26 27
Basic Facts and Figures, 2012 on Human Settlements in Tanzania Mainland
23
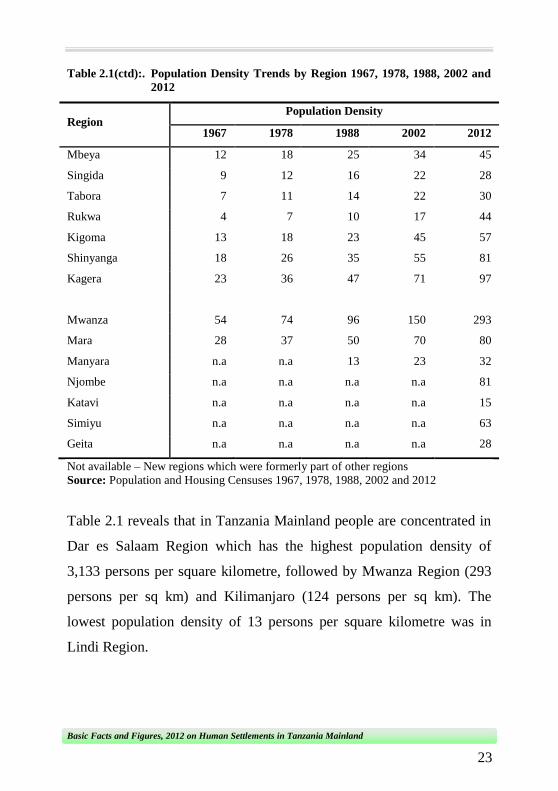
Table 2.1(ctd):. Population Density Trends by Region 1967, 1978, 1988, 2002 and
2012
Region Population Density
1967 1978 1988 2002 2012
Mbeya 12 18 25 34 45
Singida 9 12 16 22 28
Tabora 7 11 14 22 30
Rukwa 4 7 10 17 44
Kigoma 13 18 23 45 57
Shinyanga 18 26 35 55 81
Kagera 23 36 47 71 97
Mwanza 54 74 96 150 293
Mara 28 37 50 70 80
Manyara n.a n.a 13 23 32
Njombe n.a n.a n.a n.a 81
Katavi n.a n.a n.a n.a 15
Simiyu n.a n.a n.a n.a 63
Geita n.a n.a n.a n.a 28
Not available – New regions which were formerly part of other regions
Source: Population and Housing Censuses 1967, 1978, 1988, 2002 and 2012
Table 2.1 reveals that in Tanzania Mainland people are concentrated in
Dar es Salaam Region which has the highest population density of
3,133 persons per square kilometre, followed by Mwanza Region (293
persons per sq km) and Kilimanjaro (124 persons per sq km). The
lowest population density of 13 persons per square kilometre was in
Lindi Region.
Basic Facts and Figures, 2012 on Human Settlements in Tanzania Mainland
24
Map 2.1:Population Densities in Tanzania Mainland, 2012

Basic Facts and Figures, 2012 on Human Settlements in Tanzania Mainland
25
2.1 Rural-Urban Distribution of the Population
This section deals with distribution of people by rural and urban
locations, and the factors that lead to rapid urbanization in Tanzania.
Modern society develops through the growth of cities. Urbanization is a
complex and many sided process in which alongside the demographic
aspect, there are social and economic aspects. It involves the transition
to the urban way of life through migration of people from rural to urban
areas as a progressive phenomenon.
The construction of roads, industries and other aspects of economic and
social growth in rural areas also give rise to trading and urban centres
that contribute to urbanisation. The establishment of food processing
activities, mining, schools, hospitals, religious and other social and
economic institutions attract people to the once rural areas that
gradually grow into urban centres. That leads to urbanization which
gives a powerful impetus to the break-up of traditional social structures
and readjustment of the way of life and of forms of social organization
to match with modern requirements. Rapid urbanization leads to
unplanned settlements and deteriorations of social and other basic
services.
The rapid growth of cities and towns puts an ever increasing pressure on
the urban infrastructure (transport, housing, water, sanitation, and
energy). Also it leads to an increase in crime. Inadequate housing is a
good example of the pressure that rapid population growth will exert on
the social and physical infrastructure of the towns and cities.

Basic Facts and Figures, 2012 on Human Settlements in Tanzania Mainland
26
Table 2.2: Regional Distribution of People by Rural–Urban Category, Tanzania
Mainland, 2012
Region Population Percentage
Total Rural Urban Rural Urban
Tanzania Mainland 43,625,354 30,922,213 12,703,141 70.9 29.1
Dodoma 2,083,588 1,762,394 321,194 84.6 15.4
Arusha 1,694,310 1,135,188 559,122 67.0 33.0
Kilimanjaro 1,640,087 1,242,712 397,375 75.8 24.2
Tanga 2,045,205 1,604,297 440,908 78.4 21.6
Morogoro 2,218,492 1,582,434 636,058 71.3 28.7
Pwani 1,098,668 738,297 360,371 67.2 32.8
Dar-es-Salaam 4,364,541 0 4,364,541 - 100.0
Lindi 864,652 702,603 162,049 81.3 18.7
Mtwara 1,270,854 979,350 291,504 77.1 22.9
Ruvuma 1,376,891 1,038,071 338,820 75.4 24.6
Iringa 941,238 684,890 256,348 72.8 27.2
Mbeya 2,707,410 1,809,298 898,112 66.8 33.2
Singida 1,370,637 1,199,936 170,701 87.5 12.5
Tabora 2,291,623 2,004,114 287,509 87.5 12.5
Rukwa 1,004,539 768,002 236,537 76.5 23.5
Kigoma 2,127,930 1,762,669 365,261 82.8 17.2
Shinyanga 1,534,808 1,280,137 254,671 83.4 16.6
Kagera 2,458,023 2,231,033 226,990 90.8 9.2
Mwanza 2,772,509 1,848,288 924,221 66.7 33.3
Mara 1,743,830 1,440,418 303,412 82.6 17.4
Manyara 1,425,131 1,230,010 195,121 86.3 13.7
Njombe 702,097 536,189 165,908 76.4 23.6
Katavi 564,604 407,532 157,072 72.2 27.8
Simiyu 1,584,157 1,473,639 110,518 93.0 7.0
Geita 1,739,530 1,460,712 278,818 84.0 16.0
Source: Population and Housing Census, 2012

Basic Facts and Figures, 2012 on Human Settlements in Tanzania Mainland
27
Table 2.2 shows percentage distribution of people living in rural and
urban areas in 2012. According to the 2012 Population and Housing
Census, about 71 percent of people in Tanzania Mainland live in rural
areas. The highest percentage of people living in urban areas was
reported in Dar-es-Salaam Region (100 percent) and the least urbanised
regions of Tanzania Mainland are Simiyu and Kagera whose urban
populations are less than 10 percent.
Table 2.3: Percentage Distribution of Population by Rural and Urban Areas,
Tanzania Mainland, 1967, 1978, 1988, 2002 and 2012
Year Rural Urban
1967 94.3 5.7
1978 86.7 13.3
1988 82.0 18.0
2002 77.4 22.6
2012 70.9 29.1
Source: Population and Housing Censuses, 1967, 1978, 1988, 2002 and 2012
Table 2.3 shows the increasing trend of urbanization in Tanzania
Mainland from 5.7 percent in 1967 to 29.1 percent in 2012. On the other
hand, the percentage of people living in rural areas decreased from 94.3
percent in 1967 to 70.9 percent in 2012.

Basic Facts and Figures, 2012 on Human Settlements in Tanzania Mainland
28
2.2 Trends of Urbanization
Table 2.4: Urban Population as Percentage of Total Population by Region,
Tanzania Mainland, 1978, 1988, 2002 and 2012 Censuses
Regions 1978 1988 2002 2012 Change in
(1978-2012)
Tanzania Mainland 13.3 17.9 22.6 29.1 15.8
Dodoma 8.8 11.2 12.6 15.4 6.6
Arusha 8.0 12.4 31.3 33 25
Kilimanjaro 7.5 15.2 20.9 24.2 16.7
Tanga 14.1 17.6 18.4 21.6 7.5
Morogoro 14.4 21.1 27.0 28.7 14.3
Pwani 7.2 15.4 21.1 32.8 25.6
Dar-es-Salaam 19.3 88.6 93.9 100 80.7
Lindi 10.1 15.3 16.0 18.7 8.6
Mtwara 12.0 14.0 20.3 22.9 10.9
Ruvuma 7.7 11.9 15.2 24.6 16.9
Iringa 9.1 10.0 17.2 27.2 18.1
Mbeya 9.0 18.2 20.4 33.2 24.2
Singida 9.5 8.8 13.7 12.5 3
Tabora 13.1 14.3 12.9 12.5 -0.6
Rukwa 11.8 14.2 17.6 23.5 11.7
Kigoma 9.9 12.8 12.1 17.2 7.3
Shinyanga 4.2 6.8 9.2 16.6 12.4
Kagera 3.4 5.5 6.2 9.2 5.8
Mwanza 10.2 18.6 20.5 33.3 23.1
Mara 7.3 10.5 18.6 17.4 10.1
Manyara n.a n.a 13.6 13.7 n.a
Njombe n.a n.a n.a 23.6 n.a
Katavi n.a n.a n.a 27.8 n.a
Simiyu n.a n.a n.a 7.0 n.a
Geita n.a n.a n.a 16.0 n.a
Source: Population and Housing Censuses: 1978, 1988, 2002 and 2012

Basic Facts and Figures, 2012 on Human Settlements in Tanzania Mainland
29
Table 2.4 shows that the proportion of urban population in Tanzania
Mainland increased from 13.3 percent in 1978 to 29.1 percent in 2012.
With the exception of Tabora the proportion of urban population in each
region increased between 1978 and 2012.
2.3 Child Labour
Child Labour is one of the common problems in both rural and urban
settlements. Child labour is defined as work performed by a person
under 18 years of age which is exploitative, hazardous or inappropriate
for his or her age. On the other hand, child work refers to work
performed by a person under 18 years of age which is not exploitative,
not hazardous or appropriate for his or her age. The increased rural to
urban migration in recent years, has contributed to child labour among
other factors. Table 2.5 shows the magnitude of this increasing social
problem.
Table 2.5: Percentage Distribution of Children Aged 5-17 Years and Residing in
Specified Areas by Type of Work, Tanzania Mainland, 2006
Area Sex
Type of Child Engagements
Total Child Labour Child
Work
No
Work Hazardous Non-
Hazardous
Dar-es- Male 4.6 1.6 70.4 23.4 100
Salaam Female 4.6 1.8 72.9 20.8 100
Total 4.6 1.7 71.7 22.1 100
Other
Urban
Male 2.4 6.3 69.3 22.0 100
Female 2.1 6.1 71.7 20.2 100
Total 2.3 6.2 70.5 21.1 100

Basic Facts and Figures, 2012 on Human Settlements in Tanzania Mainland
30
Table 2.5ctd: Percentage Distribution of Children Aged 5-17 Years and Residing
in Specified Areas By Type of Work, Tanzania Mainland, 2006
Area Sex
Type of Child Engagements
Total Child Labour Child
Work
No
Work Hazardous Non-
Hazardous
Rural Male 6.5 21.2 55.0 17.3 100
Female 4.8 17.7 61.6 15.9 100
Total
5.7 19.5 58.2 16.6 100
Total Male 5.8 17.5 58.3 18.5 100
Female 4.3 14.5 64.2 17.0 100
Total 5.1 16.0 61.2 17.7 100
Source: Integrated Labour Force Survey, 2006
Table 2.5 reveals that the extent of child labour in Dar es Salaam was
6.3 percent; other urban was 8.5 percent while in rural areas it was 25.2
percent. The overall proportion of children in child labour in Tanzania
Mainland was 21.1 percent.
Photographs depict different types of child labour that are common in both rural and
urban settings.

Basic Facts and Figures, 2012 on Human Settlements in Tanzania Mainland
31
CHAPTER THREE
Land Management and Administration
3.0 Introduction
This chapter focuses on land as an economic good of an increasing
value. It plays a big role in the process of poverty reduction through
wealth creation and hence improving the wellbeing of the people.
All land in Tanzania is held in trust by the President of the United
Republic of Tanzania on behalf of all Tanzanians and is therefore a
public property. In order to ensure higher security of land tenure,
Tanzania has three laws, namely, the Land Act No. 4 of 1999, Village
Land Act No. 5 of 1999 and the Land Disputes Act No. 2 of 2002. The
general purpose of these laws is to make sure that the land policy
objectives are achieved.
The Land Policy of 1995 recognizes three categories of land. These are:
reserved (protected) land (28%), village land (70%) and general land
(2%). Protected land includes land for urban settlements, national parks,
forest reserves, game reserves, game controlled areas, wetlands, marine
parks and reserves and Ngorongoro conservation area. The village land
includes rural settlements, agricultural land, grazing land and
community forests. General land includes large farms, land which is not
protected and land which is not village land.

Basic Facts and Figures, 2012 on Human Settlements in Tanzania Mainland
32
3.1 Fundamental Principles of the National Land Policy
The new land policy and laws represent a turning point in the
development of Tanzania. The implementation of the new land laws
will give substantive push to Government economic and social
development objectives under the liberalized free market economy and
poverty eradication strategy and the realization of the National
Development Vision 2025. The Vision will be achieved if the main
fundamentals of National Land Policy will be implemented. The
fundamental principles of the National Land Policy as amended in
Section 3 of Land Act No 4 of 1999 are:
a) To recognize that all land in Tanzania is public land vested in
the President of the United Republic of Tanzania as trustee on
behalf of all citizens.
b) To ensure existing rights and recognized longstanding
occupation or use of land are clarified and secured by law.
c) To facilitate an equitable distribution and access to land by all
citizens.
d) To regulate the amount of land that any one person or corporate
body may occupy or use.
e) To ensure that land is used productively and that any such use
complies with the principles of sustainable development.

Basic Facts and Figures, 2012 on Human Settlements in Tanzania Mainland
33
f) To take into account that an interest in land has value and that
value is taken into consideration in any transaction affecting
that interest.
g) To pay full, fair and prompt compensation to any person whose
right of occupancy or long standing occupation or customary
use of land is revoked or interfered with to their detriment by
the State or is acquired.
h) To provide for an efficient, effective, economical and
transparent system of land administration.
i) To enable all citizens to participate in decision making on
matters connected with their occupation of or use of land.
j) To facilitate the operation of the market for land.
k) To regulate the operation of the market for land so that rural
and urban small holders and pastoralists are not disadvantaged.
l) To set out rules of land law accessibility and in a manner that
can be readily understood by all citizens.
m) To establish an independent, expeditious and just system of the
adjudication of land disputes that will hear and determine cases
without undue delay.
n) To encourage the dissemination of information about land
administration and land law as provided for by this act through
programmes of public awareness using all forms of media.
Basic Facts and Figures, 2012 on Human Settlements in Tanzania Mainland
34
These fundamental principles are implemented through land tenure
system which has been established and operated through Land Acts No.
4 and 5 of 1999.
3.2 Land Tenure System
Land Tenure System is a system by which land is owned/used (land
ownership and acquisition). There are two major types of land tenure:-
Granted right of occupancy
Deemed right of occupancy or customary right of occupancy or
sometimes the communal ownership.
The stated forms of land tenure/ownership are recognized by Land Act
No. 4 and Village Land Act No. 5 of 1999.
3.2.1 Granted Right of Occupancy
An application for right of occupancy as described in the Land Act can
be done by a citizen, non citizen, a group of two or more citizens and
shall be submitted on a prescribed form and accompanied by
information which may be prescribed by the commissioner.
Procedures to be followed in acquiring land under Granted Right
of Occupancy are as follows:
a) Ownership of land is by way of grant by the Commissioner for
Land.

Basic Facts and Figures, 2012 on Human Settlements in Tanzania Mainland
35
b) Every application for grant of right of occupancy is made to the
relevant allocating authority or officer authorized by the
Commissioner for Land.
c) Received applications at the local authority need to be referred
to the Commissioner of Land.
d) For investment purposes Commissioner of Land needs to
receive recommendations from the Tanzania Investment Centre.
e) For other developmental purposes Commissioner of Land has to
consult respective local authorities for getting
recommendations.
3.2.2 Customary Right of Occupancy
Most of the agricultural land under small holder farmers is held under
customary right of occupancy and can mostly be found within village
land category. Some medium scale farmers have land in the village land
category. Large scale farms are normally outside of the village land and
are likely to have certificates of right of occupancy.
Procedures to be followed in acquiring land under Certificates of
Customary Right of Occupancy
An application for a customary right of occupancy shall be made using
a prescribed form and accompanied by a document and information
which may be required by the village council. This application can be
done by a person, a family unit, a group of persons as described in the
Village Land Act.
Basic Facts and Figures, 2012 on Human Settlements in Tanzania Mainland
36
Management of village land responsibilities are under Village Council,
the council is responsible for recommending to the Village. The council
also assembles land use plans with due regard to the principles of
sustainable development and relation between uses of other natural
resources and environment. Allocating institution of Land is the Village
Council upon consultation with the Village Assembly after
accomplishing the following requirements;-
The village has a village certificate
The village should be bounded by Village Land Use Plan
The village must have village registry
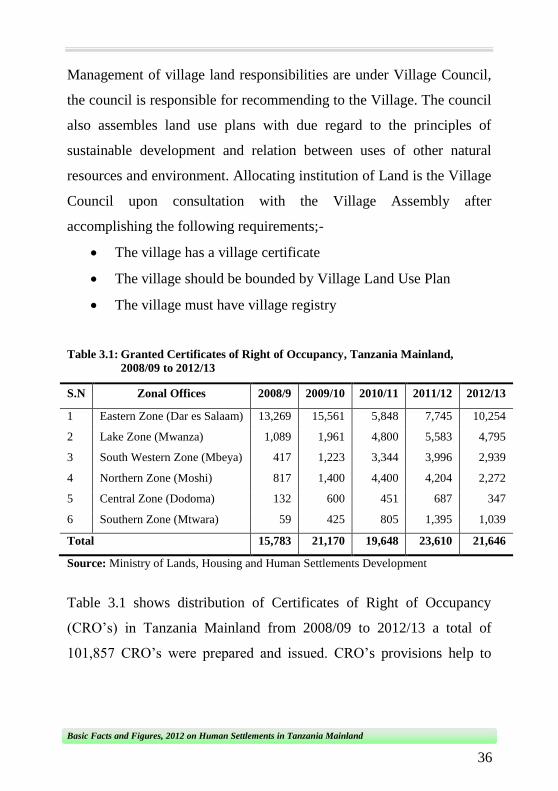
Table 3.1: Granted Certificates of Right of Occupancy, Tanzania Mainland,
2008/09 to 2012/13
S.N Zonal Offices 2008/9 2009/10 2010/11 2011/12 2012/13
1 Eastern Zone (Dar es Salaam) 13,269 15,561 5,848 7,745 10,254
2 Lake Zone (Mwanza) 1,089 1,961 4,800 5,583 4,795
3 South Western Zone (Mbeya) 417 1,223 3,344 3,996 2,939
4 Northern Zone (Moshi) 817 1,400 4,400 4,204 2,272
5 Central Zone (Dodoma) 132 600 451 687 347
6 Southern Zone (Mtwara) 59 425 805 1,395 1,039
Total 15,783 21,170 19,648 23,610 21,646
Source: Ministry of Lands, Housing and Human Settlements Development
Table 3.1 shows distribution of Certificates of Right of Occupancy
(CRO’s) in Tanzania Mainland from 2008/09 to 2012/13 a total of
101,857 CRO’s were prepared and issued. CRO’s provisions help to
Basic Facts and Figures, 2012 on Human Settlements in Tanzania Mainland
37
reduce unplanned urban settlements and facilitate the provision of social
services.
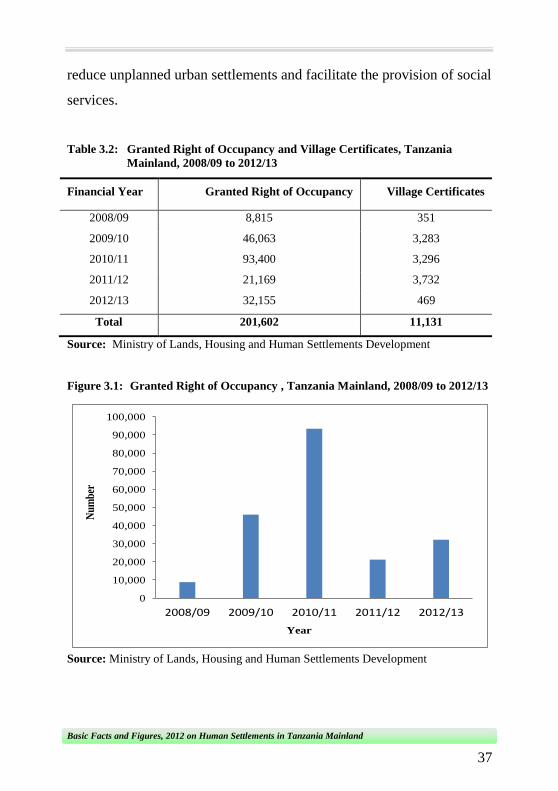
Table 3.2: Granted Right of Occupancy and Village Certificates, Tanzania
Mainland, 2008/09 to 2012/13
Financial Year Granted Right of Occupancy Village Certificates
2008/09 8,815 351
2009/10 46,063 3,283
2010/11 93,400 3,296
2011/12 21,169 3,732
2012/13 32,155 469
Total 201,602 11,131
Source: Ministry of Lands, Housing and Human Settlements Development
Figure 3.1: Granted Right of Occupancy , Tanzania Mainland, 2008/09 to 2012/13
0
10,000
20,000
30,000
40,000
50,000
60,000
70,000
80,000
90,000
100,000
2008/09 2009/10 2010/11 2011/12 2012/13
Nu
mb
er
Year
Source: Ministry of Lands, Housing and Human Settlements Development

Basic Facts and Figures, 2012 on Human Settlements in Tanzania Mainland
38
Figure 3.2: Granted Village Certificates, Tanzania Mainland, 2008/09 to 2012/13
0
500
1000
1500
2000
2500
3000
3500
4000
2008/09 2009/10 2010/11 2011/12 2012/13
Num
ber
Year
Source: Ministry of Lands, Housing and Human Settlements Development
Table 3.2 shows that from 2008/09 to 2012/13 about 201,602 customary
right of occupancy and about 11,131village certificates were granted.
Customary right of occupancy and village certificates provisions help to
reduce unplanned rural settlements and facilitate the provisions of social
services.
Table 3.3: Plots and Farms Surveyed and Approved, Tanzania Mainland, 2008/09
to 2012/13
Source: Ministry of Lands, Housing and Human Settlements Development
Financial Year Farms Plots
2008/09 734 18,641
2009/10 609 37,820
2010/11 706 26,788
2011/12 2,169 34,049
2012/13 886 58,393
Totals 5,104 175,691

Basic Facts and Figures, 2012 on Human Settlements in Tanzania Mainland
39
Figure 3.3:Plots Surveyed and Approved, Tanzania Mainland, 2008/09 to 2012/13
0
10,000
20,000
30,000
40,000
50,000
60,000
70,000
2008/09 2009/10 2010/11 2011/12 2012/13
Nu
mb
er
Year
Source: Ministry of Lands, Housing and Human Settlements Development
Figure 3.4: Farms Surveyed and Approved, Tanzania Mainland, 2008/09 to
2012/13
0
500
1000
1500
2000
2500
2008/09 2009/10 2010/11 2011/12 2012/13
Nu
mb
er
Year
Source: Ministry of Lands, Housing and Human Settlements Development

Basic Facts and Figures, 2012 on Human Settlements in Tanzania Mainland
40
Table 3.3 shows surveyed plots and farms in Tanzania Mainland from
2008/09 up to 2012/13. In total, 5,104 farms and 175,691 plots were
surveyed and approved. Surveyed farms and plots help to improve rural
and urban settlement settings by providing secure land tenure and
facilitate the provisions of social services.
3.3 Land Disputes
A land dispute is a situation in which two entities make a legal claim to
a piece of land. This dispute could be over the right of land use between
land users and other organizations or persons in connection with the
appropriation or withdrawal of land from the users, with the system of
land management, and with the exercising of other functions of disposal
and control of the land.
In Tanzania, problems associate with land disputes are on the increase
both in urban and rural areas. In rural areas farmers and livestock
keepers are the main users of what is termed as Village Land and
General Land. They grow crops and rear animals on the land. As a
matter of fact, their economic and social development to a large extent
depends on the availability of land. According to the Land Resources
and Research Institute (HakiArdhi), five land disputes are reported daily
in Tanzania, three of which involve powerful investors.
The increase in land disputes is the result of a rapid rise in land use
without a corresponding increase in land use plans, outdated land laws

Basic Facts and Figures, 2012 on Human Settlements in Tanzania Mainland
41
and the slow pace of issuing land titles. The rise in land disputes has
also been attributed to the inability of land tribunals to settle conflicts,
especially ward tribunals (Table 3.4). Villagers also do not know their
land rights and cannot, therefore, press for justice. Poor town planning
has also contributed to the problem.
Most of land contracts in rural areas are biased against villagers because
the decisions are made illegally and nobody is held accountable for
wrong decisions. Under the 1999 Village Land Act, the quorum for a
ward land tribunal is 17 members, which is equal to two-thirds of all
members, but this principle is regularly ignored. One village reportedly
sold 200 hectares to an investor based on a decision made by 14
members. Some tribunals have also operated like the courts, charging
land bidders fees ranging from TShs. 100,000 to TShs. 150,000. The
rights of livestock keepers are not recognised under the current land
policy and laws, leading to regular conflicts between farmers and
nomadic pastoralists.

Basic Facts and Figures, 2012 on Human Settlements in Tanzania Mainland
42
Table 3.4: Judgments Passed at Land Disputes Tribunals in Some Districts,
Tanzania Mainland, 2008/09
S/N Tribunal Number of
Complaints
Reported
Complaints
Judgments
passed
Ongoing
Complaints
1 Arusha 509 418 390 537
2 Babati 345 468 399 414
3 Bukoba 778 694 476 996
4 Chato 28 170 99 99
5 Dodoma 159 267 191 235
6 Geita 156 15 24 173
7 Ifakara 95 317 167 245
8 Ilala 648 1210 373 1485
9 Iringa 201 190 182 109
10 Karatu 107 129 135 101
11 Kigoma 211 204 120 295
12 Moshi 271 407 275 403
13 Kinondoni 967 833 704 1345
14 Lindi 31 64 57 38
15 Mbeya 293 271 165 399
16 Mbinga 17 138 114 41
17 Morogoro 403 323 161 569
18 Mtwara 141 96 106 31
19 Musoma 281 285 246 330
20 Mwanza 997 597 478 1116

Basic Facts and Figures, 2012 on Human Settlements in Tanzania Mainland
43
Table 3.4 ctd: Judgments Passed at Land Disputes Tribunals in Some Districts,
Tanzania Mainland, 2008/09
S/N Tribunal Number of
Complaints
Reported
Complaints
Judgments
passed
Ongoing
Complaints
21 Njombe 73 109 89 93
22 Pwani 251 287 249 289
23 Rukwa 81 171 148 104
24 Rungwe 100 58 70 7
25 Same 19 3 165 7
26 Shinyanga 120 426 46 381
27 Simanjiro 30 69 227 53
28 Singida 188 314 134 275
29 Songea 170 121 103 157
30 Tabora 77 161 144 135
31 Tanga 89 281 354 226
32 Tarime 204 663 354 513
33 Temeke 584 574 525 633
Total 8,624 10,333 7,470 11,834
Source: Ministry of Lands, Housing and Human Settlements Development
Table 3.4 shows the regional and/ or district distribution of
judgements that were passed at Land Disputes Courts in Tanzania
Mainland in 2008/09. The data reveals that 7,470 were
judgements passed and 11,834 were ongoing complaints. The
government continues with efforts to improve the situation.

Basic Facts and Figures, 2012 on Human Settlements in Tanzania Mainland
44
Table 3.5: The Resolution of Disputes Over Land and House Districts
from July, 2012 up to April, 2013
No. Council
Complaints
brought
forward up
to June,
2012
New
complaints
reported
from July,
2012 -
April, 2013
Judgement
passed
On going
complaints
1 Arusha 756 391 481 666
2 Babati 663 569 436 796
3 Bukoba 1042 750 672 1120
4 Chato 696 238 185 749
5 Dodoma 565 647 443 769
6 Geita 508 213 166 555
7 Ifakara 423 436 377 482
8 Ilala 1163 625 519 1269
9 Iringa 458 247 193 512
10 Karatu 29 59 50 38
11 Kigoma 284 222 194 312
12 Kinondoni 1397 626 706 1317
13 Lindi 57 133 121 69
14 Mbeya 803 297 208 892
15 Mbiga 48 142 140 50
16 Maorogoro 1016 410 227 1199
17 Moshi 366 205 233 338
18 Mtwara 49 112 135 26
19 Musoma 302 549 518 333
20 Mwanza 1907 429 297 2039
21 Njombe 133 113 123 123
22 Pwani 445 819 571 693
23 Rungwe 122 230 157 195

Basic Facts and Figures, 2012 on Human Settlements in Tanzania Mainland
45
Table 3.5 (ctd): The Resolution of Disputes Over Land and House Districts from
July, 2012 up to April, 2013
No. Council
Complaints
brought
forward up
to June,
2012
New
complaints
reported
from July,
2012 -
April, 2013
Judgement
passed
On going
complaints
24 Same 210 92 100 202
25 Shinyanga 26 199 149 76
26 Simanjiro 138 179 111 206
27 Singida 97 284 167 214
28 Songea 220 199 129 290
29 Rukwa 164 277 243 198
30 Tabora 311 231 211 331
31 Tanga 307 285 153 439
32 Tarime 553 284 237 600
33 Temeke 1587 429 313 1703
34 Kondoa 68 146 194 20
35 Korogwe 330 463 252 541
36 Iramba 165 158 91 232
37 Maswa 109 161 133 137
38 Ukerewe 37 112 116 33
39 Mkuranga 100 113 80 133
Jumla 17654 12074 9831 19897 Source: Ministry of Lands, Housing and Human Settlements Development

Basic Facts and Figures, 2012 on Human Settlements in Tanzania Mainland
46
Table 3.6: Land Dispute Cases Existing and were Determined in Districts,
Tanzania Mainland, 2008/09 to 2012/13
Financial Year Cases Existing Cases Determined
2008/09 8,652 6,770
2009/10 11,834 7,123
2010/11 12,735 7,756
2011/12 15,754 10,092
2012/13 19,897 9,831
Totals 68,872 41,572
Source: Ministry of Lands, Housing and Human Settlements Development
Table 3.6 shows the number of cases that were determined by land
disputes tribunals in Tanzania Mainland from 2008/09 to 2012/13. The
Table reveals that out of 68,872 cases, 41,572 cases (60%) were
determined in the last five years. The government continues with efforts
to improve the situation by establishing more tribunals each year.
Figure 3.5: The Cases Determined and Existing in the Districts Land and Housing
Tribunals, Tanzania Mainland, 2008/09 to 2012/13
0
5,000
10,000
15,000
20,000
25,000
2008/09 2009/10 2010/11 2011/12 2012/13
Nu
mb
er
Year
Cases Existing
Cases Determined
Source: Ministry of Lands, Housing and Human Settlements Development

Basic Facts and Figures, 2012 on Human Settlements in Tanzania Mainland
47
3.4 Land Use
3.4.1 Urban Settlements
In urban areas the increasing trend of migration of people from rural to
urban areas for economic reasons has led to the growth of unplanned
settlements and slums. The rapid growth of cities and towns puts an
ever increasing pressure on the urban infrastructure (transport, housing,
water and sanitation, and energy). It also leads to an increase in crime.
Urban housing is a good example of the pressures that rapid population
growth exerts on the social and physical infrastructure of the towns and
cities. To curb the problem the government through NHC under
MLHHSD has been building new housing units. To date there are more
than 17,530 housing units built all over Tanzania by the NHC.
3.4.2 Rural Settlements
Villages land use plans help to identify rural settlements development in
Tanzania. The Ministry of Lands, Housing and Human Settlements
Development through National Land Use Planning Commission
(NLUPC) is mandated to prepare Village land use plans in Tanzania
Mainland.

Basic Facts and Figures, 2012 on Human Settlements in Tanzania Mainland
48
Table 3.7: Number of Villages with Land Use Plans Prepared, Tanzania Mainland,
2008/09 to 2012/13
Financial Year Villages Land Use Plans Prepared
2008/09 125
2009/10 128
2010/11 158
2011/12 82
2012/13 111
Total 604
Source: Ministry of Lands, Housing and Human Settlements Development
Table 3.6 shows the villages for which land use plans have been
prepared. A total of 604 villages were provided with land use plans
from 2008 to 2013. Villages land use plan is one of the pre-requisite for
granting certificates of customary right of occupancy.
Figure 3.6: Village Land Use Plans Prepared, Tanzania Mainland, 2008/09 to
2012/13
0
20
40
60
80
100
120
140
160
180
2008/09 2009/10 2010/11 2011/12 2012/13
Nu
mb
er
Year
Source: Ministry of Lands, Housing and Human Settlements Development

Basic Facts and Figures, 2012 on Human Settlements in Tanzania Mainland
49
3.5 Agriculture
3.5.1 Introduction
Agriculture remains the largest sector in the economy and hence its
performance has a significant effect on the output and the corresponding
income and poverty levels. The livelihood of over 70 percent of the
poor who are in rural areas depends on agriculture. Average
contribution of agriculture to GDP over the five year period (2008 -
2012) was about 25.1 percent (Economic Survey, 2012). The growth
has been different in three subsectors of food crops, cash crops and
livestock. Within Agriculture, crops are the most important sub sector
accounting about 20 percent of total agricultural GDP.

Basic Facts and Figures, 2012 on Human Settlements in Tanzania Mainland
50
Table 3.8: Small Scale Farms: The Area Planted (000’ha) with Selected Cereal
Crops during the 2007/08 Crop Year by Region and Type of Cereal,
Tanzania Mainland
Region Maize Paddy Sorghum Bulrush
Millet
Finger
Millet Wheat
Dodoma 337.4 2.8 95.0 80.5 9.7 0.0
Arusha 105.9 0.6 1.7 0.0 0.5 4.0
Kilimanjaro 63.3 0.8 0.1 0.0 1.7 0.0
Tanga 187.2 5.6 0.5 0.0 0.0 0.0
Morogoro 111.9 82.0 7.5 0.0 0.0 0.0
Pwani 43.6 19.5 3.7 0.0 0.0 0.0
Dar es Salaam 3.6 4.3 0.0 0.0 0.0 0.0
Lindi 75.5 18.3 38.0 0.3 0.0 0.0
Mtwara 77.5 21.4 19.6 0.0 0.3 0.0
Ruvuma 149.1 48.1 2.1 0.1 7.3 2.7
Iringa 245.7 6.5 4.4 0.0 6.1 17.5
Mbeya 229.2 81.1 18.2 1.5 7.3 5.4
Singida 149.9 13.0 97.4 48.9 6.8 0.1
Tabora 291.0 99.2 45.8 1.2 0.8 0.3
Rukwa 223.2 45.7 8.7 0.0 10.6 1.9
Kigoma 14.7 0.7 1.7 0.6 0.0 0.0
Shinyanga 514.1 170.3 97.7 14.6 0.8 0.0
Kagera 11.7 6.0 9.2 0.0 0.6 0.0
Mwanza 36.3 48.8 2.5 1.7 0.0 0.0
Mara 64.6 2.7 32.9 0.3 5.7 0.0
Manyara 255.9 2.2 8.2 1.0 1.9 10.2
Total Area
Planted 3,191.4 679.7 494.8 150.8 60.1 42.2
Source: Agriculture Sample Census 2007/08
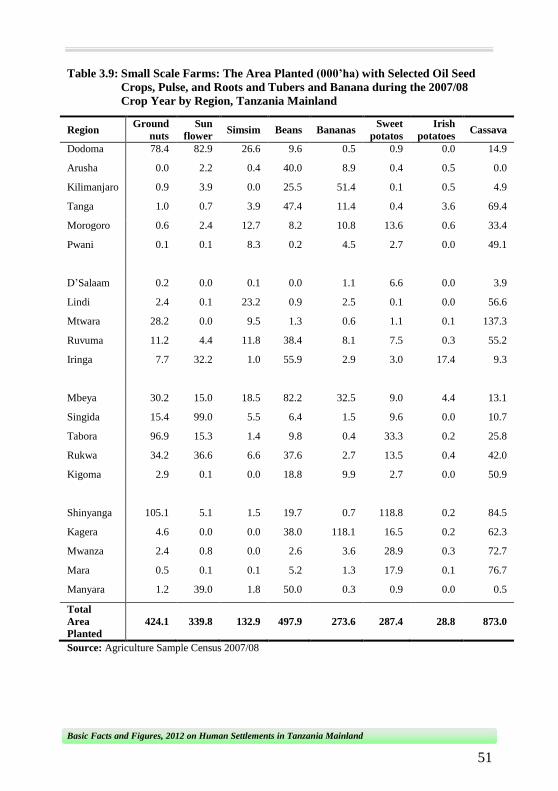
Basic Facts and Figures, 2012 on Human Settlements in Tanzania Mainland
51
Table 3.9: Small Scale Farms: The Area Planted (000’ha) with Selected Oil Seed
Crops, Pulse, and Roots and Tubers and Banana during the 2007/08
Crop Year by Region, Tanzania Mainland
Region Ground
nuts
Sun
flower Simsim Beans Bananas
Sweet
potatos
Irish
potatoes Cassava
Dodoma 78.4 82.9 26.6 9.6 0.5 0.9 0.0 14.9
Arusha 0.0 2.2 0.4 40.0 8.9 0.4 0.5 0.0
Kilimanjaro 0.9 3.9 0.0 25.5 51.4 0.1 0.5 4.9
Tanga 1.0 0.7 3.9 47.4 11.4 0.4 3.6 69.4
Morogoro 0.6 2.4 12.7 8.2 10.8 13.6 0.6 33.4
Pwani 0.1 0.1 8.3 0.2 4.5 2.7 0.0 49.1
D’Salaam 0.2 0.0 0.1 0.0 1.1 6.6 0.0 3.9
Lindi 2.4 0.1 23.2 0.9 2.5 0.1 0.0 56.6
Mtwara 28.2 0.0 9.5 1.3 0.6 1.1 0.1 137.3
Ruvuma 11.2 4.4 11.8 38.4 8.1 7.5 0.3 55.2
Iringa 7.7 32.2 1.0 55.9 2.9 3.0 17.4 9.3
Mbeya 30.2 15.0 18.5 82.2 32.5 9.0 4.4 13.1
Singida 15.4 99.0 5.5 6.4 1.5 9.6 0.0 10.7
Tabora 96.9 15.3 1.4 9.8 0.4 33.3 0.2 25.8
Rukwa 34.2 36.6 6.6 37.6 2.7 13.5 0.4 42.0
Kigoma 2.9 0.1 0.0 18.8 9.9 2.7 0.0 50.9
Shinyanga 105.1 5.1 1.5 19.7 0.7 118.8 0.2 84.5
Kagera 4.6 0.0 0.0 38.0 118.1 16.5 0.2 62.3
Mwanza 2.4 0.8 0.0 2.6 3.6 28.9 0.3 72.7
Mara 0.5 0.1 0.1 5.2 1.3 17.9 0.1 76.7
Manyara 1.2 39.0 1.8 50.0 0.3 0.9 0.0 0.5
Total
Area
Planted
424.1 339.8 132.9 497.9 273.6 287.4 28.8 873.0
Source: Agriculture Sample Census 2007/08

Basic Facts and Figures, 2012 on Human Settlements in Tanzania Mainland
52
3.5.2 Crop Production
The crops sub-sector grew by 3.4 percent in 2009 compared to 5.1
percent in 2008. The decline in growth was due to the lack of adequate
rainfall in the northern part of the country. This led to poor harvests and
lack of animal feed and water
Food Crops
The aggregate national food availability in Tanzania is not plenty, but
rather of a critical balance between production and needs. Food crop
production dominates Tanzania’s agriculture economy with over 5
million hectares cultivated per year, of which 85 percent is food crops.
The major staples include maize, sorghum, millet, wheat, pulses
(mainly beans), cassava and potatoes. Other food crops include
groundnuts, sesame, coconuts, soya beans, bananas and plantains.
Among food crops, cereals are the major crops grown in Tanzania. The
area planted with cereals in 2007/08 was 4,798,071 hectares
representing 61percent of total planted area followed by roots and
tubers 14 percent, pulses 12 percent and oil seeds 7 percent. Among
cereals, maize production is higher than any other cereal in Tanzania
and accounts for over 75 percent of total cereals produced. Production
patterns oscillate dramatically, according to the unpredictable weather
conditions in a given harvest year. In the past 10 years, for instance,
maize production has varied considerably, ranging from 2,638 million
tonnes in 2006/7, to as low as 2,107 million tonnes in 2009/2010.

Basic Facts and Figures, 2012 on Human Settlements in Tanzania Mainland
53
A field of maize crop
Annual demand for staples in Tanzania is about 11 million tonnes with
maize and rice accounting for half of the total. Tanzania’s average
yields for maize and rice are far below the African average. Low
productivity of cereals in Tanzania is attributed to dependency on rain-
fed agriculture and low usage of fertilizer, improved seeds, pesticides
and suitable farming equipments.
Cash Crops
Principal export crops include coffee, tea, cotton, cashewnuts, sisal, oil
seeds, horticultural crops, pyrethrum, fresh cut flowers, cloves and
spices. In terms of value, coffee is the most important agricultural
export. Recent exports show that coffee accounted for 17.7 percent of
the Tanzania’s total agricultural exports in 2009/2010. It was followed
by cotton, cashew nuts, tobacco, tea and sisal. In Zanzibar, the major
cash crop is cloves, 90 percent of which is produced on the island of

Basic Facts and Figures, 2012 on Human Settlements in Tanzania Mainland
54
Pemba. The major importers of Tanzania’s agricultural exports are the
EU countries, especially the United Kingdom, Germany, and the
Netherlands.
Impressive progress has been registered in recent years in growing
export crops following the influx of investors interested in large scale
farming. In 2009/10, production of some of the cash crops including
cotton, pyrethrum and tobacco on average went up. Cotton production
went up from 267,004 tonnes in 2008/09 to 365,731 tonnes in 2009/10
while pyrethrum increased from 1,500 tonnes in 2008/09 to 3,320
tonnes in 2009/10 and tobacco production increased from 55,356 tonnes
in 2008/09 to 60,900 tonnes in 2009/10.
A sisal plantation
The increase in production was a result of better use of farm inputs
especially fertilizer and insecticides that were obtained through a

Basic Facts and Figures, 2012 on Human Settlements in Tanzania Mainland
55
special loan scheme known in Kiswahili as ‘ruzuku ya mbolea’
(fertilizer subsidy). Other reasons were stiff competition among
farmers, enough rains, use of good pyrethrum seeds and the expansion
of tobacco and cotton farms. On the other hand the, production of
coffee, cashew nuts, sisal, and tea went down in 2009/2010 compared to
2008/2009. In the 2010/11 financial year, production of sugar was
expected to increase from 279,850 tonnes in 2009/10 to 317,000 tonnes
2010/11 while that of tobacco was expected to go up from 60,900
tonnes in 2009/10 to 78,000 tonnes in 2010/11. That would be possible
if the intension to build capacity of farmers in utilizing modern farming
techniques as well as using improved seed varieties were realised. Tea
production went down from 33,160 tonnes in 2009/10 to 32,000 tonnes
in 2010/11 while that of sisal increased from 26,363 tonnes in 2009/10
to 35,000 tonnes in 2010/11 the increase in the number of sisal farms,
fuelled the improving of sisal prices at the world market. Coffee
production increased from 40,000 tonnes in 2009/10 to 60,575 tonnes in
2010/11 while cashew nut production increased from 74,169 tonnes in
2009/10 to 121,070 tonnes in 2010/11.
3.5.3 Arable Land
In agriculture, arable land is the land that is suitable for growing crops.
It includes all land under annual crops, temporary meadows for mowing
or market, and kitchen gardens and land temporary fallow (less than
five years). Abandoned land resulting from shifting cultivation is not
included in this category. Arable land is a category of agricultural land,

Basic Facts and Figures, 2012 on Human Settlements in Tanzania Mainland
56
which, according to Food and Agriculture Organization’s (FAO)
definition, additionally includes land under permanent or perennial
crops, such as fruit plantations, as well as permanent pastures, for
grazing of livestock.
Farmers cultivating the arable land using hand hoes
Tanzania is endowed with an area of about 88.6 million hectares of
land, out of which 44 million hectares are classified as suitable for
agriculture. However, part of this arable land may be only marginally
suitable for agricultural production for a variety of reasons, including
soil degradation and drought proneness. According to recent studies,
only 10.1 million hectares, or 23 percent of the arable land is under
cultivation. This includes around 2.2 to 3.0 million hectares of annual
crops, fallow of up to 5 years duration, permanent crops and pasture.

Basic Facts and Figures, 2012 on Human Settlements in Tanzania Mainland
57
3.6 Livestock Production
Livestock production is one of the major agricultural activities in
Tanzania. The sub sector contributes to national food supply, converts
rangelands resources into products suitable for human consumption and
is a source of cash incomes and inflation – free store of value. It
provides about 30 percent of the agricultural GDP. Out of the sub
sector’s contribution to GDP, about 40 percent originates from beef
production, 30 percent from milk production and another 30 percent
from poultry and small stock production.
Livestock production originates from a large resource base composed of
the different livestock species, breeds and types whose ownership and
distribution differ from region to region. Three livestock production
systems are commonly distinguished in the rangeland areas; commercial
ranching, pastoralism and agro-pastoralism.
Commercial ranching accounts for about 2 percent of the total cattle
herd. It is practised mainly by the National Ranching Company
(NARCO), currently in the process of being privatised. Private
commercial ranching exists in different regions of the country with
small stock numbers. Pastoralism is concentrated in the northern plains
and is practised in traditional grazing areas where climatic and soil
conditions do not favour crop production. The main roles of livestock
in this system are subsistence, store of wealth and source of cash
incomes.

Basic Facts and Figures, 2012 on Human Settlements in Tanzania Mainland
58
Table 3.10:Number of Livestock and Livestock Keeping Households by Type of
Livestock, Tanzania Mainland, 2007/08
Livestock Type Number of
Livestock
Number of
Households
Livestock/
household
Cattle 21,125,251 1,659,160 13
Goats 15,085,150 1,732,863 9
Sheep 5,718,975 638,469 9
Pigs 1,581,396 521,797 3
Chicken 42,666,543 3,745,867 11
Ducks 1,157,520 _ _
Turkeys 83,297 _ _
Rabbits 135,737 _ _
Donkeys 296,660 _ _
Source: Tanzania Agriculture Sample Census 2007/08
Agro-pastoralism, comprising a combination of crop cultivation with
livestock keeping is thriving, as livestock sector numbers have
continued to increase at a rate of more than 2 percent per annum. Out of
3.7 million households in the country, 3 percent are pastoralists and 7
percent are agro-pastoralists. Approximately 99 percent of the livestock
sub-sector belongs to traditional (small) owners, with big ranches and
dairy farms constituting the remaining 1 percent.

Basic Facts and Figures, 2012 on Human Settlements in Tanzania Mainland
59
Cattle and goats grazing
Carrying capacity of the rangeland is estimated at 20 million animal
units but there were only 16 million animal units in 2007/08. There is
ample potential for expansion of the livestock industry through better
animal husbandry and addition of livestock.
According to the available data for 2011/2012, cattle produced most of
the meat contributing 54 percent of total meat production whereas sheep
and goats contributed about 21 percent, pigs contributed about 9 percent
and chicken meat accounted for 16 percent. Meat produced in the
country is mainly for the domestic market although part of the annual
off-take of cattle, sheep and goats are exported mainly to neighbouring
and the Middle East countries.

Basic Facts and Figures, 2012 on Human Settlements in Tanzania Mainland
60
Annual milk production is estimated at 1.85 billion litres whereby about
68 percent is produced by indigenous cattle kept in rural areas and 32
percent by improved cattle mainly kept by smallholder producers and
commercial farms (Table 3.10). The milk production from the
indigenous cattle ranges from 1 – 2 litres per cow per day while for the
improved dairy cow milk production ranges between 7 and 10 litres per
cow per day. At present, about 10 percent of the milk produced annually
enter the market and the remaining is consumed at home or considered
to be a waste commercially mainly due to lack of collection systems.
Eggs are from indigenous and commercial layer chickens. Indigenous
chickens contribute almost 100 percent and 20 percent of eggs
consumed in rural and urban areas respectively. Whereas’ commercial
layers contribute more than 80 percent of all eggs consumed in urban
and peri-urban areas. Commercial layer production is concentrated in
major cities of Dar-es-Salaam, Kilimanjaro, Pwani, Dodoma, Iringa,
Morogoro and Mbeya.

Basic Facts and Figures, 2012 on Human Settlements in Tanzania Mainland
61
Table 3.11: Production of Livestock Products, Tanzania Mainland, 2000/01 - 2011/12
Type of
Product/Year
Meat Production (Tonnes) Milk Production (‘000’ litres) Egg
Production
(‘000’) Beef Lamb/
Mutton Pork Chicken Total
Traditional
Herd
Improved
Herd Total
2000/2001 181,000 72,100 20,000 50,000 323,100 492,500 321,500 814,000 600,000
2001/2002 182,000 74,000 21,000 55,000 332,000 578,000 322,500 900,500 650,000
2002/2003 182,500 74,500 23,000 61,500 341,500 620,700 359,800 980,500 790,000
2003/2004 184,000 75,800 26,000 63,000 348,800 813,700 366,300 1,180,000 910,000
2004/2005 204,520 78,093 27,000 68,896 378,509 920,000 466,400 1,386,400 1,858,660
2005/2006 208,046 78,766 30,672 69,900 387,384 935,540 485,056 1,420,596 2,100,800
2006/2007 180,629 80,936 31,721 77,280 370,566 945,524 475,681 1,421,205 2,230,900
2007/2008 218,976 81,173 33,307 77,250 410,706 980,000 520,000 1,500,000 2,690,000
2008/2009 225,178 82,884 36,000 78,168 422,230 1,012,436 591,690 1,604,126 2,806,350
2009/2010 243,943 86,634 38,180 80,916 449,673 997,261 652,596 1,649,857 2,917,875
2010/2011 262,606 103,709 43,647 93,534 503,496 1,135,422 608,800 1,744,222 3,339,566
2011/2012 289,835 111,106 47,246 84,524 532,711 1,255,938 597,161 1,853,099 3,494,584
Source: Ministry of Livestock and Fisheries Development
Basic Facts and Figures, 2012 on Human Settlements in Tanzania Mainland
62
CHAPTER FOUR
Housing Characteristics and Facilities
4.0 Introduction
This chapter deals with housing characteristics as revealed by type of
building materials, available facilities and services available in the
housing units such as source of energy, water , sanitation and garbage
disposal. These are some of the key indicators for measuring social
welfare and achievements made through the National Strategy for
Growth and Reduction of Poverty (NSGRP) known in Kiswahili as
MKUKUTA.
Table 4.1 reveals that about two thirds of households (68 percent) live
in dwellings with floors made of earth, sand or dung, followed by
households living in dwellings with floors made of cement (30 percent).
However, more urban households in Tanzania Mainland have floors of
their dwellings made of cement (71 percent) compared to rural
households (15 percent).
There are three main types of materials used to construct walls of
dwellings in Tanzania Mainland namely sundried bricks, poles and mud
and baked bricks.
Table 4.1 shows that 29 percent of households in Tanzania Mainland
live in dwellings with walls made of sun-dried bricks, 26 percent in

Basic Facts and Figures, 2012 on Human Settlements in Tanzania Mainland
63
dwellings with walls made of poles and mud 24 percent live in
dwellings with walls made of baked bricks. Less than one percent of
households were living in dwellings constructed with stones. On the
other hand 47 percent of households in urban areas live in dwellings
constructed using cement blocks compared to only four percent of
households in rural areas.
Sixty percent of households in Tanzania Mainland used iron sheets for
roofing material. Majority of households in urban areas use iron sheets
(88 percent) whereas in rural areas only half of households use iron
sheets and other half use grass, thatch or mud (Table 4.1).

Basic Facts and Figures, 2012 on Human Settlements in Tanzania Mainland
64
Table 4.1: Percentage Distribution of Households in Rural and Urban Areas by
Construction Materials of Dwelling, Tanzania Mainland, 2010
Construction Materials
2010 TDHS
Urban Rural Tanzania
Mainland
Flooring Material
Earth, Sand, dung 23.1 83.9 68.2
Cement 70.7 15.2 29.5
Other 6.1 0.8 2.2
Total 100 100 100
Main Wall Material
Grass 0.1 0.8 0.6
Poles and Mud 7.8 32.7 26.3
Sun-dried bricks 20.1 31.9 28.8
Baked bricks 23.2 24.3 24
Wood, timer 0.2 1.9 1.5
Cement blocks 46.7 3.8 14.8
Stones 1.2 0.2 0.5
Other 0.7 4.4 3.5
Total 100 100 100
Main Roof Material
Grass/thatch/mud 6.5 49 38.1
Iron Sheet 88 50.5 60.1
Tiles 1.8 0.2 0.6
Concrete 2.8 0 0.7
Asbestos 0.8 0.2 0.4
Other 0 0.1 0.1
Total 100 100 100
Source: Tanzania Demographic and Health Survey (TDHS) 2010

Basic Facts and Figures, 2012 on Human Settlements in Tanzania Mainland
65
Some houses in rural areas with grass as roofing material
The use of metal roofing and cement block walls are most common in urban areas.
4.1 Water Services
Water is one of the most important basic necessities. According to
MKUKUTA, the goal is to ensure access to clean, affordable and safe
water, sanitation, decent shelter and a safe and sustainable environment
and thereby reduced vulnerability from environmental risks.
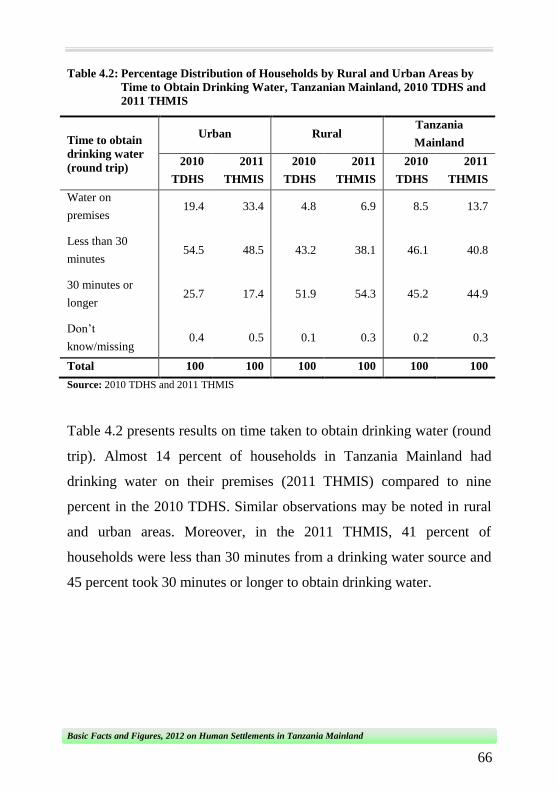
Basic Facts and Figures, 2012 on Human Settlements in Tanzania Mainland
66
Table 4.2: Percentage Distribution of Households by Rural and Urban Areas by
Time to Obtain Drinking Water, Tanzanian Mainland, 2010 TDHS and
2011 THMIS
Time to obtain
drinking water
(round trip)
Urban Rural Tanzania
Mainland
2010
TDHS
2011
THMIS
2010
TDHS
2011
THMIS
2010
TDHS
2011
THMIS
Water on
premises 19.4 33.4 4.8 6.9 8.5 13.7
Less than 30
minutes 54.5 48.5 43.2 38.1 46.1 40.8
30 minutes or
longer 25.7 17.4 51.9 54.3 45.2 44.9
Don’t
know/missing 0.4 0.5 0.1 0.3 0.2 0.3
Total 100 100 100 100 100 100
Source: 2010 TDHS and 2011 THMIS
Table 4.2 presents results on time taken to obtain drinking water (round
trip). Almost 14 percent of households in Tanzania Mainland had
drinking water on their premises (2011 THMIS) compared to nine
percent in the 2010 TDHS. Similar observations may be noted in rural
and urban areas. Moreover, in the 2011 THMIS, 41 percent of
households were less than 30 minutes from a drinking water source and
45 percent took 30 minutes or longer to obtain drinking water.

Basic Facts and Figures, 2012 on Human Settlements in Tanzania Mainland
67
Fetching water from a shallow well.
Shallow wells are the main source of water supply in rural areas of
Tanzania Mainland
Collecting tap water from the community facility

Basic Facts and Figures, 2012 on Human Settlements in Tanzania Mainland
68
Table 4.3: Total Number of Boreholes Drilled by Region, Tanzania Mainland,
2009-2013
Region 2009 2010 2011 2012 2013
Arusha 2 2 2 2 2
Pwani 11 15 10 18 7
Dar-es Salaam 73 31 70 50 30
Dodoma 2 2 15 10 10
Iringa 4 5 2 3 4
Lindi 1 3 3 4 2
Mwanza 18 8 6 5 3
Mara 4 2 4 4 3
Morogoro 2 4 4 10 15
Mtwara 14 11 10 3 4
Mbeya 1 5 4 9 1
Tabora 2 13 4 4 2
Rukwa 4 8 4 3 3
Shinyanga 1 2 2 1 3
Kigoma 17 14 10 4 2
Ruvuma 1 4 2 2 8
Kilimanjaro 2 6 4 4 -
Tanga 2 4 2 3 2
Singida 1 2 2 2 3
Manyara - 3 1 2 3
Kagera - - - - -
Njombe - - - - 2
Katavi - - - - 3
Geita - - - - -
Simiyu - - - - -
Total 162 144 161 143 112
Source: Ministry of Water and Irrigation

Basic Facts and Figures, 2012 on Human Settlements in Tanzania Mainland
69
Table 4.3 shows the regional distribution of drilled boreholes whereby a
total of 112 boreholes were drilled in 2013 compared to 143 in 2012,
which is equivalent to a decrease of 22 percent.
In 2011, a total of 2,836 water samples were collected from various
sources of domestic water for laboratory testing, compared to 1,684
water samples collected for test in 2010. Out of those, 2,110 water
samples, equivalent to 74.4 percent met the required standards for
human consumption.
4.2 Sanitation
Ensuring the availability of adequate sanitation facilities is another
Millennium Development Goal that Tanzania shares with other
countries. A household is classified as having an improved toilet if the
toilet is used only by members of one household (i.e. it is not shared)
and if the facility used by the household separates the waste from
human contact (WHO/UNICEF, 2004).
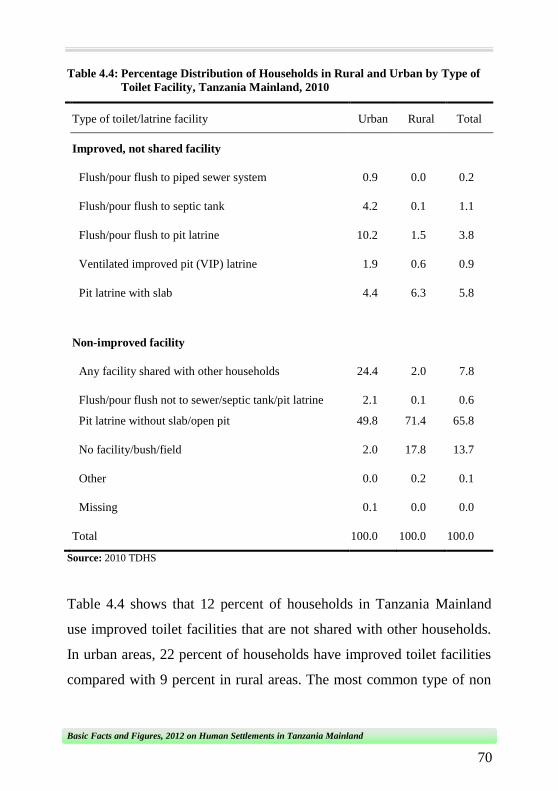
Basic Facts and Figures, 2012 on Human Settlements in Tanzania Mainland
70
Table 4.4: Percentage Distribution of Households in Rural and Urban by Type of
Toilet Facility, Tanzania Mainland, 2010
Type of toilet/latrine facility Urban Rural Total
Improved, not shared facility
Flush/pour flush to piped sewer system 0.9 0.0 0.2
Flush/pour flush to septic tank 4.2 0.1 1.1
Flush/pour flush to pit latrine 10.2 1.5 3.8
Ventilated improved pit (VIP) latrine 1.9 0.6 0.9
Pit latrine with slab 4.4 6.3 5.8
Non-improved facility
Any facility shared with other households 24.4 2.0 7.8
Flush/pour flush not to sewer/septic tank/pit latrine 2.1 0.1 0.6
Pit latrine without slab/open pit 49.8 71.4 65.8
No facility/bush/field 2.0 17.8 13.7
Other 0.0 0.2 0.1
Missing 0.1 0.0 0.0
Total 100.0 100.0 100.0
Source: 2010 TDHS
Table 4.4 shows that 12 percent of households in Tanzania Mainland
use improved toilet facilities that are not shared with other households.
In urban areas, 22 percent of households have improved toilet facilities
compared with 9 percent in rural areas. The most common type of non

Basic Facts and Figures, 2012 on Human Settlements in Tanzania Mainland
71
improved toilet facility is an open pit latrine or one without slabs, used
by 71 percent of households in rural areas and 50 percent of households
in urban areas. Overall, 14 percent of households in Tanzania Mainland
have no toilet facility. Most of these households are in rural areas. This
is a matter of concern to local government authorities who are
responsible for supervising sanitation and health promotion initiatives in
their administrative areas.
4.3 Garbage Disposal
The importance of garbage disposal is well documented. Proper garbage
disposal is important for many reasons, including personal and public
health, safety, and the environment. Garbage disposal management is of
great importance to both rural and urban areas.

Basic Facts and Figures, 2012 on Human Settlements in Tanzania Mainland
72
Table 4.5: Distribution of Households in Rural and Urban Areas by Means of
Garbage Disposal, Tanzania Mainland, 2000/01 and 2007
Means of
Garbage
Disposal
Dar-es-Salaam
(%)
Other Urban
(%)
Rural Areas
(%)
Tanzania
Mainland
(%)
2000/01 2007 2000/01 2007 2000/01 2007 2000/01 2007
Rubbish
pit in
Compound
14.6 15.4 24.7 33.5 23.5 31.9 23.1 30.6
Rubbish
pit Outside
Compound
38.4 21.3 44.9 36.6 27.1 23.8 30.5 26.0
Rubish bin 20.3 32.8 8.8 9.0 0.5 0.4 3.1 5.2
Rubbish
thrown
Inside
Compound
1.2 3.1 8.9 7.2 22.8 27.7 19.3 21.3
Rubbish
thrown
outside
compound
16.2 22.4 11.8 12.1 24.5 15.1 22.0 15.2
Other 9.3 5.0 0.9 1.6 1.6 1.1 2.0 1.6
Total 100.0 100.0 100.0 100.0 100.0 100.0 100.0 100.0
Source: Household Budget Survey 2007
Table 4.5 reveals that from 2000/01 to 2007, the majority of households
in Dar-es-Salaam and other urban areas use rubbish pit outside
compound for garbage disposal. Other common means of garbage
disposal are rubbish pit in compound and rubbish thrown outside
compound. Likewise the data shows that a small number of households

Basic Facts and Figures, 2012 on Human Settlements in Tanzania Mainland
73
in rural areas from 2000/01 to 2007 used rubbish bin for garbage
disposal.
4.4 Energy
Cooking and heating with solid fuels can lead to high levels of indoor
smoke, a complex mix of health-damaging pollutants such as carbon
monoxide, a poisonous gas if inhaled in a large quantities often causes
death. Solid fuels are defined as charcoal, wood, straw, shrubs, and grass.

Basic Facts and Figures, 2012 on Human Settlements in Tanzania Mainland
74
Table 4.6: Percentage Distribution of Households in Rural and Urban Areas by
Energy Source for Lighting and Cooking, Tanzania Mainland, 2011
Source: 2011 THMIS
Energy Source Urban Rural Total
Energy for Cooking
Electricity 0.7 0.0 0.2
Bottled gas 1.7 0.1 0.5
Biogas 0.4 0.1 0.2
Paraffin/Kerosene 7.0 0.5 2.1
Charcoal 69.2 8.5 24.0
Firewood 18.8 90.1 71.9
Straw/shrubs/grass 0.0 0.2 0.1
Agricultural crop 0.1 0.1 0.1
Other 0.4 0.2 0.2
No food cooked in household 1.7 0.2 0.6
Total 100.0 100.0 100.0
Percentage using solid fuel for 88.2 98.8 96.1
cooking
1
Lighting Energy
Electricity 46.1 3.3 14.2
Solar 2.0 2.3 2.2
Gas 0.2 0.0 0.1
Paraffin-hurricane lamp 28.7 19.7 22.0
Paraffin-pressure lamp 1.2 1.4 1.4
Paraffin-wick lamp 15.3 46.2 38.3
Firewood 0.0 2.9 2.1
Candles 1.6 0.5 0.8
Lantern, Chinese battery lamp 4.9 23.6 18.8
Other 0.0 0.1 0.1
Total 100.0 100.0 100.0
Note: Total may not sum to 100.0 percent because of missing cases
LPG= Liquid Petroleum Gas
1Includes charcoal, wood, and straw/shrubs/grass

Basic Facts and Figures, 2012 on Human Settlements in Tanzania Mainland
75
Table 4.6 shows that almost all Tanzania’s households (96 percent) use
solid fuel for cooking, with wood being the major source of solid fuel
for cooking (72 percent of households). There are large differentials in
cooking fuel between urban and rural areas in Tanzania Mainland.
Whereas 90 percent of households in rural areas use wood for cooking,
the main source of cooking fuel in the urban areas is charcoal (69
percent).
About 62 percent of Tanzanian households use paraffin as their major
source of energy for lighting (22 percent hurricane lamp, 1 percent
pressure lamp, and 39 percent wick lamp). In Tanzania Mainland, 46
percent of households in urban areas use electricity as their major
source of energy for lighting, and 29 percent use a paraffin hurricane
lamp. Use of electricity as the main source of energy for lighting in
rural areas in Tanzania Mainland is very limited (3 percent), 14 percent
of households use electricity for lighting.
Basic Facts and Figures, 2012 on Human Settlements in Tanzania Mainland
76
CHAPTER FIVE
Infrastructure and Services
5.0 Introduction
Economic development of any country depends on an efficient and
reliable infrastructure. Transport and communication infrastructure are
important drivers in the whole process of socio-economic development
and poverty alleviation. Their effectiveness, appropriateness and
adequacy contribute a lot to the successful implementation of socio-
economic activities. Transport infrastructure includes roads, railways,
air and waterways. Transport and communication services contribute to
social economic development and enhance social accessibility to
services and information sharing. Other equally important socio-
economic services such as education, health and sanitation contribute to
improvement of human settlements and quality of life.
5.1 Surface Transport
Surface transport is the transportation of passengers and freight by road
or rail.
There are two types of surface transport which are:
i.Road Transport
ii.Railway Transport
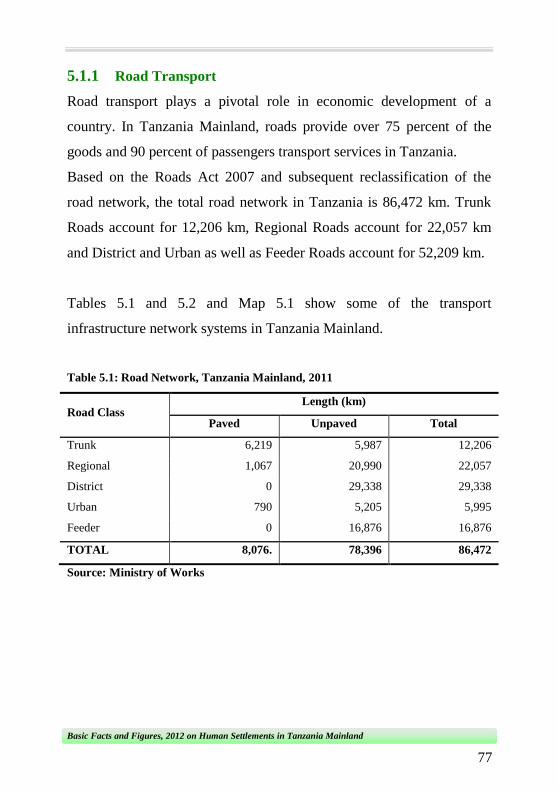
Basic Facts and Figures, 2012 on Human Settlements in Tanzania Mainland
77
5.1.1 Road Transport
Road transport plays a pivotal role in economic development of a
country. In Tanzania Mainland, roads provide over 75 percent of the
goods and 90 percent of passengers transport services in Tanzania.
Based on the Roads Act 2007 and subsequent reclassification of the
road network, the total road network in Tanzania is 86,472 km. Trunk
Roads account for 12,206 km, Regional Roads account for 22,057 km
and District and Urban as well as Feeder Roads account for 52,209 km.
Tables 5.1 and 5.2 and Map 5.1 show some of the transport
infrastructure network systems in Tanzania Mainland.
Table 5.1: Road Network, Tanzania Mainland, 2011
Road Class Length (km)
Paved Unpaved Total
Trunk 6,219 5,987 12,206
Regional 1,067 20,990 22,057
District 0 29,338 29,338
Urban 790 5,205 5,995
Feeder 0 16,876 16,876
TOTAL 8,076. 78,396 86,472
Source: Ministry of Works

Basic Facts and Figures, 2012 on Human Settlements in Tanzania Mainland
78
Map 5.1: Map of Tanzania Showing Transport Infrastructure
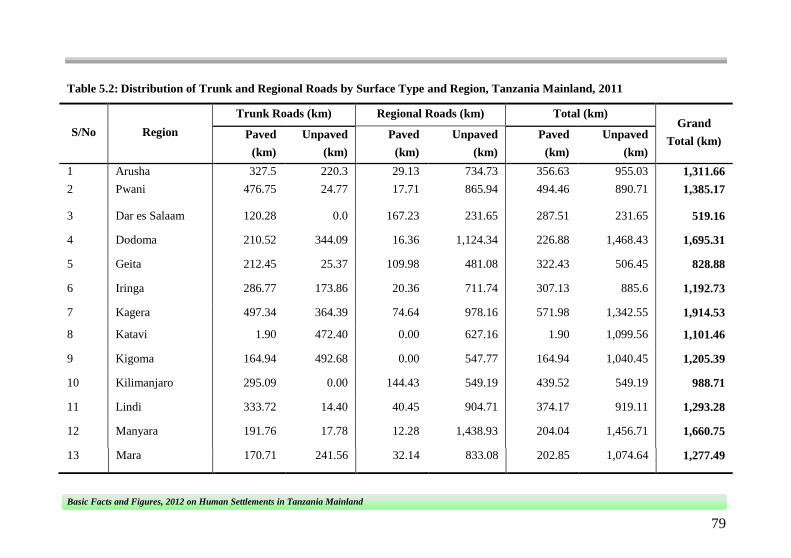
Basic Facts and Figures, 2012 on Human Settlements in Tanzania Mainland
79
Table 5.2: Distribution of Trunk and Regional Roads by Surface Type and Region, Tanzania Mainland, 2011
S/No Region
Trunk Roads (km) Regional Roads (km) Total (km) Grand
Total (km) Paved
(km)
Unpaved
(km)
Paved
(km)
Unpaved
(km)
Paved
(km)
Unpaved
(km)
1 Arusha 327.5 220.3 29.13 734.73 356.63 955.03 1,311.66
2 Pwani 476.75 24.77 17.71 865.94 494.46 890.71 1,385.17
3 Dar es Salaam 120.28 0.0 167.23 231.65 287.51 231.65 519.16
4 Dodoma 210.52 344.09 16.36 1,124.34 226.88 1,468.43 1,695.31
5 Geita 212.45 25.37 109.98 481.08 322.43 506.45 828.88
6 Iringa 286.77 173.86 20.36 711.74 307.13 885.6 1,192.73
7 Kagera 497.34 364.39 74.64 978.16 571.98 1,342.55 1,914.53
8 Katavi 1.90 472.40 0.00 627.16 1.90 1,099.56 1,101.46
9 Kigoma 164.94 492.68 0.00 547.77 164.94 1,040.45 1,205.39
10 Kilimanjaro 295.09 0.00 144.43 549.19 439.52 549.19 988.71
11 Lindi 333.72 14.40 40.45 904.71 374.17 919.11 1,293.28
12 Manyara 191.76 17.78 12.28 1,438.93 204.04 1,456.71 1,660.75
13 Mara 170.71 241.56 32.14 833.08 202.85 1,074.64 1,277.49

Basic Facts and Figures, 2012 on Human Settlements in Tanzania Mainland
80
Table 5.2(ctd):Distribution of Trunk and Regional Roads by Surface Type and Region, Tanzania Mainland, 2011
Source: MoW
S/No Region
Trunk Roads (km) Regional Roads (km) Total (km) Grand
Total (km) Paved
(km)
Unpaved
(km)
Paved
(km)
Unpaved
(km)
Paved
(km)
Unpaved
(km)
14 Mbeya 405.70 406.56 28.75 1,414.62 434.45 1,821.18 2,255.63
15 Morogoro 446.11 398.05 51.07 996.26 497.18 1,394.31 1891.49
16 Mtwara 171.26 112.74 52.4 719.32 223.66 832.06 1,055.72
17 Mwanza 231.04 18.04 19.93 682.48 250.97 700.52 951.49
18 Njombe 193.87 209.92 12.50 706.97 206.37 916.89 1,123.26
19 Rukwa 51.31 361.19 5.5 791.79 56.81 1,152.98 1,209.79
20 Ruvuma 332.46 592.61 12.90 1,203.11 345.36 1,795.72 2,141.08
21 Shinyanga 209.21 69.13 14.37 680.86 223.58 749.99 973.57
22 Simiyu 72.84 272.57 0.00 500.18 72.84 772.75 845.59
23 Singida 339.99 334.23 27.57 986.94 367.56 1,321.17 1,688.73
24 Tabora 152.08 813.82 8.01 969.32 160.09 1,783.14 1,943.23
25 Tanga 327.68 0.00 145.14 1,324.17 472.82 1,324.17 1,796.99
Total 6,223.28 5,980.46 1,042.85 21,004.50 7,266.13 26,994.96 34,251.09
Basic Facts and Figures, 2012 on Human Settlements in Tanzania Mainland
81
5.1.2 Railway Transport
Tanzania has two railway systems, Tanzania Railways Limited - TRL
and Tanzania and Zambia Railway Authority - TAZARA. The two
systems interface at Kidatu and at Dar es Salaam port. Together, the
railways serve 16 of the 25 regions in Tanzania Mainland. They also
serve neighbouring countries of Zambia, Democratic Republic of
Congo, Burundi, Rwanda, Uganda and Malawi.
TRL is owned wholly by Tanzania Government after the concession
agreement with RITES Company of India ceased in 2007. On the other
hand TAZARA is owned jointly by Tanzania and Zambia on 50/50
percent basis. The coverage of the two railway systems is shown in Map
5.2.
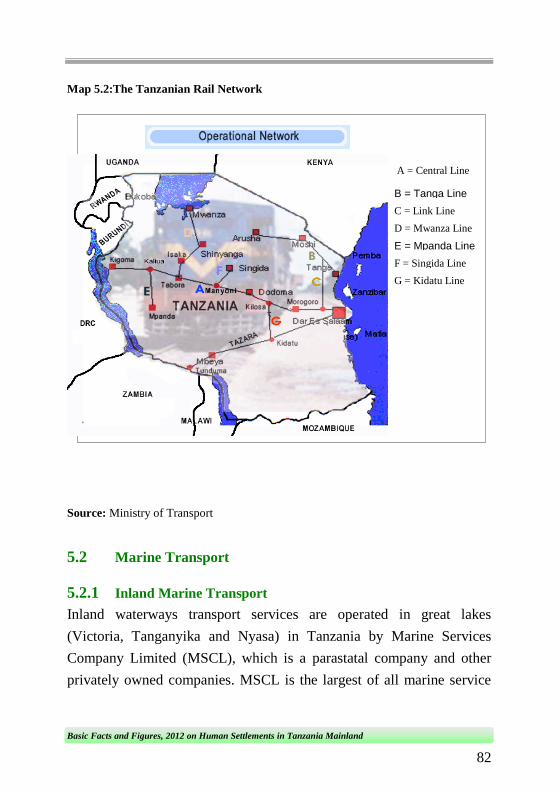
Basic Facts and Figures, 2012 on Human Settlements in Tanzania Mainland
82
Map 5.2:The Tanzanian Rail Network
Source: Ministry of Transport
5.2 Marine Transport
5.2.1 Inland Marine Transport
Inland waterways transport services are operated in great lakes
(Victoria, Tanganyika and Nyasa) in Tanzania by Marine Services
Company Limited (MSCL), which is a parastatal company and other
privately owned companies. MSCL is the largest of all marine service
G = Kidatu Line F = Singida Line E = Mpanda Line D = Mwanza Line C = Link Line B = Tanga Line
A = Central Line

Basic Facts and Figures, 2012 on Human Settlements in Tanzania Mainland
83
providing companies. The ownership of ports remains under Tanzania
Ports Authority (TPA). Statistics and information in Table 5.3 show
coverage of MSCL up to December, 2012.
Table 5.3: Vessels Operated by Marine Service Company Limited, Tanzania
Mainland, 2012
Lake Victoria
Name of Vessel Type Year of
Manufacture Status
M/V Victoria Passenger/Cargo 1960 Operational
M/V Umoja Wagon ferry 1964 Operational
M/V Clarias Passenger/Cargo 1961 Operational
M/T Nyangumi Oil Tanker 1958 Awaiting Repairs
M/V Wimbi Cargo 1938 Operational
M/V Malindi Cargo 1938 Awaiting Repairs
M/V Butiama Passenger/Cargo 1980 Awaiting Repairs
M/V Serengeti Passenger/Cargo 1988 Operational
MT Ukerewe Tug 1983 Operational
Lake Tanganyika
Name of Vessel Type Year of
Manufacture Status
M/V Liemba Pass/cargo 1913 Operational
M/V Mwongozo Seismic Survey 1982 Operational
M/V Sangara Oil Tanker 1981 Operational
Lake Nyasa
Name of Vessel Type Year of
Manufacture
Status
M/V Iringa Pass/cargo 1974 Operational
M/V Songea Pass/cargo 1974 Not Operational
Source: Marine Services Company Limited

Basic Facts and Figures, 2012 on Human Settlements in Tanzania Mainland
84
5.2.2 Sea Transport
Sea Transport is mainly for passengers and goods between Tanzania
Mainland and Zanzibar. Both public and private operators run shipping
companies that provide services. Likewise, marine vessels also shuttle
along the coast of Tanzania Mainland and Zanzibar Islands.
5.3 Communication
Tanzania has witnessed a great revolution in the communication sector
through advancement of infrastructures as well as corresponding
services. Communication is a consumable end service and enables other
sectors of the economy to perform efficiently and effectively. The
industry, particularly telecommunication has had a steady growth since
the introduction of mobile services in early 1990s. Nowadays a person
in the village can have access to markets in Dar es Salaam before
sending his/her produce. Table 5.4 reveals typical vibrancy of a
communication industry from the year 2008 to the year 2012.
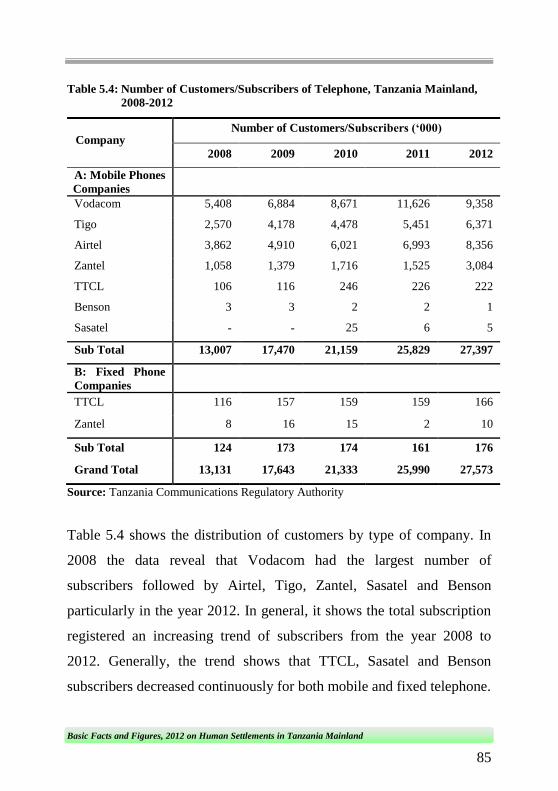
Basic Facts and Figures, 2012 on Human Settlements in Tanzania Mainland
85
Table 5.4: Number of Customers/Subscribers of Telephone, Tanzania Mainland,
2008-2012
Company Number of Customers/Subscribers (‘000)
2008 2009 2010 2011 2012
A: Mobile Phones
Companies
Vodacom 5,408 6,884 8,671 11,626 9,358
Tigo 2,570 4,178 4,478 5,451 6,371
Airtel 3,862 4,910 6,021 6,993 8,356
Zantel 1,058 1,379 1,716 1,525 3,084
TTCL 106 116 246 226 222
Benson 3 3 2 2 1
Sasatel - - 25 6 5
Sub Total 13,007 17,470 21,159 25,829 27,397
B: Fixed Phone
Companies
TTCL 116 157 159 159 166
Zantel 8 16 15 2 10
Sub Total 124 173 174 161 176
Grand Total 13,131 17,643 21,333 25,990 27,573
Source: Tanzania Communications Regulatory Authority
Table 5.4 shows the distribution of customers by type of company. In
2008 the data reveal that Vodacom had the largest number of
subscribers followed by Airtel, Tigo, Zantel, Sasatel and Benson
particularly in the year 2012. In general, it shows the total subscription
registered an increasing trend of subscribers from the year 2008 to
2012. Generally, the trend shows that TTCL, Sasatel and Benson
subscribers decreased continuously for both mobile and fixed telephone.
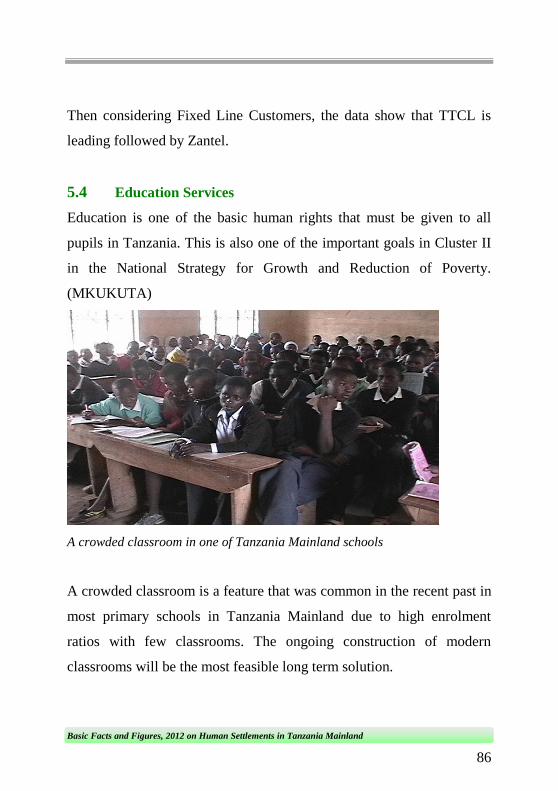
Basic Facts and Figures, 2012 on Human Settlements in Tanzania Mainland
86
Then considering Fixed Line Customers, the data show that TTCL is
leading followed by Zantel.
5.4 Education Services
Education is one of the basic human rights that must be given to all
pupils in Tanzania. This is also one of the important goals in Cluster II
in the National Strategy for Growth and Reduction of Poverty.
(MKUKUTA)
A crowded classroom in one of Tanzania Mainland schools
A crowded classroom is a feature that was common in the recent past in
most primary schools in Tanzania Mainland due to high enrolment
ratios with few classrooms. The ongoing construction of modern
classrooms will be the most feasible long term solution.

Basic Facts and Figures, 2012 on Human Settlements in Tanzania Mainland
87
Map 5.3: Primary Schools Net Enrolment Ratio (NER) in Percentage by Region,
Tanzania Mainland, 2012

Basic Facts and Figures, 2012 on Human Settlements in Tanzania Mainland
88
Net Enrolment Ratio
Map 5.3 shows Net Enrolment Ratios of pupils in primary schools in
Tanzania Mainland by region. Out of the 21 regions only 12 (57.1%)
have enrolment ratios above 90. The leading regions are Mbeya
(99.8%), Mara (99.6%), Tanga (99.5%), Ruvuma and Mwanza (99.7%)
each. Manyara and Kigoma are the regions with the lowest NER of 80.9
percent and 81.4 percent respectively. The MKUKUTA target was 99
percent by 2010.
Typical Primary School Classrooms

Basic Facts and Figures, 2012 on Human Settlements in Tanzania Mainland
89
Construction of modern classrooms in primary schools in Tanzania
Mainland is among the important activities in response to MKUKUTA
goals, which emphasize the need to deliver proper education to pupils
under conducive environment. This initiative is also in response to high
NERs in Tanzania Mainland. Data from Basic Education Statistics
(BEST) 2012 show that the adequacy of classrooms is still a big
problem in primary schools with big variations among the regions. The
National average Pupil Classroom Ratio (PCR) is 1:70 against the
recommended ratio of 1:40, Singida and Mwanza have the highest
PCRs of 112 and 93 pupils per classroom ratio respectively, while
Kilimanjaro and Lindi have the lowest ratios (42 and 51 pupils per
classroom respectively).
Teacher/Pupil Ratio
According to the Basic Education Statistics publication of 2012,
produced by the Ministry of Education and Vocational Training, the
Pupil/Teacher Ratio in Primary Schools is 46. Singida had the highest
Pupil/Teacher Ratio of 70, followed by Tabora (56) and Mwanza (52).
In Dar-es-Salaam it was 35, and the lowest was in Kilimanjaro Region
with an average pupil per teacher ratio of 32. The recommended
Teacher/Pupil Ratio is 40.
5.5 Health Services
The Government of Tanzania through the Ministry of Health and Social
Welfare aims at improving health and the state of well-being of its

Basic Facts and Figures, 2012 on Human Settlements in Tanzania Mainland
90
people. The National Health Policy provides direction towards
improvement and sustainability of the health status of all the people, by
reducing disability, morbidity and mortality, improving nutritional
status and raising life expectancy. The policy recognizes that, good
health is a major resource essential for poverty eradication and
economic development.
In order to optimally and effectively achieve the intended goal of
“Health for All” whereby health is to be brought within reach of
everyone in the country, there is a need to improve accessibility and
quality of health services in the country.
5.5.1 Human Resources for Health (HRH) Profile and Distribution
The World Health Organisation (WHO) has stated that achieving the
MDGs in health, requires that at health facilities, qualified health care
providers are available and perform adequately. It has been observed
that in Sub Saharan Africa there is a critical shortage of skilled health
care providers. The health sector in Tanzania is facing a serious human
resource crisis which negatively affects the ability of the sector to
provide quality health services.

Basic Facts and Figures, 2012 on Human Settlements in Tanzania Mainland
91
Nurse /midwife at work in a ward of a health facility
In Tanzania, HRH Country Profile statistics (2011) estimate that, the
number of health workers available in Tanzania Mainland is approximately
56,600 serving a population of 43,169,310, which gives a ratio of 1.3 health
workers per a 1,000 population. The number of health workers available is
construed by the Ministry of Health and Social Welfare to be equivalent to
52 percent of the required human resources for health. The shortage is
observed in all cadres.
The shortage is most severe in remote rural areas where health services are
often provided by faith-based organizations. The scarcity of human
resources results in competition over limited numbers of qualified staff
among public, private and faith-based health care facilities.

Basic Facts and Figures, 2012 on Human Settlements in Tanzania Mainland
92
Under Health Sector Support Programme (HSSP) III, indicators have
been developed to objectively assess human resource levels of different
cadres (Medical Officers (MO), Assistant Medical Officers (AMO),
nurses and midwives, pharmacists, pharmaceutical technicians and
laboratory staff) per 10,000 population. Baseline values were calculated
and are shown below but no targets have been set.
MOs and AMOs per 10,000 population, with a 2008 baseline
of 0.4 MOs and 0.7 AMOs (WHO recommendation is for one
doctor to serve a population of 10,000)
Nurses/midwives per 10,000 population, with a 2008 baseline
of 2.6
Pharmacists and pharmacy technicians per 10,000 population,
with a 2008 baseline of 0.15
Health officers per 10,000 population, with a 2005 baseline of
0.23
Laboratory staff per 10,000 population, with a 2005 baseline of
0.27
While not specified in HSSP III, the indicator reflects those staff
currently available for service delivery, excluding those in management
positions and on training.

Basic Facts and Figures, 2012 on Human Settlements in Tanzania Mainland
93
The aim is to provide evidence to policy makers and managers for them
to make informed decisions about what measures to take. Figure 5.1
shows the increase in the value of the HSSP III indicators. The number
of HRH for three years from 2009 up to 2011 shows that the number of
medical personnel available for service delivery, particularly medical
officers (MO), assistant medical officers (AMO), nurses and midwives,
pharmacist, pharmaceutical technicians and laboratory staff, has
gradually increased over the three years. The number of MOs increased
from 1,226 up to 2,268 while AMOs have increased from 1,627 up to
2,003. The number of nurses and midwives has increased from 15,650
up to19,412, pharmaceutical staff increased from 489 up to 811 and
laboratory staff have increased from 814 up to 1098.
Overall, ratios of health workers per 10,000 population have increased
from 0.30 to 0.51 for MOs, 0.40 to 0.45 for AMOs, 3.85 to 4.50 for
nurses and midwives, 0.12 up to 0.19 for pharmaceutical staff, and from
0.20 to 0.25 for laboratory staff. This is shown in Figure 5.1.

Basic Facts and Figures, 2012 on Human Settlements in Tanzania Mainland
94
Figure 5.1: National Level Human Resources for Health, Tanzania Mainland, 2009
– 2011
0.300.40
3.85
0.12 0.20
0.49 0.44
4.00
0.170.24
0.51 0.45
4.50
0.19 0.25
0.00
0.50
1.00
1.50
2.00
2.50
3.00
3.50
4.00
4.50
5.00
MO AMO Nurses &
midwives
Pharmacist & PT Laboratory Staff
Nu
mb
er p
er 1
0,0
00 P
op
ula
tion
2009 2010 2011
Source: Ministry of Health and Social Welfare
PT – Pharmacy Technician
Note: Data include those staff engaged in service delivery only, i.e.
excluding those in management positions, on training, etc.
HRH Distribution per 10,000 Population by Region
Monitoring the regional distribution of these various cadres is also
critical in order to determine where bottlenecks to service delivery exist,
and where new placements should be targeted. Table 5.5 summarizes
the distribution of the different cadres of health professionals per 10,000
populations by region for the period between 2009 and 2011.

Basic Facts and Figures, 2012 on Human Settlements in Tanzania Mainland
95
Table 5.5: Regional Distribution of Medical Officers (MOs) and Assistant Medical Officers (AMOs) Tanzania Mainland, 2009-
2011
Region MOs AMOs
Number Per 10,000 population Number Per 10,000 population
2009 2010 2011 2009 2010 2011 2009 2010 2011 2009 2010 2011
Arusha 34 56 62 0.21 0.34 0.36 45 51 71 0.28 0.3 0.41
Pwani 52 88 97 0.5 0.82 0.89 69 79 58 0.67 0.74 0.53
Dodoma 56 93 103 0.27 0.44 0.48 74 84 146 0.36 0.4 0.67
DSM 386 650 718 1.27 2.08 2.25 515 583 223 1.69 1.87 0.7
Iringa 54 90 99 0.31 0.52 0.56 71 81 63 0.42 0.47 0.36
Kagera 27 45 49 0.11 0.17 0.19 35 40 59 0.14 0.16 0.22
Kigoma 13 22 24 0.07 0.12 0.13 17 20 22 0.1 0.11 0.12
Kilimanjaro 158 266 294 0.99 1.63 1.76 211 239 468 1.31 1.46 2.8
Lindi 17 28 31 0.18 0.3 0.33 22 25 40 0.24 0.27 0.42
Manyara 31 52 58 0.23 0.38 0.4 41 47 30 0.31 0.34 0.21
Mara 27 45 50 0.15 0.25 0.27 36 41 40 0.2 0.22 0.21
Mbeya 80 135 149 0.31 0.51 0.54 107 121 148 0.41 0.45 0.54
Morogoro 54 91 100 0.26 0.43 0.46 72 82 63 0.35 0.39 0.29
Mtwara 18 30 33 0.14 0.23 0.25 24 27 40 0.18 0.21 0.3
Mwanza 111 186 205 0.32 0.52 0.56 147 167 255 0.43 0.47 0.7

Basic Facts and Figures, 2012 on Human Settlements in Tanzania Mainland
96
Table 5.5(ctd): Regional Distribution of Medical Officers (MOs) and Assistant Medical Officers (AMOs) Tanzania Mainland,
2009-2011
Region MOs AMOs
Number Per 10,000 population Number Per 10,000 population
2009 2010 2011 2009 2010 2011 2009 2010 2011 2009 2010 2011
Mwanza 111 186 205 0.32 0.52 0.56 147 167 255 0.43 0.47 0.7
Rukwa 5 8 8 0.03 0.05 0.05 6 7 33 0.04 0.05 0.21
Ruvuma 14 24 26 0.1 0.17 0.18 19 21 39 0.14 0.15 0.27
Shinyanga 27 45 49 0.07 0.12 0.12 35 40 57 0.1 0.1 0.14
Singida 13 21 23 0.09 0.15 0.17 17 19 35 0.13 0.14 0.25
Tabora 10 16 18 0.04 0.07 0.07 13 14 28 0.06 0.06 0.12
Tanga 39 65 72 0.2 0.33 0.36 51 58 85 0.27 0.3 0.42
TOTAL 1,226 2,056 2,220 0.3 0.49 0.51 1,627 1,846 1,938 0.4 0.44 0.45
Note: MO includes general medical officers, specialists, dental officers and dental surgeons AMO includes AMO general, AMO specialists, and assistant dental officers
Table 5.5 shows that the number and also the indicator values for the two cadres of MO and AMO have risen in
all regions over the three years period from 2009-2011. However, the Table shows large and continued
variations in the availability of these staff, from 2.25 MOs per 10,000 population in Dar es Salaam.

Basic Facts and Figures, 2012 on Human Settlements in Tanzania Mainland
97
to the lowest ratio of 0.05 MOs per 10,000 population in Rukwa
compared to the National ratio of 0.51 MOs per 10,000 population For
AMOs, the picture is equally varied
Figure 5.2: Distributions of Medical Officers and Assistant Medical Officers by
Region, Tanzania Mainland, 2011
8
18
23
24
26
31
33
49
49
50
58
62
72
97
99
100
103
149
205
294
718
33
28
35
22
39
40
40
59
57
40
30
71
85
58
63
63
146
148
255
468
223
0 100 200 300 400 500 600 700 800
Rukwa
Tabora
Singida
Kigoma
Ruvuma
Lindi
Mtwara
Kagera
Shinyanga
Mara
Manyara
Arusha
Tanga
Pwani
Iringa
Morogoro
Dodoma
Mbeya
Mwanza
Kilimanjaro
Dar es Salaam
Number
Reg
ion
Assistant Medical Officers
Medical Officers
Source: Ministry of Health and Social Welfare
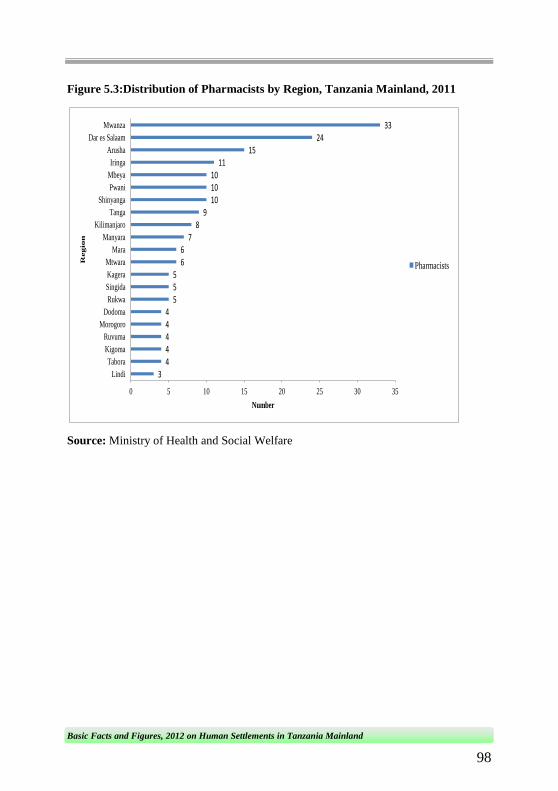
Basic Facts and Figures, 2012 on Human Settlements in Tanzania Mainland
98
Figure 5.3:Distribution of Pharmacists by Region, Tanzania Mainland, 2011
344444
555
66
78
9101010
1115
2433
0 5 10 15 20 25 30 35
Lindi
Tabora
Kigoma
Ruvuma
Morogoro
Dodoma
Rukwa
Singida
Kagera
Mtwara
Mara
Manyara
Kilimanjaro
Tanga
Shinyanga
Pwani
Mbeya
Iringa
Arusha
Dar es Salaam
Mwanza
Number
Reg
ion
Pharmacists
Source: Ministry of Health and Social Welfare

Basic Facts and Figures, 2012 on Human Settlements in Tanzania Mainland
99
Figure 5.4:Distribution of Clinical Officers by Region, Tanzania Mainland 2011
123136139144
158161
179185192
211233
296308
327328
343345
377407
471551
0 100 200 300 400 500 600
Lindi
Rukwa
Kigoma
Mtwara
Tabora
Singida
Dodoma
Manyara
Mara
Ruvuma
Kagera
Shinyanga
Mbeya
Iringa
Arusha
Pwani
Tanga
Mwanza
Kilimanjaro
Dar es Salaam
Morogoro
Number
Reg
ion
Clinical Officers
Source: Ministry of Health and Social Welfare

Basic Facts and Figures, 2012 on Human Settlements in Tanzania Mainland
100
Figure 5.5: Distribution of Registered Nurses and Enrolled Nurses by Region,
Tanzania Mainland, 2011
308894
76345
78139
34173
111340
204198
13370
342297
126389
9156
224295301
331345366
394407
419
555591
616629
695750756775
864
0 200 400 600 800 1000
Lindi
Kigoma
Tanga
Mtwara
Manyara
Dodoma
Tabora
Rukwa
Pwani
Singida
Kilimanjaro
Ruvuma
Shinyanga
Kagera
Mara
Arusha
Morogoro
Iringa
Dar es Salaam
Mbeya
Mwanza
Number
Reg
ion
Enrolled Nurses
Registered Nurses
Source: Ministry of Health and Social Welfare
5.5.2 Distribution of Health Facilities
The health care delivery system has been marked by reform and
improvement. There has been an expansion of health services in rural
areas facilitating greater access to health services for the rural
population. In 1980, about 45 percent of the population lived within 1
km of a health facility, 72 percent within 5 km and 93.1 percent within
10 km of a facility. In recent years there has been an increase in the
number of health facilities in the country, so that the majority of the

Basic Facts and Figures, 2012 on Human Settlements in Tanzania Mainland
101
population lives within 5 km from a health facility. However, there are
still geographical inequalities in access to health services. The
Government through the Ministry of Health and Social Welfare initiated
the Primary Health Care Development Programme (PHCDP) aimed at
ensuring that there is a dispensary at each village and a health center in
each ward, a district hospital for each local government authority and
upgraded regional hospitals to provide referral services while the
national, zonal and specialized hospitals provide higher specialized
services.
Table 5.5 reveals that in 2011 there were a total of 6,559 health
facilities as compared to 6,342 that were available in year 2010. This is
an increase of about 3.4 percent. In year 2011 the type of ownership of
health facilities were as follows; 4,525 (69%) were owned by the
Government, 848 (13%) by faith based organisations, 238 (4%) by
parastatals and 908 (14%) were owned by the Private Sector.
Table 5.6: Distribution of Health Facilities by Type, Tanzania Mainland, 2010 and
2011
Health Facilities 2010 2011
Hospitals 240 249
Health Centres 633 653
Dispensaries 5,469 5,657
Total 6,342 6,559
Source: Ministry of Health and Social Welfare

Basic Facts and Figures, 2012 on Human Settlements in Tanzania Mainland
102
Figure 5.6 shows the number and percentage of health facilities by type
of ownership.
Figure 5.6: Percentage Distribution of Health Facilities by Type of Ownership,
Tanzania Mainland, 2011
39
66
71
41
21
1114
10
14
63 4
0
10
20
30
40
50
60
70
80
Hospital Health Centre Dispensary
Per
cen
t
Government
FBOs
Private
Parastatal
Source: Ministry of Health and Social Welfare
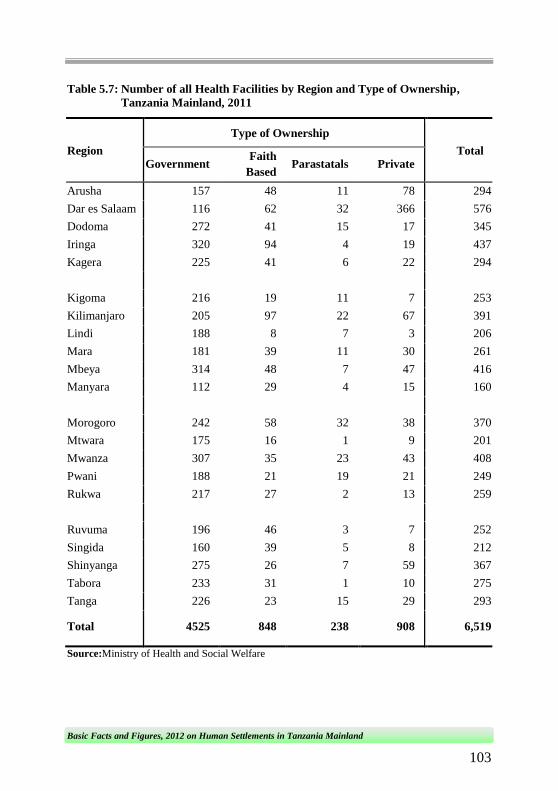
Basic Facts and Figures, 2012 on Human Settlements in Tanzania Mainland
103
Table 5.7: Number of all Health Facilities by Region and Type of Ownership,
Tanzania Mainland, 2011
Region
Type of Ownership
Total Government
Faith
Based Parastatals Private
Arusha 157 48 11 78 294
Dar es Salaam 116 62 32 366 576
Dodoma 272 41 15 17 345
Iringa 320 94 4 19 437
Kagera 225 41 6 22 294
Kigoma 216 19 11 7 253
Kilimanjaro 205 97 22 67 391
Lindi 188 8 7 3 206
Mara 181 39 11 30 261
Mbeya 314 48 7 47 416
Manyara 112 29 4 15 160
Morogoro 242 58 32 38 370
Mtwara 175 16 1 9 201
Mwanza 307 35 23 43 408
Pwani 188 21 19 21 249
Rukwa 217 27 2 13 259
Ruvuma 196 46 3 7 252
Singida 160 39 5 8 212
Shinyanga 275 26 7 59 367
Tabora 233 31 1 10 275
Tanga 226 23 15 29 293
Total 4525 848 238 908 6,519
Source:Ministry of Health and Social Welfare

Basic Facts and Figures, 2012 on Human Settlements in Tanzania Mainland
104
Hospitals
In 2011 there were 248 hospitals in Tanzania Mainland as compared to
240 hospitals in 2010. Ninety seven hospitals (39%) were owned by the
Government, 102 (41%) by faith based organizations, 14 (6%) by
parastatal organizations and 35 (14%) were owned by the Private
Sector.
Table 5.8: Number of Hospitals by Region and Type of Ownership, Tanzania
Mainland, 2011
Region Type of Ownership Total
Government Faith Based Parastatals Private
Arusha 3 7 2 0 12
Dar es Salaam 8 4 5 23 40
Dodoma 5 3 0 0 8
Iringa 6 7 0 3 16
Kagera 3 11 1 0 15
Kigoma 3 3 0 0 6
Kilimanjaro 6 10 0 1 17
Lindi 5 3 1 0 9
Mara 3 5 0 0 8
Mbeya 8 8 0 2 18
Manyara 4 3 0 0 7
Morogoro 4 5 3 1 13
Mtwara 4 1 0 0 5
Mwanza 7 6 1 3 17
Pwani 5 1 1 0 7
Rukwa 2 2 0 0 4
Ruvuma 3 7 0 0 10
Singida 3 6 0 0 9
Shinyanga 6 1 0 2 9
Tabora 4 3 0 0 7
Tanga 5 6 0 0 11
Total 97 102 14 35 248
Source: Ministry of Health and Social Welfare

Basic Facts and Figures, 2012 on Human Settlements in Tanzania Mainland
105
Health Centres
About 653 health centres were available in 2011 as compared to 633 in
2010. Out of the 653 health centre 432 (66%) belonged to the
Government, 138 (21%) to faith based organizations, 64 (10%) were
owned by the Private Sector and 19 (3%) were owned by the
parastatals.
Table 5.9: Number of Health Centres by Region and Type of Ownership Tanzania
Mainland, 2011
Region
Type of Ownership
Total Government Faith Based Parastatals Private
Arusha 26 9 0 7 42
Dar es Salaam 5 12 6 25 48
Dodoma 26 4 3 2 35
Iringa 26 16 0 0 42
Kagera 25 5 0 1 31
Kigoma 17 4 0 1 22
Kilimanjaro 26 10 2 2 40
Lindi 16 1 0 0 17
Mara 17 7 0 4 28
Mbeya 24 8 0 4 36
Manyara 7 7 0 0 14
Morogoro 27 8 6 2 43
Mtwara 14 3 0 2 19
Mwanza 39 7 0 2 48
Pwani 16 2 1 2 21
Rukwa 22 10 0 0 32

Basic Facts and Figures, 2012 on Human Settlements in Tanzania Mainland
106
Table 5.9 ctd: Number of Health Centres by Region and Type of Ownership
Tanzania Mainland, 2011
Region
Type of Ownership
Total Government Faith Based Parastatals Private
Ruvuma 19 6 0 0 25
Singida 14 3 0 1 18
Shinyanga 29 3 0 3 35
Tabora 14 6 0 1 21
Tanga 23 7 1 5 36
Grand Total 432 138 19 64 653
Source: Ministry of Health and Social Welfare
Dispensaries
A total of 5,618dispensaries were available in year 2011 as compared to
5,469 dispensaries in 2010. Of these, 3,996 (71%) were owned by the
Government, 608 (11%) by faith based organisations, 205 (4%) by
parastatals, and 809 (14%) were owned by the Private Sector.

Basic Facts and Figures, 2012 on Human Settlements in Tanzania Mainland
107
Table 5.10: Number of Dispensaries by Region and Type of Ownership, Tanzania
Mainland, 2011
Region
Type of Ownership
Total
Government
Faith
Based Parastatals Private
Arusha 128 32 9 71 240
Dar es Salaam 103 46 21 318 488
Dodoma 241 34 12 15 302
Iringa 288 71 4 16 379
Kagera 197 25 5 21 248
Kigoma 196 12 11 6 225
Kilimanjaro 173 77 20 64 334
Lindi 167 4 6 3 180
Mara 161 27 11 26 225
Mbeya 282 32 7 41 362
Manyara 101 19 4 15 139
Morogoro 211 45 23 35 314
Mtwara 157 12 1 7 177
Mwanza 261 22 22 38 343
Pwani 167 18 17 19 221
Rukwa 193 15 2 13 223
Ruvuma 174 33 3 7 217
Singida 143 30 5 7 185
Shinyanga 240 22 7 54 323
Tabora 215 22 1 9 247
Tanga 198 10 14 24 246
Total 3,996 608 205 809 5,618
Source: Ministry of Health and Social Welfare

Basic Facts and Figures, 2012 on Human Settlements in Tanzania Mainland
108
Table 5.11: Percentage Distribution of Households by Mean Distance to the Health
Facility, Tanzania Mainland, 2007
Distance to Health
Facility
Dar-es-Salaam Other Urban Rural Tanzania
Mainland
2000/01 2007 2000/01 2007 2000/01 2007 2000/01 2007
Nearest Hospital
Less than 2 Km 51.6 17.9 37.3 34 5.1 2.7 13.3 10.2
1 to 5.9 36.4 47.4 41 32.8 13.1 8.9 19.1 17.2
6 to 9.9 9.4 23.3 8.6 6.6 14.9 13.8 13.5 13.4
10 to 19.9 1.5 10.2 2.7 6.7 25 20.5 20 16.9
20 to 39.9 0.1 1.2 4.9 9.1 20.2 25 16.4 19.6
40+ 0.9 0.1 5.4 10.8 21.6 29.1 17.7 22.8
Total 100 100 100 100 100 100 100 100
Mean Distance 2.8 4.9 7.4 12.6 25.7 31.7 21.3 25.4
Nearest
Dispensary/Health
Centre
Less than 2 Km 85.6 74.9 70.3 71.6 27.7 32.3 37.9 43.8
2 to 5.9 12.5 23.6 27.4 25.6 41.6 35.3 37.5 32.4
6 to 9.9 1.7 1.2 1.4 2 19.9 19.9 15.9 14.7
10 to 19.9 0.2 0.3 0.4 0.8 9 11.1 7.1 8.1
20+ 0 0 0.5 0 1.9 1.5 1.5 1.0
Total 100 100 100 100 100 100 100 100
Mean Distance 1.4 0.7 1.3 1.1 4.7 4.6 3.9 3.6
Source: Household Budget Survey 2000/01 and 2007
Table 5.11 shows the percentage distribution of households by mean
distance to health facilities. With respect to hospitals, in 2007 the
majority of households (72.6 percent) live at a distance of 6 km or more
and only 10.2 percent of households live within a distance of less than 2
km. However, 43.8 percent of households live within a distance of 2 to
5.9 km from the nearest dispensary or health centre.

Basic Facts and Figures, 2012 on Human Settlements in Tanzania Mainland
109
CHAPTER SIX
Good Governance and Accountability
6.0 Crimes Situation
6.1 Introduction
This chapter deals with other social statistics aspects related to human
settlements such as road accidents, crime and justice statistics that are
reported in rural and urban settings. Crime statistics provide the
government with indicators to monitor implementation of Cluster III of
MKUKUTA. The cluster focuses on Good Governance and
Accountability of which reduction of crime is among other goals.
Crime as a type of offence may be grouped into three categories:
i. Crime against person or persons
ii. Crime against property
iii. Crime against public tranquillity
The information presented in this chapter helps to reveal the magnitude
of the crime and may lead to necessary action to be taken to reduce the
occurrence of such offences in various communities. This will also help
to maintain peace and respect to the rule of law and order, which are
prerequisites to a conducive environment for socio-economic
development.

Basic Facts and Figures, 2012 on Human Settlements in Tanzania Mainland
110
6.1.1 Crime Against Persons
Crime against persons affect their humanity and life in general. These
include offences such as murder, sodomy, rape, child stealing, desertion
of child, human trafficking and illegal immigration. Recently, there has
also been occurrences of crime against disabled persons especially
albinos for superstitious purposes.
Table 6.1: Number of Reported Crimes Against Persons, Tanzania, 2007-2012
Type of Crime 2007 2008 2009 2010 2011 2012
Murder 3,583 2,354 4,209 3,795 4,023 3,928
Rape 8,894 8,105 7,235 6,493 5,948 6,132
Sodomy 567 629 770 756 780 829
Child Stealing 71 142 110 109 104 113
Desertion of
Child 157 157 172 186 172
186
Total 13,272 11,387 12,496 11,339 11,027 11,188
Source: Tanzania Police Force
Table 6.1 reveals that rape is the leading crime against persons followed
by murder.
6.1.2 Crime Against Property
Crime against property happens when peoples` belongings get
destroyed either by armed robbery, violence, burglary and stealing in a
certain community or country.

Basic Facts and Figures, 2012 on Human Settlements in Tanzania Mainland
111
Table 6.2: Number of Reported Crimes Against Property, Tanzania, 2007-2012
Type of Crime 2007 2008 2009 2010 2011 2012
Armed Robbery 1,108 1,031 1,430 1,332 1,288 1,221
Robbery with Violence 7,198 6,089 7,381 8,598 6,577 6,378
Burglary 20,904 27,491 26,561 22,456 23,873 24,555
*Stealing 21,708 31,130 28,427 26,726 6,305 537
Stealing Motor Vehicle 254 313 350 301 392 392
Stealing Motor Cycle 222 427 859 1,614 2,611 3,512
Stealing of Livestock 5,153 5,897 5,891 5,294 5,244 5,572
Arson (Setting fire on
property ) 2,943 2,629 2,743 2,506 2,375 2,471
Total 59,490 75,007 73,642 68,821 48,665 44,638
Source: Tanzania Police Force
Note: * Stolen property with the value of TShs 10 million or more were reported in year
2011 and 2012. Also stolen property with the value below TShs 10 Million
were categorised as minor offences
6.1.3 Crimes against Public Tranquillity
Crime against public tranquillity happens when there is anarchy due to
many reasons, some of which may be caused by political, economic and
social instability.

Basic Facts and Figures, 2012 on Human Settlements in Tanzania Mainland
112
Table 6.3: Number of Reported Crimes Against Public Tranquillity, Tanzania,
2007-2012
Type of Crime 2007 2008 2009 2010 2011 2012
Unlawful possession
of fire arms 585 540 469 604 450 438
Unlawful possession
of Narcotics (Heroin
& Cocaine)
318 515 700 707 604 531
Unlawful possession
of Bhang 5,521 6,094 7,130 6,248 6,243 6,114
Unlawful possession
of Government
trophies
791 856 845 857 875 809
Unlawful possession
of Illicit Liquor 5,937 5,028 4,932 4,460 4,286 4,819
Total 13,152 13,033 14,076 12,876 12,458 12,711
Source: Tanzania Police Force
6.2 Road Traffic Accidents
Road traffic accidents remain to be a major problem in Tanzania. Many
people have lost their lives, have been incapacitated and lost properties
due to road accidents. There are different types of road traffic accidents
caused by different factors. Motor accidents are categorized as fatal
accidents if they result in deaths and injured persons. Table 6.4 shows
accidents by type from 2007 to 2012.

Basic Facts and Figures, 2012 on Human Settlements in Tanzania Mainland
113
Table 6.4: Road Traffic Accidents and Persons Killed/Injured, Tanzania
Mainland, 2007 – 2012 (Number)
Item 2007 2008 2009 2010 2011 2012
Total Number of Road
Traffic Accidents 25,151 17,451 22,019 24,926 23,986 23,606
Fatal Accidents 3,065 2,460 2,872 3,159 3,349 3,429
Killed Persons 3,071 2,840 3,851 3,687 3,981 4,062
Injured Persons 16,119 16,982 20,717 20,064 20,802 20,037
Source: Tanzania Police Force
Table 6.4 reveals that there has been an increase in the number of
people who lost their lives and were injured in road accidents from
2007 to 2012.
6.2.1 Motor Vehicles Accidents by Cause
Table 6.5 shows the distribution of road accidents by cause from 2007
to 2012. It is shown that dangerous driving is the leading cause,
followed by bad roads, defective motor vehicles, excessive speed and
careless pedestrians.

Basic Facts and Figures, 2012 on Human Settlements in Tanzania Mainland
114
Table 6.5: Motor Vehicle Traffic Accidents by Cause, Tanzania Mainland: 2007-
2012 (Number)
Cause of Accident 2007 2008 2009 2010 2011 2012
Reckless/Dangerous
Driving 7,735 5,367 10,339 3,849 5,744 3,091
Defective Motor Vehicles 3,139 2,178 2,233 4,086 2,055 2,223
Careless Pedestrians 3,999 2,775 1,259 1,220 825 930
Excessive Speed 2,549 1,769 1,025 3,438 2,158 2,144
Careless Motor Cyclists 1,995 1,384 2,347 1,987 3,765 4,951
Careless Pedal Cyclists 1,776 1,232 1,701 3,906 1,313 980
Intoxication 401 278 221 580 171 112
Other i.e. Bad Road,
Slippery, etc 3,557 2,468 2,894 5,860
7,955
9,175
Total 25,151 17,451 22,019 24,926 23,986 23,606
Source: Tanzania Police Force
6.2.2 Motor Cycle Accidents
Table 6.6 presents motor cycle accidents that caused deaths, injury and
other people became incapacitated between 2007 and 2012. The
demand for motor cycles as means of transport is growing and
consequently accidents caused by motor cycles are also increasing.
Table 6.6: Motor Cycle Accidents, Tanzania Mainland, 2007 - 2012
Type of Events 2007 2008 2009 2010 2011 2012
Number of Motor Cycles
Causing Accidents 1,683 2,520 3,920 5,439 6,820 7,115
Motor Cycle Accidents 1,683 2,036 3,406 4,363 5,384 5,763
Killed Persons 193 309 502 683 945 930
Injured Persons 1,423 1,931 3,478 4,471 5,506 13,808
Source: Tanzania Police Force

Basic Facts and Figures, 2012 on Human Settlements in Tanzania Mainland
115
CHAPTER SEVEN
Safe Cities Programme
7.0 Safe Cities Approach
The 2008 victimization survey in Tanzania followed two studies carried
out under the Safer Cities Programme supported by the UN-HABITAT.
The first study, conducted in 2000, was carried out in Dar es Salaam
City while the second covered Mtwara Municipal and the cities of
Arusha and Dar es Salaam.
The main goal of the survey was to collect data which would allow state
organs, particularly local authorities, and all interested stakeholders to
understand better the state of crime in their respective jurisdictions and
plan accordingly. The local government authorities are required by the
Constitution of the United Republic of Tanzania (1977) to maintain
peace and order. Furthermore, the Local Government Act of 1982
(section 54) requires local authorities to address issues of safety and
insecurity.
The survey was coordinated by Safer Cities National Programme
Tanzania within PMO-RALG in collaboration with UN-Habitat and
funded by UNODC.1 City and Municipal Directors of the respective
urban centres contributed immensely to the smooth conduct of the
1 Within the framework of the UN Development Account project 06/07R Collection and analysis
of data and trends on drugs, crime, and victimization in Africa.

Basic Facts and Figures, 2012 on Human Settlements in Tanzania Mainland
116
exercise which was implemented by their Safer Cities Programme
Coordinators.
7.1 Rate of Victimization
In 2007, the year covered by the survey, the total number of crimes
reported by survey respondents was 1,533. Of these, 1,078 crimes (70.3
percent) were crimes against individual respondents and 455 (29.7
percent) were household crimes.
The survey involved a total of 1,888 households in five survey centres
in Tanzania Mainland, namely Dodoma, Mbeya, Moshi, Mwanza and
Tanga.
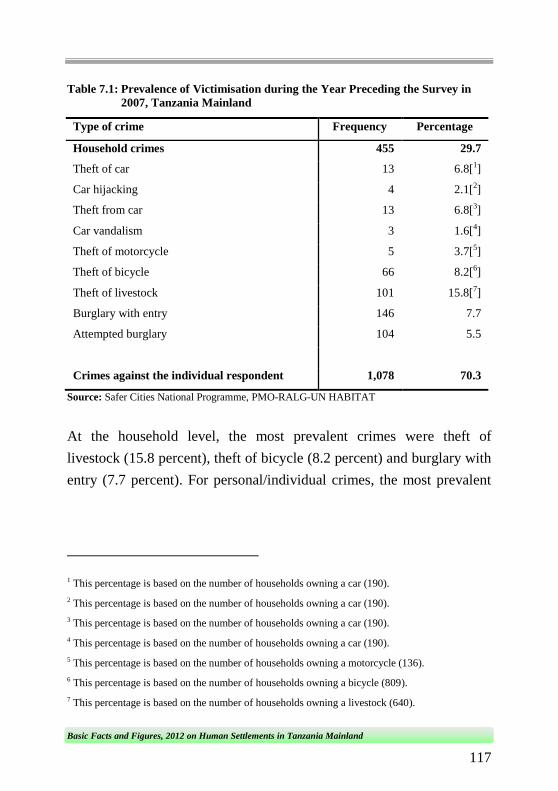
Basic Facts and Figures, 2012 on Human Settlements in Tanzania Mainland
117
Table 7.1: Prevalence of Victimisation during the Year Preceding the Survey in
2007, Tanzania Mainland
Type of crime Frequency Percentage
Household crimes 455 29.7
Theft of car 13 6.8[1]
Car hijacking 4 2.1[2]
Theft from car 13 6.8[3]
Car vandalism 3 1.6[4]
Theft of motorcycle 5 3.7[5]
Theft of bicycle 66 8.2[6]
Theft of livestock 101 15.8[7]
Burglary with entry 146 7.7
Attempted burglary 104 5.5
Crimes against the individual respondent 1,078 70.3
Source: Safer Cities National Programme, PMO-RALG-UN HABITAT
At the household level, the most prevalent crimes were theft of
livestock (15.8 percent), theft of bicycle (8.2 percent) and burglary with
entry (7.7 percent). For personal/individual crimes, the most prevalent
1 This percentage is based on the number of households owning a car (190). 2 This percentage is based on the number of households owning a car (190).
3 This percentage is based on the number of households owning a car (190). 4 This percentage is based on the number of households owning a car (190). 5 This percentage is based on the number of households owning a motorcycle (136). 6 This percentage is based on the number of households owning a bicycle (809). 7 This percentage is based on the number of households owning a livestock (640).

Basic Facts and Figures, 2012 on Human Settlements in Tanzania Mainland
118
crimes by far were corruption2 (25.7 percent) and consumer fraud (17.6
percent).
7.2 Experience of Respondents with the Police
According to the survey, the frequency of reporting crimes to the police
varies greatly depending on the type of crime concerned. While 93.3
percent of motorcycle thefts were reported to the Police, it was true only
4.6 percent of incidents of corruption, that were reported
Car hijacking is a serious crime and the general expectation would be
that victims would report it to the police when it occurs. Reporting
makes sense for a number of reasons including record keeping,
insurance needs, understanding the context and developing new
strategies of fighting the vice. However, only 56 percent of those who
had experienced car hijacking reported the incident to the police. When
these victims were asked about their satisfaction with services provided
by the police, 60 percent said that they were satisfied while 40 percent
said they were not satisfied.
The number of respondents who reported crimes to authorities other
than the Police were highest for sexual offences (20.5 percent),
followed by assault/threat (17.1 percent) and robbery (16.2 percent).
2 Corruption refers to a situation where government and non-government officers, demand extra
pay for services they are supposed to offer for free to the general public. Corruption can also
originate from the customers who corrupt employees of suppliers and or government by offering
bribes in order to get certain benefits or privileges

Basic Facts and Figures, 2012 on Human Settlements in Tanzania Mainland
119
Table 7.2: Percentage of Victims who Reported Crimes to the Police or Other
Authorities, Tanzania Mainland, 2007
Source: Safer Cities National Programme,PMO-RALG-UN HABITAT
7.3 Opinions about Police Work
Neighbourhood policing is one of the practices that promotes safety
among members of the community. Such practices allow people to
conduct their daily activities with the comfort and trust they need. This
is possible where the police are controlling crime. More than 70 percent
of respondents noted that police are doing either a “very good job” or a
“fairly good job” at both crime prevention and assisting citizens.
Type of crime % Reported to the police % Reported to other authorities
Theft of car 71.4 -
Car hijacking 55.6 -
Theft from car 43.9 7.3
Car vandalism 46.7 -
Theft of motorcycle 93.3 -
Theft of bicycle 57.2 -
Theft of livestock 21.2 4.5
Burglary with entry 44.5 3.2
Attempted burglary 29.9 -
Robbery 45.6 16.2
Personal theft 21.0 -
Sexual offences 33.5 20.5
Assault / Threat 37.3 17.1
Consumer fraud 6.6 4.5
Corruption 4.6 4.8
Basic Facts and Figures, 2012 on Human Settlements in Tanzania Mainland
120
The Police force received good ratings in the urban centre of Moshi,
whereas the poorest ratings were recorded in Mwanza city. With regard
to private security officers, more than three quarters pointed out that
they are doing either a “very good job” (21 percent) or a “fairly good
job” (57 percent). However, more than one-fifth of respondents have a
negative view of private security officials.

Basic Facts and Figures, 2012 on Human Settlements in Tanzania Mainland
121
Figure 7.1: Opinion about Police Work in Preventing and Controlling Crime,
Selected Urban Centers, 2007
Source: Safer Cities National Programme, PMO-RALG-UN HABITAT
7.4 Fear of Crime
Respondents were asked how safe it was to walk alone in the dark in
their own neighbourhood. Fear of walking alone in the dark increases
various risks such as personal attacks or threats, in the area. More than
50 percent of respondents said it was either “very safe” or “fairly safe”
to walk alone in the dark (Figure 7.2). On safety at home in the dark,
two thirds of respondents said they are either “very safe” or “fairly
safe”.
Respondents in the cities of Tanga and Moshi felt safer than those in
other cities. In particular, respondents from Mwanza and Mbeya felt

Basic Facts and Figures, 2012 on Human Settlements in Tanzania Mainland
122
very unsafe while walking alone in the dark and staying at home in the
dark.
Figure 7.2: Feelings of Safety in the Street and at Home, Selected Urban Centres,
2007
Source: Safer Cities National Programme, PMO-RALG-UN HABITAT
7.5 Crime Prevention Measures
The survey included a section in which respondents were asked to point
out preventive measures they were using to ensure maximum security
for their houses. Various crime prevention measures were mentioned,
including installation of physical tools (burglar alarms, window grids,
door locks), making arrangements with the neighbours and other
community-based crime prevention schemes. More than a quarter of the
respondents reported that they were not protected by any of the listed
prevention measures, while 24 percent said they installed door locks
and 18 percent special window grills.

Basic Facts and Figures, 2012 on Human Settlements in Tanzania Mainland
123
NATIONAL BUREAU OF STATISTICS
Vision
To be a preferable source of official statistics in Tanzania
Mission
To facilitate informed decision-making process, through
provision of relevant, timely and reliable user-driven statistical
information, coordinating statistical activities and promoting the
adherence to statistical methodologies and standards