human resources for health audit report
TRANSCRIPT

HUMAN RESOURCES FOR
HEALTH
AUDIT REPORT
SEPTEMBER, 2014

Table of Contents Executive Summary ............................................................................................................................................... 10
1. Methods ........................................................................................................................................................ 11
1.1. Staffing norms ........................................................................................................................................... 11
1.2. Population ................................................................................................................................................. 11
1.3. Data collection method ............................................................................................................................. 11
1.4. Data management, analysis and presentations ........................................................................................ 12
2. Findings ......................................................................................................................................................... 12
2.1. Overall staffing level ................................................................................................................................. 12
2.2. Staffing in Regional Referral Hospitals ...................................................................................................... 13
3.3 Staffing in General Hospitals ..................................................................................................................... 13
3.4 Staffing level by type of cadre .................................................................................................................. 15
4 Discussion and Conclusions .......................................................................................................................... 16
5. Appendices .................................................................................................................................................... 18
Appendix 1: Staffing levels for HC II, HC III and HC IVs. .................................................................................... 18
Appendix 2: Percent of approved positions filled in District Health Offices .................................................... 22
DHO’s Office ...................................................................................................... Error! Bookmark not defined.
Agago HC III Staffing .......................................................................................... Error! Bookmark not defined.
Agago HC II Staffing ........................................................................................... Error! Bookmark not defined.
004: ALEBTONG DISTRICT LOCAL GOVERNMENT ............................................. Error! Bookmark not defined.
005: AMOLATAR DISTRICT LOCAL GOVERNMENT ............................................ Error! Bookmark not defined.
006: AMUDAT DISTRICT LOCAL GOVERMENT................................................... Error! Bookmark not defined.
007: AMURIA DISTRICT LOCAL GOVERMENT .................................................... Error! Bookmark not defined.
Amuria HCIV staffing ......................................................................................... Error! Bookmark not defined.
008: AMURU DISTRICT LOCAL GOVERNMENT .................................................. Error! Bookmark not defined.

Amuru DHO’s office ........................................................................................ Error! Bookmark not defined.
Atiak HC IV Staffing ........................................................................................ Error! Bookmark not defined.
Amuru Health Centre IIs staffing ...................................................................... Error! Bookmark not defined.
009: APAC DISTRICT LOCAL GOVERNMENT ...................................................... Error! Bookmark not defined.
010: ARUA DISTRICT LOCAL GOVERNMENT ...................................................... Error! Bookmark not defined.
011: BUDAKA DISTRICT LOCAL GOVERNMENT ................................................. Error! Bookmark not defined.
012: BUDUDA DISTRICT LOCAL GOVERNMENT ................................................ Error! Bookmark not defined.
013: BUGIRI DISTRICT LOCAL GOVERNMENT ................................................... Error! Bookmark not defined.
014: BUHWEJU DISTRICT LOCAL GOVERNMENT .............................................. Error! Bookmark not defined.
015: BUIKWE DISTRICT LOCAL GOVERNMENT .................................................. Error! Bookmark not defined.
016: BUKEDEA DISTRICT LOCAL GOVERNMENT ............................................... Error! Bookmark not defined.
017: BUKWO DISTRICT LOCAL GOVERNMENT .................................................. Error! Bookmark not defined.
018: BULAMBULI DISTRICT LOCAL GOVERNMENT ........................................... Error! Bookmark not defined.
019: BUKOMANSIMBI DISTRICT LOCAL GOVERNMENT .................................... Error! Bookmark not defined.
020: BUSIA DISTRICT LOCAL GOVERNMENT ..................................................... Error! Bookmark not defined.
021: BUTALEJA DISTRICT LOCAL GOVERNMENT ............................................... Error! Bookmark not defined.
022: BUTAMBALA DISTRICT LOCAL GOVERNMENT .......................................... Error! Bookmark not defined.
023: BUNDIBUGYO DISTRICT LOCAL GOVERNMENT ........................................ Error! Bookmark not defined.
024: BUSHENYI DISTRICT LOCAL GOVERNMENT .............................................. Error! Bookmark not defined.
025: BULIISA DISTRICT LOCAL GOVERNMENT .................................................. Error! Bookmark not defined.
026: BUYENDE DISTRICT LOCAL GOVERNMENT ............................................... Error! Bookmark not defined.
027: BUVUMA DISTRICT LOCAL GOVERNMENT ................................................ Error! Bookmark not defined.
028: DOKOLO DISTRICT LOCAL GOVERNMENT ................................................. Error! Bookmark not defined.
029: GOMBA DISTRICT LOCAL GOVERNMENT .................................................. Error! Bookmark not defined.
030: GULU DISTRICT LOCAL GOVERNMENT ...................................................... Error! Bookmark not defined.

031: HOIMA DISTRICT LOCAL GOVERNMENT ................................................... Error! Bookmark not defined.
032: IBANDA DISTRICT LOCAL GOVERNMENT .................................................. Error! Bookmark not defined.
033: IGANGA DISTRICT LOCAL GOVERNMENT .................................................. Error! Bookmark not defined.
034: ISINGIRO DISTRICT LOCAL GOVERNMENT ................................................ Error! Bookmark not defined.
034: JINJA DISTRICT LOCAL GOVERNMENT ...................................................... Error! Bookmark not defined.
035: KAABONG DISTRICT LOCAL GOVERNMENT .............................................. Error! Bookmark not defined.
036: KABALE DISTRICT LOCAL GOVERNMENT .................................................. Error! Bookmark not defined.
037: KABAROLE DISTRICT LOCAL GOVERNMENT .............................................. Error! Bookmark not defined.
038: KABERAMAIDO DISTRICT LOCAL GOVERNMENT ...................................... Error! Bookmark not defined.
039: KALANGALA DISTRICT LOCAL GOVERNMENT ........................................... Error! Bookmark not defined.
040: KALIRO DISTRICT LOCAL GOVERNMENT ................................................... Error! Bookmark not defined.
041: KALUNGU DISTRICT LOCAL GOVERNMENT ............................................... Error! Bookmark not defined.
043: KAMPALA DISTRICT LOCAL GOVERNMENT ............................................... Error! Bookmark not defined.
NATIONAL REFERRAL HOSPITAL: ANALYSIS OF FILLED AND VACANT POSTS ... Error! Bookmark not defined.
043: KAMULI DISTRICT LOCAL GOVERNMENT .................................................. Error! Bookmark not defined.
044: KAMWENGE DISTRICT LOCAL GOVERNMENT ........................................... Error! Bookmark not defined.
045: KANUNGU DISTRICT LOCAL GOVERNMENT .............................................. Error! Bookmark not defined.
046: KAPCHORWA DISTRICT LOCAL GOVERNMENT ......................................... Error! Bookmark not defined.
047: KASESE DISTRICT LOCAL GOVERNMENT ................................................... Error! Bookmark not defined.
048: KATAKWI DISTRICT LOCAL GOVERNMENT ................................................ Error! Bookmark not defined.
049: KAYUNGA DISTRICT LOCAL GOVERNMENT ............................................... Error! Bookmark not defined.
050: KIBAALE DISTRICT LOCAL GOVERNMENT ................................................. Error! Bookmark not defined.
051: KIBOGA DISTRICT LOCAL GOVERNMENT .................................................. Error! Bookmark not defined.
052: KIBUKU DISTRICT LOCAL GOVERNMENT .................................................. Error! Bookmark not defined.
053: KIRYANDONG DISTRICT LOCAL GOVERNMENT ......................................... Error! Bookmark not defined.

054: KIRUHURA DISTRICT LOCAL GOVERNMENT .............................................. Error! Bookmark not defined.
055: KISORO DISTRICT LOCAL GOVERNMENT................................................... Error! Bookmark not defined.
056: KITGUM DISTRICT LOCAL GOVERNMENT ................................................. Error! Bookmark not defined.
057: KOBOKO DISTRICT LOCAL GOVERNMENT ................................................. Error! Bookmark not defined.
058: KOLE DISTRICT LOCAL GOVERNMENT ....................................................... Error! Bookmark not defined.
059: KOTIDO DISTRICT LOCAL GOVERNMENT .................................................. Error! Bookmark not defined.
060: KUMI DISTRICT LOCAL GOVERNMENT ...................................................... Error! Bookmark not defined.
061: KYANKWANZI DISTRICT LOCAL GOVERNMENT ......................................... Error! Bookmark not defined.
062: KYEGEGWA DISTRICT LOCAL GOVERNMENT ............................................ Error! Bookmark not defined.
063: KYENJOJO DISTRICT LOCAL GOVERNMENT ............................................... Error! Bookmark not defined.
064: KWEEN DISTRICT LOCAL GOVERNMENT ................................................... Error! Bookmark not defined.
065: LAMWO DISTRICT LOCAL GOVERNMENT ................................................. Error! Bookmark not defined.
066: LIRA DISTRICT LOCAL GOVERNMENT ........................................................ Error! Bookmark not defined.
067: LUUKA DISTRICT LOCAL GOVERNMENT .................................................... Error! Bookmark not defined.
068: LUWERO DISTRICT LOCAL GOVERNMENT ................................................ Error! Bookmark not defined.
069: LWENGO DISTRICT LOCAL GOVERNMENT ................................................ Error! Bookmark not defined.
070: LYANTONDE DISTRICT LOCAL GOVERNMENT ........................................... Error! Bookmark not defined.
071: MANAFWA DISTRICT LOCAL GOVERNMENT ............................................. Error! Bookmark not defined.
072: MARACHA DISTRICT LOCAL GOVERNMENT .............................................. Error! Bookmark not defined.
073: MASAKA DISTRICT LOCAL GOVERNMENT ................................................. Error! Bookmark not defined.
074: MASINDI DISTRICT LOCAL GOVERNMENT ................................................ Error! Bookmark not defined.
075: MARACHA DISTRICT LOCAL GOVERNMENT .............................................. Error! Bookmark not defined.
076: MAYUGE DISTRICT LOCAL GOVERNMENT ................................................ Error! Bookmark not defined.
077: MBARARA DISTRICT LOCAL GOVERNMENT .............................................. Error! Bookmark not defined.
078: MITOOMA DISTRICT LOCAL GOVERNMENT .............................................. Error! Bookmark not defined.

079: MITYANA DISTRICT LOCAL GOVERNMENT ............................................... Error! Bookmark not defined.
080: MPIGI DISTRICT LOCAL GOVERNMENT ..................................................... Error! Bookmark not defined.
081: MOROTO DISTRICT LOCAL GOVERNMENT ............................................... Error! Bookmark not defined.
082: MOYO DISTRICT LOCAL GOVERNMENT .................................................... Error! Bookmark not defined.
083: MUBENDE DISTRICT LOCAL GOVERNMENT .............................................. Error! Bookmark not defined.
084: MUKONO DISTRICT LOCAL GOVERNMENT ............................................... Error! Bookmark not defined.
085: MBALE DISTRICT LOCAL GOVERNMENT ................................................... Error! Bookmark not defined.
086: NAKAPIRIPIRIT DISTRICT LOCAL GOVERNMENT ....................................... Error! Bookmark not defined.
087: NAKASEKE DISTRICT LOCAL GOVERNMENT .............................................. Error! Bookmark not defined.
088: NAKASONGOLA DISTRICT LOCAL GOVERNMENT ..................................... Error! Bookmark not defined.
089: NAMAYINGO DISTRICT LOCAL GOVERNMENT .......................................... Error! Bookmark not defined.
090: NAMUTUMBA DISTRICT LOCAL GOVERNMENT ........................................ Error! Bookmark not defined.
091: NAKASEKE DISTRICT LOCAL GOVERNMENT .............................................. Error! Bookmark not defined.
092: NAPAK DISTRICT LOCAL GOVERNMENT .................................................... Error! Bookmark not defined.
093: NEBBI DISTRICT LOCAL GOVERNMENT ..................................................... Error! Bookmark not defined.
094: NGORA DISTRICT LOCAL GOVERNMENT ................................................... Error! Bookmark not defined.
095: NTOROKO DISTRICT LOCAL GOVERNMENT .............................................. Error! Bookmark not defined.
096: NTUNGAMO DTRICT LOCAL GOVERNMENT ............................................. Error! Bookmark not defined.
097: NWOYA DTRICT LOCAL GOVERNMENT ..................................................... Error! Bookmark not defined.
098: OTUKE DITRICT LOCAL GOVERNMENT ...................................................... Error! Bookmark not defined.
099: OYAM DITRICT LOCAL GOVERNMENT ...................................................... Error! Bookmark not defined.
100: PADER DITRICT LOCAL GOVERNMENT ...................................................... Error! Bookmark not defined.
101: PALLISA DITRICT LOCAL GOVERNMENT .................................................... Error! Bookmark not defined.
102: RAKAI DITRICT LOCAL GOVERNMENT ....................................................... Error! Bookmark not defined.
103: RUBIRIZI DITRICT LOCAL GOVERNMENT ................................................... Error! Bookmark not defined.

104: RUKUNGIRI DITRICT LOCAL GOVERNMENT .............................................. Error! Bookmark not defined.
105: SHEEMA DITRICT LOCAL GOVERNMENT ................................................... Error! Bookmark not defined.
106: SERERE DITRICT LOCAL GOVERNMENT ..................................................... Error! Bookmark not defined.
107: SIRONKO DISTRICT LOCAL GOVERNMENT ................................................ Error! Bookmark not defined.
108: SOROTI DISTRICT LOCAL GOVERNMENT ................................................... Error! Bookmark not defined.
109: SSEMBABULE DITRICT LOCAL GOVERNMENT ........................................... Error! Bookmark not defined.
110: TORORO DISTRICT LOCAL GOVERNMENT ................................................. Error! Bookmark not defined.
111: WAKISO DISTRICT LOCAL GOVERNMENT ................................................. Error! Bookmark not defined.
112: YUMBE DISTRICT LOCAL GOVERNMENT ................................................... Error! Bookmark not defined.
113: ZOMBO DISTRICT LOCAL GOVERNMENT .................................................. Error! Bookmark not defined.
List of Tables Table 1: Percent of approved positions filled by level of care (as at December 2013) ........................................ 12
Table 2: Percent of approved positions filled in regional referral hospitals ......................................................... 13
Table 3: Percent of approved positions filled in HFs from DLGs and Urban AuthoritiesError! Bookmark not defined.
Table 4: Percent of approved positions filled by health workers per general hospital ........................................ 13
Table 5: Percent of approved positions filled in the public sector for selected health cadres ............................ 15

1.1.1.1 Abbreviations and Acronyms
CUFH China-Uganda Friendship Hospital
DHO District Health Office/Officer
DLG District Local Government
GH General Hospital
GoU Government of Uganda
HC II, III,
IV
Health Center, level II, III and IV
HRH Human Resources for Health
IDI Infectious Diseases Institute
KCCA Kampala Capital City Authority
LG Local Government
MC Municipal Council
MHO Municipal Health Office/Officer

MO Medical Officer
MOFPED Ministry of Finance and Economic Development
MOH Ministry of Health
MOPS Ministry of Public Service
MOSG Medical Officer Special Grade
PEPFAR (The US) President’s Emergency Plan For AIDS Relief
PNFP Private-not-for-profit
PREFA Protecting Families Against AIDS
RRH Regional Referral Hospital
TC Town Council
UBTS Uganda Blood Transfusion Services
UCI Uganda Cancer Institute
UCP Uganda Capacity Project
UHI Uganda Health Institute

Executive Summary
Introduction
This audit report provides information on staffing levels and skill mix in the public health sector as of
December 2013. It is aimed at providing human resource information regarding the current gap in
staffing within GoU established structure in order to inform future HRH planning (recruitment and
training). The analysis focuses on public sector (MOH) employees who are currently occupying
established or approved positions within government-owned facilities or institutions.
Methods
The MOH, with support of Uganda Capacity Program, collected data using standard reporting forms
from 2 national hospitals, 3 central specialized institutions, 14 Regional Referral Hospitals (RRH), 42
General Hospitals (GH), 179 HC IVs, 936 HC IIIs and 1,619 HC IIs. Data were entered, processed and
analyzed using MS Excel 2013.
Major Findings
Overall 69% of the approved staffing positions is currently filled, as per December 2013. The combined
staffing level at central-level institutions (national referral hospitals, specialized health institutions and
regional referral hospitals) was 81%; while the combined staffing at health facilities and management
offices at the district local government and Municipal Council levels was 67%. General administration
cadres and Clinical Officers are available in sufficient numbers (101% capacity). Nurses and midwives are
staffed to 83% and 76% capacity respectively. The following health cadres are severely short in number:
Pharmacists (8%), Anaesthetic staff (30%), Health administrators (33%), and Cold chain technicians
(40%). Overall, staffing is skewed in favour of specialized health institutions and larger health facilities
(RRH 81%; GH 68%; HC IV 78%; HC III 76%; HC II 49%).
Conclusion and recommendations
Compared to 2009, staffing level has increased by 14% point as at December 2013. However,
distribution of staffing is skewed against lower referral health facilities where most patients seek care. In
addition, cadres that are critical in scaling-up maternal and child survival interventions are severely in
short supply. Future recruitment plans should prioritize critical but rare cadres such as pharmacists,
Anaesthetic staff and pathologists in addition to lower-level health facility staff.

Introduction
This audit report, the fifth since 2009, provides information on staffing levels and skill mix in the public
health sector as of December 2013. The objective of the analysis was to provide HRH information and
identify the staffing gaps in and skill mix within GoU established structure in order to inform future HRH
planning (recruitment and training). For this reason, the analysis focuses on public sector (MOH)
employees who are currently occupying established or approved positions within government-owned
health institutions. Health workers who are employed by the GoU, but are currently seconded to the
Private-not-for-profit (PNFP) health institutions are excluded from the analysis. Similarly, health workers
who were hired on contract by Implementing Partners (e.g. PEPFAR, Baylor, PREFA, IDI etc.) were
excluded because they would only improve the status of staffing at health facilities temporarily. It also
excludes staffing at the Ministry of Health Headquarters and the Health Service Commission.
The report provides the staffing level and skill mix as at December 2013. Therefore it provides an
indication of the impact on staffing of the nation-wide recruitment which was carried out in 2012.
1. Methods
1.1. Staffing norms
In this analysis, staffing level is defined as the proportion of approved positions filled by the appropriate
health worker; where ‘approved positions’ are based on fixed MOH norms or standards for different
levels of care or institutions.
1.2. Population
The MOH, with support of Uganda Capacity Program, collected, analysed and summarized data from
public health facilities and health institutions, consisting of 2 national hospitals (Mulago and Butabika), 3
central specialized institutions (Uganda Blood Transfusion Services (UBTS), Uganda Heart Institute (UHI)
and Uganda Cancer Institute (UCI)), 14 Regional Referral Hospitals (RRH), of 42 General Hospitals (GH),
179 HC IVs, 936 HC IIIs and 1,619 HC IIs. Additional data were collected from District and Municipal
Health Offices (DHOs and MHOs); and Kampala City Council Authority offices. Overall, the report
summarises data from 105 District Local Governments (DLGs), KCCA , 21 municipal councils and 69 big
town councils.
1.3. Data collection method
The MOH and UCP requested local governments and agencies—namely DHOs, MHOs, RRHs, UBTS, UHI,
UCI and KCCA—to submit data from their jurisdictions, on the proportion of approved positions filled by
health workers at different levels of care or service as at December 2013. Data were submitted to
Uganda Capacity Program using a standard reporting form. Data were collected between December
2013 and March 2014. A number of follow-up calls were made to ensure data quality. For entities
(health facilities, LGs and municipalities) that had not submitted data by March 2014, we solicited and
extracted relevant data from the staff lists included in the Budget Framework paper and submitted to
the MoFPED.

1.4. Data management, analysis and presentations
Data were entered, cleaned, coded and analyzed in MS Excel 2013. This draft report presents results at
the national level, by district, by level of health care delivery, and by level of health management agency
(DHOs, MHOs, KCCA). It does not presents results by individual health units.
2. Findings
This section presents the combined staffing level (overall percent of approved positions filled at the
national level); as well as a breakdown of staffing by level of care and cadre.
2.1. Overall staffing level
Table 1 below shows the aggregate (national) staffing level for public health facilities in 2 national
hospitals, 3 central specialized institutions, 14 Regional Referral Hospitals (RRH), of 42 General Hospitals
(GH), 164 HC IVs, 803 HC IIIs and 1,321 HC IIs..
Table 1: Percent of approved positions filled by level of care (as at December 2013)
NAME No. of Units
Total
Norm Filled Vacant
%
Filled
%
Vacant
Butabika NRH 1 424 359 63 85% 15%
Mulago NRH 1 2,801 1,880 581 67% 24%
UBTS 1 242 215 27 89% 11%
UCI 1 213 122 91 57% 43%
Uganda Heart Institute 1 190 134 56 71% 29%
RRH 14 4,744 3,820 924 81% 19%
Sub-Total Central Level 19 8,272 6,530 1,742 79% 21%
DHO's Office 112 1,232 636 596 52% 43%
Municipal Councils 22 176 111 65 63% 35%
Town Councils 69 345 111 234 32% 68%
General Hospitals 42 7,600 5,281 2,319 69% 32%
HC IV 164 7,920 6,734 1,186 85% 22%
HC III 803 17,746 13,398 4,348 75% 25%
HC II 1,321 14,364 7,096 7,268 49% 51%
Sub-Total Local Government 2,533 49,383 33,367 16,016 68% 32%
Total National Level 2,552 57,655 39,897 17,758 69% 31%
Overall 69% of the approved staffing positions is currently filled (as per December 2013), as seen from
Table 1 above. Staffing at central-level institutions (UBTS, UCI, UHI and RRH) is generally high, at 79%;
with Uganda Blood Transfusion Services (UBTS) being the most staffed (89%) and Uganda Heart Institute
(UCI), the least staffed, at 57%. The overall staffing level at health facilities from DLGs and urban
authorities is comparatively lower, at 68%; of which Health Centre IV s have the highest staffing level

(85%), and Town Council (TC) health offices the lowest staffing level at 32%. Overall, staffing is skewed in
favour of the larger health facilities.
2.2. Staffing in Regional Referral Hospitals
Table 2 below presents the HRH staffing position for the 14 Regional Referral Hospitals (RRH) including
the China-Uganda Friendship Hospital (CUFH)-Naguru. The RRHs are rank-ordered from the highest to
the lowest staffing levels.
Table 2: Percent of approved positions filled in regional referral hospitals
SN Name Norm Filled Filled % Vacant %
1 Arua RRH 293 316 108% -7.8%
2 Mbale RRH 372 386 104% -3.8%
3 FortPortal 326 313 96% 4.0%
4 Gulu RRH 321 304 95% 5.3%
5 Mbarara RRH 329 304 92% 7.6%
6 Jinja RRH 421 375 89% 10.9%
7 Masaka RRH 312 261 84% 16.3%
8 Lira RRH 340 271 80% 20.3%
9 Hoima RRH 308 234 76% 24.0%
10 Soroti RRH 340 253 74% 25.6%
11 Kabale RRH 340 237 70% 30.3%
12 Naguru RRH 344 232 67% 32.6%
13 Mubende RRH 349 191 55% 45.3%
14 Moroto RRH 349 143 41% 59.0%
TOTAL 4,744 3,820 81% 19%
The average staffing level for RRHs is 81%. As evident from the table above, Arua and Mbale RRHs are
overstaffed, at 108% and 104% respectively; while severe shortages exist in Moroto and Mubende RRHs,
where only 41% and 55% of the approved positions are filled, respectively. It is notable that most (11) of
the RRHs are staffed to at least 70% capacity.
3.3 Staffing in General Hospitals
Table 3 shows the staffing level for general hospitals only. The hospitals are ranked from the highest
staffing level to the lowest.
Table 3: Percent of approved positions filled by health workers per general hospital
SN Name District Norm Filled Filled % Filled %
1 Iganga Hospital Iganga 190 190 100% 0%

2 Bundibugyo Hospital Bundibugyo 190 184 97% 3%
3 Kamuli Hospital Kamuli 190 183 96% 4%
4 Apac Hospital Apac 190 163 86% 14%
5 Mityana Hospital Mityana 190 163 86% 14%
6 Kalisizo Hospital Rakai 190 163 86% 14%
7 Entebbe Hospital Wakiso 190 161 85% 15%
8 Nakaseke Hospital Nakaseke 190 158 83% 17%
9 Kawolo Hospital Buikwe 190 157 83% 17%
10 Kapchorwa Hospital Kapchorwa 190 157 83% 17%
11 Kitgum Hospital Kitgum 190 155 82% 18%
12 Kayunga Hospital Kayunga 190 151 79% 21%
13 Bwera Hospital Kasese 190 149 78% 22%
14 Yumbe Hospital Yumbe 190 143 75% 25%
15 Adjumani Hospital Adjumani 190 141 74% 26%
16 Kilembe Hospital Kasese 190 141 74% 26%
17 Kisoro Hospital Kisoro 190 140 74% 26%
18 Itojo Hospital Ntungamo 190 139 73% 27%
19 Tororo Hospital Tororo 190 138 73% 27%
20 Abim Hospital Abim 190 136 72% 28%
21 Masindi Hospital Masindi 190 134 71% 29%
22 Kilembe Mines Hospital Kasese 190 133 70% 30%
23 Rakai Hospital Rakai 190 128 67% 33%
24 District Hospital Moyo 190 127 67% 33%
25 Bugiri Hospital Bugiri 190 126 66% 34%
26 Lyantonde Hospital Lyantonde 190 120 63% 37%
27 Bududa Hospital Bududa 190 113 59% 41%
28 Nebbi Hospital Nebbi 190 113 59% 41%
29 Kagadi Hospital Kibaale 190 112 59% 41%
30 Kiboga Hospital Kiboga 190 108 57% 43%
31 Kiryandongo Hospital Kiryandongo 190 108 57% 43%
32 Gombe Hospital Butambala 190 107 56% 44%
33 Anaka Hospital Nwoya 190 106 56% 48%
34 Atutur Hospital Kumi 190 106 56% 44%
35 Kambuga Hospital Kanungu 190 99 52% 48%
36 Busolwe Hospital Butaleja 190 98 52% 52%
37 Bukwo Hospital Bukwo 190 92 48% 57%
38 Kitagata Hospital Sheema 190 82 43% 58%
39 Kaabong Hospital Kaabong 190 80 42% 58%
40 Kyenjojo Hospital Kyenjojo 190 79 42% 62%
41 Masafu Hospital Busia 190 72 38% 63%
42 Katakwi Hospital Katakwi 190 71 37% 65%

Overall 7,980 5,426 68% 32%
The average staffing level for GHs is 68%. In Iganga hospital, all approved positions are filled. However,
at least 7 GHs (Busolwe, Bukwo, Kitagata, Kaabong, Kyenjojo, Masafu, and Katakwi) have severe
shortage of staff with staffing below 50%.
3.4 Staffing level by type of cadre
Staffing in the health facilities was also analyzed by type of cadre. The analysis of health workers was
grouped into 15 broad categories shown in Table 4. The categories of Nurses and Midwives consist of
both enrolled and registered staff, of all grades. Similarly, doctors consist of Medical officers (MOs) at
different levels of seniority, including MO special grades; but excluding Consultants. Health
administration cadres comprise of staff with health-related qualifications/skills, and are serving in
substantive administrative positions. This category includes hospital directors, health planners and
health economists, and DHOs. On the other hand, staff classified in the category of “general
administration” consist of all those with generic management qualifications (e.g. hospital
administrators, stores assistants and the like).
Table 4: Percent of approved positions filled by health professionals (selected health cadres)
Cadre category Norm Filled Staffing level
Doctors 1,296 936 72%
Nurses 19,946 16,584 83%
Midwives 6,061 4,607 76%
Clinical Officers 2,758 2,780 101%
Laboratory staff 2,737 2,379 87%
Anaesthetic cadre 725 215 30%
Pharmacists 370 31 8%
Dispensers 420 232 55%
Other Allied Health Staff1 1,177 820 70%
Cold Chain Technicians 284 115 40%
Consultants 305 107 35%
General administrative cadres 1,337 1,356 101%
Health Administration 374 124 33%
Support Staff 8,622 4,573 53%

Cadre category Norm Filled Staffing level
Others 6,055 3,330 55%
Note: The definition of Health Professionals in Uganda includes those cadres that are registered and
their work is regulated by the four health professional councils (Medical and Dental, Nurses and
Midwives, Allied Health and Pharmacy).
1other allied health include physiotherapists, orthopaedic officers/assistants, ophthalmic
officers/assistants, radiographers, etc.
The approved positions for general administration cadres and Clinical Officers are filled to 101%
capacity. The health cadres who are severely short in number include Pharmacists (8%), Anaesthetic
staff (30%), Health administrators (33%), and Cold chain technicians (40%).
3.5 Short comings/Limitations of the study
During data collection exercise not all health facilities were able to send information in time for this
report. Previous data on these health facilities had to be retrieved and incorporated for completeness.
Even with this approach, information of some health facilities could be missing from the analysis. In
addition, data analysis was done at different times by two different consultants. The final analysis used
the information collected by the previous teams. Data collection was therefore supervised by the first
team and some gaps could not easily be detected by the second team.
The report does not have details of the RRH and general hospitals. However, the analysis included
aggregate totals of staffing from these institutions. The final figure of the overall staffing excludes staff
at the MoH headquarters.
4 Discussion and Conclusions
Although there has been a steady growth in staffing level from 53% in 2009 to 67% in 2013, this analysis
indicates that the most marked increase in staffing took place between 2012 and 2013. This can be
attributed to the nation-wide recruitment by the government of Uganda in 2012. However, this
particular audit report and all the preceding ones indicate that staffing, especially at health facilities, are
still skewed towards the larger health facilities. This report also shows that RRH hospitals are relatively
well staffed, at 85% capacity; while at a HC II (the lowest level of formal medical care—and where most
patients seek healthcare), only 49% of approved positions are filled. Nevertheless, HCIIIs and HCIVs are
fairly sufficiently staffed, at 76% and 78% respectively.
The report also indicates that, presently, health institutions are well staffed with clinical officers (101%)
and nurses (83%). However, there is severe shortage of anesthetic staff (30%), cold-chain technicians
(40%), dispensers (55%) and pharmacists (8%). In any case most of these cadres are probably
concentrated at the large health facilities. Future recruitment plans need to prioritize these rare cadres

and lower-level health facilities. Further, future HRH interventions need to focus on achieving equitable
distribution and promoting accountability and productivity of health workers.

5. Appendices
________________________________________________________
Appendix 1: Staffing levels for HC II, HC III and HC IVs.
Local
Govt
HC II HC III HC IV
TOTAL (EXCL. HEALTH
OFFICE)
Norm Filled
Filled
% Norm Filled
Filled
% Norm Filled
Filled
% Norm Filled
Filled
%
Abim 90 65 72% 57 47 82% 0 0 0% 147 112 76%
Adjumani 189 153 81% 0 138 0% 48 30 63% 237 321 135%
Agago 216 144 67% 152 133 88% 0 0 0% 368 277 75%
Alebtong 18 7 39% 76 56 74% 48 44 92% 142 107 75%
Amolatar 63 35 56% 57 52 91% 48 63
131
% 168 150 89%
Amudat 9 4 44% 57 21 37% 48 27 56% 114 52 46%
Amuria 180 84 47% 133 112 84% 96 87 91% 409 283 69%
Amuru 135 91 67% 152 125 82% 48 39 81% 335 255 76%
Apac 144 87 60% 0 163 0% 48 53
110
% 192 303 158%
Arua 162 63 39% 532 262 49% 192 98 51% 886 423 48%
Arua-MC 0 0 0% 0 0 0% 48 35 73% 48 35 73%
Budaka 27 24 89% 171 137 80% 48 45 94% 246 206 84%
Bududa 63 26 41% 133 98 74% 0 0 0% 196 124 63%
Bugiri 153 37 24% 228 115 50% 48 30 63% 429 182 42%
Buhweju 72 12 17% 57 33 58% 48 19 40% 177 64 36%
Buikwe 135 51 38% 190 144 76% 0 0 0% 325 195 60%
Bukedea 9 2 22% 95 77 81% 48 40 83% 152 119 78%
Bukomans
imbi 27 9 33% 57 52 91% 48 32 67% 132 93 70%
Bukwo 99 59 60% 57 49 86% 48 28 58% 204 136 67%
Bulambuli 72 29 40% 171 109 64% 96 82 85% 339 220 65%
Buliisa 36 23 64% 57 46 81% 48 42 88% 141 111 79%
Bundibugy
o 126 91 72% 95 79 83% 96 107
111
% 317 277 87%
Bushenyi 126 73 58% 133 126 95% 48 45 94% 307 244 79%
Bushenyi-
MC 18 8 44% 0 0 0% 48 35 73% 66 43 65%
Busia 117 22 19% 133 88 66% 0 0 0% 250 110 44%
Busia-MC 0 0 0% 0 0 0% 48 34 71% 48 34 71%
Butaleja 90 26 29% 190 135 71% 0 0 0% 280 161 58%
Butambala 81 41 51% 76 44 58% 0 0 0% 157 85 54%
Buvuma 45 19 42% 57 43 75% 48 34 71% 150 96 64%
Buyende 45 29 64% 76 69 91% 48 44 92% 169 142 84%
Dokolo 99 62 63% 76 75 99% 48 51 106 223 188 84%

Local
Govt
HC II HC III HC IV
TOTAL (EXCL. HEALTH
OFFICE)
Norm Filled
Filled
% Norm Filled
Filled
% Norm Filled
Filled
% Norm Filled
Filled
%
%
Entebbe-
MC 0 0 0% 19 18 95% 0 0 0% 19 18 95%
Fort-
Portal-MC 0 0 0% 57 43 75% 48 28 58% 105 71 68%
Gomba 99 51 52% 76 57 75% 48 26 54% 223 134 60%
Gulu 288 255 89% 190 141 74% 96 87 91% 574 483 84%
Hoima 135 68 50% 323 208 64% 96 61 64% 554 337 61%
Hoima-
MC 36 17 47% 38 22 58% 0 0 0% 74 39 53%
Ibanda 279 69 25% 133 80 60% 96 82 85% 508 231 45%
Iganga 171 112 65% 228 216 95% 96 83 86% 495 411 83%
Iganga-
MC 27 7 26% 19 25
132
% 0 0 0% 46 32 70%
Isingiro 288 97 34% 361 220 61% 144 81 56% 793 398 50%
Jinja 252 180 71% 190 166 87% 144 133 92% 586 479 82%
Jinja-MC 36 16 44% 19 31
163
% 96 93 97% 151 140 93%
Kaabong 153 61 40% 76 36 47% 48 28 58% 277 125 45%
Kabale 522 261 50% 304 222 73% 288 185 64% 1114 668 60%
Kabale-
MC 27 23 85% 0 0 0% 48 31 65% 75 54 72%
Kabarole 135 64 47% 361 275 76% 96 86 90% 592 425 72%
Kaberamai
do 54 41 76% 133 115 86% 48 45 94% 235 201 86%
Kalangala 9 5 56% 114 101 89% 96 73 76% 219 179 82%
Kaliro 36 22 61% 76 79
104
% 48 44 92% 160 145 91%
Kalungu 27 14 52% 133 120 90% 48 32 67% 208 166 80%
Kamuli 207 53 26% 171 141 82% 144 77 53% 522 271 52%
Kamweng
e 153 108 71% 152 109 72% 96 88 92% 401 305 76%
Kanungu 117 56 48% 190 119 63% 96 82 85% 403 257 64%
Kapchorw
a 90 55 61% 133 105 79% 0 0 0% 223 160 72%
Kasese 432 196 45% 551 351 64% 192 88 46% 1175 635 54%
Kasese-
MC 27 21 78% 76 62 82% 48 13 27% 151 96 64%
Katakwi 117 74 63% 76 65 86% 48 31 65% 241 170 71%
Kayunga 72 39 54% 152 135 89% 96 72 75% 320 246 77%
KCCA 9 25
278
% 95 347
365
% 48 124
258
% 152 496 326%
Kibaale 99 41 41% 304 152 50% 0 0 0% 403 193 48%
Kiboga 90 24 27% 152 66 43% 48 37 77% 290 127 44%

Local
Govt
HC II HC III HC IV
TOTAL (EXCL. HEALTH
OFFICE)
Norm Filled
Filled
% Norm Filled
Filled
% Norm Filled
Filled
% Norm Filled
Filled
%
Kibuku 36 19 53% 133 80 60% 48 48
100
% 217 147 68%
Kiruhura 171 41 24% 228 136 60% 96 67 70% 495 244 49%
Kiryandon
go 117 57 49% 95 65 68% 0 0 0% 212 122 58%
Kisoro 171 114 67% 266 190 71% 144 83 58% 581 387 67%
Kitgum 72 44 61% 152 94 62% 48 36 75% 272 174 64%
Koboko 81 64 79% 76 60 79% 48 42 88% 205 166 81%
Kole 0 42 0% 76 65 86% 48 42 88% 124 149 120%
Kotido 72 46 64% 95 62 65% 48 55
115
% 215 163 76%
Kumi 36 15 42% 38 30 79% 0 0 0% 74 45 61%
Kween 135 70 52% 152 114 75% 48 38 79% 335 222 66%
Kyankwan
zi 27 12 44% 171 103 60% 48 46 96% 246 161 65%
Kyegegwa 54 47 87% 114 87 76% 48 45 94% 216 179 83%
Kyenjojo 45 62
138
% 190 222
117
% 48 74
154
% 283 358 127%
Lamwo 117 40 34% 95 80 84% 96 67 70% 308 187 61%
Lira 54 32 59% 133 105 79% 96 86 90% 283 223 79%
Lira-MC 9 9
100
% 38 37 97% 0 0 0% 47 46 98%
Luuka 180 61 34% 133 76 57% 48 45 94% 361 182 50%
Luwero 189 93 49% 285 235 82% 144 201
140
% 618 529 86%
Lwengo 81 26 32% 76 55 72% 144 92 64% 301 173 57%
Lyantonde 117 48 41% 57 47 82% 0 0 0% 174 95 55%
Manafwa 72 40 56% 228 180 79% 144 110 76% 444 330 74%
Maracha 36 27 75% 171 130 76% 0 0 0% 207 157 76%
Masaka 72 43 60% 114 86 75% 96 62 65% 282 191 68%
Masaka-
MC 45 27 60% 0 0 0% 0 0 0% 45 27 60%
Masindi 0 0 0% 0 0 0% 0 0 0% 0 0 0%
Masindi-
MC 45 43 96% 19 11 58% 0 0 0% 64 54 84%
Mayuge 216 86 40% 95 80 84% 96 69 72% 407 235 58%
Mbale 72 32 44% 399 313 78% 192 141 73% 663 486 73%
Mbale-MC 9 14
156
% 57 72
126
% 48 25 52% 114 111 97%
Mbarara 252 49 19% 190 104 55% 144 99 69% 586 252 43%
Mbarara-
MC 27 17 63% 38 20 53% 48 26 54% 113 63 56%
Mitooma 63 31 49% 133 92 69% 48 42 88% 244 165 68%
Mityana 144 36 25% 304 140 46% 144 98 68% 592 274 46%

Local
Govt
HC II HC III HC IV
TOTAL (EXCL. HEALTH
OFFICE)
Norm Filled
Filled
% Norm Filled
Filled
% Norm Filled
Filled
% Norm Filled
Filled
%
Moroto 90 35 39% 133 73 55% 0 0 0% 223 108 48%
Moroto-
MC 9 8 89% 19 10 53% 0 0 0% 28 18 64%
Moyo 225 133 59% 152 116 76% 192 81 42% 569 330 58%
Mpigi 63 26 41% 209 130 62% 48 59
123
% 320 215 67%
Mubende 360 109 30% 190 135 71% 96 73 76% 646 317 49%
Mukono 153 98 64% 228 198 87% 48 44 92% 429 340 79%
Mukono-
MC 27 14 52% 19 14 74% 48 55
115
% 94 83 88%
Nakapiripi
rit 54 29 54% 95 49 52% 96 69 72% 245 147 60%
Nakaseke 90 36 40% 76 61 80% 144 84 58% 310 181 58%
Nakasong
ola 180 110 61% 152 125 82% 96 92 96% 428 327 76%
Namaying
o 144 19 13% 76 50 66% 48 39 81% 268 108 40%
Namutum
ba 153 43 28% 95 89 94% 48 42 88% 296 174 59%
Napak 45 43 96% 114 96 84% 0 0 0% 159 139 87%
Nebbi 198 56 28% 247 139 56% 48 49
102
% 493 244 49%
Ngora 27 14 52% 114 79 69% 48 26 54% 189 119 63%
Ntoroko 27 24 89% 57 39 68% 48 42 88% 132 105 80%
Ntungamo 198 127 64% 209 167 80% 144 106 74% 551 400 73%
Ntungamo
-MC 9 7 78% 19 20
105
% 0 0 0% 28 27 96%
Nwoya 54 26 48% 95 51 54% 0 0 0% 149 77 52%
Otuke 36 22 61% 95 73 77% 48 39 81% 179 134 75%
Oyam 144 108 75% 76 53 70% 48 52
108
% 268 213 79%
Pader 117 92 79% 171 136 80% 48 46 96% 336 274 82%
Paliisa 72 38 53% 266 175 66% 48 39 81% 386 252 65%
Rakai 486 172 35% 380 264 69% 48 44 92% 914 480 53%
Rubirizi 108 30 28% 57 37 65% 48 41 85% 213 108 51%
Rukungiri 459 284 62% 285 257 90% 144 196
136
% 888 737 83%
Rukungiri-
MC 36 23 64% 19 13 68% 48 22 46% 103 58 56%
Sembabule 126 46 37% 76 56 74% 96 66 69% 298 168 56%
Serere 81 28 35% 114 80 70% 96 79 82% 291 187 64%
Sheema 180 39 22% 76 58 76% 96 64 67% 352 161 46%
Sironko 81 52 64% 266 168 63% 96 84 88% 443 304 69%
Soroti 81 30 37% 114 88 77% 48 33 69% 243 151 62%
Local
Govt
HC II HC III HC IV
TOTAL (EXCL. HEALTH
OFFICE)
Norm Filled
Filled
% Norm Filled
Filled
% Norm Filled
Filled
% Norm Filled
Filled
%
Soroti-MC 9 5 56% 57 52 91% 48 35 73% 114 92 81%
Tororo 315 87 28% 228 128 56% 192 95 49% 735 310 42%
Tororo-
MC 0 0 0% 0 0 0% 0 0 0% 0 0 0%
Wakiso 297 151 51% 361 264 73% 288 206 72% 946 621 66%
Yumbe 117 78 67% 152 116 76% 48 39 81% 317 233 74%
Zombo 63 36 57% 114 113 99% 0 0 0% 177 149 84%
Overall
14,36
4
7,09
6 49%
17,72
7
13,39
8 76%
8,64
0
6,73
4 78%
40,731
27,228 67%
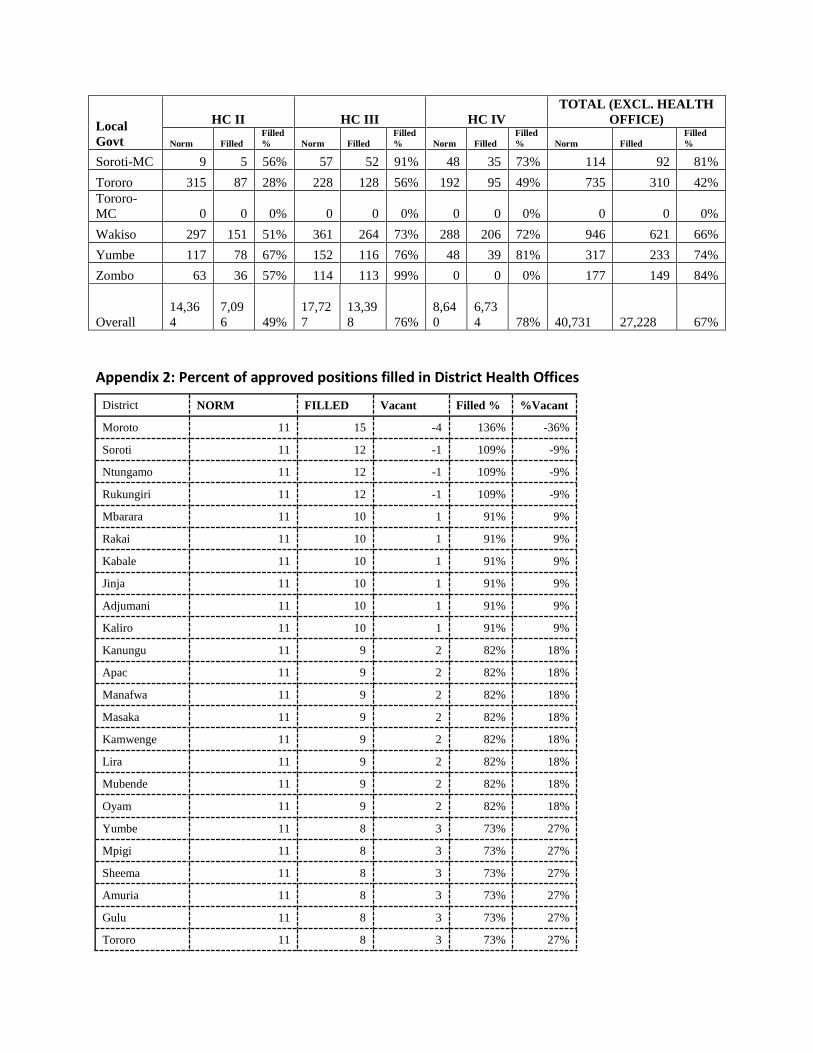
Appendix 2: Percent of approved positions filled in District Health Offices
District NORM FILLED Vacant Filled % %Vacant
Moroto 11 15 -4 136% -36%
Soroti 11 12 -1 109% -9%
Ntungamo 11 12 -1 109% -9%
Rukungiri 11 12 -1 109% -9%
Mbarara 11 10 1 91% 9%
Rakai 11 10 1 91% 9%
Kabale 11 10 1 91% 9%
Jinja 11 10 1 91% 9%
Adjumani 11 10 1 91% 9%
Kaliro 11 10 1 91% 9%
Kanungu 11 9 2 82% 18%
Apac 11 9 2 82% 18%
Manafwa 11 9 2 82% 18%
Masaka 11 9 2 82% 18%
Kamwenge 11 9 2 82% 18%
Lira 11 9 2 82% 18%
Mubende 11 9 2 82% 18%
Oyam 11 9 2 82% 18%
Yumbe 11 8 3 73% 27%
Mpigi 11 8 3 73% 27%
Sheema 11 8 3 73% 27%
Amuria 11 8 3 73% 27%
Gulu 11 8 3 73% 27%
Tororo 11 8 3 73% 27%

District NORM FILLED Vacant Filled % %Vacant
Amolatar 11 8 3 73% 27%
Kayunga 11 8 3 73% 27%
Maracha 11 8 3 73% 27%
Kiruhura 11 8 3 73% 27%
Kitgum 11 8 3 73% 27%
Kotido 11 8 3 73% 27%
Mukono 11 8 3 73% 27%
Nakapiripirit 11 8 3 73% 27%
Wakiso 11 8 3 73% 27%
Moyo 11 8 3 73% 27%
Luwero 11 7 4 64% 36%
Nebbi 11 7 4 64% 36%
Napak 11 7 4 64% 36%
Hoima 11 7 4 64% 36%
Iganga 11 7 4 64% 36%
Kalangala 11 7 4 64% 36%
Lyantonde 11 7 4 64% 36%
Zombo 11 7 4 64% 36%
Kyankwanzi 11 7 4 64% 36%
Nakasongola 11 7 4 64% 36%
Ntoroko 11 7 4 64% 36%
Kabarole 11 6 5 55% 45%
Sironko 11 6 5 55% 45%
Bushenyi 11 6 5 55% 45%
Bukedea 11 6 5 55% 45%
Isingiro 11 6 5 55% 45%
Kapchorwa 11 6 5 55% 45%
Kyegegwa 11 6 5 55% 45%
Dokolo 11 6 5 55% 45%
Kamuli 11 6 5 55% 45%
Sembabule 11 6 5 55% 45%
Pader 11 6 5 55% 45%
Serere 11 6 5 55% 45%
Kaberamaido 11 6 5 55% 45%
Luuka 11 6 5 55% 45%
Arua 11 5 6 45% 55%
Bugiri 11 5 6 45% 55%

District NORM FILLED Vacant Filled % %Vacant
Ibanda 11 5 6 45% 55%
Kyenjojo 11 5 6 45% 55%
Mityana 11 5 6 45% 55%
Budaka 11 5 6 45% 55%
Bukwo 11 5 6 45% 55%
Butaleja 11 5 6 45% 55%
Buvuma 11 5 6 45% 55%
Mitooma 11 5 6 45% 55%
Katakwi 11 5 6 45% 55%
Koboko 11 5 6 45% 55%
Rubirizi 11 5 6 45% 55%
Bundibugyo 11 4 7 36% 64%
Namutumba 11 4 7 36% 64%
Busia 11 4 7 36% 64%
Namayingo 11 4 7 36% 64%
Ngora 11 4 7 36% 64%
Buhweju 11 4 7 36% 64%
Bulambuli 11 4 7 36% 64%
Kibuku 11 4 7 36% 64%
Buyende 11 4 7 36% 64%
Kween 11 4 7 36% 64%
Lwengo 11 4 7 36% 64%
Kiryandongo 11 4 7 36% 64%
Kole 11 4 7 36% 64%
Buikwe 11 3 8 27% 73%
Paliisa 11 3 8 27% 73%
Butambala 11 3 8 27% 73%
Abim 11 3 8 27% 73%
Kiboga 11 3 8 27% 73%
Mayuge 11 3 8 27% 73%
Kasese 11 3 8 27% 73%
Bududa 11 3 8 27% 73%
Kaabong 11 3 8 27% 73%
Lamwo 11 3 8 27% 73%
Otuke 11 3 8 27% 73%
Kalungu 11 3 8 27% 73%
Nwoya 11 3 8 27% 73%

District NORM FILLED Vacant Filled % %Vacant
Amuru 11 2 9 18% 82%
Amuru 11 2 9 18% 82%
Buliisa 11 2 9 18% 82%
Gomba 11 2 9 18% 82%
TOTAL 1,122 636 486 57% 43%
1.1.1.2 Appendix 3: Percent of approved positions filled in Municipal Health
Offices
Municipal Norm Filled Filled
% Vacant %
Tororo-MC 8 8 100% 0%
Masaka-MC 8 8 100% 0%
Rukungiri-MC 8 8 100% 0%
Bushenyi-MC 8 8 100% 0%
Jinja-MC 8 7 88% 22%
Kasese-MC 8 7 88% 22%
Fort-Portal-MC 8 6 75% 33%
Kabale-MC 8 6 75% 33%
Moroto-MC 8 6 75% 33%
Arua-MC 8 5 63% 44%
Masindi-MC 8 5 63% 44%
Mbarara-MC 8 4 50% 56%
Hoima-MC 8 3 38% 67%
Lira-MC 8 3 38% 67%
Mbale-MC 8 6 75% 67%
Busia-MC 8 1 13% 89%
Mukono-MC 8 1 13% 89%
Ntungamo-MC 8 1 13% 89%
TOTAL 144 93 65% 35%