human resource bundles and manufacturing … j.p. (1995... · production systems in the world auto...
TRANSCRIPT

Human Resource Bundles and Manufacturing Performance: Organizational Logic and FlexibleProduction Systems in the World Auto IndustryAuthor(s): John Paul MacduffieSource: Industrial and Labor Relations Review, Vol. 48, No. 2 (Jan., 1995), pp. 197-221Published by: Cornell University, School of Industrial & Labor RelationsStable URL: http://www.jstor.org/stable/2524483 .Accessed: 24/01/2011 14:04
Your use of the JSTOR archive indicates your acceptance of JSTOR's Terms and Conditions of Use, available at .http://www.jstor.org/page/info/about/policies/terms.jsp. JSTOR's Terms and Conditions of Use provides, in part, that unlessyou have obtained prior permission, you may not download an entire issue of a journal or multiple copies of articles, and youmay use content in the JSTOR archive only for your personal, non-commercial use.
Please contact the publisher regarding any further use of this work. Publisher contact information may be obtained at .http://www.jstor.org/action/showPublisher?publisherCode=cschool. .
Each copy of any part of a JSTOR transmission must contain the same copyright notice that appears on the screen or printedpage of such transmission.
JSTOR is a not-for-profit service that helps scholars, researchers, and students discover, use, and build upon a wide range ofcontent in a trusted digital archive. We use information technology and tools to increase productivity and facilitate new formsof scholarship. For more information about JSTOR, please contact [email protected].
Cornell University, School of Industrial & Labor Relations is collaborating with JSTOR to digitize, preserveand extend access to Industrial and Labor Relations Review.
http://www.jstor.org
HUMAN RESOURCE BUNDLES AND MANUFACTURING PERFORMANCE: ORGANIZATIONAL LOGIC AND FLEXIBLE PRODUCTION SYSTEMS IN THE WORLD AUTO INDUSTRY
JOHN PAUL MACDUFFIE*
Using a unique international data set from a 1989-90 survey of 62 automotive assembly plants, the author tests two hypotheses: that innovative HR practices affect performance not individually but as interrelated elements in an internally consistent HR "bundle" or system; and that these HR bundles contribute most to assembly plant productiv- ity and quality when they are integrated with manufacturing policies under the "organizational logic" of a flexible production system. Analy- sis of the survey data, which tests three indices representing distinct bundles of human resource and manufacturing practices, supports both hypotheses. Flexible production plants with team-based work systems, "high-commitment" HR practices (such as contingent compensation and extensive training), and low inventory and repair buffers consis- tently outperformed mass production plants. Variables capturing two- way and three-way interactions among the bundles of practices are even better predictors of performance, supporting the integration hypoth- esis.
D espite claims that innovative human resource (HR) practices can boost
firm-level performance and national com- petitiveness, few studies have been able to confirm this relationship empirically, and still fewer have systematically described the conditions under which it will be strongest.
*The author, who is Assistant Professor of Man- agement at the Wharton School, University of Penn- sylvania, thanks Peter Cappelli, Harry Katz, Thomas Kochan, Bruce Kogut, Paul Osterman, Frits Pil, Daniel Raff, Nikolai Rogovsky, Libby Scott, and Peter Sherer for their comments on an earlier draft of this paper, and the International MotorVehicle Program at M.I.T. for generous support.
Although some of the problems in this research stream have been empirical (for example, unreliable measures and inad- equate controls), the more fundamental barriers have been conceptual. Innovative HR practices are often studied in a vacuum, with more attention paid to isolating the effect of individual practices than to under-
Additional details on the data and methodologies from the International Assembly Plant Study are avail- able from John Paul MacDuffie at 2017 Steinberg- Dietrich Hall, Wharton School, University of Pennsyl- vania, Philadelphia, PA 19104-6370. Data cannot be shared with other researchers due to confidentiality agreements with participating companies.
Industrial and Labor Relations Review, Vol. 48, No. 2 January 1995). ? by Cornell University. 0019-7939/95/4802 $01.00
197

198 INDUSTRIAL AND LABOR RELATIONS REVIEW
standing how different HR practices inter- act to reinforce one another, or how they are linked to business functions and strate- gies.
In this paper I test the relationship be- tween HR practices and economic perfor- mance using a unique international data set based on surveys distributed to 62 auto- motive assembly plants in 1989-90. I inves- tigate the hypothesis that "bundles" of in- terrelated and internally consistent HR practices, rather than individual practices, are the appropriate unit of analysis for studying the link to performance, because they create the multiple, mutually reinforc- ing conditions that support employee mo- tivationtand skill acquisition. Furthermore, I examine the hypothesis advanced in Arthur (1992) and Kochan, Cutcher- Gershenfeld, and MacDuffie (1991) that an HR bundle or system must be integrated with complementary bundles of practices from core business functions (and thereby with the firm's overall business strategy) to be effective.
I argue here that flexible production systems have a distinct "organizational logic" that integrates bundles of human resource practices with manufacturing practices in pursuit of simultaneous improvements in productivity and quality. A flexible produc- tion plant reduces inventory levels and other "buffers," increasing interdependence in the production process and highlighting production problems. Dealing effectively with these problems requires motivated, skilled, and adaptable workers. By combin- ing the reduction of buffers with the devel- opment of these work force characteristics, flexible production systems create the con- ditions under which innovative HR prac- tices are most likely to yield effective eco- nomic performance.
This line of argument is consistent with recent work (Cappelli and Singh 1993; Kogut and Zander 1992; Pfeffer 1994) as- serting that human resources can be a pri- mary source of sustainable competitive ad- vantage for a firm. Employee knowledge about products, processes, and customers that is embedded in routines and social interaction patterns can create organiza-
tional capabilities more difficult to imitate than readily purchased technological capa- bilities.
Focusing on one specific industry con- text, automotive assembly, provides many advantages for testing this argument. Em- pirical work on this topic has often relied on dichotomous measures of HR practices at the establishment level and financial measures of performance at the corporate level. These measures can be quite unreli- able, particularly across industries, and are at different levels of analysis. The assembly plant data set used in this study includes more reliable, context-specific measures of performance and HR practices at a com- mon level of analysis, as well as control variables, such as technology and product complexity, that could affect manufactur- ing performance.
Previous Research
This paper builds on an extensive body of past research on the auto industry in two ways. It explores the role of human re- sources in the "organizational logic" of a production system more deeply than previ- ous descriptive work that contrasts mass and flexible production (for example, WomackJones, and Roos 1990; MacDuffie and Krafcik 1992). Although mass and flexible (or "lean") production systems implicitly require different approaches to managing human resources, Womack et al. did not explain how HR practices are inte- grated into these different production sys- tems, nor did they test the relationship between HR practices and performance. Indeed, the term "lean production" used by Womack et al. appropriately captures the minimization of buffers but neglects the expansion of work force skill and con- ceptual knowledge required for problem- solving under this approach. These "en- riched" human resource capabilities are better described in terms of flexibility.
This paper also encompasses more of the interaction between social and technical aspects of the production system than past industrial relations research (such as Katz, Kochan, and Gobeille 1983; Katz, Kochan,

HR BUNDLES AND MANUFACTURING PERFORMANCE 199
and Weber 1985; Katz, Kochan, and Keefe 1988). The authors of these earlier papers concluded that Quality-of-Work-Life (QWL) activities had little impact on per- formance because QWL had virtually no effect on work organization, process im- provement, or skill development. But they lacked data about the production system to test this hypothesis. The 1988 paper ex- tended the inquiry to the value of teams, finding that teams were negatively associ- ated with performance. However, only plants from a single company were studied, at which the adoption of teams was not linked to broader changes in production policies. Also, these authors did not mea- sure bundles of practices but assessed indi- vidual practices, potentially missing differ- ences between overall HR systems.
The emphasis here on the relationship between the social system and technical features of production is consistent with the tradition of socio-technical systems (STS) theory (Trist and Bamforth 1951; Emery and Thorsrud 1976; Pasmore 1988). My view of this relationship, however, dif- fers considerably from that of STS theory. STS theory characterizes autonomous work teams as an alternative to Taylorist ap- proaches to work organization that is supe- rior in any technical setting. STS organiza- tional designs thus seek to maximize the autonomy of work teams from the con- straints of the technical system, often by adding buffers to the technical system. In contrast, this paper explores the integra- tion of HR practices that seek to expand employee skill and involvement with pro- duction practices that minimize buffers.
For example, at Volvo's celebrated Uddevalla plant, the elimination of the moving assembly line and the introduction of team assembly of an entire vehicle were heralded by some as an appealing alterna- tive to flexible production (Berggren 1992). But as Adler and Cole (1993) have argued, although Uddevalla's emphasis on team autonomy (and the use of buffers of various kinds to protect this autonomy) may have facilitated individual and team learning, it constrained organizational learning and overall system improvement. Although this
paper cannot resolve this debate (Uddevalla was closed in the spring of 1993, in part due to concerns about its economic perfor- mance), it does test a hypothesis-about how buffer reduction coupled with innova- tive HR practices is linked to economic performance-that is counter to STS pre- dictions.
The "Organizational Logic" of Flexible Production:
Integrating Bundles of Practices'
Innovative human resource practices are likely to contribute to improved economic performance only when three conditions are met: when employees possess knowl- edge and skills that managers lack; when employees are motivated to apply this skill and knowledge through discretionary ef- fort; and when the firm's business or pro- duction strategy can only be achieved when employees contribute such discretionary effort (Levine and Tyson 1990; Bailey 1992). I will argue that all three conditions must be met for HR practices to contribute to performance. Skilled and knowledgeable workers who are not motivated are unlikely to contribute any discretionary effort. Motivated workers who lack skills or knowl- edge may contribute discretionary effort with little impact on performance. Even if innovative HR practices generate skilled and motivated workers, the HR system must be integrated with the firm's production strategy for discretionary effort to be ap- propriately channeled toward performance improvement.
The concept of "bundles" of HR prac- tices is important in evaluating whether
"Organizational logic" is a term used by sociolo- gists to describe principles or frameworks for action that indicate preferred directions without dictating particular practices (Useem 1993; Biggart 1991). It can be related to literature in organization theory and economics that examines systemic interrelation- ships 'among organizational practices, using notions of congruence, "fit," configurations, and comple- mentarities (for example, Miller and Friesen 1984; Milgrom and Roberts 1993; Meyer, Tsui, and Hinings 1993, in an Academy of ManagementJournal special issue on "configurational" research).

200 INDUSTRIAL AND LABOR RELATIONS REVIEW
(and how) these conditions can be met. Firms generally organize human resource practices into systems that are consistent with their culture and business strategy (Osterman 1987; Block, Kleiner, Roomkin, and Salsburg 1987). It is the combination of practices in a bundle, rather than indi- vidual practices, that shapes the pattern of interactions between and among managers and employees (Cutcher-Gershenfeld 1991). Thus, research that focuses on the impact of individual HR practices on per- formance may produce misleading results, with a single practice capturing the effect of the entire HR system (Ichniowski, Shaw, and Prennushi 1993).
Furthermore, a bundle of interrelated, overlapping HR practices provides several ways for workers to acquire skills (for ex- ample, off-thejob and on-thejob training, job rotation, problem-solving groups) and multiple incentives to boost motivation (for example, extrinsic rewards such as perfor- mance-based pay and intrinsic rewards from participating in decision-making and good job design). As Hackman (1985) wrote, performance may be "an overdetermined phenomenon, the product of multiple non- independent factors whose influence de- pends in part on the fact that they are redundant." There is now ample empirical support for the bundling or systems view.2
The "organizational logic" of flexible production links together a bundle of manu-
2For example, Weitzman and Kruse (1990) found that most studies of contingent compensation plans showed weak but positive effects on performance, with the strongest effects occurring when contingent pay was combined with some employee participation scheme. Similarly, Levine and Tyson (1990) found that the performance impact of employee participa- tion programs was greatest when participation was substantive, involving changes in how work was done, rather than consultative. Several recent large-sample, cross-industry surveys also have found a positive asso- ciation between bundles of innovative HR practices and various performance measures, including the Columbia Business Unit studies (Ichniowski 1991; Mitchell, Lewin, and Lawler 1990); a study by Huselid (1993) that addressed criticisms of the Columbia studies about response rate, simultaneity, and meth- odology for measuring HR practices; and a two-round survey of Fortune 1000 companies (Lawler, Mohrman, and Ledford 1992).
facturing practices (related to the minimi- zation of buffers) with a bundle of human resource practices (related to the expan- sion of work force skills and motivation).' Each of these bundles is made up of inter- related, internally consistent, and even over- lapping practices. The two bundles are complementary in that they affect separate aspects of a plant's operations and yet mu- tually reinforce each other. Thus, "organi- zational logic" here refers to a systemic property that exerts a powerful pull toward internal consistency within these bundles and a complementary relationship between them. (The degree to which internal con- sistency within bundles and complementar- ities across bundles exists is, of course, a matter for empirical investigation.)
Buffers
Under mass production, disruptions to the production process (sales fluctuations, supply interruptions, equipment break- downs) prevent the realization of econo- mies of scale. Accordingly, buffers such as extra inventories or repair space are added to the production system. These buffers essentially create organizational slack as a reserve against unforeseen contingencies.
But under flexible production, such buff- ers are seen as costly for several reasons. First, the buffers represent a commitment of resources not directly devoted to pro- duction. Inventory buffers in particular are costly to store and handle, and can hinder the move from one product design to another. Most important, buffers can hide production problems. When inven- tory stocks are high, a defective part can simply be scrapped and replaced. But when inventories are very low, as with a Just-in-
3The distinctive "logic" of flexible production in auto assembly emerged from the experiments ofJapa- nese companies in the 1950s and 1960s (Monden 1983; Cusumano 1985; Ono 1988). Although this production system model is grounded in a particular historical context, it appears to be diffusing success- fully to different social and economic contexts (Helper 1991; Florida and Kenney 1991) and thus will be described in terms of its organizational characteris- tics rather than its link toJapan.

HR BUNDLES AND MANUFACTURING PERFORMANCE 201
Time inventory system, a bad part draws immediate attention, and must be dealt with, to prevent the production system from grinding to a halt. Buffers of in-process inventories are kept low and lot sizes are small, so if a problem is discovered by a "downstream" process, there are few defec- tive parts that must be discarded. Shrink- ing the size of the final repair area has a similar effect, since a small area will over- flow quickly if defect levels rise. The mini- mization of buffers serves a cybernetic or feedback function, providing valuable in- formation about production problems (Ono 1988; Schonberger 1982).
Human Resource Capabilities
Historically, under mass production, workers were hired to perform narrowly defined manual tasks requiring little skill, and were viewed as interchangeable parts. Turnover was high, but jobs were set up so any unskilled worker could learn them quickly, minimizing the costs of replacing workers. Absenteeism was high, but buffers of utility workers were established to pro- vide coverage. Motivation was low, but close monitoring by supervisors and effi- ciency wages ensured adequate work effort. Workers were not expected to think on the job, and were in fact discouraged from doing so. The main concern of mass pro- duction managers was to prevent any dis- ruption to the achievement of production quotas, and they developed buffers of vari- ous kinds, in part, as a safeguard against labor troubles (Shimada and MacDuffie 1986).
In contrast, flexible production gives workers a much more central role in the production system. To identify and resolve problems as they appear on the line, work- ers must have both a conceptual grasp of the production process and the analytical skills to identify the root cause of problems. Developing an integrated conception of the production system requires that work- ers directly encounter problems, through the decentralization of production respon- sibilities such as quality inspection, equip- ment maintenance, job specification, and
statistical process control (SPC) from spe- cialized inspectors and engineers to shop- floor teams. Developing the skills for this problem-solving requires a variety of multiskilling practices, including extensive off- and on-the-job training, a few broadjob classifications, allowing job rotation within and across teams, and "off-line" group prob- lem-solving activities (for example, em- ployee involvement groups or quality circles).
The multiple skills and conceptual knowl- edge developed by the work force under flexible production are of little use unless workers are motivated to contribute men- tal as well as physical effort. Workers will only contribute their discretionary effort to problem-solving if they believe that their individual interests are aligned with those of the company, and that the company will make a reciprocal investment in their well- being. Thus, flexible production is charac- terized by such "high commitment" human resource policies as employment security, compensation that is partially contingent on performance, and a reduction of status barriers between managers and workers. The company investment in building worker skills also contributes to this "psychological contract" of reciprocal commitment (Cole 1979; Dore 1992).
The Link Between Buffers and Human Resources
The complementarity of policies on buff- ers and human resources is critical to the "organizational logic" of mass versus flex- ible production.4 Under mass production, the use of buffers to create stable condi- tions for high-volume production, under which all inputs can be optimized for great-
4This perspective is supported by cross-industry research that finds statistically significant links be- tween innovative HR practices and manufacturing policies such asJust-in-Time inventory systems (JIT) and total quality management (Snell and Dean 1992; Ebrahimpour and Lee 1988). While these authors argue that the integration of these manufacturing policies with innovative HR practices leads to im- proved performance, they lack performance mea- sures to test this claim.

202 INDUSTRIAL AND LABOR RELATIONS REVIEW
est efficiency, is complemented by the view of production workers as interchangeable parts. Workers who were not expected to think and whose expected contribution of effort could be obtained despite their low skill and motivation were a perfect match for a technically optimized production sys- tem that was not supposed to stop and in which modifications were to be kept to a minimum.
For flexible production, the link between the minimization of buffers and the devel- opment of human capabilities is driven by the philosophy of continuous improvement, known in Japan as "kaizen." From the perspective of kaizen, problems are oppor- tunities for improvement (Imai 1986). It is this philosophy that sustains the organization's willingness to accept the vulnerability of "lean" buffers and the pres- sure to deal with problems as they become visible-even if this means stopping the production line, unthinkable under mass production. This philosophy also guides the development of problem-solving skills in the work force. In a sense, flexible production transfers the ability to cope with contingencies from the technical sys- tem, where buffers provide mass produc- tion systems with 'just in case" protection, into the human resource system, which deals with the unexpected by developing a capa- bility for learning (MacDuffie 1991; Adler 1992; Nishiguchi 1993).
Another critical difference in philoso- phy relates to production system outcomes. The conventional wisdom of manufactur- ing under a mass production "logic" as- sumes a necessary tradeoff between the goals of productivity and quality. The use of buffers is justified on productivity grounds, because it protects against disrup- tions to high-volume production, and be- cause a certain level of quality defects is expected. By contrast, under flexible pro- duction, productivity (minimization of ef- fort) and quality (minimization of defects) are regarded as complementary goals.
This characteristic of flexible produc- tion is also linked to the reduction of buff- ers and the development of problem-solv- ing capabilities. With no buffers present,
any defect can bring the entire system to a standstill, so there is a strong incentive to drive quality defects toward zero. Stopping the line to deal with a quality problem can ultimately boost uptime and productivity if the problem can be traced back to its root cause and eliminated.
Problem-solving efforts are not limited to quality matters. Under flexible produc- tion, workers and engineers also apply their problem-solving abilities to the task of im- proving equipment performance over time-a process identified by Monden (1983) as "giving wisdom to the machine." As a result, production technology need not be automatically subject to decay and depreciation but can actually appreciate in value over time. The same principle ap- plies to all job specifications. Although the basic structure of production jobs is deter- mined by engineers, teams of production workers have responsibility for developing, recording, and modifying job specifica- tions-a process known as "standardized work." These specifications are as detailed as any industrial engineering time study, but with the crucial difference that work- ers, rather than managers or engineers, take charge of their revision. (Adler 1993; Cole 1992.)
Thus the problem-solving capabilities that arise from linking lean buffers with enriched human resources can help boost performance by improving the efficiency with which the root causes of quality prob- lems are identified, by helping technology to be used more effectively, and by refining job specifications.
Operationalizing the Organizational Logic: Measurement Issues
The discussion above suggests that bundles of practices should be measured to capture the "organizational logic" of a pro- duction system. This raises four important measurement questions: (1) What consti- tutes a "bundle"? (2) How should practices in a bundle be combined? (3) How can a bundle be empirically validated? and (4) How should the relationship between dif- ferent bundles of practices be specified?
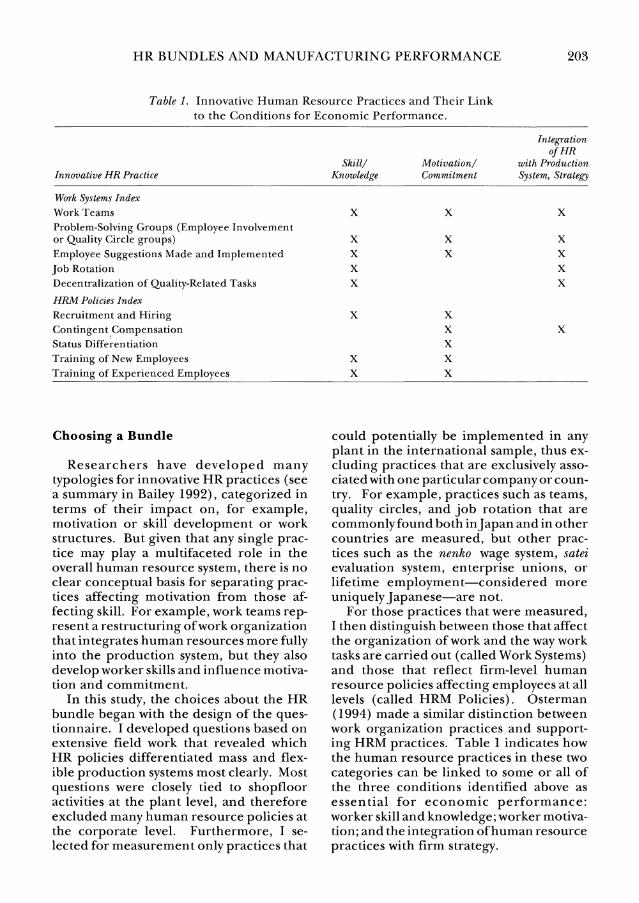
HR BUNDLES AND MANUFACTURING PERFORMANCE 203
Table 1. Innovative Human Resource Practices and Their Link to the Conditions for Economic Performance.
Integration of HR
Skill! Motivation/ with Production Innovative HR Practice Knowledge Commitment System, Strategy
Work Systems Index Work Teams X X X Problem-Solving Groups (Employee Involvement or Quality Circle groups) X X X Employee Suggestions Made and Implemented X X X Job Rotation X X Decentralization of Quality-Related Tasks X X
HRM Policies Index Recruitment and Hiring X X Contingent Compensation X X Status Differentiation X Training of New Employees X X Training of Experienced Employees X X
Choosing a Bundle
Researchers have developed many typologies for innovative HR practices (see a summary in Bailey 1992), categorized in terms of their impact on, for example, motivation or skill development or work structures. But given that any single prac- tice may play a multifaceted role in the overall human resource system, there is no clear conceptual basis for separating prac- tices affecting motivation from those af- fecting skill. For example, work teams rep- resent a restructuring of work organization that integrates human resources more fully into the production system, but they also develop worker skills and influence motiva- tion and commitment.
In this study, the choices about the HR bundle began with the design of the ques- tionnaire. I developed questions based on extensive field work that revealed which HR policies differentiated mass and flex- ible production systems most clearly. Most questions were closely tied to shopfloor activities at the plant level, and therefore excluded many human resource policies at the corporate level. Furthermore, I se- lected for measurement only practices that
could potentially be implemented in any plant in the international sample, thus ex- cluding practices that are exclusively asso- ciated with one particular company or coun- try. For example, practices such as teams, quality circles, and job rotation that are commonly found both injapan and in other countries are measured, but other prac- tices such as the nenko wage system, satei evaluation system, enterprise unions, or lifetime employment-considered more uniquelyJapanese-are not.
For those practices that were measured, I then distinguish between those that affect the organization of work and the way work tasks are carried out (called Work Systems) and those that reflect firm-level human resource policies affecting employees at all levels (called HRM Policies). Osterman (1994) made a similar distinction between work organization practices and support- ing HRM practices. Table 1 indicates how the human resource practices in these two categories can be linked to some or all of the three conditions identified above as essential for economic performance: worker skill and knowledge; worker motiva- tion; and the integration of human resource practices with firm strategy.

204 INDUSTRIAL AND LABOR RELATIONS REVIEW
Combining Practices in a Bundle
Implicit in the notion of a "bundle" is the idea that practices within bundles are inter- related and internally consistent, and that "more is better" with respect to the impact on performance, because of the overlap- ping and mutually reinforcing effect of multiple practices. While the combined impact of practices in a bundle could be specified in a variety of ways, two simple alternatives are an additive approach and a multiplicative approach. Choosing between these two approaches poses the question of whether the bundle as a whole should be viewed as equal to or greater than the sum of the parts.
For both statistical and conceptual rea- sons, I use the additive approach to com- bining practices. Statistically, the additive combination of practices has the desirable property that the sum of normally distrib- uted variable scores is still normally distrib- uted, which is not true for the multiplica- tive product. Conceptually, a multiplica- tive relationship implies that if any single organizational practice is not present, the "bundle" score (and effect) should be zero. This is too rigid a criterion for a bundle, given that there is no precise theoretical basis for specifying which practices signify the "organizational logic." Although prac- tices in a bundle are expected to be interre- lated, the absence of a particular practice will not eradicate the effect of all other practices, but will weaken the net effect of the bundle. (Osterman [1994] takes this approach; see p. 176.)
Validating a Bundle
Three statistical procedures-each with advantages and disadvantages-can be used to validate a conceptually defined "bundle": reliability analysis, factor analysis, and clus- ter analysis. Reliability analysis can evalu- ate the intercorrelations among variables grouped together in a bundle-an advan- tage if the conceptual basis for categorizing practices is strong, and a disadvantage if it is not. Factor analysis is best suited to identifying the interrelationships among a set of items in a scale, all designed to mea-
sure the same construct. It is less appropri- ate for assessing a "bundle," which is not a scale but an index (DeVellis 1991) consist- ing of a set of interrelated variables, each of which represents a different construct. Cluster analysis groups observations (in this case plants) that lie in close proximity in multidimensional space for a given set of variables. Since different clustering algo- rithms produce different clusters and all clustering algorithms will find clusters of some kind, it is important to test different cluster solutions and choose those that are most statistically distinct (Everitt 1980; Aldenderfer and Blashfield 1984; Ulrich and McKelvey 1990).
Examining the Interaction Between Bundles
The interaction between bundles can also be modeled as either an additive or multiplicative relationship. Here, I argue that the multiplicative assumption makes more sense, because the bundles are con- ceptualized as complementary. The "orga- nizational logic" argument claims that poli- cies to reduce buffers will only be effective in the presence of HR policies that develop problem-solving skills and motivation in the work force, and that either set of poli- cies alone will be ineffective. A multiplica- tive relationship among the three bundles of practices (Use of Buffers, Work Systems, and HRM Policies) will be captured in two ways here-with an overall Production Or- ganization Index (POI) that is the product of scores for the three bundles, and with two-way and three-way multiplicative inter- action terms. In addition, I will compare the multiplicative POI with an additive POI that averages the three indices to assess the assumption about interrelationships among bundles.
Methodology Sample
The International Assembly Plant Study was sponsored by the International Motor Vehicle Program (IMVP) at M.I.T.5 The
5The International Motor Vehicle Program (IMVP) was a five-year research program, from 1985 to 1990,
HR BUNDLES AND MANUFACTURING PERFORMANCE 205
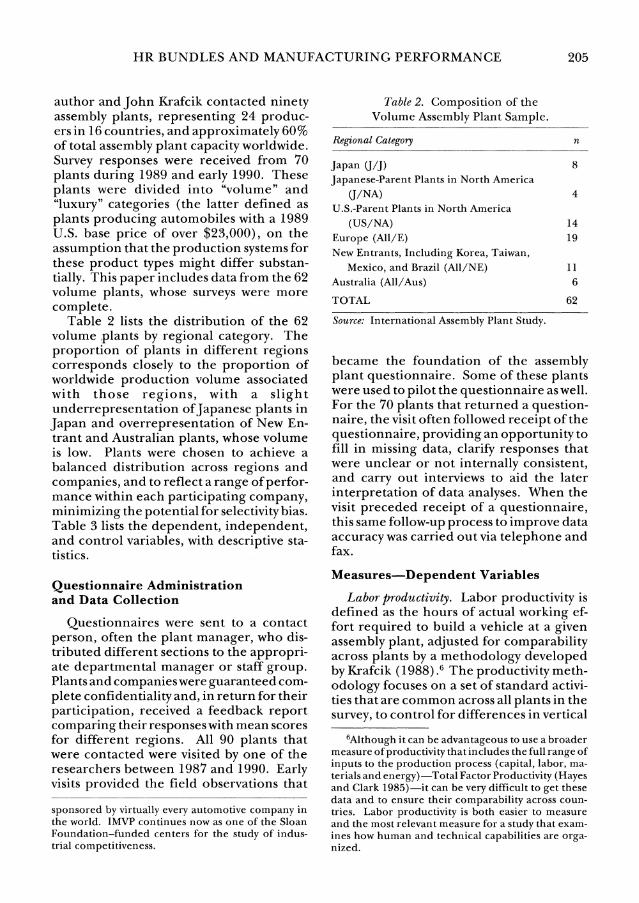
author and John Krafcik contacted ninety assembly plants, representing 24 produc- ers in 16 countries, and approximately 60% of total assembly plant capacity worldwide. Survey responses were received from 70 plants during 1989 and early 1990. These plants were divided into "volume" and "luxury" categories (the latter defined as plants producing automobiles with a 1989 U.S. base price of over $23,000), on the assumption that the production systems for these product types might differ substan- tially. This paper includes data from the 62 volume plants, whose surveys were more complete.
Table 2 lists the distribution of the 62 volume plants by regional category. The proportion of plants in different regions corresponds closely to the proportion of worldwide production volume associated with those regions, with a slight underrepresentation ofJapanese plants in Japan and overrepresentation of New En- trant and Australian plants, whose volume is low. Plants were chosen to achieve a balanced distribution across regions and companies, and to reflect a range of perfor- mance within each participating company, minimizing the potential for selectivity bias. Table 3 lists the dependent, independent, and control variables, with descriptive sta- tistics.
Questionnaire Administration and Data Collection
Questionnaires were sent to a contact person, often the plant manager, who dis- tributed different sections to the appropri- ate departmental manager or staff group. Plants and companies were guaranteed com- plete confidentiality and, in return for their participation, received a feedback report comparing their responses with mean scores for different regions. All 90 plants that were contacted were visited by one of the researchers between 1987 and 1990. Early visits provided the field observations that
sponsored by virtually every automotive company in the world. IMVP continues now as one of the Sloan Foundation-funded centers for the study of indus- trial competitiveness.
Table 2. Composition of the Volume Assembly Plant Sample.
Regional Category n
Japan (J/J) 8 Japanese-Parent Plants in North America
(J/NA) 4 U.S.-Parent Plants in North America
(US/NA) 14 Europe (All/E) 19 New Entrants, Including Korea, Taiwan,
Mexico, and Brazil (All/NE) 11 Australia (All/Aus) 6
TOTAL 62
Source: International Assembly Plant Study.
became the foundation of the assembly plant questionnaire. Some of these plants were used to pilot the questionnaire as well. For the 70 plants that returned a question- naire, the visit often followed receipt of the questionnaire, providing an opportunity to fill in missing data, clarify responses that were unclear or not internally consistent, and carry out interviews to aid the later interpretation of data analyses. When the visit preceded receipt of a questionnaire, this same follow-up process to improve data accuracy was carried out via telephone and fax.
Measures-Dependent Variables
Labor productivity. Labor productivity is defined as the hours of actual working ef- fort required to build a vehicle at a given assembly plant, adjusted for comparability across plants by a methodology developed by Krafcik (1988) .6 The productivity meth- odology focuses on a set of standard activi- ties that are common across all plants in the survey, to control for differences in vertical
6Although it can be advantageous to use a broader measure of productivity that includes the full range of inputs to the production process (capital, labor, ma- terials and energy) -Total Factor Productivity (Hayes and Clark 1985)-it can be very difficult to get these data and to ensure their comparability across coun- tries. Labor productivity is both easier to measure and the most relevant measure for a study that exam- ines how human and technical capabilities are orga- nized.

206 INDUSTRIAL AND LABOR RELATIONS REVIEW
Table 3. Descriptive Statistics: Dependent and Independent Variables. (n = 62 Except for Quality, for Which n = 46)
Variable Name Mean S.D. Description
Dependent Variables Productivity 33.1 12.4 Labor productivity, defined as hours of
actual effort required to build a vehicle Quality 78.4 31.2 Consumer-perceived quality, defined as
defects per 100 vehicles, from J.D. Power
Independent Variables Production Organization Index 45.9 20 Index capturing "organizational logic" of
the production system; simple average of the three component indices listed below
Use of Buffers 56.1 23.9 The degree to which production operations are buffered against potential disruptions
Work Systems 31.9 23.3 Work structures and policies that govern shop floor production activity
HRM Policies 47.3 26.0 Organization-wide HR policies that affect employee commitment and motivation
Total Automation 24.0 14.0 Overall automation stock, defined as % of direct production steps that are automated
Production Scale 904.4 639.9 Average number of vehicles built during a standard, non-overtime day
Model Mix Complexity 30.9 21.3 Mix of different platforms and models at a plant
Parts Complexity 56.5 23.5 Variation in the number of wire harnesses, exterior colors, engine/transmission combinations; number of assembly area parts; percentage of common parts across vehicles; and number of suppliers of assembly area parts
Product Design Age 4.6 3.2 Weighted average number of years since a major model introduction for each product
Source: International Assembly Plant Study.
integration. Since a large vehicle requires more effort to assemble than a small ve- hicle, adjustments are made to standardize for vehicle size. Adjustments are also made to standardize for the number of welds, which differs across designs and therefore affects headcount in the body shop.
Labor hours are also adjusted for absen- teeism, for two reasons: (1) the study fo- cuses on the labor effort involved in build- ing vehicles (not total labor costs) and does not include the additional employees hired to cover absenteeism; and (2) absenteeism rates may be influenced significantly by national and social welfare policies that are not under the control of plant manage- ment. This is a conservative adjustment, given that absenteeism is lowest in the coun-
try with plants having the highest produc- tivity (Japan), moderate in the United States, where productivity is intermediate, and highest in countries whose productiv- ity is worst in the sample (various European and newly industrialized countries).
Quality. The quality measure is derived from the 1989 survey of new car buyers in the United States, carried out byJ. D. Power. The variable measures the number of de- fects per 100 vehicles, and is adjusted to reflect only those defects that an assembly plant can affect, that is, omitting defects related to the engine or transmission, while emphasizing defects related to the fit and finish of body panels, paint quality, and the integrity of electrical connections (Krafcik 1988).
HR BUNDLES AND MANUFACTURING PERFORMANCE 207
Measures-Independent Variables
Production organization measures. To operationalize the "organizational logic" of flexible and mass production systems, I developed three component indices-Use of Buffers, Work Systems, HRM Policies- and an overall Production Organization Index. The variables included in these indices reflect both choices about what to include in the assembly plant questionnaire and statistical tests aimed at boosting the internal reliability of each index.
Each of the three component indices is composed of multiple variables, described below. All variables are standardized by conversion to z-scores before being addi- tively combined to form indices. Each vari- able in an index receives equal weight, because I felt that there was no clear con- ceptual basis for assigning differential weights. For ease of interpretation, I apply a linear transformation to the summed z- scores for each component index, such that 0 is the plant with the lowest score in the sample and 100 is the plant with the highest score. The validation of these indi- ces is described in the next section.
(i) Use of Buffers. This index measures a set of production practices that are in- dicative of overall production philosophy with respect to buffers (for example, in- coming and work-in-process inventory), with a low score signifying a "buffered" system and a high score signifying a "lean" system. It consists of three items:
- the space (in square feet) dedicated to final assembly repair, as a percentage of total assembly area square footage.
- the average number of vehicles held in the work-in-process buffer between the paint and assembly areas, as a percentage of one shift production.
- the average level of inventory stocks, in days for a sample of eight key parts, weighted by the cost of each part.
(ii) Work Systems. This index captures how work is organized, in terms of both formal work structures and the allocation of work responsibilities, and the participa- tion of employees in production-related problem-solving activity. A low score for this variable indicates a work system with a
narrow division of labor that is "specializ- ing" in orientation, and a high score indi- cates a "multiskilling" orientation. It con- sists of six items:
- the percentage of the work force in- volved in formal work teams.
- the percentage of the work force in- volved in employee involvement groups.
- the number of production-related sug- gestions received per employee.
- the percentage of production-related suggestions implemented.
- the extent of job rotation within and across teams (O = no job rotation, 1 = infrequent rotation within teams, 2 = frequent rotation within teams, 3 = fre- quent rotation within teams and across teams of the same department, 4 = fre- quent rotation within teams, across teams, and across departments).
- the degree to which production workers carry out quality tasks (O = functional specialists responsible for all quality re- sponsibilities; 1, 2, 3, 4 = production workers responsible for 1, 2, 3, or 4 of the following tasks: inspection of in- coming parts, work-in-process, finished products; gathering Statistical Process Control data).
(iii) HRM Policies. This index measures a set of policies that affects the "psychologi- cal contract" between the employee and the organization, and hence employee motivation and commitment. A low score for this variable indicates a "low commit- ment" set of HRM policies and a high score indicates "high commitment" policies. It consists of four items:
- the hiring criteria used to select employ- ees in three categories: production workers, first line supervisors, and engi- neers (the sum of rankings of the impor- tance of various hiring criteria for these three groups of employees, with low scores for criteria that emphasize the fit between an applicant's existing skills and job requirements ["previous expe- rience in a similarjob"] and high scores for criteria that emphasize openness to learning and interpersonal skills ["a will- ingness to learn new skills" and "ability to work with others"]).
- the extent to which the compensation

208 INDUSTRIAL AND LABOR RELATIONS REVIEW
system is contingent on performance (0 = no contingent compensation; I = com- pensation contingent on corporate performance; 2= compensation contin- gent on plant performance, for manag- ers only; 3 = compensation contingent on plant performance or skills acquired, production employees only; and 4 = com- pensation contingent on plant perfor- mance, all employees).
- the extent to which status barriers be- tween managers and workers are present (0 = no implementation of policies that break down status barriers and 1, 2, 3, 4 = implementation of 1, 2, 3, or 4 of these policies: common uniform, common cafeteria, common parking, no ties).
- the level of training provided to newly hired production workers, supervisors, and engineers in the first six months of employment (0 = up to one week of training for newly hired production workers, first line supervisors, and engi- neers; 1 = one to two weeks of training for newly hired employees in all three groups; 2 = two to four weeks of training for newly hired employees in all three groups; and 3 = over four weeks of training for newly hired employees in all three groups).
- the level of ongoing training provided to experienced production workers, su- pervisors, and engineers (0 = 0-20 hours of training for experienced production workers, first line supervisors, and engi- neers per year; 1= 21-40 hours of train- ing per year for all 3 groups; 2 = 41-80 hours of training per year; and 3 = over 80 hours of training per year).
(iv) Production Organization Index (POI). This index is constructed, as de- scribed above, in both an additive form, as a simple average of the three component indices, and a multiplicative form, as the product of component indices. For both forms, a low POI score indicates a tradi- tional mass production system and a high POI score indicates a flexible production system.
Measures-Control Variables
Total automation. The main technology variable, the automated percentage of di- rect production steps, captures the level of
both flexible and fixed automation.7 For each functional area, a proxy measure for direct production activities was developed, as described in Table 4. Then a weighted average level of automation for the plant was calculated, based on the amount of direct labor each functional area requires in an average unautomated plant. Since the index measures the percentage of total direct production steps that are automated, it is expected to correlate with the produc- tivity measure, which includes the labor hours required for non-automated direct production steps as well as indirect and salaried hours.
Plant scale. This variable is defined as the average number of vehicles built during a standard, non-overtime day, adjusted for capacity utilization. Overtime is not in- cluded in either production levels or hours worked, which adjusts for overcapacity situ- ations. In undercapacity situations, I dis- tinguished between short-term and long- term undercapacity. When undercapacity was short-term, I asked for data from the most recent period of full capacity opera- tion. When undercapacity was long-term, I assumed that plants would have been able to adjust labor inputs to that capacity level and regarded it as the effective capacity of the plant.
Model mix complexity. This measure is based on the mix of different products and product variants produced in the plant. It includes the number of distinct platforms, models, body styles, drive train configura- tions (front-wheel versus rear-wheel drive), and export variations (right-hand versus
7Another technology variable, the Robotic Index, measures the number of weld, paint, and assembly robots (defined as programmable with at least three axes of motion) used in the plant, adjusted for plant scale. This measure is a better proxy for the quality and vintage of the capital equipment in a plant than the "total automation" variable, since the robots, by definition, are flexible rather than fixed automation and most investment in robotics is relatively recent. Since both technology variables produced similar results when used separately in regression analyses, I only report results using "total automation," which is the more comprehensive of the two measures.

HR BUNDLES AND MANUFACTURING PERFORMANCE 209
Table 4. Measurement of Automated Percentage of Direct Production Steps.
Functional Area Proxy Measure of Automated Production Steps
Body Welding Percentage of spot and seam welds applied by automation Paint: Joint Sealing Percentage of total length of joint sealer applied by automation Paint: Primer/Color Percentage of total square inches of paint applied by automation Assembly Number of automated assembly tasks, weighted by labor content
left-hand steering), weighted according to a scheme developed by Krafcik (1988). The measure includes a correction factor to account for the number of assembly lines and body shops in the plant. For instance, a plant with two parallel assembly lines producing a single model on each is given the same model mix score as that of an- other plant that builds one model with one assembly line. The measure is scaled to yield a score from 0 to 100, where 0 repre- sents the plant with the least model mix complexity and 100 the plant with the most model mix complexity.
Parts complexity. This measure is com- piled from two subgroups of variables. The first subgroup includes three measures of parts or component variation-the num- ber of engine/transmission combinations, wire harnesses, and exterior paint colors- that affect the sequencing of vehicles, the variety of required sub-assemblies, and material and parts flow through the system. The second subgroup includes three mea- sures-the number of total parts to the assembly area, the percentage of common parts across models, and the number of suppliers to the assembly area-that affect both the logistics of material and parts flow and the administrative/coordination re- quirements for dealing with suppliers. All these variables are scored on a 1-6 scale, where 1 is the lowest and 6 the highest complexity level. They are additively com- bined and the resulting index is rescaled from 0 to 100, as above.
Product design age. This variable is de- fined as the weighted average number of years since a major model change introduc- tion for each of the products currently being built at each plant. This measure is a partial proxy for manufacturability in the
assembly area, under the assumption that products designed more recently are more likely than older products to have been conceived with ease of assembly in mind.8
Model Specification
For the regression analyses, I chose to log all dependent and independent vari- ables, conforming to the common practice of using a Cobb-Douglas specification for the production function. Cobb-Douglas is attractive because it generates coefficients and test statistics that are easy to interpret and its assumption of the substitutability of labor and capital (that is, that different mixes of labor and capital, but neither fac- tor exclusively, can achieve the same out- put quantity) is a good fit to the auto assem- bly plant context.
These data do not support the use of the precise Cobb-Douglas specification, how- ever, primarily because labor hours, the usual measure of labor inputs in Cobb- Douglas, is an integral part of the left-hand- side productivity measure. The productiv-
8This assumption must be qualified. Newer de- signs may capture a time trend toward more manufacturable designs across companies, but given wide differences in product development capabilities (Clark and Fujimoto 1991), two designs of the same age across different companies are not likely to be equally manufacturable. It is more plausible that a company with a rapid product development cycle (whose products will be younger, on average) achieves better coordination between design and manufactur- ing-and thus more manufacturable designs-than companies with long development cycles. While older designs, by moving down the learning curve, could be associated with fewer hours per car, most evidence suggests that the benefits of more manufacturable designs outweigh learning curve gains (Womack, Jones, and Roos 1990).
210 INDUSTRIAL AND LABOR RELATIONS REVIEW
ity measure in most Cobb-Douglas specifi- cations is a financial metric-the ratio of outputs to inputs where both are expressed in dollars-whereas here productivity is the physical ratio of inputs to outputs (hours of effort and vehicles built). But the central assumption of Cobb-Douglas-that the pro- duction function is best modeled as a mul- tiplicative relationship among interrelated inputs-is embodied in this specification.
There is also precedent for including a variable that affects how capital or labor inputs are utilized. The constant elasticity of substitution (CES) model (of which Cobb-Douglas is a specific case) includes an "efficiency" parameter that affects both inputs. Industrial relations researchers commonly include factors that affect labor inputs (for example, unionization) but not capital (Brown and Medoff 1978; Clark 1980). The production organization indi- ces will play this role here.
Thus the "base case" regression equa- tions, including all control variables but not the production organization indices, will be:
(1) Log (Productivity) = Log Total Automation + Log Product Design Age + Log Scale + Log Model Mix Complexity + Log Parts Complexity
and
(2) Log (Quality) = Log Total Automation + Log Product Design Age + Log Scale + Log Model Mix Complexity + Log Parts Complexity
Logged versions of the three component indices and the overall Production Organi- zation index will be added, one at a time, to see what they contribute to explaining per- formance beyond the "base case" variables. Finally, interaction effects among the three component indices will be considered, first by adding all two-way interaction terms, then by adding the three-way interaction term. The "base case" equation for testing the interaction terms will consist of the control variables plus all the component indices. The model produces similar re- sults with different functional forms, such as all unlogged variables.
One final data transformation is war- ranted. Five plants in the sample have missing values for some variables in the Work Systems and HRM Policies indices, but have complete data for all other vari- ables. Preserving degrees of freedom is crucial for these analyses, given the high number of variables to be entered in the regression equation and the relatively small sample size. Therefore, following Maddala (1977), I substitute the sample mean for the two missing indices for these plants (8% of the sample) so they are not ex- cluded from the regression analyses.
Empirical Results: Validating the Bundling of Practices
Reliability Tests
Reliability tests for the three component indices reveal a significant intercorrelation among the included variables. The Cronbach's standardized alpha score is 0.63 for the Use of Buffers index, 0.70 for the HRM Policies index, and 0.81 for the Work Systems index. The three component indi- ces are also highly intercorrelated-for Use of Buffers and Work Systems, r = 0.62; for the Use of Buffers and HRM Policies, r = 0.48; and for Work Systems and HRM Poli- cies, r = 0.62. For the Production Organiza- tion Index, the Cronbach's standardized alpha is 0.80.
Factor Analysis When all variables making up the three
component indices were factor analyzed, strong factors did emerge, but each factor combined variables involving Buffers with some Work Systems or HRM Policy vari- ables in ways that were not readily inter- pretable. As a result, these factors were not used, since the indices can be more readily justified conceptually and are validated by the other two methods.
Cluster Analysis The final validation step involved the
examination of clusters generated from values of the three component indices. Analyses comparing various clustering

HR BUNDLES AND MANUFACTURING PERFORMANCE 211
Table 5. Means of Production Organization Variables and Indices Across Clusters of Plants.
Sample MassProd Transition FlexProd Variable (n = 57) (n = 29) (n = 14) (n = 14) F
Repair Area (sq. feet as % of assembly area) 10.4% 13.7% 9.1% 4.8% 15.8*** Paint-Assembly Buffer (% of 1-shift production) 23.3% 29.7% 18.7% 14.6% 3.9** Inventory Level (days' supply for 8 parts) 2.1 2.8 2.1 0.63 18.7*** % Work Force in Teams 22.4% 5.0% 10.4% 70.2% 38.6*** % Work Force in EI, QC Groups 32.5% 16.5% 20.9% 77.4% 17.8*** Suggestions per Employee 9.2 0.24 0.33 36.5 15.3*** % Suggestions Implemented 36.3% 25.5% 23.8% 72.0% 16.8*** Job Rotation Index (0 = none; 4 = extensive) 1.8 1.2 1.9 3.0 20.8*** Quality Control at Shop Floor (0 = none; 4 = extensive) 3.1 2.6 2.9 4.5 2.8* Hiring Criteria (Low = match past experience to job; High = interpersonal skills, willingness to learn new skills) 35.1 32.7 35.8 39.4 12.7*** Training New Hires (0 = Low; 3 = High) 1.6 1.0 1.9 2.4 13.1* Training Experienced Employees (0 = Low; 3 = High) 1.4 0.9 1.6 2.1 7.9*** Contingent Compensation (0 = none; 4 = based on plant performance) 1.6 0.72 2.2 3.0 20.0*** Status Differentiation (0 = extensive; 4 = little) 1.9 1.1 2.0 3.4 17.7***
Use of Buffers Index 58.7 44.7 62.7 83.5 28.3*** Work Systems Index 32.0 18.8 24.3 66.7 59.4*** HRM Policies Index 47.3 26.5 55.9 81.8 73.4***
*Statistically significant at the .10 level; **at the .05 level; ***at the .01 level. Source: International Assembly Plant Study.
methods (not reported here) showed that the Euclidean measure for distance between cluster centroids and the Within Group Average method of forming clusters pro- duced the most statistically distinct clus- ters. These methods were used to derive two-, three-, and four-cluster solutions. Means from the three-cluster solution are presented here, since they can be readily interpreted. Clusters 1 and 3, which repre- sent the endpoints of the production orga- nization continuum, are labeled "MassProd" and "FlexProd," respectively, and Cluster 2 is regarded as an intermediate group, here labeled "Transition."
Table 5 contains means across these three clusters for all of the variables making up the Production Organization Index and then for each component index. These means are based on the original, unstandardized scale for each variable, for easier interpretability. All means differ
substantially across clusters, for both the individual variables and all three compo- nent indices, and nearly all the F-tests are statistically significant at the .01 level.
Empirical Results: Production Organization and Manufacturing
Performance
Correlations The simple correlations between the pro-
duction organization indices and perfor- mance are relatively high, and similar. For Use of Buffers, Work Systems, and HRM Policies, the correlations with productivity are, respectively, r = -.49, r =-.50, and r = -.50, with p < .01 for all three. The corre- sponding correlations with quality are r = - .49, r = -.43, and r = -.67, again with p < .01. The correlationswith performance are negative because of the way outcomes are measured lower hours per vehicle and
212 INDUSTRIAL AND LABOR RELATIONS REVIEW
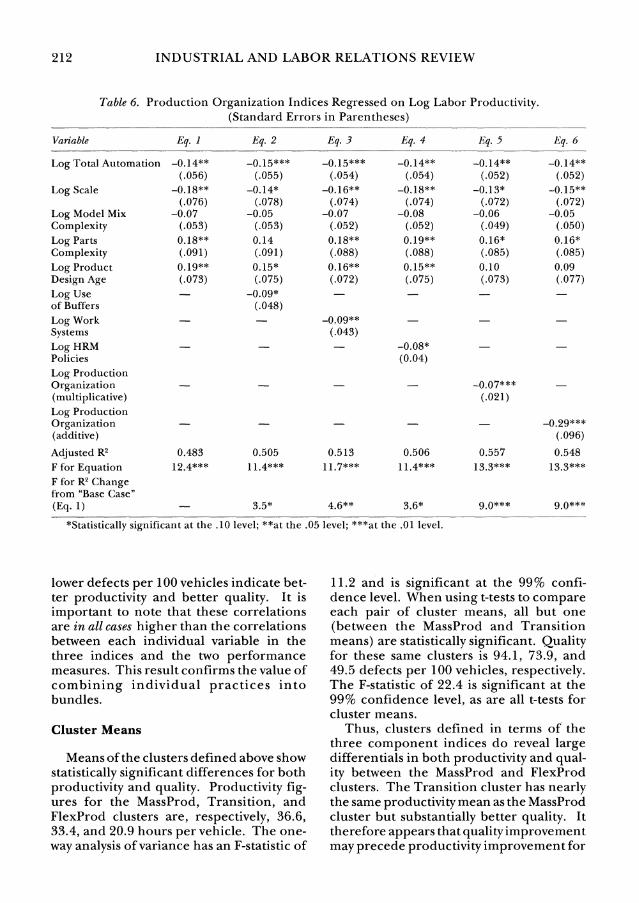
Table 6. Production Organization Indices Regressed on Log Labor Productivity. (Standard Errors in Parentheses)
Variable Eq. I Eq. 2 Eq. 3 Eq. 4 E, q. 5 E q. 6
Log Total Automation -0.14** -0.15*** -0.15*** -0.14** -0.14** -0.14** (.056) (.055) (.054) (.054) (.052) (.052)
Log Scale -0.18** -0.14* -0.16** -0.18** -0.13* -0.15** (.076) (.078) (.074) (.074) (.072) (.072)
Log Model Mix -0.07 -0.05 -0.07 -0.08 -0.06 -0.05 Complexity (.053) (.053) (.052) (.052) (.049) (.050) Log Parts 0.18** 0.14 0.18** 0.19** 0.16* 0.16* Complexity (.091) (.091) (.088) (.088) (.085) (.085) Log Product 0.19** 0.15* 0.16** 0.15** 0.10 0.09 Design Age (.073) (.075) (.072) (.075) (.073) (.077) Log Use -0.09* of Buffers (.048) Log Work -0.09** Systems (.043) Log HRM -0.08* Policies (0.04) Log Production Organization _ -0.07*** (multiplicative) (.021) Log Production Organization 02- 9* ** (additive) (.096)
Adjusted R 2 0.483 0.505 0.513 0.506 0.557 0.548 F for Equation 12.4*** 11.4*** 11.7*** 11.4*** 13.3*** 13.3*** F for R2 Change from "Base Case" (Eq. 1) 3.5* 4.6** 3.6* 9.0*** 9.0***
*Statistically significant at the .10 level; **at the .05 level; ***at the .01 level.
lower defects per 100 vehicles indicate bet- ter productivity and better quality. It is important to note that these correlations are in all cases higher than the correlations between each individual variable in the three indices and the two performance measures. This result confirms the value of combining individual practices into bundles.
Cluster Means
Means of the clusters defined above show statistically significant differences for both productivity and quality. Productivity fig- ures for the MassProd, Transition, and FlexProd clusters are, respectively, 36.6, 33.4, and 20.9 hours per vehicle. The one- way analysis of variance has an F-statistic of
11.2 and is significant at the 99% confi- dence level. When using t-tests to compare each pair of cluster means, all but one (between the MassProd and Transition means) are statistically significant. Quality for these same clusters is 94.1, 73.9, and 49.5 defects per 100 vehicles, respectively. The F-statistic of 22.4 is significant at the 99% confidence level, as are all t-tests for cluster means.
Thus, clusters defined in terms of the three component indices do reveal large differentials in both productivity and qual- ity between the MassProd and FlexProd clusters. The Transition cluster has nearly the same productivity mean as the MassProd cluster but substantially better quality. It therefore appears that quality improvement may precede productivity improvement for

HR BUNDLES AND MANUFACTURING PERFORMANCE 213
plants making a transition to flexible pro- duction.
Productivity Regressions
Table 6 contains the first hierarchical regression analysis. Equation 1 contains the "base case" variables regressed on log labor productivity. All of the control vari- ables are statistically significant except for model mix complexity. As expected, scale and automation have negative signs, that is, the higher the scale of production and level of automation, the lower the hours per vehicle. Product design age and parts complexity have positive signs, signifying that an older design and more complexity are linked to more hours per vehicle.
Equations 2, 3, and 4 add the three indi- ces of the production organization index, one at a time, to the "base case" variables. All three indices are statistically significant. Furthermore, they all have approximately the same effect size, with standardized co- efficients (not shown) ranging from -.186 to -.196. In all three equations, the ad- justed R2 is higher than the "base case" and the increase is statistically significant. Thus each index has the hypothesized relation- ship to productivity-"leaner" buffers, more multiskilling work systems, and more "high commitment" HR policies are each associ- ated with fewer hours per vehicle.
Equation 5 then adds the full Production Organization Index (POI), in its multipli- cative form, to the base case variables. The index is statistically significant at the 99% confidence level, with a standardized coef- ficient of -.32 (not shown), substantially higher than coefficients for the three sepa- rate indices. The increase in R2 is also a statistically significant change, suggesting substantial interaction effects. Results when using the additive form of the POI, in equa- tion 6, are virtually identical, providing little basis for supporting one form over the other.
Interaction effects are tested in Table 7. Equation 1 provides the base case, with all control variables and all three component indices. Equation 2 adds the two-way inter- action terms (Buffers x WorkSys; Buffers x
Table 7. Production Organization Interaction Terms Regressed on Log Labor Productivity.
(Standard Errors in Parentheses)
Variable Eq. 1 Eq. 2 Eq. 3
Log Total -0.15*** -0.11** -0.11** Automation (.053) (.051) (.048) Log Scale -0.29* -0.17** -0.11 **
(.173) (.072) (.070) Log Model Mix -0.55 -0.07 -0.04 Complexity (.051) (.049) (.047) Log Parts 0.15* 0.22** 0.15* Complexity (.088) (.087) (.084) Log Product 0.09 0.10 0.10 Design Age (.076) (.074) (.069) Log Use of -0.09* -0.09 -0.03 Buffers (.047) (.069) (.067) Log Work Systems -0.06 -0.02 -0.01
(.045) (.047) (.044) Log HRM Policies -0.08* -0.05 -0.03
(.045) (.051) (.056) LBuffers x LWorkSys - -0.18** -0.02
(.076) (.089) LBuffers x LHRM -0.01 -0.31* Policies (.144) (.169) LWorkSys x LHRM -0.13* 0.141 Policies (.076) (.118) LBuffers x LWorkSys - -0.64*** x LHRM Policies (.221)
Adjusted R2 0.543 0.597 0.649 F for Equation 10.0*** 9.2*** 10.4*** F for R2 change from base case (Eq. 1) 3.4** 5.0***
*Statistically significant at the .10 level; **at the .05 level; ***at the .01 level.
HRM; WorkSys x HRM), and equation 3 adds the three-way interaction term (Buff- ers x WorkSys x HRM).
Multiplicative interaction terms are of- ten criticized because they are so highly correlated with the component variables, creating problems of multicollinearity that can inflate standard errors (Blalock 1979). This is a particular problem with a small sample size and limited degrees of free- dom. To deal with this problem, Jaccard, Turrisi, and Wan (1990) recommended a linear transformation known as "center- ing," in which the mean value for a variable is subtracted from each score. Centering reduces multicollinearity without chang-

214 INDUSTRIAL AND LABOR RELATIONS REVIEW
ing the structural relationship among the variables. Regression results, including f- tests for the overall equation and for incre- mental R-squared changes, are unchanged when centering is used. Thus centering increases the likelihood that a statistically significant interaction effect can be identi- fied, because of the reduction in measure- ment error, without the risk associated with other procedures for reducing multicollin- earity that interaction effects will be artifi- cially inflated (Cronbach 1987).9
In equation 2, the Buffers x WorkSys interaction term and the WorkSys x HRM interaction term are both statistically sig- nificant, while the Buffers x HRM term is not. One possible explanation for this latter result is the high correlation (r = .72) with the Use of Buffers index. Coefficients for the individual indices are no longer statistically significant. All three interac- tion terms have the expected negative sign, and the adjusted R2 is .597. Finally, there is a statistically significant increase in R2 from the "base case" of equation 1. Thus the two- way interaction terms do explain variance in productivity beyond that captured by the three individual indices.
The three-way interaction term is an even better predictor of productivity. In equa- tion 3, this interaction term (Buffers x WorkSys x HRM) is statistically significant at the 99% confidence interval, and the adjusted R2 increases to .649. None of the individual indices have statistically signifi- cant coefficients, and of the three two-way interaction terms, only Buffers x HRM is statistically significant-a striking finding, since this interaction term was the only one that was not significant in equation 2. 10 The
9Without centering, nine of the twelve correla- tions between the three indices and the four interac- tion terms are greater than 0.5, and three correla- tions are greater than 0.8. After centering, only one of the twelve correlations is greater than 0.5.
10One possible explanation is that the three-way interaction term identifies plants with high scores on Use of Buffers and HRM Policies (as well as on Work Systems) while the two-way interaction term may iden- tify plants with high scores on Use of Buffers (that is, plants that have reduced buffers considerably) but low scores on HRM Policies. Plants in this latter
increase in R2 from equation 1 is statisti- cally significant, as noted in the table. Fur- thermore, the increase from equation 2 is also statistically significant, with an F-statis- tic of 8.4 (p = .005).
Quality Regressions
Tables 8 and 9 show the parallel analyses for quality. In Table 8, the base case, in equation 1, has a very low adjusted R2 of .06, and none of the independent variables (or the equation overall) is statistically signifi- cant. Particularly noteworthy, in compari- son with the productivity base case, is that the automation coefficient is very close to zero. Equation 2, which adds the Use of Buffers index, is little different, since nei- ther the index nor the change in R2 is statistically significant. This result is sur- prising, given the expectation that low buffer, Just-in-Time systems are strongly associated with high quality levels. In equa- tions (3) and (4), however, the two other indices related to production organization are statistically significant. Equation 3 contains the Work Systems index, signifi- cant at the 95% confidence level, with an adjusted R2 of .149, and in equation 4 the HRM Policies index is significant at the 99% confidence level and the adjusted R2 rises to .24. In both cases, the increase in R2 over the base case is statistically significant. The control variables do not change appre- ciably in any of these equations.
Equation 5 reveals that, as with produc- tivity, the overall Production Organization Index (in its multiplicative form) is associ- ated with a more substantial increase in R2 over the base case than the individual com- ponent indices. The adjusted R2 increases to .293, and the standardized coefficient for the overall index (not in the table) of -.57 is higher than that for Work Systems
group, which would have moved toward "leaner" buff- ers without changing HR practices, possibly do have significantly better productivity than plants with low scores for both indices. In the equation that only includes the two-way interaction terms, the combina- tion of these two different statistical relationships might have increased the standard error of the coef- ficient until it was not significant.

HR BUNDLES AND MANUFACTURING PERFORMANCE 215
Table 8. Production Organization Indices Regressed on Log Quality. (Standard Errors in Parentheses)
Variable Eq. 1 Eq. 2 Eq. 3 Eq. 4 Eq. 5 Eq. 6
Log Total Automation 0.01 -0.02 0.01 0.03 0.01 0.02 (.095) (.099) (.091) (.086) (.084) (.075)
Log Scale -0.14 -0.10 -0.11 -0.16 -0.07 -0.06 (.120) (.126) (.116) (.108) (.106) (.095)
Log Model Mix Complexity 0.05 0.09 0.06 0.04 0.09 0.11 (.085) (.089) (.081) (.077) (.074) (.067)
Log Parts Complexity 0.02 -0.06 0.03 -0.02 -0.08 -0.08 (.151) (.154) (.144) (.136) (.132) (.119)
Log Product Design Age 0.18 0.08 0.12 0.06 -0.04 -0.10 (.130) (.151) (.126) (.122) (.127) (.115)
Log Use of Buffers -0.11 (.094)
Log Work Systems -0.15 * * (.065)
Log HRM Policies -0.20*** (.062)
Log Production Organization -0.12*** (multiplicative) (.032) Log Production Organization - -0.65*** (additive) (.125) Adjusted R2 0.064 0.075 0.149 0.241 0.293 0.429 F for Equation 1.6 1.6 2.3** 3.4*** 4.1*** 6.6*** F for R2 change from "base case" (Eq. 1) 1.5 5.0** 10.3*** 14.0*** 26.6***
*Statistically significant at the .10 level; **at the .05 level; ***at the .01 level.
(-.33) and HRM Policies (-.46). The F- statistic for the increase in R2, compared to the "base case," is also statistically signifi- cant. For quality, however, using the addi- tive form of the Production Organization Index (in equation 6) results in a much larger increase in adjusted R2 (.429) and a much larger standardized coefficient (.73). This result calls into question the assump- tion that the relationship among the com- ponent indices is best modeled as multipli- cative rather than additive.
In tests of interaction terms (Table 9), the results for quality differ from those for productivity. Equation 1 again provides the base case with all three indices but no interaction terms. In equation 2, which includes all the two-way interaction terms, Buffers x WorkSys is significant with a nega- tive sign, while Buffers x HRM is significant with a positive sign; the remaining WorkSys x HRM interaction term is not statistically
significant. Of the individual component indices, both Use of Buffers and HRM Poli- cies coefficients are statistically significant, both with a negative sign. The overall adjusted RI is .456, and the increase in RI from equation 1 is statistically significant. Equation 3 shows very similar results be- cause, unlike for productivity, the three- way interaction term is not statistically sig- nificant, and the coefficients for the other variables change relatively little.
These results suggest that the relation- ship of the Use of Buffers index to quality is complex. In equations 6 and 7, the index alone and the Buffers x WorkSys interac- tion term are significant with negative coef- ficients, as expected. But the positive coef- ficient for the Buffers x HRM interaction term is counter to expectations, indicating that when all other main effects and inter- action effects are held constant, plants with a high interaction score for these indices
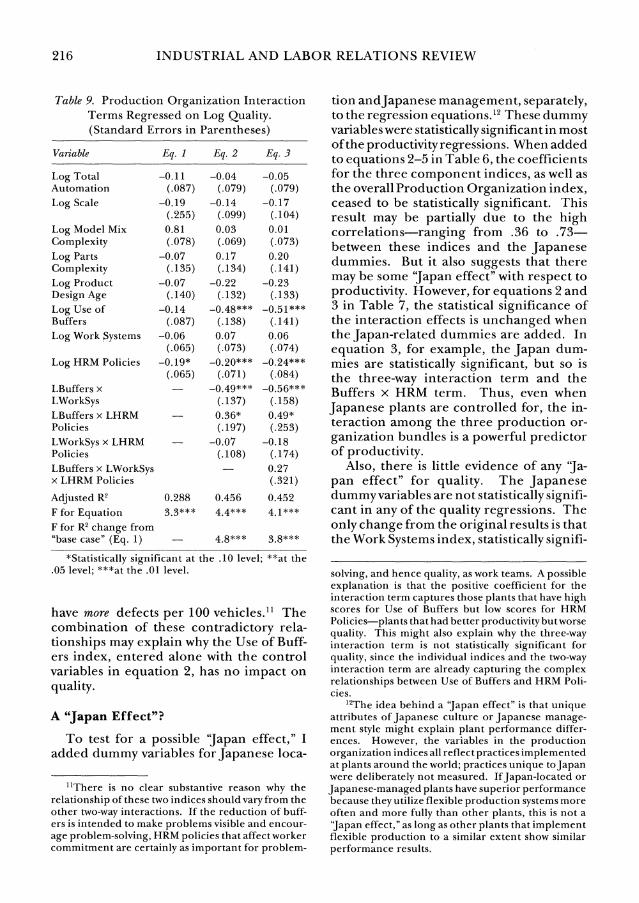
216 INDUSTRIAL AND LABOR RELATIONS REVIEW
Table 9. Production Organization Interaction Terms Regressed on Log Quality. (Standard Errors in Parentheses)
Variable Eq. 1 Eq. 2 Eq. 3
Log Total -0.11 -0.04 -0.05 Automation (.087) (.079) (.079) Log Scale -0.19 -0.14 -0.17
(.255) (.099) (.104) Log Model Mix 0.81 0.03 0.01 Complexity (.078) (.069) (.073) Log Parts -0.07 0.17 0.20 Complexity (.135) (.134) (.141) Log Product -0.07 -0.22 -0.23 Design Age (.140) (.132) (.133) Log Use of -0.14 -0.48*** -0.51*** Buffers (.087) (.138) (.141) Log Work Systems -0.06 0.07 0.06
(.065) (.073) (.074) Log HRM Policies -0.19* -0.20*** -0.24***
(.065) (.071) (.084) LBuffers x -0.49*** -0.56*** LWorkSys (.137) (.158) LBuffers x LHRM 0.36* 0.49* Policies (.197) (.253) LWorkSys x LHRM -0.07 -0.18 Policies (.108) (.174) LBuffers x LWorkSys 0.27 x LHRM Policies (.321) Adjusted R2 0.288 0.456 0.452 F for Equation 3.3*** 4.4*** 4.1*** F for R2 change from "base case" (Eq. 1) 4.8*** 3.8***
*Statistically significant at the .10 level; **at the .05 level; ***at the .01 level.
have more defects per 100 vehicles.11 The combination of these contradictory rela- tionships may explain why the Use of Buff- ers index, entered alone with the control variables in equation 2, has no impact on quality.
A "Japan Effect"?
To test for a possible 'Japan effect," I added dummy variables for Japanese loca-
l"There is no clear substantive reason why the relationship of these two indices should vary from the other two-way interactions. If the reduction of buff- ers is intended to make problems visible and encour- age problem-solving, HRM policies that affect worker commitment are certainly as important for problem-
tion andjapanese management, separately, to the regression equations.12 These dummy variables were statistically significant in most of the productivity regressions. When added to equations 2-5 in Table 6, the coefficients for the three component indices, as well as the overall Production Organization index, ceased to be statistically significant. This result may be partially due to the high correlations-ranging from .36 to .73- between these indices and the Japanese dummies. But it also suggests that there may be some 'Japan effect" with respect to productivity. However, for equations 2 and 3 in Table 7, the statistical significance of the interaction effects is unchanged when the Japan-related dummies are added. In equation 3, for example, the Japan dum- mies are statistically significant, but so is the three-way interaction term and the Buffers x HRM term. Thus, even when Japanese plants are controlled for, the in- teraction among the three production or- ganization bundles is a powerful predictor of productivity.
Also, there is little evidence of any 'Ja- pan effect" for quality. The Japanese dummy variables are not statistically signifi- cant in any of the quality regressions. The only change from the original results is that the Work Systems index, statistically signifi-
solving, and hence quality, as work teams. A possible explanation is that the positive coefficient for the interaction term captures those plants that have high scores for Use of Buffers but low scores for HRM Policies-plants that had better productivity but worse quality. This might also explain why the three-way interaction term is not statistically significant for quality, since the individual indices and the two-way interaction term are already capturing the complex relationships between Use of Buffers and HRM Poli- cies.
12The idea behind a 'Japan effect" is that unique attributes of Japanese culture orJapanese manage- ment style might explain plant performance differ- ences. However, the variables in the production organization indices all reflect practices implemented at plants around the world; practices unique toJapan were deliberately not measured. If Japan-located or Japanese-managed plants have superior performance because they utilize flexible production systems more often and more fully than other plants, this is not a "Japan effect," as long as other plants that implement flexible production to a similar extent show similar performance results.

HR BUNDLES AND MANUFACTURING PERFORMANCE 217
cant in the original quality regressions, ceases to be significant when the Japan dummies are added, but the dummy vari- ables are also not statistically significant. This may be due to multicollinearity be- tween the Japan dummies and the Work Systems index. As with productivity, the coefficients for the interaction terms are essentially unchanged when the Japanese dummies are added.
As a final test, I examine whether the production organization indices and inter- action terms help explain performance dif- ferences within the group of 13 Japanese- managed plants, using non-parametric Spearman correlation coefficients.13 Nearly all of the eight variables (three component indices, one overall Production Organiza- tion index, and four interaction terms) have statistically significant correlations with productivity and quality. Only HRM Policies does not have a significant correla- tion with productivity, and only Work Sys- tems is not significantly correlated with quality.'4 These results strengthen the case that the bundles of practices that make up flexible production do account for observed performance differences.
Conclusions
Past research on the relationship between innovative human resource practices and economic performance has often failed to recognize the interrelationships among practices in the overall HR system; has used aggregate performance measures at a cor- porate level of analysis, far removed from
'3This non-parametric statistic is necessary, given the small number of plants in these subsamples. Also, a one-tail significance test is used, since the direction of the relationship is expected to be negative, that is, the higher a plant's score on each variable (closer to the "flexible production" endpoint), the lower hours per vehicle and defects per vehicle should be.
"4Applying the same test to the subset of eight plants located injapan, the Use of Buffers index and the overall Production Organization index both have a statistically significant correlation with productiv- ity, as does the Buffers x WorkSys interaction term and the three-way interaction term. For quality, the correlations with the Use of Buffers and HRM Policies indices are statistically significant, as is the correla- tion with the Buffers x HRM term.
the settings in which many HR practices are implemented; or has lacked adequate data about technical aspects of a firm's produc- tion system and business strategy to assess the relative contribution of the HR system to performance. In addition, much of the research on the performance of automo- tive assembly plants has overemphasized either the technical system or the HR sys- tem without fully exploring the interaction of the two systems and how it can affect performance.
In this paper I have investigated two hypotheses left unresolved by this research stream: that innovative HR practices affect performance not individually but as inter- related elements in an internally consistent HR "bundle" or system; and that these HR bundles contribute most to assembly plant productivity and quality when they are inte- grated with manufacturing policies under the "organizational logic" of a flexible pro- duction system. I developed three indices (Use of Buffers, Work Systems, and HRM Policies) to capture systemic differences in organizational logic between mass produc- tion and flexible production. I found that each of these indices had high internal consistency, in terms of intercorrelations among the bundled practices. Each was also highly correlated with the other two indices, suggesting a high degree of inte- gration. Finally, cluster analysis distin- guished three groups of plants-Mass Pro- duction, Transition, and Flexible Produc- tion-that differed significantly in mean values for these indices and the practices bundled within them.
I explored the contribution of innova- tive HR practices to economic performance using hierarchical regression analysis, add- ing production organization indices suc- cessively to a "base case" equation contain- ing control variables. The three produc- tion organization indices, as well as the overall index combining them, were all found to be statistically significant pre- dictors of productivity and quality, with the exception of Use of Buffers, which was not significant for quality. Further- more, the results strongly support the hypothesized two-way and three-way in-

218 INDUSTRIAL AND LABOR RELATIONS REVIEW
teraction effects among the indices. The variance explained in the regres-
sion analyses was much higher for produc- tivity than for quality. This difference may partly be due to the smaller sample size for the quality regressions. But the control variables account for 48% of the variance in the "base case" productivity equation, and only 6% in the "base case" quality equation. This difference suggests that the relative contribution of the production organiza- tion indices is greater for quality than for productivity. This interpretation is consis- tent with the fact that the Transition cluster of plants has better quality than the Mass Production cluster of plants, but roughly equivalent productivity. However, it also raises the possibility that the control vari- ables are incorrectly specified in the quality regressions.
Overall, the evidence strongly supports the hypothesis that assembly plants using flexible production systems, which bundle human resource practices into a system that is integrated with production/busi- ness strategy, outperform plants using more traditional mass production systems in both productivity and quality. These results provide the strongest statistical evidence to date of a positive relationship between innovative human resource practices and economic performance, particularly given the comprehensive international sample, the presence of strong control variables, the high reliability of the con- text-specific measures of performance and HR practices, and the discovery of statistically significant interaction effects in a small sample.
There are several limitations to this study. The data are cross-sectional, so causality cannot be definitively determined. Find- ings from assembly plants, which have both capital-intensive and labor-intensive opera- tions, may not generalize well to other set- tings. The automation measures do not capture all capital inputs to the production process and are thus imperfect proxies for capital. In addition, the data do not in- clude all the variables that could affect assembly plant performance. This study also faces some of the perennial dilemmas
of how to measure innovative HR practices. For example, survey data cannot identify the nuances of team functioning. Some teams may engage in little job rotation and cross-training because of workers' resistance to having a "team concept" forced on them. Other teams may focus on personnel and schedule matters but do little produc- tion problem-solving. Thus the growing body of assembly plant case studies is an essential complement to these survey data (for example, Brown and Reich 1989; Adler 1992; Huxley, Robertson, and Rinehart 1991; Rubenstein, Kochan, and Bennett 1993).
These data also cannot address the de- bate about whether flexible production represents "management by stress." Critics argue that flexible production plants achieve much of their productivity advan- tage by "sweating" workers through a faster work pace, standardized jobs, social con- trol via peer pressure, and stress from a bufferless production system and "kaizen" (continuous improvement) efforts that emphasize reductions of labor input (Parker and Slaughter 1988; Fucini and Fucini 1990; Graham 1993). Because the data analyzed here do not measure work pace explicitly, I cannot evaluate the claim that flexible production leads inevitably to "speedup"-or the counterclaim that it requires "working smarter" more than working harder.
This study does shed light on the issue of "fit" between HR strategy and business strat- egy (Arthur 1992). A "fit" hypothesis pre- dicts that either mass or flexible produc- tion plants with a good fit between their HR and production strategies will perform well. In contrast, these results suggest that, at least for auto assembly plants, the flexible production approach consistently leads to better performance than the mass produc- tion approach. If flexible production does constitute a superior strategy for automo- tive assembly, then it should diffuse more rapidly than other production systems-an issue that will be explored as this research continues with the collection of longitudi- nal data from the same international sample.

HR BUNDLES AND MANUFACTURING PERFORMANCE 219
REFERENCES
Adler, Paul S. 1992. "The 'Learning Bureaucracy': New United Motor Manufacturing, Inc." In Barry M. Staw and Larry L. Cummings, eds., Research in Organizational Behavior. Greenwich, Conn.: JAI Press.
_. 1993. "Time-and-Motion Regained." Harvard Business Review (Jan.-Feb.), pp. 97-108.
Adler, Paul S., and Robert E. Cole. 1993. "Designed to Learn: A Tale of Two Auto Plants. " Sloan Manage- ment Review (Spring), pp. 33-45.
Aldenderfer, Mark S., and Roger K. Blashfield. 1984. Cluster Analysis. Beverly Hills: Sage.
Arthur,Jeffrey B. 1992. "The Link Between Business Strategy and Industrial Relations Systems in Ameri- can Steel Minimills." Industrial and Labor Relations Review, Vol. 45, No. 3 (April), pp. 488-506.
Bailey, Thomas. 1992. "Discretionary Effort and the Organization of Work: Employee Participation and Work Reform Since Hawthorne." Paper written for the Sloan Foundation, Columbia University.
Berggren, Christian. 1992. Alternatives to Lean Produc- tion: Work Organization in the Swedish Auto Industry. Ithaca, N.Y.: ILR Press.
Biggart, Nicole Woolsey. 1991. "Explaining Asian Economic Organization: Toward a Weberian Insti- tutional Perspective." Theory and Society, Vol.20, pp. 199-232.
Blalock, H. M. 1979. Social Statistics. New York: McGraw-Hill.
Block, Richard, Morris Kleiner, Myron Roomkin, and Sidney Salsburg. 1987. "Industrial Relations and the Performance of the Firm: An Overview." In Morris M. Kleiner et al., eds., Human Resources and thePeiformanceoftheFirm. Madison,Wis.: Industrial Relations Research Association Series.
Brown, Charles, and James Medoff. 1978. "Trade Unions in the Production Process." Journal of Politi- cal Economy, Vol. 86, No. 3 (June), pp. 335-78.
Brown, Claire, and Michael Reich. 1989. "When Does Union-Management Cooperation Work? A Look at NUMMI and GM-Van Nuys." California Management Review, Vol. 31, No. 4 (Summer), pp. 26-44.
Cappelli, Peter, and Harbir Singh. 1992. "Integrat- ing Strategic Human Resources and Strategic Man- agement." In Peter Sherer, David Lewin, and Olivia Mitchell, eds., Research Frontiers in Industrial Rela- tions, pp. 165-92. Madison, Wis.: Industrial Rela- tions Research Association series.
Carper, W. B., and W. E. Snizek. 1980. "The Nature and Type of Organizational Typologies: An Over- view." Academy of Management Review, Vol. 5, pp. 65- 75.
Clark, Kim. 1980. "The Impact of Unionization on Productivity: A Case Study." Industrial and Labor Relations Review, Vol. 34, No. 4 (July), pp. 466-87.
Clark, Kim, and Takahiro Fujimoto. 1991. Product DevelopmentPerformance. Cambridge, Mass.: Harvard Business School Press.
Cole, Robert E. 1979. Work, Mobility, and Participa- tion: A Comparative Study of Japanese and American
Industry. Berkeley: University of California Press. __. 1992. "Issues in Skill Formation and Training in Japanese Approaches to Automation." In Paul S. Adler, ed., Technology and theFuture of Work, pp. 187- 209. New York: Oxford University Press.
Cronbach, Lee. 1987. "Statistical Tests for Modera- tor Variables." Psychological Bulletin, Vol. 102, No. 3, pp. 414-17.
Cusumano, Michael. 1985. 7hejapaneseAuto Industry: Technology and Management at Toyota and Nissan. Cambridge, Mass.: Harvard University Press.
Cutcher-Gershenfeld, Joel. 1991. "The Impact on Economic Performance of a Transformation in Workplace Relations." Industrial and LaborRelations Review, Vol. 44, No. 2 (January), pp. 241-60.
DeVellis, Robert F. 1991. Scale Development: Theory and Applications. Newbury Park, Calif.: Sage.
Dore, Ronald P. 1992. 'Japan's Version of Manage- rial Capitalism." In Thomas A. Kochan and Michael Useem, eds., Transforming Organizations. New York: Oxford University Press, pp. 17-27.
Ebrahimpour, Maling, and Sang Lee. 1988. "Quality Management Practices of American and Japanese Electronic Firms in the U.S." Production and Inven- tory ManagementJournal (4th qtr.), pp. 28-31.
Emery, Fred, and Einar Thorsrud. 1976. Democracy at Work. Leiden, Netherlands: Martinus Nijhoff.
Everitt, Brian. 1980. Cluster Analysis, 2nd Edition. London: Heineman.
Florida, Richard, and Martin Kenney. 1991. "Trans- planted Organizations: The Transfer of Japanese Industrial Organization to the U.S." American Socio- logical Review, Vol. 56 (June), pp. 381-98.
Fucini,J., andJ. Fucini. 1990. WorkingfortheJapanese: Inside Mazda's American Auto Plant. New York: Free Press.
Graham, Laurie. 1993. "Inside a Japanese Trans- plant: A Critical Perspective. " Work and Occupations, Vol. 20, No. 2, pp. 147-73.
Hackman, J. Richard. 1985. "Doing Research That Makes a Difference." In Edward E. Lawler III et al., eds., Doing Research That Is Useful for Theory and Practice. San Francisco: Jossey-Bass.
Hayes, Robert, and Kim Clark. 1985. "Exploring the Sources of Productivity Differences at the Factory Level." In Kim Clark et al., eds., The Uneasy Alliance. Boston, Mass.: Harvard Business School Press.
Helper, Susan. 1991. "Strategy and Irreversibility in Supplier Relations: The Case of the U.S. Automo- bile Industry." Business History Review, Vol. 65, pp. 781-824.
Huselid, Mark. 1993. "Human Resource Manage- ment Practices and Firm Performance." Unpub- lished paper, Rutgers University.
Huxley, Christopher, David Robertson, and Jim Rinehart. 1991. "Team Concept: A Case Study of Japanese Management in a Unionized Canadian Auto Plant." Unpublished paper, Canadian Auto Workers Research Group.
Ichniowski, Casey. 1991. "Human Resource Manage- ment Systems and the Performance of U.S. Manu-

220 INDUSTRIAL AND LABOR RELATIONS REVIEW
facturing Businesses." NBER Working Paper Series #3449. Cambridge, Mass.: National Bureau of Economic Research.
Ichniowski, Casey, Kathryn Shaw, and Giovanni Prennushi. 1993. "The Effect of Human Resource Management Practices on Productivity." Unpub- lished paper, Columbia University.
Imai, Kenichi. 1986. Kaizen. New York: Free Press. Jaccard, James, Robert Turrisi, and Choi K. Wan.
1990. Interaction Effects in Multiple Regression. Newbury Park, Calif.: Sage.
Katz, Harry, and Jeffrey Keefe. 1992. "Collective Bargaining and Industrial Relations Outcomes: The Causes and Consequences of Diversity." In Peter Sherer, David Lewin, and Olivia Mitchell, eds., Re- search Frontiers in Industrial Relations, pp. 43-76. Madison, Wis.: Industrial Relations Research Asso- ciation series.
Katz, Harry, Thomas A. Kochan, and Kenneth Gobeille. 1983. "Industrial Relations Performance, Economic Performance, and QWL Programs: An Interplant Analysis." Industrial and Labor Relations Review, Vol. 37, No. 1 (October), pp. 3-17.
Katz, Harry, Thomas A. Kochan, and Jeffrey Keefe. 1988. "Industrial Relations and Productivity in the U.S. Automobile Industry. " Brookings Papers on Eco- nomic Activity, Vol. 3, pp. 685-715.
Katz, Harry, Thomas A. Kochan, and Mark Weber. 1985. "Assessing the Effects of Industrial Relations and Quality of Working Life on Organizational Per- formance. " Academy of ManagementJournal, Vol. 28, No. 3 (September), pp. 509-27.
Kochan, Thomas A., Joel Cutcher-Gershenfeld, and John Paul MacDuffie. 1991. "Employee Participa- tion, Work Redesign, and New Technology: Impli- cations for Manufacturing and Engineering Prac- tice." In Gavriel Salvendy, ed., Handbook ofIndustrial Engineering, 2nd Edition. New York: John Wiley, pp. 798-814.
Kogut, Bruce, and Udo Zander. 1992. "Knowledge of the Firm, Combinative Capabilities, and the Repli- cation of Technology." Organization Science, Vol. 3, No. 3 (August), pp. 383-97.
Krafcik, John F. 1988. "Comparative Analysis of Performance Indicators at World Auto Assembly Plants." M.S. Thesis, Sloan School of Management, M.I.T.
Lawler, Edward E., III, Susan Mohrman, and Gerald E. Ledford,Jr. 1992. Employee Involvement and TQM: Practice and Results in Fortune 1000 Companies. San Francisco: Jossey-Bass.
Levine, David, and Laura D'Andrea Tyson. 1990. "Participation, Productivity, and the Firm's Envi- ronment." In Alan S. Blinder, ed., PayingforProduc- tivity. Washington, D.C.: Brookings Institute, pp. 183-244.
MacDuffieJohn Paul. 1991. "Beyond Mass Produc- tion: Flexible Production Systems and Manufactur- ing Performance in the World Auto Industry. " Diss., Sloan School of Management, M.I.T.
MacDuffie, John Paul, and John F. Krafcik. 1992. "Integrating Technology and Human Resources for High Performance Manufacturing: Evidence from
the International Auto Industry." In Thomas A. Kochan and Michael Useem, eds., Transforming Or- ganizations. New York: Oxford University Press, pp. 209-26.
Maddala, G. S. 1977. Econometrics. New York: McGraw- Hill.
Meyer, Alan D., Anne S. Tsui, and C.R. Hinings. 1993. "Configurational Approaches to Organizational Analysis." Academy of Management Journal, Vol. 36, No. 6 (December), pp. 1175-95.
Milgrom, Paul, and John Roberts. 1993. "Complementarities and Fit: Strategy, Structure, and Organizational Change." Unpublished manu- script, Stanford University.
Miller, Danny, and Peter Friesen. 1980. "Momentum and Revolution in Organizational Adaptation." Academy of ManagementJournal, Vol. 23, pp. 591-614.
Mitchell, Daniel J.B., David Lewin, and Edward E. Lawler III. 1990. "Alternative Pay Systems, Firm Performance, and Productivity." In Alan S. Blinder, ed., Paying for Productivity. Washington, D.C.: Brookings Institution, pp. 15-94.
Monden, Yasuhiro. 1983. Toyota Production System. Norcross, Ga.: Institute of Industrial Engineers.
Nishiguchi, Toshihiro. 1993. StrategicIndustrial Sourc- ing: The Japanese Advantage. New York: Oxford University Press.
Ono, Taiichi. 1988. Workplace Management. Cam- bridge, Mass.: Productivity Press.
Osterman, Paul. 1987. "Choices Among Alternative Internal Labor Market Systems." Industrial Rela- tions, Vol. 27, No. 1 (February), pp. 46-67.
__. 1994. "How Common Is Workplace Transfor- mation and Who Adopts It?" Industrial and Labor Relations Review, Vol. 47, No. 2 (January), pp. 173- 88.
Parker, Mike, and Jane Slaughter. 1988. Choosing Sides: Unions and the Team Concept. Boston: South End Press.
Pasmore, William. 1988. DesigningEffective Organiza- tions: The Socio-Technical Systems Perspective. New York: John Wiley.
Pfeffer, Jeffrey. 1994. Competitive Advantage 7'/irough People. Boston, Mass.: Harvard Business School Press.
Rubenstein, Saul, Thomas A. Kochan, and Michael Bennett. 1993. "The Saturn Partnership: Co- Management and the Reinvention of the Local Union." In Bruce Kaufman and Morris Kleiner, eds., Employee Representation: Alternatives and Future Directions. Madison, Wis.: Industrial Relations Re- search Association series.
Schonberger, Richard. 1982. Japanese Manufacturing Techniques. New York: Free Press.
Shimada, Haruo, and John Paul MacDuffie. 1986. "Industrial Relations and 'Humanware': Japanese Investments in Automobile Manufacturing in the United States." Working Paper, Sloan School of Management, M.I.T.
Snell, Scott A., andJames W. Dean,Jr. 1992. "Inte- grated Manufacturing and Human Resource Man- agement: A Human Capital Perspective." Academy of Management Journal, Vol. 35, No. 3 (August),

HR BUNDLES AND MANUFACTURING PERFORMANCE 221
pp. 467-504. Trist, Eric, and Kenneth Bamforth. 1951. "Some Social and Psychological Consequences of the Longwall Method of Coal-Getting." Human Rela- tions, Vol. 4, pp. 6-38.
Ulrich, Dave, and Bill McKelvey. 1990. "General Organizational Classification: An Empirical Test Using the United States and Japanese Electronics Industries." Organizational Science, Vol. 1, No. 1 (February), pp. 99-118.
Useem, Michael. 1993. ExecutiveDefense: Shareholder Powerand CorporateReorganization. Cambridge, Mass.: Harvard University Press.
Weitzman, Martin, and Douglas Kruse. 1990. "Profit Sharing and Productivity." In Alan S. Blinder, ed., PayingforProductivity. Washington, D.C.: Brookings Institute, pp. 95-142.
WomackJames, DanielJones, and Daniel Roos. 1990. The Machine That Changed the World. New York: Rawson-MacMillan.