human regulatory t-cell isolation and measurement of function
TRANSCRIPT

Application Note
Human Regulatory T-Cell Isolation and Measurement of Function
BD Biosciences
March 2010
Application Note
Human Regulatory T-Cell Isolation and Measurement of FunctionChristopher Boyce, BS,* Cynthia Lane, PhD,* Ravi Hingorani, PhD,* Catherine McIntyre, PhD,** Joyce Ruitenberg, BS,** Smita Ghanekar, PhD***BD Pharmingen, San Diego, **BD Biosciences, San Jose
Contents
1 Abstract
2 Introduction
5 Objectives
5 Methods
11 Results
14 Discussion
15 Conclusions
19 References
AbstractRegulatory T cells (Tregs) play a critical role in maintaining immune modulation and are present in normal peripheral blood in low numbers (5 to 10% of CD4+ T cells or 1 to 2% of total lymphocytes). Forkhead box P3 (FoxP3) is considered to be the definitive marker for this rare cell population, but as an intracellular antigen, it is not suitable for sorting viable Tregs that can be used in subsequent studies. Some researchers identify and sort Tregs within a CD4+ lymphocyte population based upon high expression levels of CD25. This strategy can result in the isolation of a Treg population with high purity, but the recovery of Tregs can be low using this approach. As an alternative, CD127 can be used to identify Tregs as CD127low events within the CD4+CD25+ lymphocyte population, and this approach can result in a pure Treg population with higher recoveries. Recent studies investigating CD45RA expression of Treg populations have identified potential subclasses of Tregs and CD45RA expression that can be used to identify and sort CD45RA+ and CD45RA– Treg subpopulations.
In this application note we demonstrate the performance and utility of the BD Pharmingen™ human regulatory T cell sorting kit to sort CD45RA+ and CD45RA– Treg populations using a BD FACSAria™ II cell sorter. Using this approach, it is possible to isolate CD45RA+ and CD45RA– Treg populations that are 89.4 ±14.8% and 90.6 ±14.6% pure (n = 10), 84.4 ±2.2% and 85.6 ±1.5% viable (n = 3), and 90.4 ±2.39% and 90.8 ±2.67% FoxP3+ (n = 10 ), respectively. Cell population percentage recoveries ranged from 45 to 100%, with 2.17 ±1.53 x 10⁵ CD45RA+ Tregs and 1.2 ±0.81 x 10⁵ CD45RA– Treg cells recovered from 100 mL of whole blood within a 2 to 4-hour sort time.
CD45RA+ Treg post-sort fractions from 4 donors were subsequently cultured for 13 to 14 days, after which the function of the cultured Treg populations was assessed using the BD FastImmune™ human regulatory T cell function kit. Compared to controls, this 7-hour assay demonstrated that these cultured CD45RA+ Tregs could suppress the frequency of CD4+CD69+ and CD4+CD154+ lymphocytes by 44.33 ±3.49% and 30.41 ±5.94%, respectively, at a Treg:PBMC ratio of 0.5:1. Previously cryopreserved autologous PBMCs were used as effector cells.
Taken together, the data presented in this application note demonstrates that when used in combination, these tools offer a simplified and standardized isolation and assay system for Tregs. These pre-optimized methods relieve researchers of optimizing and troubleshooting isolation and suppression assay protocols in their laboratory. General tips for sorting rare cell populations and specific tips for handling Tregs are also provided.

Application Note
Human Regulatory T-Cell Isolation and Measurement of Function
BD Biosciences
March 2010
For Research Use Only. Not for use in diagnostic or therapeutic procedures.
IntroductionRegulatory T cells (Tregs) play a key role in immune homeostasis and represent approximately 5 to 10% of CD4+ T cells in peripheral blood. Tregs prevent inappropriate immune responses by suppressing effector cells.1 Alterations in the number and function of Tregs have been implicated in many diseases such as type I diabetes, graft versus host disease, systemic lupus erythematosus, and rheumatoid arthritis.
Two major populations of CD4+ Tregs have been described: natural Tregs (nTregs) and inducible Tregs (iTregs). Natural Tregs originate in the thymus as CD4+ cells expressing FoxP3+ (forkhead box P3) and high levels of CD25. Conventional CD4+ T cells also originate in the thymus and can differentiate in the periphery into CD25+FoxP3+ cells upon sufficient antigenic stimulation. FoxP3 is an intracellular Treg-specific transcription factor and controls a number of quintessential characteristics of Tregs, including the transcriptional repression of key effector molecules such as Interleukin-2 (IL-2) and CD127 (Interleukin-7 receptor).2 FoxP3 provides a useful marker to assess Treg purity, but being an intracellular marker it is not suitable for sorting of viable cells.
Tregs are known to express the highest levels of CD25 and a CD4+CD25+(high)
gating strategy is sometimes used to identify and sort Treg populations.1 See Figure 1 (panels A and C). The CD4+CD25+(high) gating strategy is effective at identifying pure populations of Tregs, but to the exclusion of a portion of a CD25+(int) (CD25+ intermediate) population that is FoxP3+ (Figure 1, Panel C). When used as a sorting strategy, this gating approach results in overall lower recovery of Tregs possessing a FoxP3 phenotype (Figure 1, panel D). The low numbers of CD4+CD25+(high) Tregs isolated using this approach might require expansion in culture for 10 to 15 days to achieve high enough cell numbers for downstream studies.

Application Note
Human Regulatory T-Cell Isolation and Measurement of Function
BD Biosciences
March 2010
Page 3
For Research Use Only. Not for use in diagnostic or therapeutic procedures.
Figure 1. FoxP3 expression of CD4+ T lymphocytes over a range of CD25 expression levels
CD4 gate
CD25+(high) gate
CD25+(int) gate A
CD25+(int) gate B
CD25+(low) gate
CD25neg gate
CD4 FITC
CD
25 P
E-C
y7
104
103
102
102 103 104 105
All Events
(x 1
,000
)
(x 1,000)
250
Lymphocyte Gate
FSC
SSC
25020015010050
200
150
100
50
CD4 gate
(x 1
,000
)25
0
Lymphocyte Gate
CD4 FITC
SSC
102
200
150
100
50
103 104 105
CD4 gate
CD25+CD127low gate
CD25 PE-Cy7
CD
127
Ale
xa F
luo
r® 6
47-5
5
102 103 104 105
105
104
103
102
0
P1
FoxP3 PE
CD25+(high) gate
Co
un
t
102 103 104 105
10
23
45
6
P2
FoxP3 PE
CD25+(int) gate A
Co
un
t
102 103 104 105
05
1015
P3
FoxP3 PE
CD25+(int) gate B
Co
un
t
102 103 104 105
05
1015
2025
30
P4
FoxP3 PE
CD25+(low) gate
Co
un
t
102 103 104 105
050
100
150
200
P5
FoxP3 PE
CD25neg gate
Co
un
t
102 103 104 105
050
100
150
200
P6
FoxP3 PE
Co
un
t
102 103 104 105
05
1015
20
CD25high -and- CD25+CD127low
Tube: Tube_002
Population #Events %Parent %Total
100.054.126.50.20.20.80.72.10.9
12.51.2
11.50.71.91.7
####54.149.00.7
97.33.1
90.57.8
42.347.09.4
43.46.17.0
91.4
36,972All Events19,991Lymphocyte Gate9,797CD4 gate
73CD25+(high) gate71P1
CD25+CD127low gateP6
CD25neg gateP5
CD25+(low) gateP4
CD25+(int) gate BP3
CD25+(int) gate AP2
304275762322
4,605431
4,247259684625
A B
C
E
D
0
20
40
60
80
100
CD25high CD25int A CD25int B CD25low CD25neg CD25+
CD127low
GATE
% F
oxP3
+ e
vent
s
0
1000
2000
3000
4000
5000
6000
7000
8000
9000
CD25
MFI
% FoxP3+ events
CD25 MFI
Application Note
Human Regulatory T-Cell Isolation and Measurement of Function
BD Biosciences
March 2010
For Research Use Only. Not for use in diagnostic or therapeutic procedures.
Role of CD127: Increase in Treg recovery
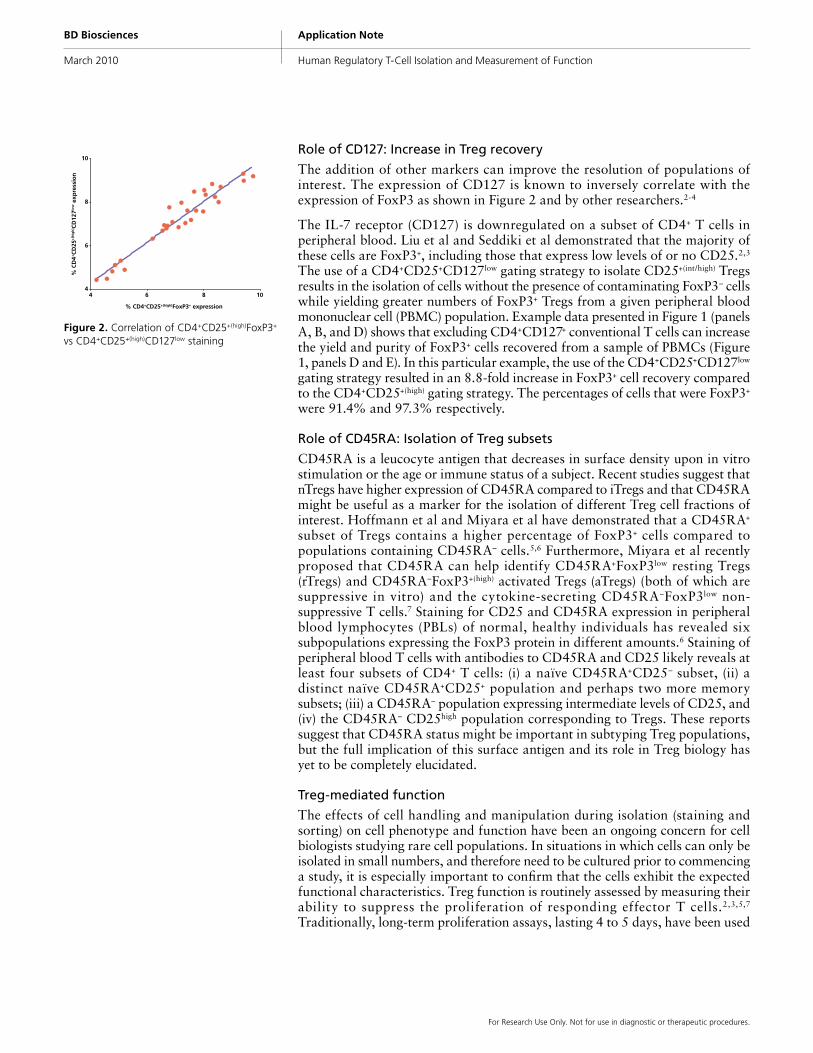
The addition of other markers can improve the resolution of populations of interest. The expression of CD127 is known to inversely correlate with the expression of FoxP3 as shown in Figure 2 and by other researchers.2-4
The IL-7 receptor (CD127) is downregulated on a subset of CD4+ T cells in peripheral blood. Liu et al and Seddiki et al demonstrated that the majority of these cells are FoxP3+, including those that express low levels of or no CD25.2,3 The use of a CD4+CD25+CD127low gating strategy to isolate CD25+(int/high) Tregs results in the isolation of cells without the presence of contaminating FoxP3– cells while yielding greater numbers of FoxP3+ Tregs from a given peripheral blood mononuclear cell (PBMC) population. Example data presented in Figure 1 (panels A, B, and D) shows that excluding CD4+CD127+ conventional T cells can increase the yield and purity of FoxP3+ cells recovered from a sample of PBMCs (Figure 1, panels D and E). In this particular example, the use of the CD4+CD25+CD127low gating strategy resulted in an 8.8-fold increase in FoxP3+ cell recovery compared to the CD4+CD25+(high) gating strategy. The percentages of cells that were FoxP3+ were 91.4% and 97.3% respectively.
Role of CD45RA: Isolation of Treg subsets
CD45RA is a leucocyte antigen that decreases in surface density upon in vitro stimulation or the age or immune status of a subject. Recent studies suggest that nTregs have higher expression of CD45RA compared to iTregs and that CD45RA might be useful as a marker for the isolation of different Treg cell fractions of interest. Hoffmann et al and Miyara et al have demonstrated that a CD45RA+ subset of Tregs contains a higher percentage of FoxP3+ cells compared to populations containing CD45RA– cells.5,6 Furthermore, Miyara et al recently proposed that CD45RA can help identify CD45RA+FoxP3low resting Tregs (rTregs) and CD45RA–FoxP3+(high) activated Tregs (aTregs) (both of which are suppressive in vitro) and the cytokine-secreting CD45RA–FoxP3low non-suppressive T cells.7 Staining for CD25 and CD45RA expression in peripheral blood lymphocytes (PBLs) of normal, healthy individuals has revealed six subpopulations expressing the FoxP3 protein in different amounts.6 Staining of peripheral blood T cells with antibodies to CD45RA and CD25 likely reveals at least four subsets of CD4+ T cells: (i) a naïve CD45RA+CD25– subset, (ii) a distinct naïve CD45RA+CD25+ population and perhaps two more memory subsets; (iii) a CD45RA– population expressing intermediate levels of CD25, and (iv) the CD45RA– CD25high population corresponding to Tregs. These reports suggest that CD45RA status might be important in subtyping Treg populations, but the full implication of this surface antigen and its role in Treg biology has yet to be completely elucidated.
Treg-mediated function
The effects of cell handling and manipulation during isolation (staining and sorting) on cell phenotype and function have been an ongoing concern for cell biologists studying rare cell populations. In situations in which cells can only be isolated in small numbers, and therefore need to be cultured prior to commencing a study, it is especially important to confirm that the cells exhibit the expected functional characteristics. Treg function is routinely assessed by measuring their ability to suppress the proliferation of responding effector T cells.2,3,5,7 Traditionally, long-term proliferation assays, lasting 4 to 5 days, have been used
% CD4+CD25+(high)FoxP3+ expression
% C
D4+
CD
25+
(hig
h) C
D12
7low e
xpre
ssio
n
10
8
6
44 6 8 10
Figure 2. Correlation of CD4+CD25+(high)FoxP3+ vs CD4+CD25+(high)CD127low staining

Application Note
Human Regulatory T-Cell Isolation and Measurement of Function
BD Biosciences
March 2010
Page 5
for this purpose. The results from these long-term assays can be misleading because the effector cells might die or alter their function due to IL-2 depletion, apoptosis, or other bystander effects of long-term culture conditions, making it appear as though the Tregs are suppressive (or non-suppressive). A short-term assay would eliminate the artifacts of long-term culture and provide results in a more expedient manner.
A flow cytometry assay has been developed to assess the suppressive capacity of sorted and expanded Tregs upon short-term (7 hours) activation. The surface activation markers CD154 and CD69 are known to be expressed by activated CD4+ T cells within hours of coming into contact with an activation stimulus. Suppression of this activation by Tregs results in a down-regulation in the frequency and/or staining intensity of CD154 and CD69 expression.8,9 The BD FastImmune human regulatory T cell function kit is a flow cytometry based assay of Treg function measuring the expression of CD154 and CD69 in response to a known antigenic stimulation.
ObjectivesThe objective of this application note is to demonstrate:
• The utility of the Human Regulatory T Cell Sorting Kit for the enrichment of Tregs from human PBMCs, using the BD FACSAria II cell sorter, that are >80% pure (FoxP3+) and >80% viable.
• That the enriched Tregs can be cultured successfully and these cultured Tregs exhibit suppressive activity as measured using the BD FastImmune human regulatory T cell function kit.
Methods
Antibodies
For Research Use Only. Not for use in diagnostic or therapeutic procedures.
Product Description Vendor Cat. No.
Mouse IgG1 κ, BD Horizon™ V450 (MOPC-21) BD Biosciences 560373
FoxP3 BD Horizon V450 (259D/C7) BD Biosciences 560460
BD Pharmingen Human Regulatory T Cell Sorting Kit: Treg sorting cocktail, CD45RA FITC; CD127 Alexa Fluor® 647; CD25 PE; CD4 PerCP-Cy™5.5.
BD Biosciences 560753
BD FastImmune Human Regulatory T Cell Function Kit :Staining cocktail. CD154 APC; CD69 PE-Cy™7
BD Biosciences 648956

Application Note
Human Regulatory T-Cell Isolation and Measurement of Function
BD Biosciences
March 2010
Ancillary reagents and materials
Instruments
Data from stained cells was acquired using a BD FACSAria II, BD FACSCanto™ II, or BD™ LSR II system. Cell sorting was performed on a BD FACSAria II cell sorter. Instruments were set up using BD™ Cytometer Setup and Tracking (CS&T) beads. Application settings were applied and compensation performed using BD CompBeads prior to each experiment (analysis or sort). BD FACSDiva™ software was used for acquisition and sorting. BD FACSDiva or FlowJo™ software was used for analysis.
For Research Use Only. Not for use in diagnostic or therapeutic procedures.
Product Description Vendor Cat. No.
BD Falcon™ 96-well plate lid BD Biosciences 351191
BD Falcon round-bottom tubes, 12 x 75 mm BD Biosciences 352063
BD Falcon conical tubes, 15 mL BD Biosciences 352096
BD Falcon conical tubes, 50 mL BD Biosciences 352098
BD Falcon 96-well V-bottomed plate BD Biosciences 353263
BD™ CompBead Anti-Mouse Ig, κ/Negative Control (FBS)Compensation Particles Set
BD Biosciences 552843
Stain buffer (FBS) BD Biosciences 554656
Human FoxP3 Buffer Set BD Biosciences 560098
BD Cytometer Setup and Tracking (CS&T) Bead Kit BD Biosciences 641319
BD Vacutainer® CPT™ tubes with sodium heparin BD Medical 362753
BD Vacutainer® tubes with heparin BD Medical 367874
Dynabeads® Human T activator CD3/CD28 (Dynal) Invitrogen 111-31D
Albumin, bovine serum (BSA) Sigma A4503
Sodium azide Sigma S2002
Human serum, AB (Lonza 14-490E) VWR International 12001-882
Cellgro Dulbecco’s phosphate buffered saline (DPBS) w/o Ca/Mg (Mediatech 21-031-CV)
VWR International 45000-434
Ficoll-Paque™ PLUS medium (GE Healthcare 17-1440-02) VWR International 17-1440-02
X-VIVO™ 15 medium: without gentamicin and phenol red (Lonza Walkersville Inc. 04-744Q)
VWR International 12002-006
VWR® microcentrifuge tubes VWR International 87003-290

Application Note
Human Regulatory T-Cell Isolation and Measurement of Function
BD Biosciences
March 2010
Page 7
Methods
Isolation of PBMCs Ficoll-Paque PLUS:
1. Whole blood was collected from normal donors into BD Vacutainer tubes (heparin) and diluted 1:1 with sterile DPBS at room temperature.
2. Ficoll-Paque PLUS (14 mL) was dispensed into 50-mL conical tubes, overlayed with 35 mL of diluted whole blood, and the tubes were centrifuged (700g, 20 min, 18–22°C).
3. Twenty to 25 mL of the plasma layer was removed by aspiration, and the PBMC fraction was transferred to a 50-mL conical tube.
4. Cells were washed twice in DPBS + 1% Human AB serum and centrifuged (225g, 10 min, 18–22°C).
BD CPT tubes: PBMCs were isolated according to the Technical Data Sheet (TDS).10
Regardless of the isolation method used, PBMCs were resuspended in DPBS + 1% human AB serum at a concentration of 1–2 x 10⁷ PBMCs/mL.
Cell counts and viability determinationCell counts and viability determination were performed using a Vi-Cell™ viability analyzer (Beckman Coulter), CELL- DYN® hematology analyzer cell counter (pre-sort), or the manual Trypan Blue exclusion method.
Surface stainingCells were stained with the Human Regulatory T Cell Sorting Cocktail (CD45RA FITC, CD127 Alexa Fluor® 647, CD25 PE, and CD4 PerCP-Cy5.5) as outlined in the Human Regulatory T Cell Sorting Kit TDS.11
Pre-sort analysis Labeled PBMCs were loaded onto a BD FACSAria II system and analyzed as shown in Figure 3 to confirm the presence of CD4+CD25+CD127lowCD45RA+ (CD45RA+ Tregs) and CD4+CD25+CD127lowCD45RA– (CD45RA– Tregs). The gating strategy recommended in the Human Regulatory T Cell Sorting Kit TDS was used to sort the Tregs from PBMCs and is outlined in Figure 3 (panels A through F).11 Lymphocytes were gated using an FSC vs. SSC plot (panel A) followed by doublet discrimination (panels B and C). The singlet lymphocytes were then gated for CD4+ expression (panel D), followed by a CD25+CD127low gate to identify Tregs (panel E). Tregs were further discriminated according to their CD45RA expression (panel F). The CD45RA+ and CD45RA– gates were used as sorting gates. This population hierarchy is summarized in panel H. The distribution of the CD45RA+ and CD45RA– Treg populations displayed on a CD4 vs. CD25 plot is shown in panel G.
For Research Use Only. Not for use in diagnostic or therapeutic procedures.

Application Note
Human Regulatory T-Cell Isolation and Measurement of Function
BD Biosciences
March 2010
Treg sortingThe BD FACSAria II system was set up for a sort using either a 70-µm or 100-µm nozzle (70 psi or 35 psi with a frequency of 87 or 60 kHz respectively). CD45RA+ Tregs and CD45RA– Tregs were sorted in purity mode at a rate of 10,000 to 11,000 events per second. Sorted cells were collected in 12 x 75-mm round-bottom tubes coated with human AB serum prior to the addition of 0.4 mL of X-VIVO 15 medium + 10% human AB serum and 0.2% acetylcysteine (if performing a post-sort culture) or DPBS + 1% Human AB serum (if performing only a post-sort analysis) as outlined in the Human Regulatory T Cell Sorting Kit TDS.11
Note: Tips on sorting rare cell populations are provided at the end of this application note.
All Events
Lymphocyte Gate
FSC
SSC
(x 1
,000
)25
020
015
010
050
(x 1,000)25020015010050
Lymphocyte Gate
Doublet Disc 1
FSC
FSC
(x 1
,000
)25
020
015
010
050
(x 1,000)25020015010050
Doublet Disc 1
Doublet Disc 2
SSC
SSC
(x 1
,000
)25
020
015
010
050
(x 1,000)25020015010050
Doublet Disc 2
CD4 Gate
CD4 PerCP-Cy5-5
SSC
(x 1
,000
)25
020
015
010
050
-102-231 102 103 104 1050
CD4 Gate
CD127low Treg
CD25 PE
CD
127
Ale
xa F
luo
r® 6
470
102
103
104
105
-102-283
-129
102 103 104 1050
Treg cocktail
CD4+CD25+CD127low CD45RA+
CD4+CD25+CD127low CD45RA–
CD45RA FITC
CD
25 P
E10
210
310
410
5
102 103 104 105
CD4 Gate
CD4 PerCP-Cy5-5
CD
25 P
E-1
020
102
103
104
105
102 103 104 105-102-231
-283
0
Tube: Treg cocktail
Population #Events %Parent %Total
30,000 #### 100.022,506 75.0 75.022,394 99.5 74.622,302 99.6 74.311,137 49.9 37.1
944 8.5 3.1422 44.7 1.4515 54.6 1.7
All EventsLymphocyte Gate
Doublet Disc 1Doublet Disc 2
CD4 GateCD127low Treg
CD4+CD25+CD127low CD45RACD4+CD25+CD127low CD45RA
A B C
D E F
G H
Figure 3. Gating strategy used to sort CD45RA+ and CD45RA– Tregs
For Research Use Only. Not for use in diagnostic or therapeutic procedures.

Application Note
Human Regulatory T-Cell Isolation and Measurement of Function
BD Biosciences
March 2010
Page 9
Sorted cell populations were centrifuged (250g, 10 min), the supernatant carefully removed, and the resulting cell suspension divided into two or three fractions as required. Fraction 1 was used for purity determination, Fraction 2 for FoxP3 staining, and Fraction 3 (select donors) for culture.
Note: Tips on cell handling to maximize Treg viability are provided at the end of this application note.
Purity of sorted cell populationsA fraction of the sorted cell populations (3–5 x 10⁴) was resuspended in DPBS + 1% AB serum, and at least 5,000 CD4+ events were acquired on the BD FACSAria II system used for the sort, or on a BD FACSCanto II or BD LSR II system. Data was analyzed using the same gating strategy used in the sort procedure. Purity was calculated as the number of events in the original sort gate after the exclusion of cell debris.
Note: Tips on post-sort analysis of low cell numbers are provided at the end of this application note.
FoxP3 staining of sorted cell populations (microassay) A fraction of the sorted cell populations was stained for intracellular FoxP3 expression using FoxP3 BD Horizon V450 and the Human FoxP3 buffer set with the following modifications to accommodate the low cell numbers.12
Note: Staining for the surface markers CD25, CD45RA, CD4, and CD127 was not necessary since cells were already stained with these markers prior to the sort.
1. Five 0.65-mL microcentrifuge tubes were labeled as shown in Table 1.
2. Sorted cells were resuspended in stain buffer (FBS) at a concentration of at least 3 x 10⁴ cells/50 µL (6 x 10⁵ cells/mL) and dispensed into the tubes as shown in Table 1.
3. Stain buffer (FBS, 500 µL) was added to each of the tubes, which were centrifuged (250g, 5 min), and the supernatant carefully removed.
4. Two-hundred fifty microliters of 1X FoxP3 Buffer A was added to each of the tubes, which were vortexed gently for 1 second, and incubated for 10 min at room temperature (RT) protected from light.
Note: Optional step: tubes can be stored overnight at 4°C in buffer A and the procedure continued the next day. Bring tubes to RT before proceeding.
5. Each tube was centrifuged (250g, 5 min), and fixative (1X FoxP3 buffer A) carefully removed taking care not to inadvertently remove the pellet, which might be buoyant.
Tube Cell fraction Cell number Antibody Antibody (Test)
1 Pre-sort At least 2 x 10⁵ FoxP3 BD Horizon V450 0.5 (2.5 µL)
2 CD45RA– Treg At least 3 x 10⁴ Isotype BD Horizon V450 0.5 (volume is batch specific)
3 CD45RA– Treg At least 3 x 10⁴ FoxP3 BD Horizon V450 0.5 (2.5 µL)
4 CD45RA+ Treg At least 3 x 10⁴ Isotype BD Horizon V450 0.5 (volume is batch specific)
5 CD45RA+ Treg At least 3 x 10⁴ FoxP3 BD Horizon V450 0.5 (2.5 µL)
Table 1. Tubes for FoxP3 staining (microassay)
For Research Use Only. Not for use in diagnostic or therapeutic procedures.

Application Note
Human Regulatory T-Cell Isolation and Measurement of Function
BD Biosciences
March 2010
6. Cells were permeabilized by gently resuspending the pellet in the residual volume of fixative followed by the addition of 250 µL of 1X FoxP3 buffer C.
7. Cell suspensions were gently vortexed for 1 second and incubated for 30 minutes at RT protected from light.
8. Stain buffer (FBS) (500 µL) was added to each of the tubes, which were centrifuged (250g, 5 min). The stain buffer was carefully removed, leaving behind approximately 50 µL of liquid.
9. FoxP3 BD Horizon V450 (2.5 µL) or isotype BD Horizon V450 (0.5 µg) was added to each vial as indicated in Table 1.
10. Each tube was vortexed gently for 1 second and incubated for 30 minutes at RT protected from light.
11. Cells were washed as in step 8. 12. Cells were resuspended in 300 µL of DPBS, and data was acquired
immediately. A minimum of 500 to 2,000 CD4+ events were acquired.
Note: Tips on post-sort analysis of low cell numbers are provided at the end of this application note.
Culture of sorted cell populationsSorted cell populations of CD45RA+ Tregs derived from 4 different donors were cultured for 13 to 14 days according to the procedure outlined by Basu et al.13 Briefly, cells were cultured at a concentration of 2 x 10⁵ cells/mL in X-VIVO 15 medium + 10% AB serum and stimulated with CD3/CD28 beads (cell:bead ratio of 1:1) in the presence of 100 ng/mL of rapamycin. Recombinant human IL-2 (300 units/mL) was added on day 2 and was present for the remainder of the culture period. Rapamycin was withdrawn on day 7 and cells re-stimulated with CD3/CD28 beads on day 9. Cell concentration was maintained at 2 x 10⁵ cells/mL throughout the 13 to 14-day culture.
Functional assayCultured CD45RA+ Tregs were harvested and a functional assay set up as out-lined in the BD FastImmune human regulatory T cell function kit TDS at a ratio of Treg:PBMC of 0:1, 0.5:1, and 0.25:1 using previously cryopreserved autolo-gous PBMCs as responders.14 Cells were incubated for 7 hours at 37°C, in the presence of activation cocktails and in the presence or absence of Tregs, then held overnight at 18°C in a programmable water bath prior to staining and analysis.
Note: This overnight holding step is optional. Samples can be stored at 4°C prior to staining, or stained and analyzed immediately if preferred.
The percent suppression of CD69 and CD154 expression (frequency or staining intensity) of CD4+ T cells was determined as outlined in the BD FastImmune human regulatory T cell function kit TDS.14
For Research Use Only. Not for use in diagnostic or therapeutic procedures.

Application Note
Human Regulatory T-Cell Isolation and Measurement of Function
BD Biosciences
March 2010
Page 11
Results
Phenotypic analysis of sorted Tregs
CD45RA+ Tregs and CD45RA– Tregs were sorted from PBMC populations as outlined in the methods section (Figure 3). Flow cytometric analysis of the sorted Tregs was performed, and representative data is presented in Figure 4. Slight adjustment of gates was required to properly visualize the sorted fractions.
These data confirm the utility of this approach to obtain cell populations with high purity. In panel A, 99.3% of sorted cells were CD45RA– Tregs, and in panel B, 99.9% of sorted cells were CD45RA+ Tregs.
Figure 5 shows data from 10 independent sorting experiments analyzed in the same way as shown in Figure 4. Purity is expressed as the percentage of CD4+CD25+CD127low lymphocytes that are either CD45RA– or CD45RA+, (% Purity). Each donor is represented by a different color, and the mean ±SD by the horizontal lines. The data shows that in 9 out of 10 experiments, the CD45RA– Treg sorted population had a purity of >80% (mean 90.6 ±14.6%), and in 8 out of 10 experiments the CD45RA+ sorted population had a purity of >80% (mean 89.4 ±14.8%).
The data demonstrates that when Tregs are sorted on a BD FACSAria II system using the BD Human Regulatory T Cell Sorting Kit, it is possible to isolate CD45RA+ and CD45RA– Treg populations with an acceptable observed reproducibility.
CD4 Gate
CD127low Treg
CD25 PE
M
CD
127
Ale
xa F
luo
r® 6
47
010
210
310
410
5
0
-81
101 102 103 104 105
CD45RAneg fract
CD45RA+
CD45RA– Treg
CD
25 P
E
102
103
104
105
102 103 104 105
Tube: CD45RAneg fract
Population #Events %Parent %Total
5,502 #### 100.05,172 94.0 94.05,156 99.7 93.75,150 99.9 93.65,127 99.6 93.24,997 97.5 90.84,962 99.3 90.2
23 0.5 0.4
All EventsLymphocyte Gate
Doublet Disc 1Doublet Disc 2
CD4 GateCD25+CD127low Treg
CD45RA– TregCD45RA+ Treg
CD4 Gate
CD127low Treg
CD25 PE
CD
127
Ale
xa F
luo
r® 6
47
010
210
310
410
5
0
-81
101 102 103 104 105
CD45RA+ fract
CD45RA+ Treg
CD45RA– Treg
CD
25 P
E
102
103
104
105
102 103 104 105
Tube: CD45RA+ fract
Population #Events %Parent %Total
5,224 #### 100.04,912 94.0 94.04,898 99.7 93.84,898 100.0 93.84,890 99.8 93.64,840 99.0 92.6
3 0.1 0.14,834 99.9 92.5
All EventsLymphocyte Gate
Doublet Disc 1Doublet Disc 2
CD4 GateCD25+CD127low Treg
CD45RA– TregCD45RA+ Treg
A
B
Figure 4. Phenotypic analysis of sorted Tregs
Figure 5. CD45RA expression of sorted Treg fractions
CD45RA- Treg
Sorted populations
% P
uri
ty
CD45RA+ Treg
60
40
80
100
120
For Research Use Only. Not for use in diagnostic or therapeutic procedures.
Application Note
Human Regulatory T-Cell Isolation and Measurement of Function
BD Biosciences
March 2010
FoxP3 expression of sorted Tregs
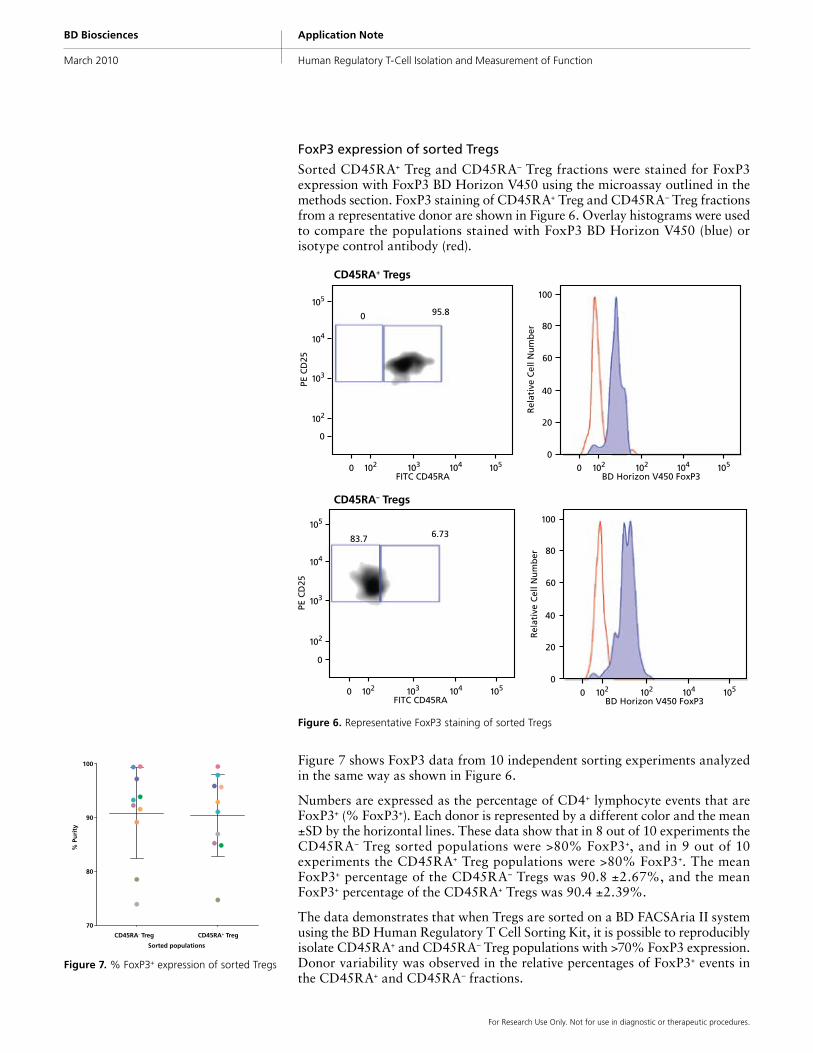
Sorted CD45RA+ Treg and CD45RA– Treg fractions were stained for FoxP3 expression with FoxP3 BD Horizon V450 using the microassay outlined in the methods section. FoxP3 staining of CD45RA+ Treg and CD45RA– Treg fractions from a representative donor are shown in Figure 6. Overlay histograms were used to compare the populations stained with FoxP3 BD Horizon V450 (blue) or isotype control antibody (red).
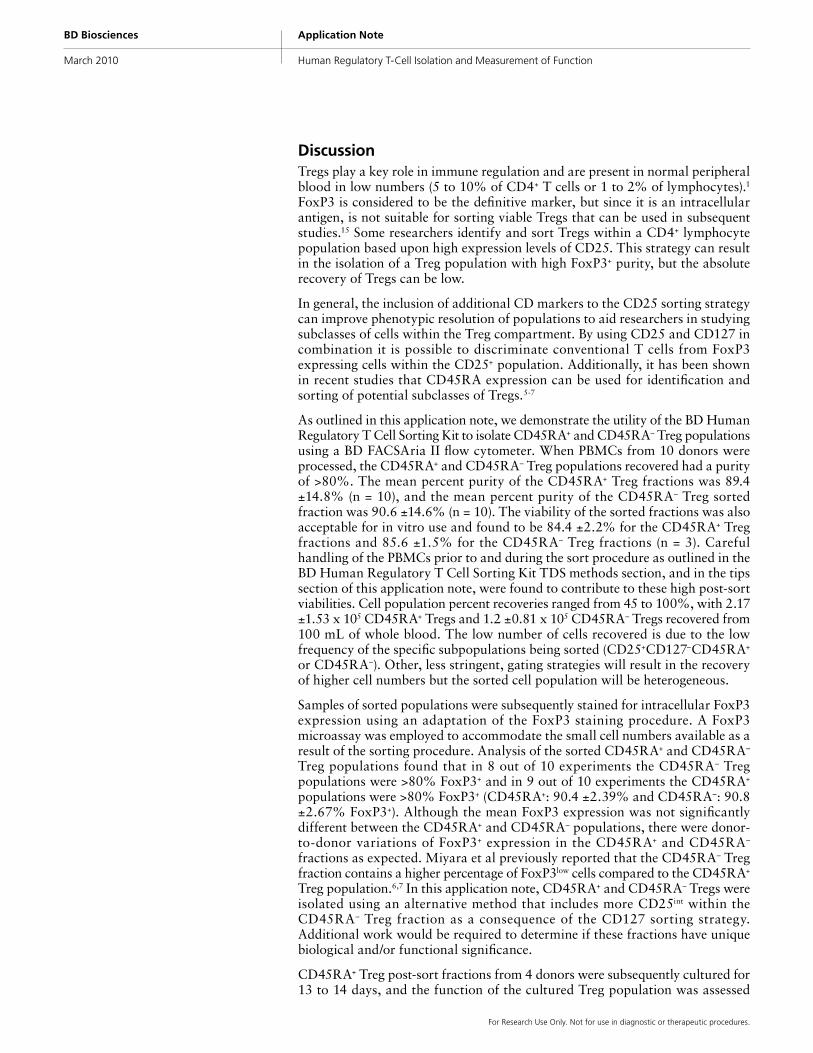
Figure 7 shows FoxP3 data from 10 independent sorting experiments analyzed in the same way as shown in Figure 6.
Numbers are expressed as the percentage of CD4+ lymphocyte events that are FoxP3+ (% FoxP3+). Each donor is represented by a different color and the mean ±SD by the horizontal lines. These data show that in 8 out of 10 experiments the CD45RA– Treg sorted populations were >80% FoxP3+, and in 9 out of 10 experiments the CD45RA+ Treg populations were >80% FoxP3+. The mean FoxP3+ percentage of the CD45RA– Tregs was 90.8 ±2.67%, and the mean FoxP3+ percentage of the CD45RA+ Tregs was 90.4 ±2.39%.
The data demonstrates that when Tregs are sorted on a BD FACSAria II system using the BD Human Regulatory T Cell Sorting Kit, it is possible to reproducibly isolate CD45RA+ and CD45RA– Treg populations with >70% FoxP3 expression. Donor variability was observed in the relative percentages of FoxP3+ events in the CD45RA+ and CD45RA– fractions.
PE C
D25
FITC CD45RA
Rel
ativ
e C
ell N
um
ber
BD Horizon V450 FoxP3
95.80
105
104
103
102
0
0 102
20
0
40
60
80
100
102 102 104 1050103 104 105
PE C
D25
FITC CD45RA
Rel
ativ
e C
ell N
um
ber
BD Horizon V450 FoxP3
6.7383.7
105
104
103
102
0
0 102
20
0
40
60
80
100
102 102 104 1050103 104 105
CD45RA+ Tregs
CD45RA– Tregs
Figure 6. Representative FoxP3 staining of sorted Tregs
CD45RA- Treg
Sorted populations
% P
uri
ty
CD45RA+ Treg
70
80
90
100
Figure 7. % FoxP3+ expression of sorted Tregs
For Research Use Only. Not for use in diagnostic or therapeutic procedures.

Application Note
Human Regulatory T-Cell Isolation and Measurement of Function
BD Biosciences
March 2010
Page 13
Viability of sorted cells
The viability of the PBMC pre-sort cell suspension and the sorted fractions was determined as outlined in the methods section. Pre-sort viabilities were routinely >95% (n = 10) (mean = 96.4 ±1.8%). The mean post-sort viability of the CD45RA+ and CD45RA– fractions was 84.4 ±2.2% and 85.6 ±1.5% (n = 3), respectively. The data demonstrates that when Tregs are sorted on a BD FACSAria II system using the BD Human Regulatory T Cell Sorting Kit, it is possible to achieve acceptable post-sort viability.
Cell recoveries
Ten sorting experiments were performed using the procedure outlined in the methods section. Cell counts were determined using cell counting standard practices, BD FACSDiva real-time data, and the input and output event counts as derived from the experimental sort reports. Reports were compiled and then analyzed. The data is presented in Table 2.
Cells were stained and sorted, and the mean number of cellular events that were sorted (from the sort report) was 77.300 ±23.099 x 10⁶. The time taken to perform these sorts was approximately 2 to 4 hours. The mean number of CD45RA– Tregs and CD45RA+ Tregs recovered was subject to biological variability (2.17 ±1.53 x 10⁵ and 1.20 ±0.81 x 10⁵ respectively). Percentage recoveries were typically between 45 and 100% (data not shown). Variation in cell number and percentage recoveries could be due to donor variation of the percentage of CD45RA+ and CD45RA– Tregs in starting populations in addition to differences in cell preparation and sorting conditions on a particular experiment day (data not shown).
Suppression of CD69 and CD154 expression on effector cells by cultured Tregs
Sorted CD45RA+ Tregs derived from 4 donors were cultured for 13 to 14 days, and their suppressive ability determined using the BD FastImmune human regulatory T cell function kit as outlined in the methods section. Data shown in Figure 8 demonstrates that the cultured Tregs could suppress the frequency of CD4+CD69+ and CD4+CD154+ lymphocytes by 44.33 ±3.49% and 30.41 ±5.94% respectively, at a Treg:PBMC ratio of 0.5:1 compared to the control (Treg:PBMC ratio of 0:1). Different donors are represented by different colored lines.
Statistic Total cell number (x 106)
PBMCs sorted CD45RA– Tregs recovered CD45RA+ Tregs recovered
Mean 77.300 0.217 0.120
1 SD 23.099 0.153 0.081
N 10 10 10
Table 2. Pre-sort and post-sort cell numbers
Treg:PBMC
A: CD69
% C
D69
Su
pp
ress
ion
00:1 0.5:1 0.25:1
20
40
60
Treg:PBMC
B: CD154
% C
D15
4 Su
pp
ress
ion
00:1 0.5:1 0.25:1
20
40
60
Figure 8. Suppression of CD69+ or CD154+ frequency by cultured CD45RA+ Tregs
For Research Use Only. Not for use in diagnostic or therapeutic procedures.
Application Note
Human Regulatory T-Cell Isolation and Measurement of Function
BD Biosciences
March 2010
DiscussionTregs play a key role in immune regulation and are present in normal peripheral blood in low numbers (5 to 10% of CD4+ T cells or 1 to 2% of lymphocytes).1 FoxP3 is considered to be the definitive marker, but since it is an intracellular antigen, is not suitable for sorting viable Tregs that can be used in subsequent studies.15 Some researchers identify and sort Tregs within a CD4+ lymphocyte population based upon high expression levels of CD25. This strategy can result in the isolation of a Treg population with high FoxP3+ purity, but the absolute recovery of Tregs can be low.
In general, the inclusion of additional CD markers to the CD25 sorting strategy can improve phenotypic resolution of populations to aid researchers in studying subclasses of cells within the Treg compartment. By using CD25 and CD127 in combination it is possible to discriminate conventional T cells from FoxP3 expressing cells within the CD25+ population. Additionally, it has been shown in recent studies that CD45RA expression can be used for identification and sorting of potential subclasses of Tregs.5-7
As outlined in this application note, we demonstrate the utility of the BD Human Regulatory T Cell Sorting Kit to isolate CD45RA+ and CD45RA– Treg populations using a BD FACSAria II flow cytometer. When PBMCs from 10 donors were processed, the CD45RA+ and CD45RA– Treg populations recovered had a purity of >80%. The mean percent purity of the CD45RA+ Treg fractions was 89.4 ±14.8% (n = 10), and the mean percent purity of the CD45RA– Treg sorted fraction was 90.6 ±14.6% (n = 10). The viability of the sorted fractions was also acceptable for in vitro use and found to be 84.4 ±2.2% for the CD45RA+ Treg fractions and 85.6 ±1.5% for the CD45RA– Treg fractions (n = 3). Careful handling of the PBMCs prior to and during the sort procedure as outlined in the BD Human Regulatory T Cell Sorting Kit TDS methods section, and in the tips section of this application note, were found to contribute to these high post-sort viabilities. Cell population percent recoveries ranged from 45 to 100%, with 2.17 ±1.53 x 10⁵ CD45RA+ Tregs and 1.2 ±0.81 x 10⁵ CD45RA– Tregs recovered from 100 mL of whole blood. The low number of cells recovered is due to the low frequency of the specific subpopulations being sorted (CD25+CD127–CD45RA+ or CD45RA–). Other, less stringent, gating strategies will result in the recovery of higher cell numbers but the sorted cell population will be heterogeneous.
Samples of sorted populations were subsequently stained for intracellular FoxP3 expression using an adaptation of the FoxP3 staining procedure. A FoxP3 microassay was employed to accommodate the small cell numbers available as a result of the sorting procedure. Analysis of the sorted CD45RA+ and CD45RA– Treg populations found that in 8 out of 10 experiments the CD45RA– Treg populations were >80% FoxP3+ and in 9 out of 10 experiments the CD45RA+ populations were >80% FoxP3+ (CD45RA+: 90.4 ±2.39% and CD45RA–: 90.8 ±2.67% FoxP3+). Although the mean FoxP3 expression was not significantly different between the CD45RA+ and CD45RA– populations, there were donor-to-donor variations of FoxP3+ expression in the CD45RA+ and CD45RA– fractions as expected. Miyara et al previously reported that the CD45RA– Treg fraction contains a higher percentage of FoxP3low cells compared to the CD45RA+ Treg population.6,7 In this application note, CD45RA+ and CD45RA– Tregs were isolated using an alternative method that includes more CD25int within the CD45RA– Treg fraction as a consequence of the CD127 sorting strategy. Additional work would be required to determine if these fractions have unique biological and/or functional significance.
CD45RA+ Treg post-sort fractions from 4 donors were subsequently cultured for 13 to 14 days, and the function of the cultured Treg population was assessed
For Research Use Only. Not for use in diagnostic or therapeutic procedures.

Application Note
Human Regulatory T-Cell Isolation and Measurement of Function
BD Biosciences
March 2010
Page 15
using the BD FastImmune human regulatory T cell function kit. This newly developed kit measures the functional ability of a Treg population based upon suppression of the activation markers CD69 and CD154. Results showed that the cultured fractions of CD45RA+ Tregs remained functional and resulted in 44.33 ±3.49% and 30.41 ±5.94% suppression of the frequency of CD4+CD69+ and CD4+CD154+ lymphocytes compared to the control.
ConclusionsThe data presented in this application note demonstrates that CD45RA+ and CD45RA– Tregs can be isolated from human PBMCs using the BD Human Regulatory T Cell Sorting Kit and the BD FACSAria II system, and that the fractions thus generated:
• Exhibited high post-sort purities: CD45RA+ Tregs were 89.4 ±14.8% pure and CD45RA– Tregs were 90.6 ±14.6% pure (10 donors).
• Exhibited high post-sort viabilities: CD45RA+ Tregs were 84.4 ±2.2% viable and CD45RA– Tregs were 85.6 ±1.5% viable (3 donors).
• Contained high percentages of FoxP3+ events: CD45RA– Tregs were 90.8 ±2.67% FoxP3+ and CD45RA+ Tregs were 90.4 ±2.39% FoxP3+ (10 donors).
• Could be cultured for a period of 13 to 14 days (CD45RA+ fractions from 4 donors) and the cultured Tregs resulted in a suppression of the frequency of CD4+CD69+ and CD4+CD154+ lymphocytes (44.33 ±3.49% and 30.41 ±5.94% respec t ively) compared to the control , as measured using the BD FastImmune human regulatory T cell function kit.
To summarize, the data presented in this application note demonstrates that when used in combination, the tools described offer a simplified and standardized isolation and functional assay system for Tregs. These tools relieve researchers of optimizing and troubleshooting isolation and functional assay protocols in their laboratory.
For Research Use Only. Not for use in diagnostic or therapeutic procedures.

Application Note
Human Regulatory T-Cell Isolation and Measurement of Function
BD Biosciences
March 2010
General tips for sorting Tregs using the BD Human Regulatory T Cell Kit
Before you startTo properly set expectations, calculate how many cells that you expect or want from a particular process before you start. A thorough understanding of your process will help you better predict recovery and plan accordingly.For example, if you assume that 2% of PBMCs are CD4+CD25+FoxP3+ lymphocytes and you know that the average Treg recovery from your particular procedure is 50%, then to recover 1 x 10⁶ Tregs at the end of an isolation procedure, you need to start with 1 x 10⁸ PBMCs. On average, there are 106 PBMCs/mL of whole blood, so to start with 108 PBMCs, you will need approximately 100 mL of whole blood. Buffy coats or an apheresis pack might be appropriate for a given application.
Setting up for a sort using a BD FACSAria II cell sorterSee the BD FACSAria II User’s Guide for details on how to set up the instrument appropriately and perform a successful sort.16 This section highlights just some of the tips for success. • Use BD FACSDiva templates to set up your cytometer, for example, area
scaling and doublet discrimination.• Use BD FACSDiva Application Settings to ensure that the instrument setup is
appropriate to detect both dim and bright events.• Use fluorescence minus one (FMO) controls to set up gates when populations
are hard to distinguish from adjacent populations or are hard to see due to low event numbers.
• If you plan to culture cells after they have been sorted, or if your cell population is known to be sensitive to endotoxin, decontaminate the instrument using the Prepare for Aseptic Sort procedure.16-18
• Choose an appropriately sized collection tube to collect the sorted cells. Collection tube holders are available for 1-mL microtubes, 12 x 75-mm tubes, and 15-mL centrifuge tubes.
• Align the sort stream carefully to ensure that sorted cells go directly into a medium, DPBS, or serum cushion (as appropriate), and do not hit the sides of the collection tubes.
• Choose the sort precision mode so that it is appropriate for your application. Purity mode results in a sorted sample that is highly pure, at the expense of recovery and yield. In yield mode, recovery and yield are optimized at the expense of purity. See the BD FACS Aria II User’s Guide for additional information.16
• Choose an appropriate flow (event) rate to achieve the required sorting efficiency. Sorting results are typically optimized at lower flow rates.
For Research Use Only. Not for use in diagnostic or therapeutic procedures.

Application Note
Human Regulatory T-Cell Isolation and Measurement of Function
BD Biosciences
March 2010
Page 17
General tips on cell handlingStore your pre-sort and post-sort cell suspensions appropriately to minimize cell loss prior to and during the sorting and collection process.• Changes in temperature can adversely affect cell viability and/or recovery. The
BD FACSAria II cell sorter has the ability to chill the loading chamber and collection sort block.16
• Some cell types might require the presence of medium and serum to maintain optimal viability and/or recovery.
– Resuspend cells in the sample tube in the appropriate medium and serum, but do not exceed more than 2% serum.
– Sort cells into tubes coated with and/or containing a cushion of medium and/or serum.
• Changes in pH can adversely affect cell viability and recovery. Addition of HEPES (up to 25 mM) to the collection medium will limit pH fluctuations during sorting.
• Sedimentation of cells in the sample tube over time can result in low event rates and the formation of aggregates that might result in clogging.
– The BD FACSAria II system has a sample agitation feature to specify the speed at which samples are agitated.16
– Cell suspensions can be filtered using a BD Falcon centrifuge tube with mesh strainer (Cat. No. 352235) immediately prior to sorting.
Tips for maximizing Treg viabilityDifferent cell types might require different conditions to maintain viability, so conditions should be optimized for each cell type. The following tips were found to maximize viability of Treg populations during these studies:• Handle pre-sort and post-sort cell suspensions minimally, avoiding excessive
centrifugation and re-suspension.• Avoid excessive shear forces when resuspending cells. Avoid the use of small-
gauge needles, pipet tips, or rapid pipetting motions. Try gentle pipetting and re-suspension of cells using a P1000 pipet.
• To minimize cell adherence to the sides of the tube, use polypropylene tubes coated with 100% human AB serum for collecting sorted cell suspensions.
• To collect the sorted Tregs, use a cushion of 0.4 mL of X-VIVO 15 medium + 10% human AB serum + 0.2% acetylcysteine in the bottom of the sort-collection tubes.
• Pause the sort periodically and gently invert the sample and collection tubes to ensure that cells are in suspension.
For Research Use Only. Not for use in diagnostic or therapeutic procedures.

Application Note
Human Regulatory T-Cell Isolation and Measurement of Function
BD Biosciences
March 2010
Post sort analysisThe analysis of small numbers of cells collected in sort fractions generated while sorting rare cell populations (eg, Treg fractions that might contain 3–4 x 10⁴ cells) might require careful interpretation during acquisition. The cytometer chosen for acquisition, cleanliness of the sample injection port (SIP) and/or flow cell, sample carryover, the time period (post-sort) to acquisition, and the quality of the samples are all factors that might cause the generation of suboptimal results.• Set up the cytometer for post-sort analysis using a pre-sort sample for which
cell numbers are not limiting.• If the events of interest are being acquired at low acquisition rate (eg, 3 to 50
events per second), it might take several minutes to acquire enough events for analysis. This may inadvertently introduce noise, debris, or a contaminant into the system that might not be noticed under normal conditions.
– Noise might also be due to carryover from the previous sample, electronic noise, particles present in the sheath or water routinely used to clean the SIP, events attributable to Raman scattering, or debris remaining from the intracellular fixation process.
– Setting the acquisition counter to the specific events of interest will prevent premature termination of the acquisition due to noise or debris. For example, when acquiring sorted Tregs, set the acquisition counter to the CD4+ lymphocyte population and not total events.
– In some cytometers, carryover of events from the preceding tube might affect interpretation of data collected on very small fractions of cells. Try acquiring a tube of DPBS between runs to define background or carryover from previous tubes in the run.
• If analyzing a post-sort sample on the same instrument used for sorting, it might be necessary to slightly adjust pre-sort gates when analyzing post-sort populations due to changes in fluorescence intensity or marker expression over the sort process.
• Use fluorescence minus one (FMO) controls to set up gates when populations are hard to distinguish from adjacent populations or are hard to see due to low event numbers.
• Perform post-sort analysis using cell suspensions resuspended in a buffer that does not contain phenol red. The presence of phenol red can cause background problems.
Tips for post-sort culture of sorted Tregs
Different cell types might require different post-sort handling conditions to ensure successful post-sort culture and should be optimized for each cell type. The following tips were found to maximize the culture of sorted Treg populations:• If you plan to culture Tregs after they have been sorted decontaminate the
instrument using the Prepare for Aseptic Sort procedure prior to performing the sort.18,19
• Limit post-sort handling of the cells to one wash and let them rest for a few hours or overnight in culture medium before subsequent manipulation.
For Research Use Only. Not for use in diagnostic or therapeutic procedures.
Application Note
Human Regulatory T-Cell Isolation and Measurement of Function
BD Biosciences
March 2010
Page 19
References1. Baecher-Allan C, Brown JA, Freeman GJ, Hafler DA. CD4+CD25high regulatory cells in human
peripheral blood. J. Immunol. 2001;167:1245-1253.
2. Seddiki N, Santner-Nanan, B, Martinson J, et al. Expression of interleukin (IL)-2 and IL-7 receptors discriminates between human regulatory and activated T cells. J Exp Med. 2006;203(7):1693-1700.
3. Liu W, Putnum AL, Xu-Yu Z, et al. CD127 expression inversely correlates with FoxP3 and suppressive function of human CD4+ Treg cells. J Exp Med. 2006;203(7):1701-1711.
4. Boyce C, Hingorani R, Vidal J, Li L. Preliminary Analytical Performance of Natural T Regulatory Cell Assays using CD127 and hFoxP3. FOCIS Scientific Program 2008; June 8: 94 abstract Su.85. Clin Immunol. 127:S152.
5. Hoffmann P, Boeld TJ, Eder R, et al. Loss of FOXP3 expression in natural human CD4+CD25+ regulatory T cells upon repetitive in vitro stimulation. Eur J Immunol. 2009;39:1088-1097.
6. Miyara M, Wing K, Sakaguchi S. Therapeutic approaches to allergy and autoimmunity based on FoxP3+ regulatory T-cell activation and expansion. J Allergy Clin Immunol. 2009;123:749-755.
7. Miyara M, Yoshioka Y, Kitoh A, et al. Functional Delineation and Differentiation Dynamics of Human CD4+ T Cells Expressing the FoxP3 Transcription Factor, Immunity. 2009;30:899-911.
8. Noelle RJ, Roy M, Shepherd DM, Stamenkovic I, Ledbetter JA, Aruffo A. A 39-kDa protein on activated helper T cells binds CD40 and transduces the signal for cognate activation of B cells. Proc Natl Acad Sci, USA.1992;89:6550-6554.
9. Schwarting R, Biedobitek G, Stein H. Cluster report: CD69. In: Knapp W, Dörken B, Gilks WR, et al, eds. Leucocyte Typing IV: White Cell Differentiation Antigens. New York, NY: Oxford University Press; 1989:428-432.
10. BD Vacutainer CPT. Product Insert. 1/2003. Part number 8011638.
11. BD Pharmingen Human Regulatory T Cell Sorting Kit. Technical Data Sheet. 560753 Rev. 0.
12. BD Pharmingen Human FoxP3 Buffer Set. Technical Data Sheet. 560098 Rev. 5.
13. Basu S, Golovina TN, Mikheeva T, June CH, Riley JL. Cutting edge: Foxp3 mediated induction of pim 2 allows human T regulatory cells to preferentially expand in rapamycin. J Immunol. 2008;180(9):5794-5798.
14. BD FastImmune Human Regulatory T Cell Function Kit. Technical Data Sheet. Part number 23-11178-00.
15. Brusko TM, Putnam AL, Bluestone JA. Human regulatory T cells: role in autoimmune disease and therapeutic opportunities. Immunol Rev. 2008;223:371-390.
16. BD FACSAria II User’s Guide. Part number 644832. Rev B, 2009.
17. McIntyre CA, McCord R, Vrane D. Decontamination of the BD FACSAria II System Using the Prepare for Aseptic Sort Procedure. BD Biosciences Application Note, Dec 2008. Part number 23-100042-00.
18. McIntyre CA, Reinin G. Reduction in Endotoxin Levels After Performing the Prepare for Aseptic Sort Procedure on the BD FACSAria II Flow Cytometer. BD Biosciences Application Note, February 2009. Part number 23-10615-00.
BD Biosciences has several tools for the identification, isolation, and multicolor analysis of human regulatory T cells.
Visit bdbiosciences.com/treg for additional information.
For Research Use Only. Not for use in diagnostic or therapeutic procedures.

Application Note
Human Regulatory T-Cell Isolation and Measurement of Function
BD Biosciences
March 2010
BD Biosciences2350 Qume DriveSan Jose, CA 95131US Orders: [email protected]
For Research Use Only. Not for use in diagnostic or therapeutic procedures.
BD FACSAria and BD FACSAria II cell sorters and BD FACSCanto and BD LSR II flow cytometers are Class I (1) laser products.
Alexa Fluor is a registered trademark of Molecular Probes.
CELL-DYN is a registered trademark of Abbott Laboratories.
Cy is a trademark of Amersham Biosciences Corp. Cy dyes are subject to proprietary rights of Amersham Biosciences Corp. and Carnegie Mellon University and are made and sold under license from Amersham Biosciences Corp. only for research and in vitro diagnostic use. Any other use requires a commercial sublicense from Amersham Biosciences Corp., 800 Centennial Avenue, Piscataway, NY 08855-1327, USA.
Dynabeads is a registered trademark of Invitrogen.
Ficoll-Paque is a trademark of GE Healthcare.
Flow Jo is a trademark of Tree Star, Inc.
Vi-Cell is a trademark of Beckman-Coulter.
VWR is a registered trademark of VWR International.
X-VIVO is a trademark of Lonza Walkersville Inc.
BD, BD Logo and all other trademarks are property of Becton, Dickinson and Company. © 2010 BD
23-11485-00