human life history traits on a parasitic landscapes
TRANSCRIPT

ral
nate ì: 274-
ated ,al of
ulin
sion
:ton
of 5-34. uence
I
ce and 3f
èrtility 1 gs of
ceton. does i 266:
I
I
Evolutionary Biology of Host-Parasite Relationships: Theory Meets Reality R. Poulin, S. Morand and A. Skorping (Editors) O 2000 Elsevier Science B.V. All rights reserved.
143
Human Life History Traits on a Parasitic Landscape
J.-F. Guégan' and A.T. TeriokhinaSb
a Centre d'Etudes sur le Polymorphisme des Micro-organismes, U.M.R. C.N.R.S./I.R.D. 9926, Centre I.R.D. de Montpellier, 91 1 avenue du Val de Montferrand, Parc Agropolis, F- 34032 Montpellier cédex 1, France.
b Department of Biology, Moscow State University, Moscow 1 19899, Russia.
1. INTRODUCTION
In 1798, Malthus in his first Essay on the Principle of Population argued that in order to maintain a balance between human population and food supply, population growth is inevitably checked by mortality-inducing processes and represents a fundamental regulator of population. Doubtless, demographic crises for the eighteenth and presumably previous centuries in north-western Europe were a response to the onset of variable mixes of famine, epidemics and wars (Jones 1990; Dormandy 1999). In tropical and sub-tropical areas, people are at present strongly affected by multiple infectious diseases like yellow fevec, malaria and bilharzia, which did not occur, or were much less serious, in the early development of Western nations (Anderson and May 1991; Ewald 1994). Even if relationships between harvests and human mortality have influenced short-term fluctuations of population in the past (malnutrition itself is rarely a killer, it lowers resistance to fatal infectious diseases), the current view is that of a neo-Malthusian crboom and busb model in which human populations in the past, and possibly a few primitive tribes today, have been regulated by the unpredictable waxing and waning of epidemics (Anderson and May 1978). For instance, epidemics have been responsible for the relative decimation of indigenous populations in the Americas and the Pacific after contact with European diseases in the colonial era (Combes 1995).
Although infectious diseases are accepted as having a major impact on human population demography around the world (Anderson & May 1991; Ewald 1994), desperately few investigations have been made to relate how these diseases have shaped human biology and vice versa.
Many ecologists studying parasitism have stressed the importance of an evolutionary approach (Price 1980; Levin and Pimentel 1981; Anderson and May 1982; Ewald 1983; May and Anderson 1983), but human epidemiology has traditionally stood outside of the influence of evolutionary concepts (but see Ewald 1994; Nesse and Williams 1994; Stearns 1999 for evolutionary thinking into human health and disease).
* Corresponding author: JFG. E-mail: gueean8cepm.mpl.ird.fr. J.F.G. was supported by I.R.D. and A.T.T. by C.N.R.S through a senior research grant.

144
One way of describing human population bio-demographic characteristics is to consider the interaction of several processes, most, but not all of which are associated, directly or indirectly, with economic development. Thus, the key-proximate determinants of human bio- demographic characteristics are those generally related to development, modernisation programmes, culture and family planning practices, geographical and climate descriptors (Jones 1990; Borgerhoff Mulder 1998). Particular problems in many less developed countries are systematically attributed to variables of economic development which strongly contrast with those prevailing in Western nations. However, the majority of less developed countries are currently in low latitudes where a warm and humid climate is ideal for several diseases to develop. In addition, there has traditionally been a very poor overlap between medical epidemiologists and evolutionary biologists, and biological factors such as parasitic constraints (see also Clayton & Moore 1997; Poulin 1998) have been too rarely assessed in studies of human life histories.
In contrast, an important debate nowadays exists to elucidate the different ways in which parasites may interfere with bio-demographic characteristics in animal species (Lively 1987; Hochberg et al. 1992; Forbes 1993; Lafferty 1993; Michalakis & Hochberg 1994; Maller 1997). For instance, empirical evidence demonstrates that faced with virulent parasites, hosts should adjust their reproductive biology by increasing reproductive output and/or reducing age at maturity (Minchella 1985; Hochberg et al. 1992; Stearns 1992; Frank 1996; McNamara & Houston 1996; Sorci et al. 1996; Reeson et al. 1998; Kris & Lively 1998; Brooke et al. 1998; van Baalen 1999). Such life history trait adjustments should be mediated by genetic change or via phenotypic plasticity (Minchella & LoVerde 1981; Pianka 1988).
In this paper, we consider the relative importance bf infectious disease species richness and composition as possible causes of inter-country differences in human life history, while controlling for other potentially influential variables such as economic and geographical parameters. We here argue that parasitic pressures is a missing ingredient in human population studies, and we show that a better understanding of the causes and consequences of variation in human evolution can give markedly different pictures of what really exists.
2. MATERIALS AND METHODS
2.1. Materials The data for analysis were compiled for a total set of 165 different countries using large
global data sets which are now widely available and which make such macroscale study entirely relevant.
2.1.1. Spatial patterns We considered five eco-geographical variables, which may affect the variation of
infectious disease diversity and human characteristics across countries. These spatial descriptors are those which are (i) usually invoked to explain the distribution of free-living species (Brown 1995; Rosenzweig 1995) and (ii) are also considered as the most influential parameters of human traits (Jones 1990) on a large scale. They are: (1) total surface area of a given country (in square-km); (2) mean latitude (in degrees, which refers to the value taken at the geographical centre of each country); (3) mean longitude (in degrees, measured as previously). The two first variables were log-transformed in order to minimise effects of non- normality on statistical analysis (Zar 1996). Furthermore, we considered whether or not a country was located (4) in the Northern (coded O) or Southern Hemisphere (coded l), and (5) on a landmass (coded O) or an island (coded 1). Such spatial information can be accepted as
I
ICS is to consider iated, directly or its of human bio- t, modemisation mate descriptors ieloped countries strongly contrast !eloped countries :veral diseases to ,etween medical Ich as parasitic arely assessed in
nt ways in which es (Lively 1987; ‘rg 1994; M~l l e r !t parasites, hosts andor reducing
,996; McNamara )8; Brooke et al. liated by genetic i). species richness fe history, while !nd geographical dient in human nd consequences really exists. -
itries using large nacroscale study
the variation of .. These spatial on of free-living most influential
surface area of a he value taken at ?s, measured as ;e effects of non- vhether or not a :oded l), and (5) n be accepted as
I
I
i ~
I
I
I
I
I
I
I
145
reflecting other potential physical variables influencing infectious disease species distribution and human characteristics, e.g. temperature andor ecosystem productivity. Data were compiled from World Atlas v, 2.1 .O O.
2.1.2. Economic and social patterns Because both infectious diseases and human traits may differ across countries
experiencing more or less urbanisation, having more or less inhabitants, or allocating more or less financial supports for health care, we also compiled demographic and economic data for the 165 countries. Data for population geography were essentially obtained from the 1992 World population data sheet (Jones 1990). Three social or economic parameters were retained for each country: (1) per capita gross national product (GNP in US$ a year); (2) total population (in number of people per country) noted “Population” in illustration; (3 ) population density (number of people per square-km) noted “PopDensity” in illustration. The two first variables, i.e. GNP and total population, were log-transformed.
2.1.3. Historical patterns Intuitively, we can easily admit that humans from two ethnic groups may share similar
traits or they may harbour the same infectious diseases, or group of Co-occurring diseases, as a result of their common history (Harvey and Pagel 1991; Martins 1996). These pattems may be inherited from either behavioural factors shared by two ethnic groups or genetic similarity between two given tribes, or by both these behavioural and biological factors. In order to deal with the confounding effect of common history, we used the human group phylogeny based on the findings of Cavalli-Sforza et al. (1994). We decided to consider the eight large divisions of ethnological groups: I: Africans and Nilotics (except native people from the Maghreb); II: Europeans (including people from the Middle-East); III: Indians; IV: Mongoloids, Japanese and Koreans; V: Amerindians; VI: New Guineans-Papous; VII: Melanesians; VIII: Mhongs, Khmers, Thais, Filipinos, Indonesians and related tribes. In addition, a ninth category was assigned to Creoles from Caribbean islands. Then, we assigned a value to these variables only for countries with at least 50 per cent of inhabitants belonging to one ethnological group. For countries with a high ethnical polymorphism, e.g. Brazil, former Soviet Union and South Africa, no coding was assigned.
2.1.4. Religion patterns We considered the five main groups of religions distributed across countries: I: Moslems,
II: Christians (Catholics, Protestants, Orthodox) and Jews; III: Hinduists; IV: Shintoists and related religions; V: Animists, and we assigned a category to a country when at least 50% of inhabitants belong to one major religion.
2.1.5. Human life history and demographic trait patterns In this study, we used five different human life history and demographic traits susceptible
to interfere with socio-economical, e.g. GNP, and infection conditions: (1) fertility, which indicates the productivity or fertility as number of offspring bom to a woman per lifetime passing through the child-bearing ages; (2) female life expectancy at 1 year which provides a realistic snapshot of lifespan (infant mortality acts mainly during the first year of life) throughout the life history; 3) infant mortality rate in the first year of life (per 1,000 live births), noted “ZnjMort” in illustration; 4) total death rate (per 1,000 people) and 5) total population growth (per 1,000 people), which gives an estimate of the reproductive capacity of a population, and noted “PopGrowth” in illustration.
.
146
2.1.6. Infectious disease patterns Disease occurrence in the 165 different countries were mainly compiled from information
available on two Web Sites, the World Health Organisation (Geneva, Switzerland at http://www.WHO.int/) and the Centers for Disease Control and Prevention (Atlanta, USA at http://www.CDC.gov/). We used a data set of 15 categories of human diseases, both parasitic and contagious ones, which are in many ways the current most dreadful killers occurring on Earth. When information at the species level was not available, we decided to pool these data by category of diseases. Disease categories (with their corresponding code used in illustration if different from original) are as follows: Hepatitis A (“HepA”), Hepatitis B (“HepB”), Malaria, Schistosomiasis (L'Schistes''), Filariasis (“Filaria”), Meningococcosis (“Meningo”), Yellow fever (“Yellow”), Dengue fever (“Dengue”), Cholera, Trypanosomiasis (“Trypano”), Dracunculiasis (“Dracur~cu”), Chagas, Lyme, cutaneous Leishmaniasis (“CLeish”) and visceral Leishmaniasis (“VLeish”). The presence-absence of each disease was considered in analysis, and then, we calculated the total infectious disease species richness per country (noted “Parasites” in illustrations) that actually represents the available pool of parasitic infections to humans. We are absolutely conscious that this list of infectious diseases represents only a brief part of all pathogens parasitising humans but it is sufficient for the purpose of this research which is to determine whether pathogens, when considered as a potential variable, may have played a role on human life history characteristics, and vice versa.
2.2. Methods There are appreciable intercorrelations among the different variables above, and it
becomes difficult to assess the relative effect of each variable. In addition, it is generally admitted that modern efforts (modernisation, education, economic progress,. . .) have made a significant difference, rather than merely a trivial one, on human characteristics. In order to deal with this multicollinearity, two complementary data analysis procedures were used.
First, we used MultiDimensional Scaling (MDS) analysis (most currently available statistical packages have MDS procedures) to obtain two-dimensional representations of the dissimilarities (measured as 1 minus the absolute value of the Pearson’s correlation coefficient, d = 1-lrl) between the different variables mentioned above (Schiffman et al. 1981; Barbujani and Excoffier 1999 for a biological application). Absolute values of r (instead of r themselves) were preferred because we were interested in visualising the strength of correlations but not their direction (which indeed depend on rather arbitrary choice of units for variables). In addition, no statistical distribution assumptions are used in MDS procedure. Once we have the two-dimensional map, it is easy to visualise the location of and navigate between variables, and to explain the dissimilarities between variables in terms of fewer underlying relationships.
Two groups of correlation matrices between the different variables were generated: (1) the matrices of first group were computed for the variables listed in sections 2.1.1 to 2.1.5 plus the total infectious disease species richness (from item 2.1.6); and (2) the matrices of second group with the same variables as listed in sections 2.1.1 to 2.1.5 plus the 15 infectious diseases (item 2.1.6). This procedure was repeated 5 times: (1) for the total set of countries, (2) only for African, (3) only for continental South American, (4) only for south-east Asian, and (5) only for Western, countries.
MDS scatterplots were built using a function minimisation algorithm that provides the optimal configuration with the best goodness-of-fit between the scatterplot configuration and the original dissimilarity matrix measured by a standardised stress coefficient. This is defined
from information , Switzerland at (Atlanta, USA at es, both parasitic lers occurring on o pool these data ;ed in illustration itis B (“HepB’), 1s is (“Men ingo”), a i s (“Trypano”),
(“CLeish”) and ’as considered in ness per country pool of parasitic fectious diseases sufficient for the considered as a
xistics. and vice
:s above, and i t n, it is generally ...) have made a stics. In order to were used.
xrently available sentations of the ;on’s correlation ‘fman et al. 1981; of r (instead of r the strength of
y choice of units MDS procedure.
i of and navigate i cerms or tewer
*re generated: ( I ) ins 2. I . 1 to 2.1.5 ) the matrices of the 15 infectious
I set of countries, south-east Asian.
that provides the sonfiguration and it. This is defined
147
as the square root of the sum of squares of differences between estimated and original distances, divided by the sum of squares of estimated distances. The smaller the stress value, the better is the fit of the reproduced distance matrix of the scatterplot to the original distance matrix. Two-dimensional configurations were drawn for all the 10 correlation matrices mentioned above.
Second, we used more conventional statistical methods (Sokal and Rohlf 198 I), two-way analysis of variance (ANOVA) and analysis of covariance (ANCOVA), to examine the factors influencing the variability of human fertility and lifespan across countries.
The two-way ANOVA model included two factors and their interaction term: the first factor being or the total infectious disease species richness, or the presence of an individual infectious disease, or the presence of a group of Co-occurring species, and the second factor being the gross national product (GNP) categorised into 10 different classes. GNP classes with only presence or only absence of a disease were withdrawn from analysis. For two-way ANOVA, GNP were categorised into different categories as follows: Class1 < US$150; US$lSO 5 Class2 < US$300; US$300 5 Class3 < US$500; US$500 5 Class4 < US$l,OOO; US$l,OOO 2 Class5 < US$1,500; US$1,500 2 Class6 < US$3,000; US$3,000 5 Class7 < US$5,000; US$5,000 2 Class8 < US$lO,OOO; US$lO,OOO 5 Class9 < US$20,000; Class10 2 US$20,000. It was not possible to directly use the total infectious disease species richness because of insufficient numbers of observations in classes (especially when crossing with GNP). Hence, we decided to categorise this variable in two classes: (1) richness I 5 species, and (2) richness > 5 species. Concerning infectious disease species composition, we separated between countries experiencing the Co-occurring presence of Malaria-Dengue-Yellow- Cholera-Meningococcosis-Trypanosomiasis-Dracunculosis~Schistosomiasis (coded 1) and between countries not harbouring this group of diseases (coded O). For ANCOVA, GNP was used as a continuous covariate variable when evaluating the effect of different categorised factors measuring the intensity of disease. The advantage of two-way ANOVA consists in obtaining more detailed and easily visualised results while ANCOVA prevents from getting misleading significance probab es because of insufficiently fine discretising of GNP. In these analyses, as well as testing the efficacies of two-way ANOVA and ANCOVA separately, we also tested them against each other.
Significance levels in multiple comparisons (the different infectious disease categories against fertility and lifespan) were corrected according to the sequential Bonferonni method. The i-th comparison was considered as significant at a=0.05 if the computed probability level p, was lesser than d(l+k-i), where k is the total number of comparisons (Rice 1989; Peres- Neto 1999).
In addition, as recently pointed out by Poulin and Morand (1999), the geographical distance between component parasite species communities might be an important source of similarity between them both in terms of species richness and composition. Though our interest was not intended to test the likelihood that exchanges of infectious diseases occur between adjacent countries, we should properly control for distances in our statistical analysis with the subsequent deflation of degree of freedom that happens. Thus, in order to deal with the confounding effect of geographical disease similarities across nations, we used the mean longitude and latitude parameters as covariates of disease species richness and composition to explain both fertility and lifespan variables.
All statistical analysis were performed with Systat 8.0 (Wilkinson et al. 1998) for a personal PC computer.
I
148
3. RESULTS
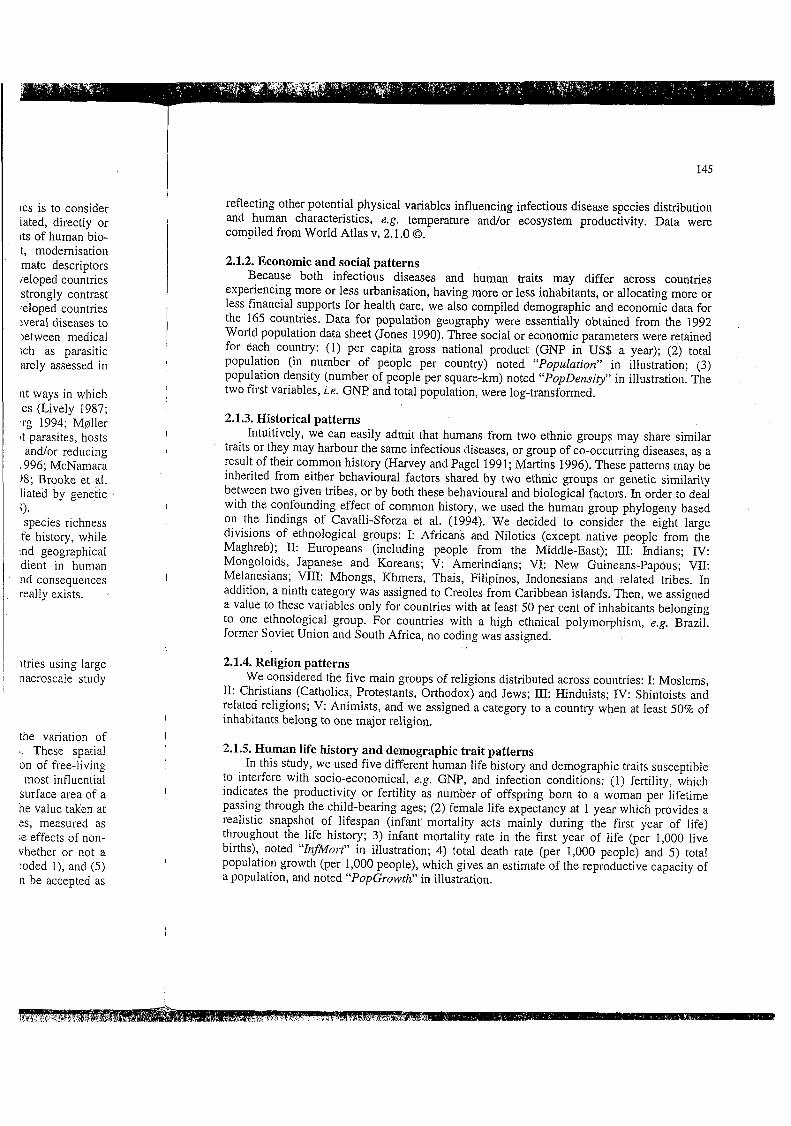
3.1. MDS analysis In Figures 1 to 3, 6 scatterplots visualising relationships between different variables for
different groups of countries are presented. Namely, Figures l a and l b are drawn on the base of correlations computed for all countries, Figures 2a and 2b for only African countries and Figures 3a and 3b for only Westem countries.
We see on Figure la, a group of clustered variables formed by five human life history and demographic variables (fertility, lifespan, population growth, infant mortality, total death rate), by the total number of parasite species, by one economic variable (GNP), two ethnic (Africans-Nilotics and Europeans) variables and one geographic parameter (Latitude). Figure 1 b, in which total disease species richness has been substituted by specific infectious disease occurrences, illustrates a similar clustering of the same group of variables and, in addition, Cholera, Trypanosomiasis, Yellow fever, Filariasis, Meningococcosis, Malaria, Schistosomiasis, Dracunculiasis (and, in a lesser extent, Dengue fever, Lyme disease, and one religion, Animists).
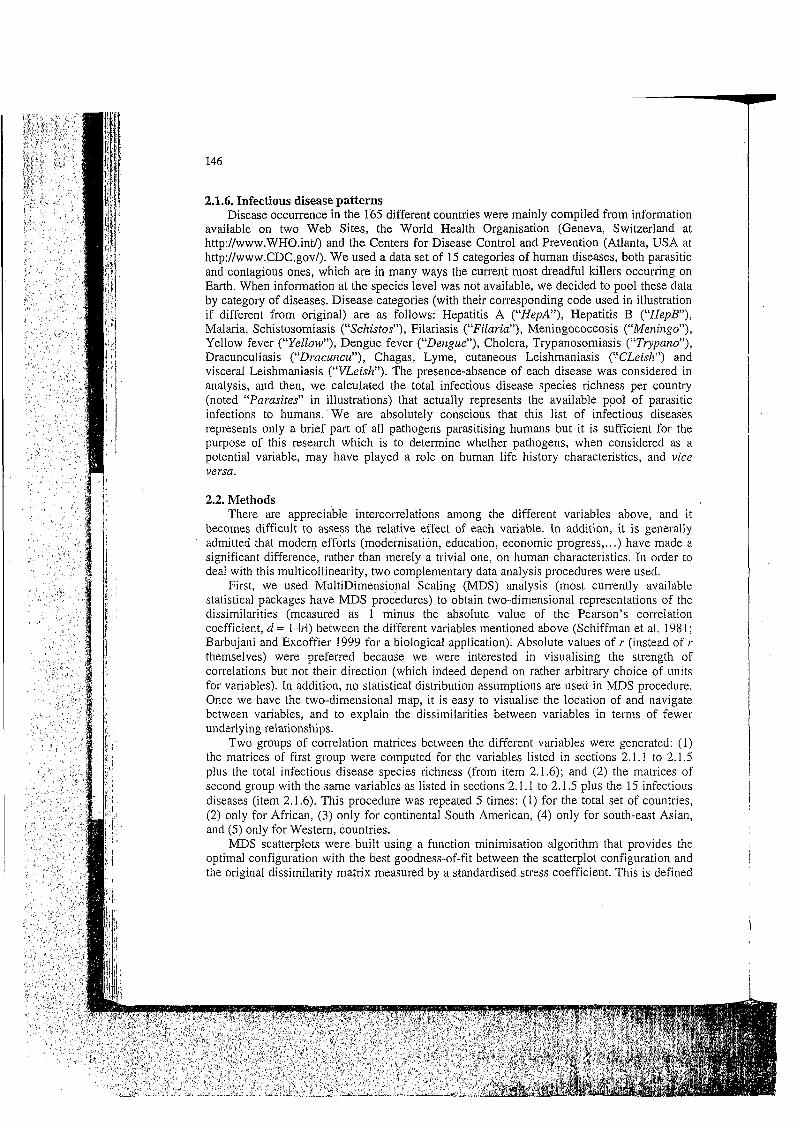
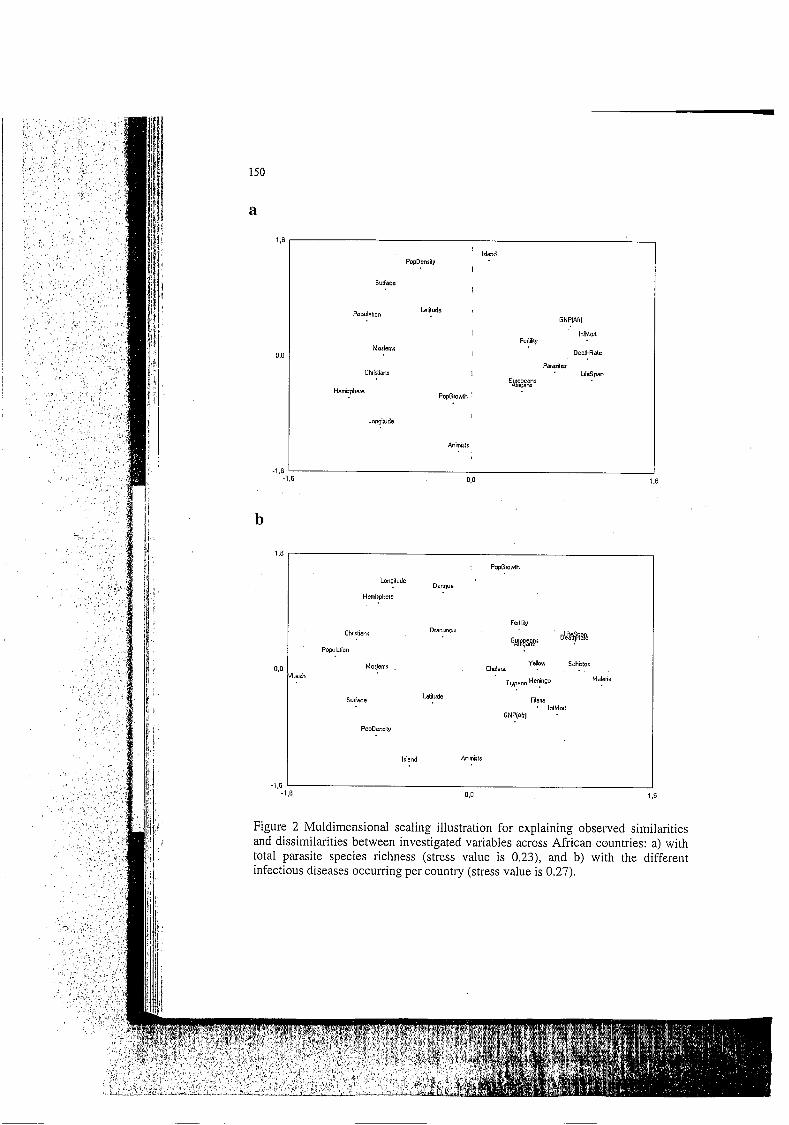
For only African countries, as illustrated on Figure 2a, we also observe a group of clumped variables including the same four human life history and demographic variables as mentioned above, plus the total parasite species richness, two ethnic (Africans-Nilotics and Europeans) tribes and the GNP incomes. Contribution of infectious diseases for African countries on Figure 2b indicates a relatively appreciable clustering of the same set of variables as previously shown plus Malaria, Schistosomiasis, Yellow fever, Cholera, Meningococcosis, Trypanosomiasis and Filariasis.
The picture obtained for only South American countries shows a more fuzzy pattem in the distribution of variables with a somewhat weaker similarity between disease species number and composition variables and human life history and demographic trait parameters (for brevity, we do not present the corresponding figure).
The configuration of variables for south-east Asian countries (also not illustrated) shows a similar clustering of variables as that obtained for African countries when the total number of disease species has been considered in analysis. But, when plotting the different diseases instead of total parasite species richness, we see that only Cholera (and to a lesser extent Malaria, Hepatitis A and Schistosomiasis) is correlated to the life history traits, and three demographic and economic variables, i.e GNP, infant mortality and death rate.
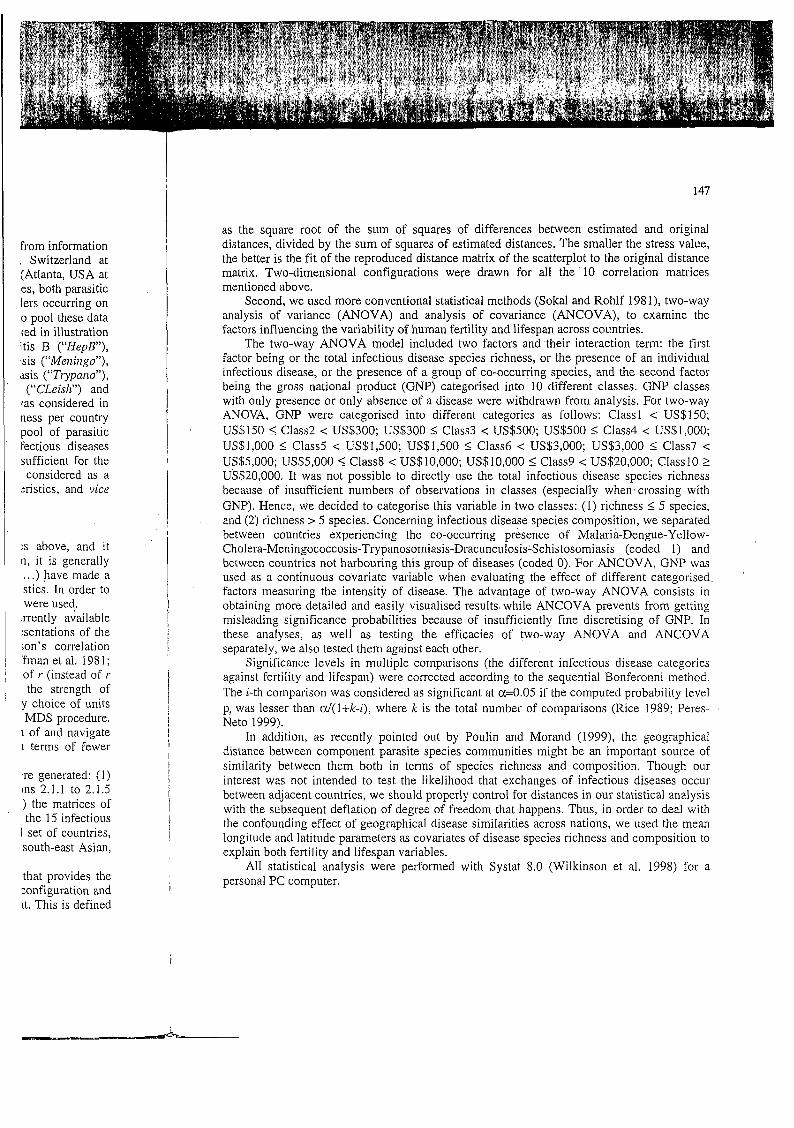
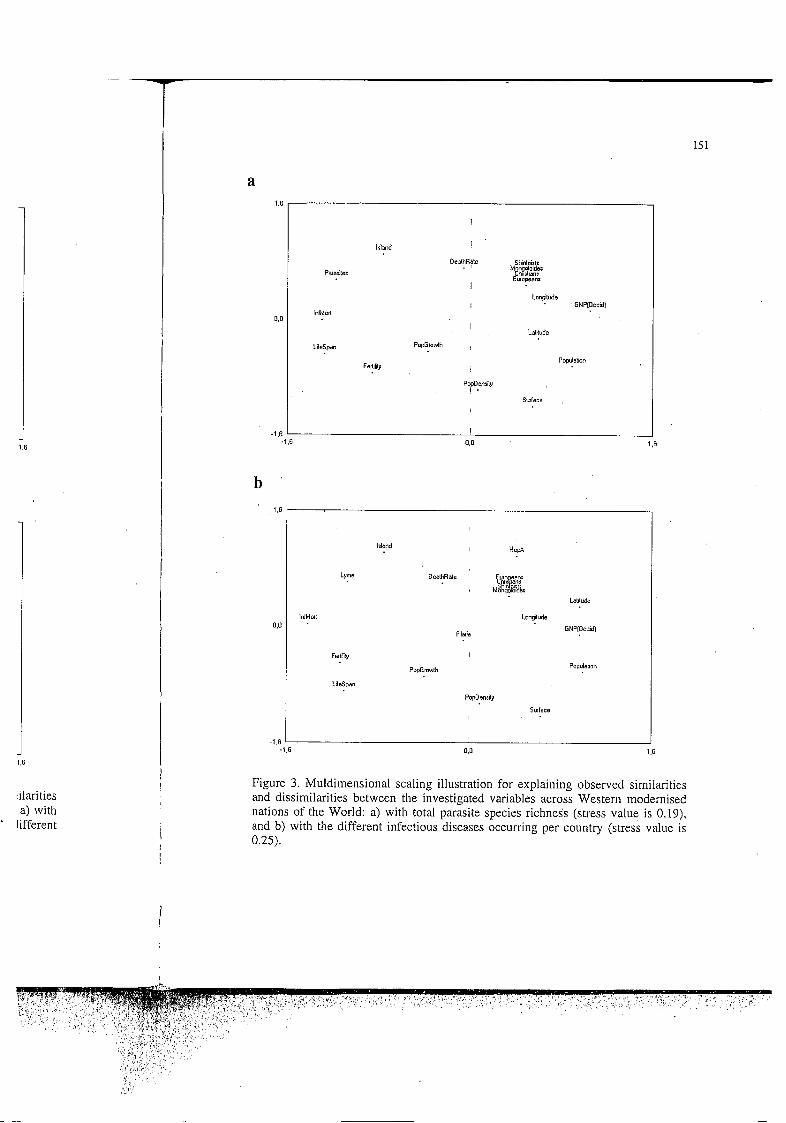
Concerning Westem countries, MDS analysis does not show any clear clustering of variables (Figure 3a,b) even if we observe that the life history and demographic variables, i.e. fertility, lifespan and infant mortality, are somewhat much more associated to the parasite species richness, and to one disease in particular, i.e. Lyme disease, than to other variables. In contrast to the results obtained for other continents, we observe that for Western nations, the GNP variable is not connected to any of these variables.
3.2. Two-way ANOVA and ANCOVA
When focusing on the intricate relationships that may exist between human characteristics, modem conditions and parasitic pressures, we show, as illustrated on Table 1, that both two-way ANOVA and ANCOVA analyses select a group of infectious diseases which shows a significant relationship with human fertility when the GNP effect has been controlled for. These are Schistosomiasis, Malaria, Trypanosomiasis, cutaneous Leishmaniasis, Yellow fever (but not significant when controlling for geographical distances

rent variables for rawn on the base :an countries and
.n life history and ality, total death jNP), two ethnic Latitude). Figure nfectious disease and, in addition, cosis, Malaria, disease, and one
;ewe a group of phic variables as :ans-Nilotics and ases for African ie set of variables Aeningococcosis,
. fuzzy pattem in I disease species ; trait parameters
Ilustrated) shows the total number
different diseases o a lesser extent traits, and three e. ear clustering of hic variables, i.e. .d to the parasite Ither variables. In stern nations, the
between human :rated on Table 1, ifectious diseases ? effect has been iasis, cutaneous .aphical distances
a
0,O
.I f . ,- -1.6
b
lnduirlt i Indians
Guineans
1 Hemisphere PopDensilY
' Moslems Cleolet
Populalion . i i Feilil@pGFwlh
'*'and Christians Eurppcqn's . LileSpanCiNP Laludc
Alricak'~!des Mongoloider . Shinloirls . . ' DealhRsle
I Longitude
Animirlr Mhongr
Melanerianr
Amemdianr
0.0 1.6
1.6 G"i!lea"S
Lymc
Latitude
Longitude C z # k Irland Christians
Populallon . Marlcmr Hey? I
149
-1.6 ' I -1.6 1 .6
Figure 1. Muldimensional scaling illustration for explaining observed similarities and dissimilarities between investigated variables across a set of 165 countries: a) with total parasite species richness (stress value is 0.27), and b) with the different infectious diseases occurring per country (stress value is 0.29).
150
a
0.1
-1 .[
b
1 .€
0.0
' Island
I PopDenray
Suilace
Latitude Populabon
I
Motlemr I
Chiirtianr
PoDGiowth ! Hemisphere
Longitude
Animists
0.0 1.6
PoDGrowh
Dengue Longitude
Hemrpheie
Dlac""C" Chritlianr
Populallon
Morlemo sirh
Sutlace Latlude
Yellow Schlrtar Cholera
Malaria Trypano Men!ngo
Filaria . InlMoil GNP(A1.b) .
PopDenrily
-1.6
0.0 1.6 -1,6
Figure 2 Muldimensional scaling illustration for explaining observed similarities and dissimilarities between investigated variables across African countries: a) with total parasite species richness (stress value is 0.23), and b) with the different infectious diseases occurring per country (stress value is 0.27).
I .6
darities a) with
lifferent
I
I
a
3 I
ldand !
Parar il es
InlMorl 0.0
LtfeSpan
lo n p 1 u d c I ' GNP[Occid)
I
PopGiawlh , Latdude
Popula1lon Fei1,liIy
PopDendy / .
Sulface ,
-1.6 I I
0.0 1.6 -1.6
, Irland
DeslhRale
Filaria
PopGiomlh
Lelilude
GNP[Occi4
Papula1,on
PopDenrily
Svface
-1 6 E -1.6 0.0 1.6
Figure 3. Muldimensional scaling illustration for explaining observed similarities and dissimilarities between the investigated variables across Western modernised nations of the World: a) with total parasite species richness (stress value is 0.19), and b) with the different infectious diseases occurring per country (stress value is 0.25).
151

- Table 1. VI
Human fertility. Summary of two-way ANOVA and ANCOVA to examine the factors influencing human fertility across countries experiencing or not the presence of a-given disease. For ANOVA, GNP values have been categorised into 10 classes (see Materials and Methods), and only classes having both the presence and the absence of a given disease were kept for further comparisons. Then, two-way ANOVA with interaction term (Disease by GNP classes) were analysed. For ANCOVA, the GNP continuous variable was considered as covariate for the different infectious disease factors. Infectious disease species richness distinguishes between countries having equal or less species richness than 5 from countries having more than 5 species, and Co-occumng species correspond to a block of tropical infectious diseases (Malaria-Dengue-Yellow-Cholera-Meningococcosis-T~panoso~asis-Dracunculiasis-Schistosomiasis). Probability values which are not significant after consideration of geographic closeness are indicated by 1 in exponent vahe, and after consideration of multiple comparisons by 2 in exponent value. Degree of freedom (df) for effect and error, F-ratio and associated probability (p) level (ns, not significant at 5% level) are given for each factor.

Table 2. Human lifespan. Summary of two-way ANOVA and ANCOVA to examine the factors influencing human lifespan across countries experiencing or not the presence of a given disease. For ANOVA, GNP values have been categorised into 10 classes (see Materials and Methods), and only classes having both the presence and the absence of a given disease were kept for further comparisons. Then, two- way ANOVA with interaction term (Disease by GNP classes) were analysed. For ANCOVA, the GNP continuous variable was considered as covariate for the different infectious disease factors. Infectious disease species richness distinguishes between countries having equal or less species richness than 5 from countries having more than 5 species, and Co-occurring species correspond to a block of tropical infectious diseases (Malaria-Dengue-Yellow-Cholera-Meningococcosis-Trypanoso~~is-Dracunculiasis-Schistosomiasís). Probability values which are not significant after consideration of geographic closeness are indicated by 1 in exponent value, and after consideration of multiple comparisons by 2 in exponent value. Degree of freedom (dfi for effect and error, F-ratio and associated probability @) level (ns, not significant at 5% level) are given for each factor.
c u w

154
and taking into account multiple comparisons), Meningococcosis (but not significant when controlling for both geographical distances and multiple comparisons), and Dracunculiasis (but not significant when using a multiple comparison test in ANOVA results).
Conversely, Cholera, Filariasis, Dengue fever, Chagas disease, Lyme disease and visceral Leishmaniasis do not show a significant effect on fertility values when controlling for the potential influence of GNP, at least at this level of investigation. In addition, when separating between countries with a total parasite species richness less or equal to 5 species and countries with more than 5, both analyses yielded similar results concerning the effect of parasitic pressures on fertility when controlling for the effect of GNP estimates (but not significant when using a multiple comparison test in ANOVA).
Furthermore, when considering a block of Co-occurring infectious diseases that are more or less specific to tropical areas (Malaria-Dengue-Yellow fever-Cholera-Meningococcosis- Trypanosomiasis-Dracunculiasis-Schistosomiasis), we obtained a significant influence of this Co-occurring species group on fertility when the influence of GNP has been controlled (but ANOVA is not significant after a multiple comparison test).
Again, when considering the potential effect of infectious disease pressures on lifespan (Table 2), after controlling for the effect ~ of GNP, both two-way ANOVA and ANCOVA analyses select a group of diseases which present a significant relationship with this human trait. Interestingly, these are the same diseases as those implicated in fertility variability, except cutaneous Leishmaniasis which is not significant, and Filariasis (but ANOVA and ANCOVA are both not significant after multiple comparison tests). In addition, Yellow fever and Meningococcosis (but ANOVA not significant after a multiple comparison test) and possibly Chagas disease (but ANOVA is not significant) might show a relationship with
7- !.,,.......i . .
. .
......... ..... P ...... j j : i
<=5 >5
Tlrl ,.... * ! ........, ...... ~ (/....._. : i
..... ..... ./ ......... .... l-..p ,... .... 9 ...... ._ .... -1 , ...... ". : :
. . . . ; i . . i l
<=5 >5 c=5 >5 . . i !
rl G2g i
~
i : : ; . . . . ............................. ; i
<=5 >5 . . . .
<=5 >5 <=5 >5
~1 ..... eg .....i ..... ". : ! ". . . . . . . . .
. . . . . . . . ! ! i :
<=5 >5
~1 .. -.- ...... ; ,........
..........._... ..,,,,,,..... i ;
. . ...... ". i : : : . . . . . .
<=5 s5 Parasites Parasites Parasites Parasites Parasites Parasites Parasites Parasites Parasites Paräsitës
1 2 3 4 5 6 7 8 9 10 GNP
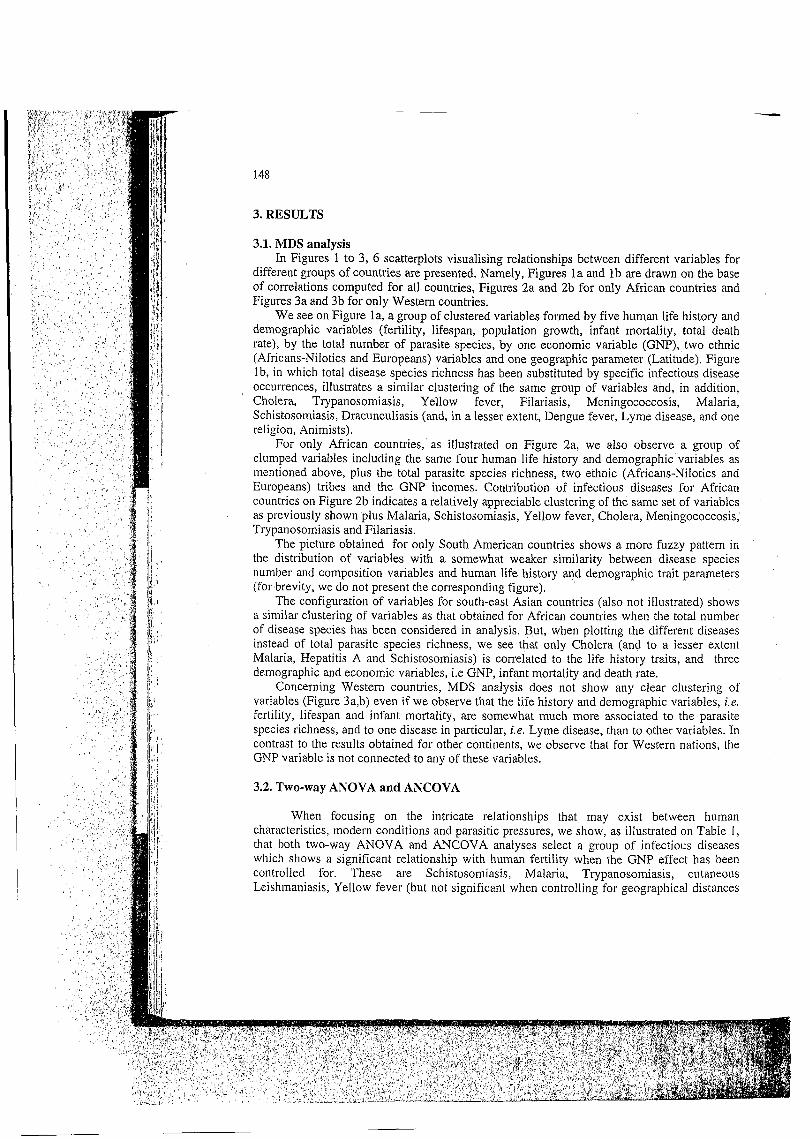
Figure 4. Plots of the predictors of fertility (upper row) and lifespan (lower row) with respect to the Global Net Product incomes (10 classes) and the infectious disease species richness (inferior or equal to 5, superior to 5) across the 165 countries. The upper row plots displays a negative relationship between fertility and GNP, but a positive relationship between fertility and the dichotomic parasite species richness variable (not significant when applying a Bonferonni correction, see Table 1). The lower row plots shows a positive trend between lifespan and GNP, and a negative association between lifespan and parasite species richness (not significant when applying a Bonferonni correction, see Table 2).
significant when id Dracunculiasis SI. sease and visceral ontrolling for the , when separating cies and countries :ffect of parasitic u t not significant
ises that are more Jleningococcosis- it influence of this -n controlled (but
isures on lifespan A and ANCOVA 1 with this human :rtility variability, but ANOVA and ion, Yellow fever iparison test) and relationship with ~1 ... " ............. " ~
...-y
'ip: ........ _ _. ............................. . . . .
: : . . . .
. . . . . . . ! ... _( ................. ~ . . . . . . . . . . . . . . . . . .
i : . . . . . . . . i t
c=5 >5 <=5 >5 Parasites Parasites
9 10
row) with respect e species richness I W plots displays a 3 between fertility when applying a ive trend between e species richness
155
.....
o 1 o 1 Parasites Parasites
..._.L.._..._.. I I
o 1 Parasites
o 1 o 1 Parasites Parasites
1 2 3 4 5 6 7 8 9 10 GNP
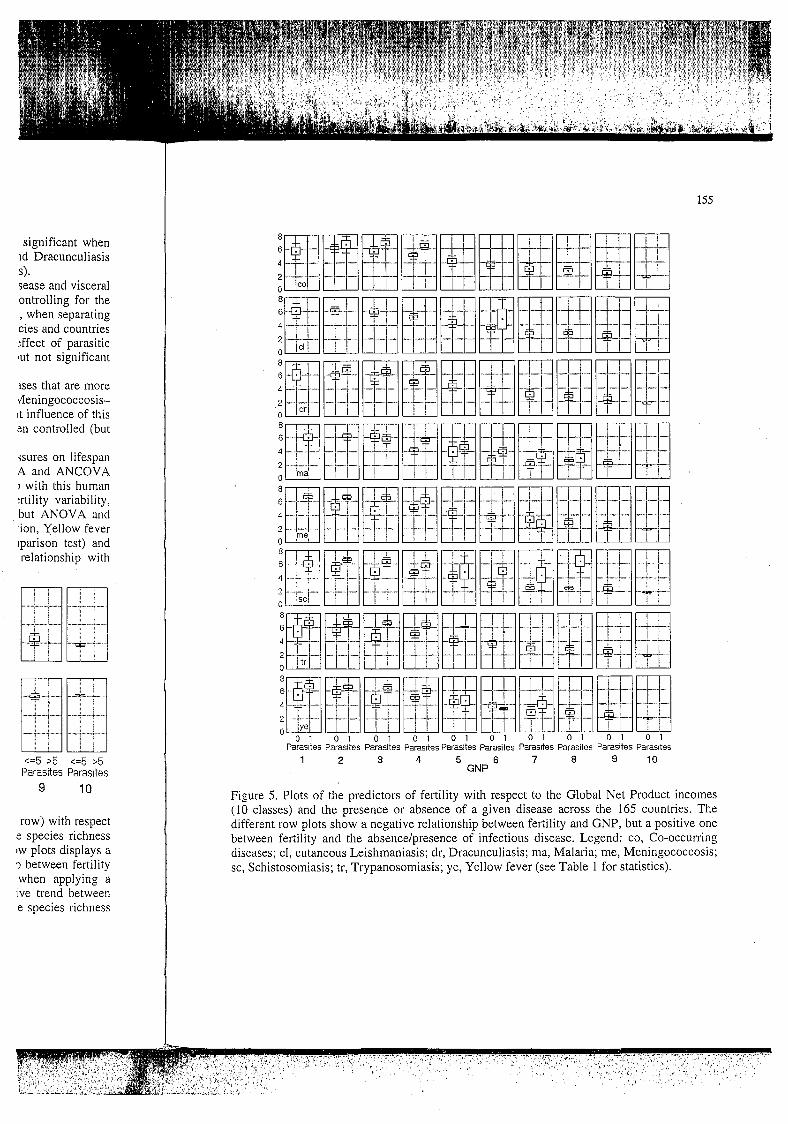
Figure 5. Plots of the predictors of fertility with respect to the Global Net Product incomes (10 classes) and the presence or absence of a given disease across the 165 countries. The different row plots show a negative relationship between fertility and GNP, but a positive one between fertility and the absence/presence of infectious disease. Legend: CO, Co-occurring diseases; cl, cutaneous Leishmaniasis; dr, Dracunculiasis; ma, Malaria; me, Meningococcosis; sc, Schistosomiasis; tr, Trypanosomiasis; ye, Yellow fever (see Table 1 for statistics).
156
human lifespan. When controlling for the geographical distances between nations, Malaria shows no significant effect on lifespan anymore (see Table 2).
When considering the total infectious disease species number per country and the block of Co-occurring species as previously mentioned, we obtain significant results indicating a possible effect of disease on human lifespan. Unfortunately, both results are not significant when applying an appropriate multiple comparison test (see Table 2).
In Figures 4 and 5, the ANOVA results are illustrated graphically. In Figure 4, the dependency of fertility and lifespan on parasites species richness and on GNP classes is presented. We see that, indeed, for most of the classes of GNP, average fertility is higher (and average lifespan, to the contrary, is lower) for the countries with total parasite species richness greater than 5 as compared with those where total parasite species richness is less than or equal to 5 (but see also corresponding Tables 1 and 2 for ANOVA).
Figure 5 illustrates the dependency of fertility (for lifespan the results are similar, except the inverse direction of changes, and for brevity they are not illustrated) on GNP classes and on the presence or absence of a block of Co-occurring diseases, or individual ones i.e. cutaneous Leishmaniasis, Dracunculiasis, Malaria, Meningococcosis, Schistosomiasis, Trypanosomiasis, Yellow fever (non-significant dependencies are not illustrated). Again, we observe that within classes with similar resource incomes, females experiencing the presence of those individual or Co-occurring diseases present, on average, higher offspring values than females living in countries free of these diseases. Both GNP incomes and disease occurrences show a strong influence on fertility with a negative relationship between fertility and GNP and a positive relationship between fertility and the presence-absence of relevant diseases.
4. DISCUSSION
The results of statistical analysis on both global and continental scales suggest that, overall, human life history traits, i.e. fertility, lifespan, across countries are strongly associated with both parasite species richness and composition and national net incomes. Multidimensional Scaling (MDS) approaches demonstrate that fertility, lifespan, parasites and GNP variables have very small distances in the two dimensional configurations that means that there exist strong correlations between all these variables. This pattern is particularly verified across the total data set of countries (global scale) and for African and southeast Asian countries, and to a lesser extent for Southern America (continental scales). In contrast, the two-dimensional solution across the set of Western countries clearly distinguish a cluster of variables formed by parasite species richness and composition, fertility, infant mortality and lifespan which is strongly disconnected from the GNP variable. The reasons seem to lie in the simple fact that the parasite species number variance seems to be greater than that observed for GNP data across Western nations. Nevertheless, on a global scale, we determine a cluster of variables in which fertility, lifespan, GNP, parasite species richness and composition plus two ethnic groups (Africans-NiIotics and Europeans) and one religion (Animists) are strongly associated which implies that this block of variables may statistically interact.
In using two-way ANOVA and ANCOVA techniques to detect the effect of infectious disease species richness and composition on fertility when GNP resource incomes have been controlled for, we confirm the above findings of a significant relationship between total parasitic pressures (or some particular infectious diseases) and human fertility across countries. Thus, human females experiencing the presence of some individual infectious
157
nations, Malaria
itry and the block sults indicating a ire not significant
In Figure 4, the i GNP classes is lity is higher (and e species richness ss is less than or
ire similar, except GNP classes and
lividual ones i.e. Schistosomiasis,
rated). Again, we cing the presence ,pring values than sease occurrences fertility and GNP vant diseases.
des suggest that, :rongly associated i1 net incomes. pan, parasites and ations that means :rn is particularly 'an and southeast ,ales). In contrast, .tinguish a cluster , infant mortality
%oris seem to lie in greater than that ale, we determine ies richness and and one religion i may statistically
'fect of infectious icomes have been lip between total n fertility across ividual infectious
I
l
I
diseases like Schistosomiasis, Trypanosomiasis, Malaria, cutaneous Leishmaniasis (always significant after different statistical controls) have higher fertility values than females living in countries with no such diseases, net incomes being held constant. Interestingly, when considering the simultaneous presence of a block of Co-occurring diseases (infectious diseases are not distributed at random but they match a nested species subset pattern in which a parasite species found in a given country with n species has a high probability of being found in all countries with n+l species), i.e. Malaria-Dengue-Yellow-Cholera-Meningococcosis- Trypanosomiasis-Dracunculiasis-Schistosomiasis, we observe a significant effect of this block of diseases on fertility values when GNP incomes have been accounted for (ANCOVA significant, ANOVA not significant when taking into account multiple comparisons). In addition, we observe that, when controlling for geographical closeness between countries, potentially promoting infectious disease richness and composition, Yellow fever and Meningococcosis do not show any specific pattern of relationship with fertility. Thus, the major influential infectious diseases on fertility in the less developed countries appears to be a group of water-borne diseases, which are recognised as the major killers of children in those areas.
In addition, two-way ANOVA and ANCOVA indicate a significant relationship between lifespan and the presence or absence of these individual or Co-occurring diseases when controlling for the effect of income. This strongly implies that within countries having the same net income product, people experiencing the presence of these infectious diseases live for a shorter time than those living in environments free of these parasites. Data are particularly significant for Schistosomiasis, Trypanosomiasis and Dracunculiasis for which both ANOVA and ANCOVA analyses give significant results.
There is a general agreement in attributing much of the observed variability in human life history characteristics to cultural, geographical and socio-economical variables (Jones 1990; Borgerhoff Mulder 1998). Current opinion of what really exists (human variability, life history characteristics) has been modelled on a Western intervention model originally designed for rich societies, so that the material poverty dogma and place of industrial growth are considered as the major causes of poor health in the Third World (Jones 1990). Although we did find that developmental variables expressed by the global net product per country do have significant associations with human fertility and lifespan across countries, when they are properly controlled for, there emerges a significant positive relationship between disease species diversity and fertility on one hand, and a significant negative relationship between disease species diversity and lifespan on the other hand. These findings confirm previous studies in which we showed that (i) human fertility variability was strongly connected to the environmental infectious disease pressures (Guégan et al. submitted), and (ii) there exists a tradeoff between human fertility and longevity (Thomas et al. 2000).
Our findings support some previous theoretical and empirical studies suggesting that there is a higher reproductive rate in areas with high parasitic pressures (see Introduction). Although data are currently insufficient to assess any causal mechanism between parasitism and human fertility, and between parasitism and human lifespan, our results demonstrate a strong association between parasitic pressures and human fertility, and between parasitic pressures and lifespan. Based on these arguments, it is likely that human traits such as fertility and lifespan might have been shaped by environmental factors such as parasitism, in conjunction with physiological and psychological mechanisms. Among other things, our work confirms that human features as traditionally revealed in ethnography, sociology or epidemiology (even if we do not exclude the influence of psychological, emotional or cognitive mechanisms!), have certainly been shaped by natural selection (see Hrdy 198 1,

I
158
1999, for instance). The evolutionary view is that decisions that influence family size have evolved to maximise biological fitness (see Gosden et al. 1999 for instance). Family size is thus considered to be an adaptation to local environmental and economical conditions. However, wealthy countries have on average the lowest fertility which is entirely in contradiction with any evolutionary explanation for family size in modern populations. The hypothesis that reproductive success might be an adaptative by-product of health, e.g. existence of evolved mechanisms between pathogens and humans, certainly needs to be investigated in future research work.
Interestingly also, from a strictly applied point of view directly relevant to health care, the financial costs of eliminating vectors involved in disease transmission must be weighted against two positive effects: (i) the reduction of transmission which represents a short-term benefit; (¡i) a possible evolutionary reduction in fertility and increase in lifespan as a long- term benefit.
5. CONCLUSION
To summarise, we demonstrated that on a global scale, and at lower continental level essentially for Africa and southeast Asia, an improved understanding of the intimate kinds of association between human traits and infectious diseases is absolutely needed. Further studies are required in both long-term field research and macro-ecological studies to fully understand the role played by parasite communities on humankind. Anyone interested in the consequences of variation in human traits, e.g. fertility increase, should also focus on the causes, accepting the fact that the biology of our species was shaped by its evolutionary past. Hence, i t does seem, then, that further progress in fertility reduction, and possibly its life expectancy corollary trait, in Third World countries will depend on a fundamental change in perception of the relationships between man and his associated infectious diseases. Even if i t is actually premature to detect between the roles played by adaptive phenotypic flexibility or by genetic differences on variations in life history traits (see Kohler et al. 1999 for a discussion on fertility), evolutionary theory may probably contribute to our understanding of human life history patterns. Given the grave problems caused by infectious diseases on human populations worldwide, an improved understanding of how parasites may have shaped human characteristics is certainly needed. Clearly, the setbacks to continued mortality reduction in the 1970s and the re-emergence-resurgence of dreadful killers, e.g. HIV, tuberculosis, advocate bridging the disciplinary gap between biomedical and evolutionary scientists!
We are indebted to the staff of C.E.P.M. at Montpellier (France) and people who attended the E.S.F. workshop (Evolutionar?) biolog? of host-parasite relntionship: reality meets morleh) held at Banyuls in May 1999. Special thanks are due to Robert Poulin, Serge Morand and Arne SkØrping for their invitation to come to the ESF workshop, and Phil Agnew for reviewing the manuscript. Detailed methods are available upon request from the first author.
REFERENCES
Anderson RM. May RM. 1978. Regulation and stability of host-parasite population interactions. II. Destabilizing processes. Journal of Animal Ecology 47: 249-267.
Anderson RM, May RM. 1982. Coevolution of hosts and parasites. Parasitology 85: 41 1-426.

family size have .). Family size is nical conditions. h is entirely in populations. The . of health, e.g. nly needs to be
o health care, the ust be weighted :nts a short-term èspan as a long-
continental level intimate kinds of I. Further studies fully understand
iterested in the Is0 focus on the volutionary past. possibly its life
mental change in seases. Even if i t rpic flexibility or t al. 1999 for a understanding of ,seases on human \le shaped human tlity reduction in [V, tuberculosis, scientists !
ple who attended u: reality meets in, Serge Morand
Phil Agnew for the first author.
xsite population 249-267.
)gy 85: 41 1-426.
159
Anderson RM, May RM. 1991. Infectious Diseases of Humans: dynamics and control. Oxford University Press, Oxford.
Barbujani G, Excoffier L. 1999. The History and Geography of Human Genetic Diversity. In: Evolution in Health & Disease (edited by SC Stearns). Oxford University Press, Oxford,
Borgerhoff Mulder M. 1998. The demographic transition: are we any closer to an evolutionary explanation? Trends in Ecology & Evolution 13: 266-270.
Brooke M de L, Davies NB, Noble DG. 1998. Rapid decline of host defences in response to reduced cuckoo parasitism: behavioural flexibility of reed warblers in a changing world. Proceedings of the Royal Society of London (B) 265: 1277-1282.
Brown JH. 1995. Macroecology. The University of Chicago Press, Chicago. Cavalli-Sforza LL, Piazza A, Menozzi P. 1994. History and geography of human genes.
Clayton DH, Moore, J. 1997. Host-Parasite Evolution. General Principles & Avian Models.
Combes C. 1995. Interactions durables. Ecologie et évolution du parasitisme. Masson
Dormandy T. 1999. A History of Tuberculosis. The White Death. The Hambledon Press,
Ewald PW. 1983. Host-parasite relations, vectors, and the evolution of disease severity.
Ewald PW. 1994. Evolution of Infectious Diseases. Oxford University Press, Oxford. Forbes MRL 1993. Parasitism and host reproductive effort. Oikos 67: 444-450. Frank SA. 1996. Models of parasite virulence. Quaterly Review of Biology 71: 37-78. Gosden RG, Dunbar RIM, Haig D, Heyer E, Mace R, Milinski M, Pichon G, Richner H,
Strassmann BI, Thaler D, Wedekind C, Stearns SC. 1999. Evolutionary interpretations of the diversity of reproductuive health and disease. In: Evolution in Health & Disease (edited by SC Stearns). Oxford University Press, Oxford, pp. 108-121.
GuCgan JF, Thomas F, Hochberg ME, Meeûs T de, Renaud F. (submitted). Parasite Diversity and Human Fecundity.
Harvey PH, Pagel MD. 1991. The Comparative Method in Evolutionary Biology. Oxford University Press, Oxford.
Hochberg ME, Michalakis Y, Meeûs T de. 1992. Parasitism as a constraint on the rate of life- history evolution. Journal of Evolutionary Biology 5: 491 -504.
Hrdy SB. 1981. The Woman that Never Evolved. Harvard University Press, Harvard. Hrdy SB. 1999. Mother Nature: A History of Mothers, Infants and Natural Selection,
Jones H. 1990. Population geography. Paul Chapman Publishing Ltd., London. Kohler H-P, Rodgers JL, Christensen K. 1999. Is fertility behavior in our genes: findings from
a (Danish) twin study.Popu1ation and Development Review 25: 253-288. Kris AM, Lively CM. 1998. Experimental exposure of juvenile snails (Potamopyrgus
antipodarum) to infection by trematode larvae (Microphallus sp.): infectivity, fecundity compensation and growth. Oecologia 1 16: 575-582.
Lafferty KD 1993. The marine snail, Cerithidea californica, matures at smaller sizes where parasitism is high. Oikos 68: 3-1 1.
Levin S, Pimente1 D. 1981. Selection of intermediate rates of increase in parasite-host systems. American Naturalist 117: 308-3 15.
pp. 27-40.
Princeton University Press, Princeton.
Oxford University Press, Oxford.
Editions, Paris.
London.
Annual Review of Ecology and Systematics 14: 465-485.
PantheonIChatto & Windus, New-York.

160
Lively CM 1987. Evidence from a New Zealand snail for the maintenance of sex by
Malthus TR. 1798. An Essay on the Principle of Population, Retrieved November 23,
Martins EP. 1996. Phylogenies and the Comparative Method in Animal Behavior. Oxford
May RM, Anderson RM. 1983. Epidemiology and genetics in the coevolution of parasites and
McNamara JM, Houston AI. 1996. State-dependent life-histories. Nature 380: 215-221. Michalakis Y., Hochberg, ME. 1994. Parasitic effects on host life-history traits: a review of
Minchella DJ. 1985. Host life-history variation in response to parasitism. Parasitology 90:
Minchella DJ, LoVerde, PT. 1981. A cost to early reproductive effort in the snail Biomphalaria glabrata. American Naturalist 118: 876-88 1.
Moller AP. 1997. Parasitism and the evolution of host life history. In: Host-Parasite Evolution: General Principles and Avian Models (edited by DH Clayton and J. Moore), Oxford University Press, Oxford, pp. 243-260.
Nesse RM, Williams G. 1994. Why we get sick: the new science of Darwinian medecine. Times Books, New York.
Peres-Neto PR 1999. How many statistical tests are too many? The problem of conducting multiple ecological inferences revisited. Mar. Ecol. Prog. Ser. 176: 303-306.
Pianka ER. 1988. Evolutionary Ecology. Harper and Row, New York,. Poulin R. 1998. Evolutionary Ecology of Parasites. From individuals to communities.
Poulin R, Morand S. 1999. Geographical distances and the similarity among parasite
Price PW. 1980. Evolutionary biology of parasites. Princeton University Press, Princeton. Reeson AF, Wilson K, Gunn A, Hails RS, Goulson D. 1998. Baculovirus resistance in the
noctuid Spodoptera exempta is phenotypically plastic and responds to population density. Proceedings of the Royal Society of London (B) 265: 1787-1291.
parasitism. Nature 328: 5 19-521.
1999, http://msumusik.mursuky.edu/-felwell/http/malthus/Index.html.
University Press, Oxford.
hosts. Proceedings of the Royal Society of London (B) 219: 281-313.
recent studies. Parasite 1: 291-294.
205-21 6.
Chapman and Hall Ltd., London.
communities of conspecific host populations. Parasitology 1 19: 369-374.
Rice WR. 1989. Analyzing tables of statistical tests. Evolution 43: 223-225. Rosenzweig ML. 1995. Species diversity in space and time. Cambridge University Press,
Schiffman SS, Reynolds ML, Young FW. 1981. Introduction to multidimensional scaling:
Sokal RR, Rohlf FJ. 1981. Biometry. The Principles and Practice of Statistics in Biological
Sorci G, Clobert J, Michalakis Y. 1996. Cost of reproduction and cost of parasitism in the
Stearns SC. 1992. The evolution of life-histories. Oxford University Press, Oxford. Stearns SC. 1999. Evolution in Health & Disease. Oxford University Press, Oxford. Thomas F, Teriokhin AT, Renaud F, de Meêus T, Guégan JF. 2000. Human longevity at the
cost of reproductive success: evidence from global data. Journal of Evolutionary Biology (in press).
Van Baalen M. 1998. Coevolution of recovery ability and virulence. Proceedings of the Royal Society of London (B) 265: 317-325.
Wilkinson L, Hill M, Vang E. 1998. Systat: Statistics, Version 8.0 Edition. Evanston, Illinois.
Cambridge.
Theory, methods, and applications. Academic Press, New York.
Research. Second Edition, WH Freeman & Co., New York.
common lizard, Lacerta vivipara. Oikos 76: 121-130.

mance of sex by
:d November 23,
Behavior. Oxford
ln of parasites and
3: 215-221. traits: a review of
Parasitology 90:
fort in the snail
In: Host-Parasite ' on and J. Moore).
winian medecine.
-m of conducting ;-306.
to communities.
among parasite ' '4.
ss, Princeton. . resistance in the ds to population 91.
University Press,
iensional scaling:
tics in Biological
parasitism in the
Ixford. Ixford. n longevity at the
of Evolutionary
lings of the Royal
vanston, Illinois.
161
Zar JH 1996. Biostatistical Analysis. Prentice Hall International Editions, Upper Saddle River, New Jersey.