human factors in urban water system safety: humans … factors in urban water system safety: humans...
TRANSCRIPT
Human Factors in Urban Water System Safety: Humans and Technology Steven Cloete, Tim Horberry and Brian Head
September 2012
Urban Water Security Research Alliance
Technical Report No. 80
Urban Water Security Research Alliance Technical Report ISSN 1836-5566 (Online)
Urban Water Security Research Alliance Technical Report ISSN 1836-5558 (Print)
The Urban Water Security Research Alliance (UWSRA) is a $50 million partnership over five years between the
Queensland Government, CSIRO’s Water for a Healthy Country Flagship, Griffith University and The
University of Queensland. The Alliance has been formed to address South East Queensland's emerging urban
water issues with a focus on water security and recycling. The program will bring new research capacity to South
East Queensland tailored to tackling existing and anticipated future issues to inform the implementation of the
Water Strategy.
For more information about the:
UWSRA - visit http://www.urbanwateralliance.org.au/
Queensland Government - visit http://www.qld.gov.au/
Water for a Healthy Country Flagship - visit www.csiro.au/org/HealthyCountry.html
The University of Queensland - visit http://www.uq.edu.au/
Griffith University - visit http://www.griffith.edu.au/
Enquiries should be addressed to:
The Urban Water Security Research Alliance Project Leader – Brian Head
PO Box 15087 The University of Queensland
CITY EAST QLD 4002 ST LUCIA QLD 4072
Ph: 07-3247 3005 Ph: 07- 346 7450
Email: [email protected] Email: [email protected]
Authors: The University of Queensland
Cloete, S., Horberry, T. and Head, B.W. (2012). Human Factors in Urban Water System Safety: Humans and
Technology. Urban Water Security Research Alliance Technical Report No. 80.
Copyright
© 2012 UQ. To the extent permitted by law, all rights are reserved and no part of this publication covered by
copyright may be reproduced or copied in any form or by any means except with the written permission of UQ.
Disclaimer
The partners in the UWSRA advise that the information contained in this publication comprises general
statements based on scientific research and does not warrant or represent the accuracy, currency and
completeness of any information or material in this publication. The reader is advised and needs to be aware that
such information may be incomplete or unable to be used in any specific situation. No action shall be made in
reliance on that information without seeking prior expert professional, scientific and technical advice. To the
extent permitted by law, UWSRA (including its Partner’s employees and consultants) excludes all liability to
any person for any consequences, including but not limited to all losses, damages, costs, expenses and any other
compensation, arising directly or indirectly from using this publication (in part or in whole) and any information
or material contained in it.
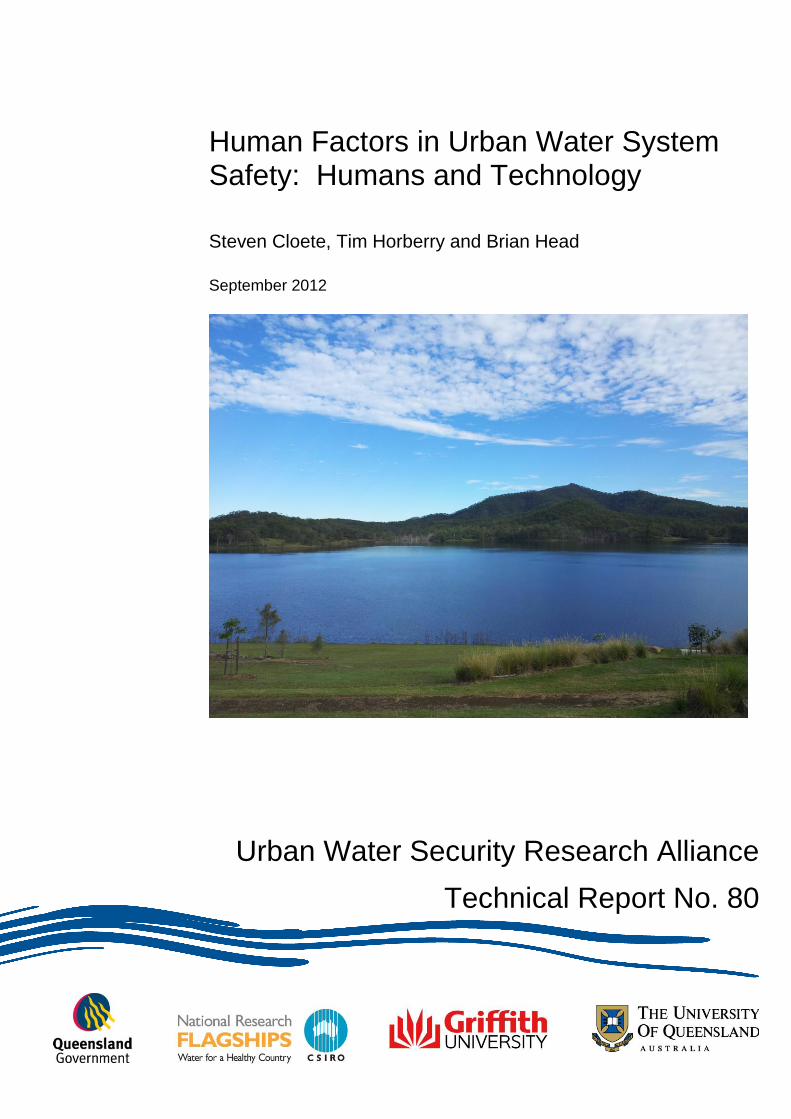
Cover Photograph
Description: Wyaralong Dam
Photographer: Steven Cloete
© 2012
Human Factors in Urban Water System Safety: Humans and Technology Page i
ACKNOWLEDGEMENTS
This research was undertaken as part of the South East Queensland Urban Water Security Research
Alliance, a scientific collaboration between the Queensland Government, CSIRO, The University of
Queensland and Griffith University.
Particular thanks go to a range of operators and water industry informants who kindly provided
information and insights concerning the operations of the water sector in South East Queensland.
Individuals are not listed for reasons of confidentiality, but include control room operators, managers
and water industry professionals.
Thanks also go to Scott Denner, SEQ Water Grid Manager, for his support and oversight as the Project
Champion, and to Brett Spink and the Risk Operations Committee for input into the planning and
focus of the project.

Human Factors in Urban Water System Safety: Humans and Technology Page ii
FOREWORD
Water is fundamental to our quality of life, to economic growth and to the environment. With its
booming economy and growing population, Australia's South East Queensland (SEQ) region faces
increasing pressure on its water resources. These pressures are compounded by the impact of climate
variability and accelerating climate change.
The Urban Water Security Research Alliance, through targeted, multidisciplinary research initiatives,
has been formed to address the region’s emerging urban water issues.
As the largest regionally focused urban water research program in Australia, the Alliance is focused on
water security and recycling, but will align research where appropriate with other water research
programs such as those of other SEQ water agencies, CSIRO’s Water for a Healthy Country National
Research Flagship, Water Quality Research Australia, eWater CRC and the Water Services
Association of Australia (WSAA).
The Alliance is a partnership between the Queensland Government, CSIRO’s Water for a Healthy
Country National Research Flagship, The University of Queensland and Griffith University. It brings
new research capacity to SEQ, tailored to tackling existing and anticipated future risks, assumptions
and uncertainties facing water supply strategy. It is a $50 million partnership over five years.
Alliance research is examining fundamental issues necessary to deliver the region's water needs,
including:
ensuring the reliability and safety of recycled water systems.
advising on infrastructure and technology for the recycling of wastewater and stormwater.
building scientific knowledge into the management of health and safety risks in the water supply
system.
increasing community confidence in the future of water supply.
This report is part of a series summarising the output from the Urban Water Security Research
Alliance. All reports and additional information about the Alliance can be found at
http://www.urbanwateralliance.org.au/about.html.
Chris Davis
Chair, Urban Water Security Research Alliance
Human Factors in Urban Water System Safety: Humans and Technology Page iii
CONTENTS
ACKNOWLEDGEMENTS....................................................................................................... i
FOREWORD ......................................................................................................................... ii
Executive Summary ............................................................................................................. 1
1. Introduction ................................................................................................................. 2
1.1. The Need for Human Factors Research in Drinking Water Treatment and Delivery .......... 2
1.2. Understanding of Human Element Risks in the Water Sector ............................................. 2
1.3. Impetus for this Research Project ........................................................................................ 3 1.3.1. Stage 1 Findings ............................................................................................................... 3
2. Previous literature ...................................................................................................... 5
2.1. Review of Previous Human Element Research in the Water Industry ................................ 5 2.1.1. Case Study: Analysis of the Walkerton Disaster............................................................... 5
2.2. Lessons from Other Comparable Domains ......................................................................... 6 2.2.1. Human Factors in Process Control ................................................................................... 6
2.3. Overview of Stage 2 ............................................................................................................. 7
3. Method ......................................................................................................................... 8
3.1. Scope ................................................................................................................................... 8
3.2. Tools .................................................................................................................................... 8 3.2.1. Operator Observations, Interviews and Questionnaires ................................................... 8 3.2.2. Short-form Cognitive Task Analysis using Modified HTA/SHERPA Methodology ............ 9
3.3. Procedure .......................................................................................................................... 10
4. Results ...................................................................................................................... 11
4.1. Water Distribution .............................................................................................................. 11 4.1.1. Control Room and Operator Observations ..................................................................... 11 4.1.2. Operator Experience Questionnaires and Interviews ..................................................... 12 4.1.3. Analysis: Compliance with Best Practice ........................................................................ 13 4.1.4. Cognitive Task Analysis – Reservoir Flush .................................................................... 16 4.1.5. Summary ........................................................................................................................ 19
4.2. Advanced Water Treatment ............................................................................................... 20 4.2.1. Control Room and Operator Observations ..................................................................... 20 4.2.2. Operator Experience Questionnaires and Interviews ..................................................... 20 4.2.3. Analysis: Compliance with Best Practice ........................................................................ 21
4.3. Comparison Between Sites: Alarm System Benchmark and Classification ..................... 22
4.4. Comparison to Other Industries ......................................................................................... 22
5. Discussion ................................................................................................................ 25
5.1. Summary of Main Results .................................................................................................. 25
5.2. Future Research ................................................................................................................ 25
5.3. Conclusions and Recommendations ................................................................................. 26 5.3.1. Human-Centred Design .................................................................................................. 26
APPENDIX .......................................................................................................................... 28
REFERENCES .................................................................................................................... 29

Human Factors in Urban Water System Safety: Humans and Technology Page iv
LIST OF FIGURES
Figure 1: The control room at the BWTA central office, showing two operator consoles with four
monitors each, and two large wall-mounted LED screens. .............................................................. 11 Figure 2: Alarm list from the Citect SCADA system at the BWTA control room. ............................................. 13 Figure 3: Screenshots of network overview schematics in the Logica (Brisbane – top panel) and Citect
(Regional – bottom panel) software platforms. ................................................................................ 15 Figure 4: Hierarchical task analysis of a simulated reservoir flush. Avenues for human error are
indicated with the SHERPA taxonomic codes in red text. ................................................................ 16 Figure 5: The primary operator console at the AWTP control room. This console is 100% attended
during shift hours. ............................................................................................................................ 20 Figure 6: Findings of this report against previous survey in chemical and power industries (Bransby
and Jenkinson, 1998). Pie charts depict previous survey results. White drops represent
distribution operators, black drops advanced water treatment operators. ....................................... 24
LIST OF TABLES
Table 1: SHERPA Error Taxonomy and Codes. ............................................................................................ 10 Table 2: Deviations from EEMUA (2007) Best-Practice Guidelines. ............................................................. 14 Table 3: Potential Errors in the Flush Task, with Corresponding SHERPA Taxonomic Codes. .................... 17

Human Factors in Urban Water System Safety: Humans and Technology Page 1
EXECUTIVE SUMMARY
1. The first phase of this project, completed in June 2011, was a basic overview of human factor
issues in the area. Recommendations stemming from this preliminary phase were that Stage 2
should focus on interactions between humans and technology, especially in the context of
changing roles, responsibilities and asset ownership in the sector. Due to funding and time
constraints, the focus of the research was restricted to two operational water grid entities – bulk
water distribution and advanced water treatment. These focus areas were selected because they
represented the greatest disparity in operational activities, age and quality of infrastructure, and
geographical extent/containment of control networks.
2. Our work focused on control room operations, especially operator interfaces and alarms.
Adopting a user-focused approach, we evaluated Supervisory Control and Data Acquisition
(SCADA) system interfaces and alarms. Best-practice evaluation tools were used for Human
Factors auditing, including the 2007 Engineering Equipment and Material Users’ Association
guidelines. In addition, naturalistic observations of control room practices were conducted, as
well as extensive interviews and technical discussions with operators. Human Error
classification and prediction tools, including a short-form Cognitive Task Analysis, were
applied to a routine control room activity at the bulk water distribution facility.
3. The recent amalgamation of water grid assets resulted in the bulk water distribution entity
inheriting five geographically independent, non-integrated SCADA systems, one of which was
running on a different software platform to the rest. This created compatibility and consistency
issues, particularly with regard to interface design, and system functionality to a lesser extent.
Alarm system performance in four of the SCADA systems was considerably below industry
benchmarks for system stability, and alarm flooding was common during system upsets and
incidents. Interface design did not effectively support operators in simple routine tasks, and
mechanisms for activity and incident logging were inefficient or absent.
4. At the time of data collection, the bulk water distribution entity had put out a tender for the
commissioning of a unitary, fully-integrated SCADA system and control room upgrade. The
operational issues described above are being progressively addressed with upgraded control
room facilities. The commissioning of a new, integrated, state-of-the-art SCADA system will
further enhance the monitoring of the bulk water network.
5. The Advanced Water Treatment Plant represents state-of-the-art water recycling and treatment
technology and provided an interesting analytical contrast. The plant was commissioned
relatively recently and considerable efforts have been put into the development of a stable,
rational SCADA interface and a sophisticated alarm management protocol. Operators reported a
high degree of satisfaction with the control room facilities during normal operation and plant
upsets, and alarm flooding was not reported to occur. However, operators reported some
dissatisfaction with the remote alerting system for when the plant is not staffed, and the system
fell short of the best-achievable industry benchmark because alarm documentation was not
electronically integrated.
6. This project has provided an encouraging initial assessment, but it is recognised that an ongoing
process is required to optimise the way in which workers interact with broader system
components, especially in times of rapid change in the industry. Further task analyses,
participatory designs, application of human factors expertise, and iterative testing are needed.
7. Recommendations for future research topics include processes and procedures for abnormal
situations, and reviews of previous accidents and incidents using retrospective task analysis
methodologies. As found in other industries that have embraced an HF-style approach, research
of this nature can help to better integrate people and technologies, and improve the robustness
and error tolerance of the sociotechnical system. In the long term, what is needed is for the
water industry to adopt a user-centred approach and to view the human element in the system as
an integral part of ensuring safety, reliability and efficiency.

Human Factors in Urban Water System Safety: Humans and Technology Page 2
1. INTRODUCTION
1.1. The Need for Human Factors Research in Drinking Water Treatment and Delivery
The human element in complex socio-technical systems has gained increasingly greater importance in
the study and application of risk and safety management (Horberry, Burgess-Limerick and Steiner
(2010). In recent decades, attribution of incidents and accidents to human and organisational error has
been steadily increasing, which can be explained by two aspects of technological advances:
1) increases in the reliability of mechanical, electrical and information-processing components of
systems; and 2) system complexity, and the often poorly-defined role of the human operator in the
control loop.
Contemporary thinking in human factors and related disciplines characterises human error as a
consequence, rather than a cause, of system failures (c.f. Reason, 1990). Detailed analyses of industrial
accidents with human error contributions show that it is always the case that multiple safety barriers at
organisational, technical and operational levels are breached before fragments of aberrant human
behaviour – labelled as ‘error’ – can take place. As such, many industries now recognise the need to
integrate human factors research and principles into their overall risk management schemes. In
systems responsible for the provision of drinking water, this recognition is in the earliest stages, and
with the exception of one recent review article (Wu et al., 2009), human element risks in water
treatment and delivery have received scant attention in the academic literature. This is surprising given
the similarities to other high-reliability industries, several of which contributed to the early
development of human factors as an academic discipline. Given the potentially serious nature of
incidents and accidents involving water treatment and distribution infrastructure, including threats to
public health and large-scale destruction of property, the sector should be playing more of an active
role in understanding and managing human element risks.
1.2. Understanding of Human Element Risks in the Water Sector
Recognition is growing among various stakeholders that water treatment and supply systems in first-
world countries like Australia are not immune to large-scale disease outbreaks. The case of E. coli
contamination in Walkerton, Ontario is the most widely publicised and discussed example of a disease
outbreak in a developed country (see Hrudey and Hrudey, 2003; 2004; Vicente and Christoffersen,
2003 and Woo and Vicente, 2003, for extensive commentary), and also an excellent demonstration of
how factors across a broad range of stakeholders interact to result in a public health disaster, not just
the presence of demonstrably incompetent and devious human behaviour. Nor is the water sector
unsusceptible to industrial accidents, which can have equally troubling implications for public health
and safety.
For example, a detailed investigation into a recent incident in South East Queensland (SEQ)
implicated several instances of human error as contributory factors (Pascoe, 2009). This was one of
the incidents that alerted regulators to potential shortcomings in the management of human element
risks. In early 2009, 400 kL of treated drinking water was accidentally dosed with a concentrated
fluoride solution in a large SEQ water treatment facility, in which fluoridation equipment had recently
been installed. The treatment plant in question was offline for maintenance, but due to a combination
of technical malfunctions and maintenance activities, the fluoride dosing equipment continued to
function, resulting in a high concentration of fluoride in the treated water. This water was then
delivered to a small residential area surrounding the treatment plant. A fluoride alarm was triggered in
the early stages of the incident and was acknowledged by an on-duty operator at a different treatment
plant. However, this was not acted upon because the operator knew that the plant was not operational
and had been issuing a number of spurious fluoride alarms in the days prior. An operator at the
affected treatment plant also recorded very high consumption of dry fluoride powder in the daily
operating log, but despite the plant being offline, did not initiate an investigation into the irregularity.
Human Factors in Urban Water System Safety: Humans and Technology Page 3
The investigation report demonstrated due recognition of the complex and multi-causal nature of the
incident, which is consistent with contemporary understanding of human error (Reason, 1990;
Simpson et al., 2009). However, a stance the water sector should be anxious to avoid is to implicitly
assume that technological components of complex systems – in particular supervisory control systems
– always provide sufficient, meaningful and credible information to the operators. Clearly in the case
of the incident described above, they do not. Alarms, for instance, can be particularly problematic, by
being unreliable, too numerous, incorrectly prioritised, and uninformative, i.e., unaccompanied by
information about what the triggers of the alarm are, and the steps the operator needs to take to rectify
the situation. It is also the case that new infrastructure is not always well integrated into existing
plants, which, in the case of the incident just described, was partially the result of procurement,
installation and operator training decisions being made to a pressing deadline.
The corollary to the assumption that technological systems work ‘as intended’ is that redemptive
actions – following a near-miss, incident or accident – are likely to be limited to reactive measures, a
common candidate of which is additional training. Without proper consideration of human element
risks, actions like additional training do not address deeper systemic issues (Simpson et al., 2009).
1.3. Impetus for this Research Project
In 2007, an extensive period of drought saw SEQ bulk water storage fall to 17% of capacity. The state
government’s response to the water supply crisis was aggressive and rapidly implemented, including
the creation of a new statutory authority and business model, introduction of new large assets
(advanced water recycling and desalination plants), and a combination of more stringent demand-side
measures (restrictions on business and residential water use) and demand reduction incentives (water
tank rebates) (Head, 2010). Around the same time, automatic fluoride dosing equipment had been
installed at all major water treatment plants to meet separate state government policy commitments for
dental health.
This research project had its beginnings in stakeholder responses to the rapid and sweeping changes
the sector had experienced in response to extended drought conditions. In the view of some interested
parties, the maxim that ‘change precedes trouble’ (Hrudey and Hrudey, 2004) rang true with the
occurrence of two well-publicised incidents within a relatively short period, both of which implicated
human failings in the operation of new water infrastructure.
This project was conceived in two stages, with the first stage as an exploratory exercise and fact-
finding mission. Insights generated in Stage 1 determined the scope and detailed focus areas for this
Stage 2 report, which focuses on control room operations in major water grid entities.
1.3.1. Stage 1 Findings
A period of pilot work (Cloete, Horberry and Head, 2011), involving analysis of recent incidents,
confidential interviews with various water industry participants, and inspection of major assets, aimed
to identify avenues for human error potential, and how a human factors framework could offer
opportunities for improvement.
Vulnerabilities at all levels of participation in the sector were revealed. At higher levels, a pressing
concern expressed by most informants was communication, both within and between water grid
entities. The perception among interviewees was that this deficiency in communication stemmed from
rapid organisational change, namely, the creation of new roles and shifts in responsibility for strategic
and operational decision-making, which created an environment of relatively low trust and left many
in the sector unsure of the limits of their authority. Closer to the coal face, concerns were expressed
over the size of the SEQ Water Grid, the potential redundancy of many smaller-capacity water
treatment plants, and the post-amalgamation position of considering the decommission or integration
of assets, and the complexities of connecting grid assets to an integrated distributed control system, or,
at the very least, facilitating communication between independent control systems.

Human Factors in Urban Water System Safety: Humans and Technology Page 4
Brief analyses of two recent incidents in the SEQ Water Grid were also conducted. A series of
incidents involving cross-connections in residential dual-reticulation systems was briefly summarised,
but could not be explored in detail because the incidents are the subject of a class action. The fluoride
dosing incident described in section 2.2 was recast in the risk management framework used by Vicente
and Christoffersen (2006) to characterise the 2000 Walkterton disaster. Several parallels between the
two incidents could be drawn, most notably a range of latent influences. These ranged from pressure
from the State Government for the rapid procurement and installation of fluoride dosing equipment,
right down to the lack of an effective tagging system for equipment maintenance.
The corporate and government-level complexities in the sector certainly stood out as issues which
require resolution. However, the agreed focus for the remainder of this project fell to the issues at the
‘sharp end’ of interactions between humans and technology, which could be addressed within limited
time and budget constraints, and for which the team’s expertise was best suited.

Human Factors in Urban Water System Safety: Humans and Technology Page 5
2. PREVIOUS LITERATURE
2.1. Review of Previous Human Element Research in the Water Industry
Prior to the pilot work conducted by our group, the only published literature dealing exclusively with
human factors in water (Wu et al., 2009) was based on a broad survey of disease outbreaks in affluent
countries, which had been previously conducted by one of the co-authors (Hrudey and Hrudey, 2004).
The 2009 paper defined human error and human reliability in very broad terms, then identified human
element contributions within a catalogue of incidents involving disease outbreaks over a thirty-year
period. Wu et al. used a human error taxonomy derived from the Reason (1990) ‘swiss cheese’ model,
categorised system failures along one of four dimensions, and determined the total contribution of
each dimension to system failure. The four dimensions were:
1. Physical system failures and extreme environmental conditions:
a. Equipment failure.
b. Disease-carrying animals and animal waste.
c. Extreme weather.
2. Active errors:
a. Mistaken belief in the security of a water system.
b. Failure to recognise and/or to take adequate measures on warnings.
c. Sanitary violations.
d. Failure to follow recommendations.
3. Latent errors:
a. Design errors:
i. Lack of sufficient water safety barriers.
ii. Existing deficiencies in system.
iii. Raw water not isolated from animal waste.
b. Maintenance errors.
c. Operation errors.
d. Insufficiently qualified staff.
e. Inadequately trained operators.
f. Communication errors.
4. Influences from consumers and third parties:
a. Failure to inform new residents and visitors consuming untreated surface water.
b. Failure to report warning signals.
c. Failure to appreciate the risk of disease transmission.
d. Lack of cooperation, interaction or communication among various parties responsible for
water safety.
e. Failure of regulator to implement policy.
All 61 cases had contributory influences from multiple dimensions. This reinforces the notion alluded
to in the example of the fluoridation incident that errors do not occur in isolation. The distribution of
active and latent error contributions were approximately equal at 38% and 37% respectively, with
physical system failures (22%) and influences from consumers and third parties (3%) playing a much
smaller role. This article (Wu et al., 2009) is the first of its kind, and is an important step in publicising
the role of human factors in drinking water contamination, especially in the context of broader system
factors. However, the classification of some error classes is arguably erroneous (dimension 2a and 3c,
for example) and very little information is provided as to how incidents are categorised along the four
dimensions, and specific details for each case are only rudimentary in form.
2.1.1. Case Study: Analysis of the Walkerton Disaster
As noted in the Stage 1 report, possibly the most serious, widely publicised and well-studied drinking
water contamination incident was the E. coli outbreak in Walkerton Ontario in May 2000. In a town of

Human Factors in Urban Water System Safety: Humans and Technology Page 6
5,000 residents, approximately half became ill as a result of ingesting contaminated water, and seven
fatalities were attributed to the event. There was a likelihood of long-term health consequences,
particularly for infected children. Residents in the town of Walkerton and across the province of
Ontario developed a serious mistrust of the water delivery authorities, with doubts about the future
security of the water system. The total economic cost of the incident was estimated at $64.5m CAD,
which included an expensive nine-month official investigation (O’Connor, 2002). Investigation of this
case revealed a unique combination of ineffective regulatory oversight, incompetent leadership,
extremely poor monitoring procedures, and even deliberate concealment of adverse monitoring results
(Vicente and Christofferson, 2006).
Although the gross incompetence and deception on the part of employees of the Walkerton Public
Utilities Commission (WPUC) were the most obvious and salient contributions to the disaster, the
O’Connor (2002) investigation made it clear that the system was already vulnerable due to the
presence of numerous latent errors. The actions of individuals served only as a trigger; there were
profound deficiencies in the physical treatment infrastructure, which were present from the very time
it was installed and which were known to the WPUC leadership and the regulatory authority charged
with oversight. The shallowness of one of the wells made it vulnerable to contamination via runoff,
and additional contamination pathways were evident in local geographical features of the well site.
Another well was not even equipped with a chlorinator for disinfection, which demonstrated the dire
ignorance and lack of training of the WPUC leadership. This was also reflected in the lax approach to
routine monitoring, which involved serious breaches of reporting requirements; monitoring was
sporadic at best, and operators were encouraged to fabricate monitoring results in the official records.
The systemic culture of noncompliance was extreme, chronic, and seemingly invisible to the regulator.
In sum, safety defences in the Walkerton supply grid were either absent or severely crippled by a
deficient organisational culture and ineffective oversight, which allowed violations by operators and
senior management to inevitably progress to a water contamination incident.
2.2. Lessons from Other Comparable Domains
There are many examples of sociotechnical systems similar in size and complexity to the water sector.
However, it is difficult to find examples of industries charged with the control of similar hazards (e.g.,
pathogens), and occupying similar organisational and operational environments. Food manufacturing
is an obvious candidate for a meaningful comparison in human factors terms. There are risk
management frameworks engineered specifically for food production (e.g., HACCP); however, none
explicitly address the impact and control of human element risks. An extensive literature search failed
to identify empirical research specifically addressing human factors issues in this industry1. It is
therefore fitting to review approaches to human factors issues in other domains.
2.2.1. Human Factors in Process Control
Many parallels to water treatment and recycling can be found in process control studies, and control
room environments have been the target of concerted research efforts. A full review is beyond the
scope of this report, but a recent example in the domain of minerals processing (Li et al., 2011) is
worth highlighting, principally because of the considerable overlap with the present research in the
methods used. These researchers demonstrated widespread shortcomings in the way control room
environments accommodate operator requirements. Control strategies were typically reactive,
operators mistrusted or ignored alarm systems, and generally did not utilise the technology available to
them: operators often lacked the will or ability to engage in process optimisation. At the organisational
level, decisions regarding operator training, task allocation and job design compounded problems at
the operational level. Also, this study uncovered numerous deficiencies in the current information
environment, which included poorly designed and integrated Human-Machine Interfaces and alarm
systems.
1 Examples were found of safety-focused interventions firmly rooted in the behaviourist tradition, but which ignores wider system factors and
explicitly attributes accident causation to the actions of individuals.

Human Factors in Urban Water System Safety: Humans and Technology Page 7
2.3. Overview of Stage 2
Unfortunately, the January 2011 floods limited the capacity of SEQ’s largest Water Grid entity
(Seqwater) to contribute the human resources necessary for its participation in Stage 2. Participation
was sought from the bulk water transport authority (Linkwater, referred to as BWTA hereafter), and
from a newly-commissioned advanced water treatment plant (AWTP), owned by Seqwater but
operated under license by Veolia Water.
The facilities were selected to represent the broadest range of technological sophistication and
operational activities within the timeframe and budget available. On the one hand, the AWTP plant
was commissioned and built relatively recently (2009-2010), it is highly automated and designed to
run with minimal input from human operators, and it is largely self-contained with only one input and
one output. At the other end of the spectrum, bulk water distribution relies on a complex network with
major components 40-50 years old. It requires extensive manual operation, and there may be
significant risks to public health and safety through incidents, accidents and water-borne disease. The
differences in age, asset quality and public risk exposure therefore provided an interesting analytic
context.

Human Factors in Urban Water System Safety: Humans and Technology Page 8
3. METHOD
A variety of human factors research methods were used. Under ideal circumstances, detailed cognitive
task analyses using quantitative error rate prediction tools, appraisal and redesign of human-machine
interfaces under a participatory ergonomics framework, and evaluation of new design concepts in a
desktop simulation, would all have been undertaken. Constraints on budget, time and human resources
of participating Water Grid entities meant that research activities were restricted to problem-
specification tasks, including an appraisal of supervisory control and alarm systems using a best-
practice audit tool, questionnaires and observations of work practices, and interviews with operators
and management.
3.1. Scope
The agreed focus for Stage 2 found its most meaningful application in control rooms of treatment
plants and other facilities, rather than in the field. Control rooms house the desktop interfaces for
distributed control systems, and are where the majority of network operations in the grid are initiated
and governed.
The key topics we addressed in our research activities were:
Alarm systems
- An operator’s inappropriate response to a critical alarm was identified as a contributory
factor in a recent industrial accident. A review and user-centred evaluation of alarm
systems across the sector was therefore designated a priority research area.
Elements of Human-Computer Interaction
- Recent changes in the organisational structure and ownership of assets in the Water Grid
precipitated, for some entities, a need to decommission aging or redundant plant
equipment and upgrade existing facilities with newer, more sophisticated technology. The
corollary to such changes is the modification, and in the case of the BWTA, a complete
overhaul of supervisory control systems. By way of contrast, the newly-commissioned
AWTP featured a state-of-the-art process control system, which was expected to deliver a
more ergonomically sound working experience to control room operators.
Extent of automation
- Automation is a defining feature of modern process control systems, and if appropriately
implemented, automation can remove tedious, time-consuming and error-prone tasks
from the operator’s workload. Rather than replacing humans, automation significantly
changes the role they play in the system. If it is implemented without due consideration of
human skills, abilities and limitations, it can lead to problems including mistrust,
overreliance, compromises to situational awareness, and manual skill degradation.
Modern process control systems are highly automated, but the bulk water transport
network has a complex mixture of manual and automatic control points, which creates
working conditions for control room operators which are substantively different to those
of a typical process-control plant.
3.2. Tools
3.2.1. Operator Observations, Interviews and Questionnaires
A questionnaire assessing the operator’s level of interaction with the SCADA system (particularly the
alarm components) and perceptions of its effectiveness was adapted from the EEMUA and ASM
Consortium guidelines (EEMUA, 2007). A checklist assessing the SCADA systems’ conformity with
ASM design requirements was adapted from similar guidelines and completed by the SCADA or
Control Systems Engineer. Semi-structured interviews were held with operators and representatives

Human Factors in Urban Water System Safety: Humans and Technology Page 9
from management, including Service Delivery Managers, Network Managers and SCADA Systems
Engineers.
In addition, naturalistic ‘fly-on-the-wall’ observations of operators at work in the control room
environment were conducted. Non-intrusive observation coincided naturally with periods of higher
operator workload, whilst in quieter periods (and with the operator’s consent) the experimenters asked
questions and led discussions on human factors issues.
3.2.2. Short-form Cognitive Task Analysis using Modified HTA/SHERPA Methodology
At the water distribution facility, an Hierarchical Task Analysis (HTA) was conducted on reservoir
flushing, which is a control room activity typically undertaken on multiple storage reservoirs several
times a week. This task was selected for detailed analysis on the advice of management and operators.
It is essential to the overarching goal of bulk water transport, because omission or incorrect execution
could have potentially serious – although short-term – consequences for water supply. In addition to
potential under-supply, overfilling reservoirs could lead to surrounding areas being affected by
inundation, which carries implications for safety and equipment/property damage.
An HTA involves observing a task and documenting each step in a hierarchical manner. The analysis
is organised according to the overall goal of the activity, and it is sequentially broken down into
subgoals, individual tasks, and eventually to the level of low-level manual behaviours like key-presses
(although such a high level of detail was not employed for the HTA reported in this document).
Human error prediction using the SHERPA (Systematic Human Error Rate Prediction Approach)
human error taxonomy (Stanton, 2004) was undertaken at all nodes in the HTA framework. The
SHERPA technique was selected for its strong theoretical grounding, efficiency and simplicity
(Kirwan, 1998). It has the advantage of being a rigorously structured approach and, compared to other
task analysis techniques, affords greater reliability and ease of interpretation. For the purposes of this
analysis, the quantitative components of error rate prediction were not included2; instead, operators
rated error likelihood on a discrete 5-point scale, with the ‘Observed’ category reserved for errors
actually witnessed during the data collection activities. The error taxonomy and likelihood scale are
presented in Table 1.
2 Quantitative error rate prediction requires extensive periods of observation or the availability of relevant accident/incident data.
Human Factors in Urban Water System Safety: Humans and Technology Page 10
Table 1: SHERPA Error Taxonomy and Codes.
Action Checking Retrieval Communication Selection Likelihood
A1
Operation too long/too short
C1
Check omitted
R1
Information not obtained
I1
Information not communicated
S1
Selection omitted
L1
Observed
A2
Operation mistimed
C2
Check incomplete
R2
Wrong information obtained
I2
Wrong information communicated
S2
Wrong selection made
L2
Reported as highly likely
A3
Operation in wrong direction
C3
Right check on wrong object
R3
Information retrieval incomplete
I3
Information communication incomplete
L3
Reported as likely
A4
Operation too little/much
C4
Wrong check on right object
L3
Reported as unlikely
A5
Misalign
C5
Check mistimed
L4
Reported as highly unlikely
A6
Right operation on wrong object
C6
Wrong check on wrong object
L5
Reported as impossible
A7
Wrong operation on right object
A8
Operation omitted
A9
Operation incomplete
A10
Wrong operation on wrong object
3.3. Procedure
Clearance to conduct the research was obtained from the University of Queensland Human Ethics
Review Committee, in accordance with NHMRC guidelines for research with human participants.
Introductory meetings were held with network and technical managers at the BWTA prior to
commencing. Research activities for both Water Grid participants consisted primarily of site visits,
during which the research team underwent safety inductions and were given an overview of the
control network and site tour (AWTP only). Operators were then interviewed and asked to complete
standardised questionnaire instruments. Extensive technical discussions were held, and demonstrations
of work practices for the purposes of Cognitive Task Analysis (BWTA only) were conducted.
Human Factors in Urban Water System Safety: Humans and Technology Page 11
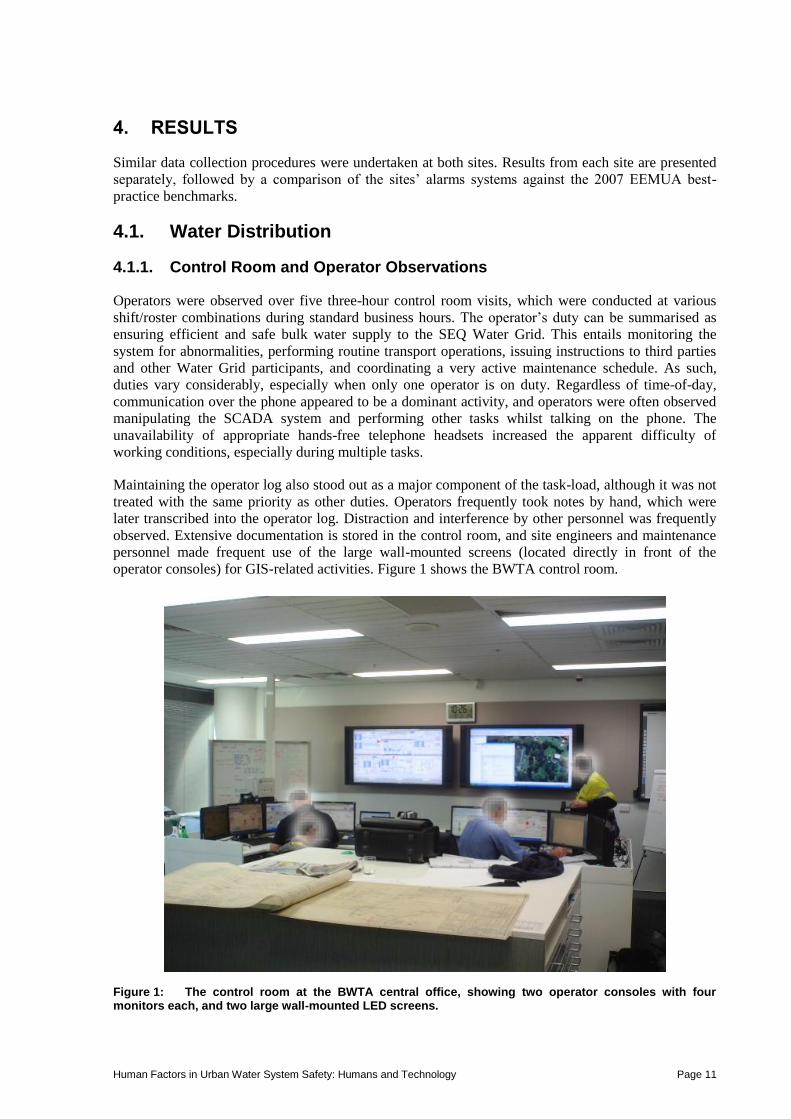
4. RESULTS
Similar data collection procedures were undertaken at both sites. Results from each site are presented
separately, followed by a comparison of the sites’ alarms systems against the 2007 EEMUA best-
practice benchmarks.
4.1. Water Distribution
4.1.1. Control Room and Operator Observations
Operators were observed over five three-hour control room visits, which were conducted at various
shift/roster combinations during standard business hours. The operator’s duty can be summarised as
ensuring efficient and safe bulk water supply to the SEQ Water Grid. This entails monitoring the
system for abnormalities, performing routine transport operations, issuing instructions to third parties
and other Water Grid participants, and coordinating a very active maintenance schedule. As such,
duties vary considerably, especially when only one operator is on duty. Regardless of time-of-day,
communication over the phone appeared to be a dominant activity, and operators were often observed
manipulating the SCADA system and performing other tasks whilst talking on the phone. The
unavailability of appropriate hands-free telephone headsets increased the apparent difficulty of
working conditions, especially during multiple tasks.
Maintaining the operator log also stood out as a major component of the task-load, although it was not
treated with the same priority as other duties. Operators frequently took notes by hand, which were
later transcribed into the operator log. Distraction and interference by other personnel was frequently
observed. Extensive documentation is stored in the control room, and site engineers and maintenance
personnel made frequent use of the large wall-mounted screens (located directly in front of the
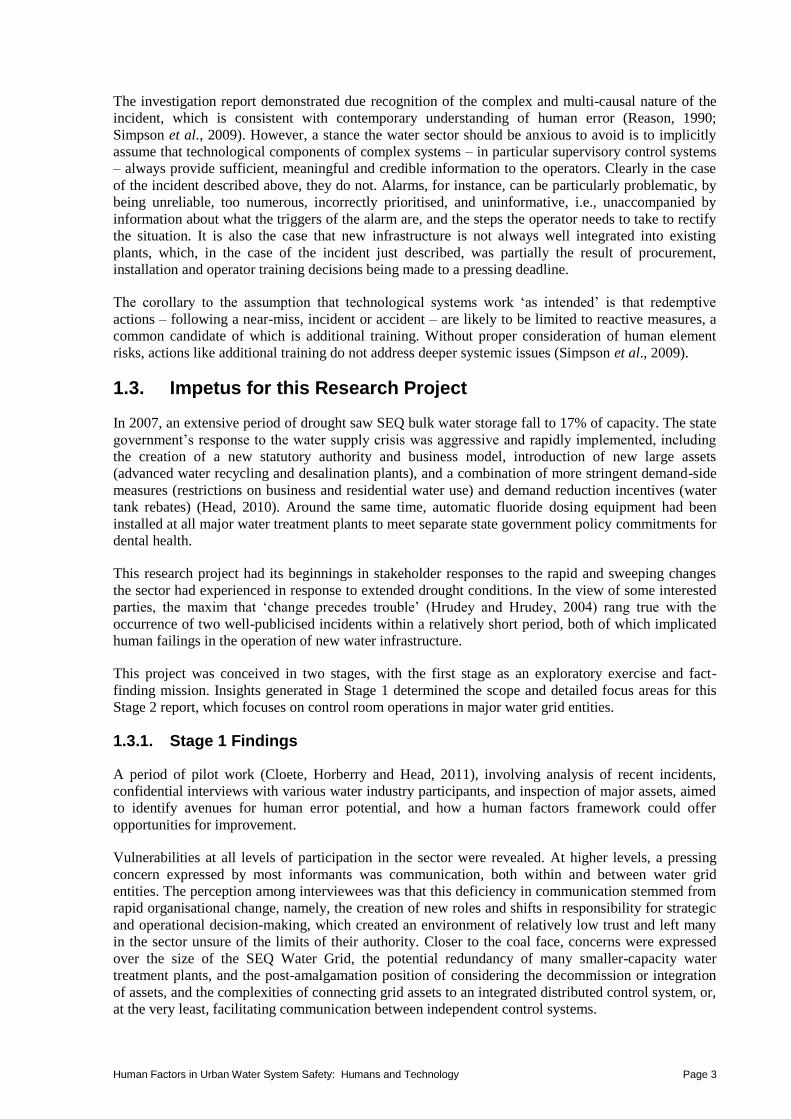
operator consoles) for GIS-related activities. Figure 1 shows the BWTA control room.
Figure 1: The control room at the BWTA central office, showing two operator consoles with four monitors each, and two large wall-mounted LED screens.

Human Factors in Urban Water System Safety: Humans and Technology Page 12
4.1.2. Operator Experience Questionnaires and Interviews
From a workforce of seven operators, we interviewed four and obtained the consent of three to
complete our questionnaire instruments. Unfortunately, the particularly small sample size did not
allow us to quantitatively analyse questionnaire data, but did provide some insights that were
consistent with observations and interviews. The segment of the questionnaire dealing with
perceptions of the alarm system had been used previously in a survey spanning the chemical and
power industries (Bransby and Jenkinson, 1998). In section 5.3 of this report, these findings are
contrasted with responses of individual operators from both of the facilities we visited.
Responses to some questionnaire items were quite variable, which indicates that individuals may
develop a unique operating style. This was reflected in some observations, particularly the
idiosyncratic ways in which operators arrange their screens and manage the operator log. Operators
were fairly consistent in their assessment of the alarm system, but again differed in their preferences
for the way information in the SCADA system is displayed and manipulated.
4.1.2.1. Operator Log
Operators also reported numerous problems with the operator log; primarily that it was maintained in
an Excel spreadsheet, which was burgeoning in size and processed on an ageing laptop. One operator
claimed that the volume of log entries required and delays due to inadequate computing power
accounted for up to 50% of their time in the control room, and this was confirmed with other operators
in subsequent discussions. Given that the most trivial situations require multiple log entries, such as a
cleaner or tradesperson requiring access to a secure facility, this is an issue of considerable concern.
Operators also stated that they were uncertain as to what the operator log information was used for,
which left them uncertain as to what information and level of detail to include. They were unanimous
in their desire for improvements to information logging, and argued that this functionality would be
best implemented at the level of discrete operations within the system, for instance, if a valve is
opened or pump disabled, the system would log the date and time of the operation, which operator
initiated it, and a brief description of why the operation was undertaken, e.g., isolation, maintenance,
routine operation, etc. Information logging on-the-fly has the potential to improve the quality and
reliability of the data collected, but would need to be designed with considerable input from users to
ensure that it would not introduce a new set of usability issues.
4.1.2.2. Alarms
Two lines of alarm information are displayed at the bottom of each screen. A dedicated alarm screen is
accessible by clicking, but most operators reported that they did not allocate an entire screen to this
function full-time. Alarms are categorised according to priority, but alarm priority is not clearly
distinguished in the system, and neither priority is signalled by an auditory alarm. Figure 2 shows a
screen-shot of the alarm list. Note that the use of red text on a dark blue background is quite difficult
to read.
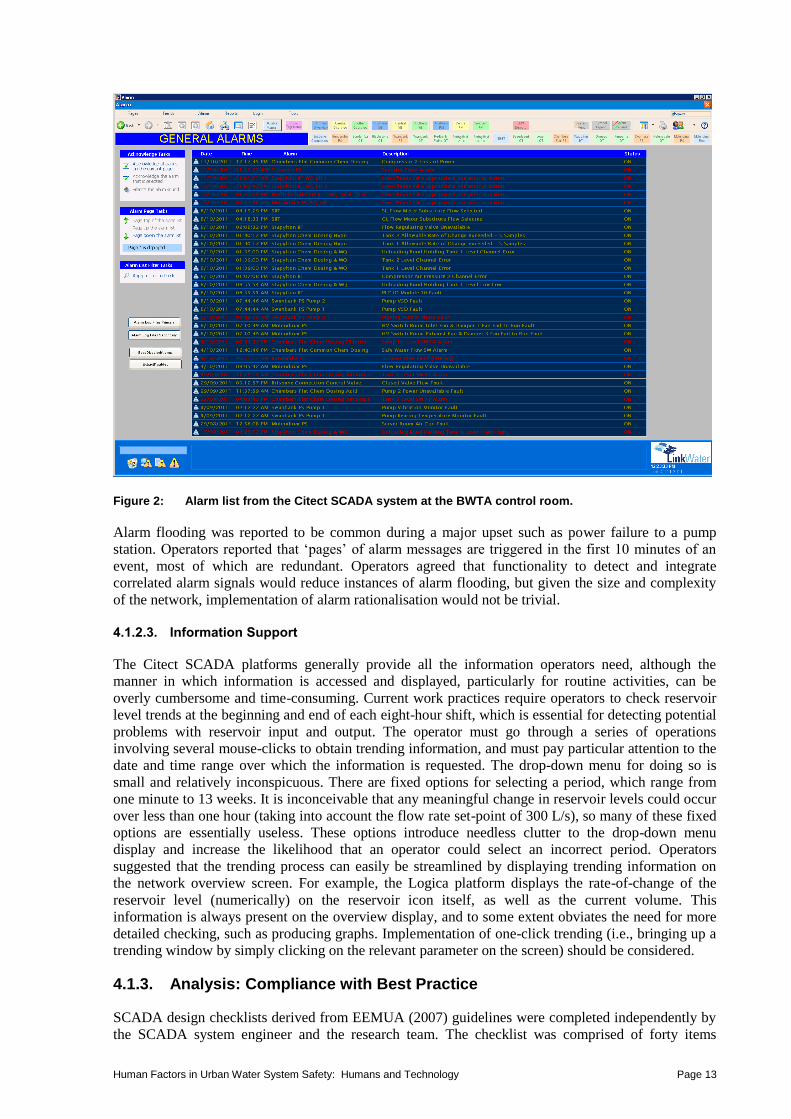
Human Factors in Urban Water System Safety: Humans and Technology Page 13
Figure 2: Alarm list from the Citect SCADA system at the BWTA control room.
Alarm flooding was reported to be common during a major upset such as power failure to a pump
station. Operators reported that ‘pages’ of alarm messages are triggered in the first 10 minutes of an
event, most of which are redundant. Operators agreed that functionality to detect and integrate
correlated alarm signals would reduce instances of alarm flooding, but given the size and complexity
of the network, implementation of alarm rationalisation would not be trivial.
4.1.2.3. Information Support
The Citect SCADA platforms generally provide all the information operators need, although the
manner in which information is accessed and displayed, particularly for routine activities, can be
overly cumbersome and time-consuming. Current work practices require operators to check reservoir
level trends at the beginning and end of each eight-hour shift, which is essential for detecting potential
problems with reservoir input and output. The operator must go through a series of operations
involving several mouse-clicks to obtain trending information, and must pay particular attention to the
date and time range over which the information is requested. The drop-down menu for doing so is
small and relatively inconspicuous. There are fixed options for selecting a period, which range from
one minute to 13 weeks. It is inconceivable that any meaningful change in reservoir levels could occur
over less than one hour (taking into account the flow rate set-point of 300 L/s), so many of these fixed
options are essentially useless. These options introduce needless clutter to the drop-down menu
display and increase the likelihood that an operator could select an incorrect period. Operators
suggested that the trending process can easily be streamlined by displaying trending information on
the network overview screen. For example, the Logica platform displays the rate-of-change of the
reservoir level (numerically) on the reservoir icon itself, as well as the current volume. This
information is always present on the overview display, and to some extent obviates the need for more
detailed checking, such as producing graphs. Implementation of one-click trending (i.e., bringing up a
trending window by simply clicking on the relevant parameter on the screen) should be considered.
4.1.3. Analysis: Compliance with Best Practice
SCADA design checklists derived from EEMUA (2007) guidelines were completed independently by
the SCADA system engineer and the research team. The checklist was comprised of forty items

Human Factors in Urban Water System Safety: Humans and Technology Page 14
assessing various aspects of display and alarm design and general control room ergonomics.
Compliance was rated on only 13 of the 40 items by both respondents. Both SCADA platforms
demonstrated relatively poor compliance with EEMUA best-practice guidelines, however, this finding
takes second stage to the fact that different SCADA platforms are used in the same control room.
Major deviations are detailed in Table 2.
Table 2: Deviations from EEMUA (2007) Best-Practice Guidelines.
Best-Practice Violation Comments
Lack of integration of SCADA systems, use of different platforms and no integration to ArcGIS system.
The ArcGIS system contains highly detailed information concerning the type and locality of network components, such as manually-operated and automatic valves. Properly integrated to the SCADA system, it could serve as the basis for an ecologically valid way of depicting the distribution network, which would confer several benefits.
Lack of consistency in the use of colour, graphic design elements and schematics between the different SCADA software platforms.
In some instances, colours are used to convey diametrically opposite meanings (e.g., on/off). This is a plainly unacceptable situation.
No spatially/geographically organised network overview screen and no protocols to constrain the way in which operators organise the screens.
Operators do not always organise their displays in an efficient way. Organisation according to the geographical distribution of the network, potentially utilising the GIS system, is recommended.
No dedicated screens for intranet, email and ad-hoc tasks.
The lack of a dedicated non-SCADA terminal means that operators need to use screens which should be dedicated to system monitoring and network activities.
No dedicated screen for alarm lists. Best practice recommends that active alarms are displayed schematically on SCADA interfaces. However, with a large and complex network, an alarm list is generally the only way that all active alarms can be depicted simultaneously. A dedicated alarm screen should be provided, as long as functionality to navigate directly from the alarm list to the relevant screen is included.
No auditory alarms, with unacknowledged alarms progressing to SCADA phone alert after three minutes.
Recommendations are that category 1 alarms (requiring immediate operator action) have an auditory signal.
No one-click integration of alarms to relevant screens/schematics, and no online alarm documentation.
Click-to-navigate functionality reduces the operators' reliance on memory and saves time navigating to the appropriate screen to deal with the problem. The lack of this functionality is particularly problematic if the operators' mental model of the network is inconsistent with the SCADA system.
Alarm documentation including detailed information on fault diagnosis and step-by-step instructions for remedying the situation should be available at a mouse-click.
Alarm flooding during incidents is common. Alarm flooding defeats the purpose of alarms, which is to support operators in fault detection and diagnosis. Alarm flooding has been implicated in several major industrial catastrophes, including Three-Mile Island.
The above list presents a preliminary audit of the operating environment, and more detailed
observations and task analysis would be required to determine the suitability of changes made simply
to satisfy best-practice criteria. Controlling water distribution differs significantly to the more
geographically constrained but equally complex process control environments for which these
guidelines were developed. What may be considered desirable and appropriate for process control
operations may not be suitable for distribution applications, and the outcome of a comprehensive user-
centred design (as proposed in Section 6.3.1) should take precedence over published guidelines.
Figure 3 illustrates the marked differences between the two SCADA platforms; the upper panel shows
an alarm list and overview screen for the Brisbane leg of the distribution network under the Logica
software platform, and the lower panel shows a regional network leg under the Citect platform. A
number of discrepancies between the two systems are immediately apparent in these images, most
notably the use of colour. In the Logica System, a pump icon with a filled red circle indicates that the
pump is out of service whilst in the Citect system, that condition is designated by the pump icon
shaded green, with red used to designate a pump which is running. This particular use of colour
contravenes an incredibly strong and pervasive colour stereotype (green=go, red=stop).

Human Factors in Urban Water System Safety: Humans and Technology Page 15
Figure 3: Screenshots of network overview schematics in the Logica (Brisbane – top panel) and Citect (Regional – bottom panel) software platforms.
Human Factors in Urban Water System Safety: Humans and Technology Page 16
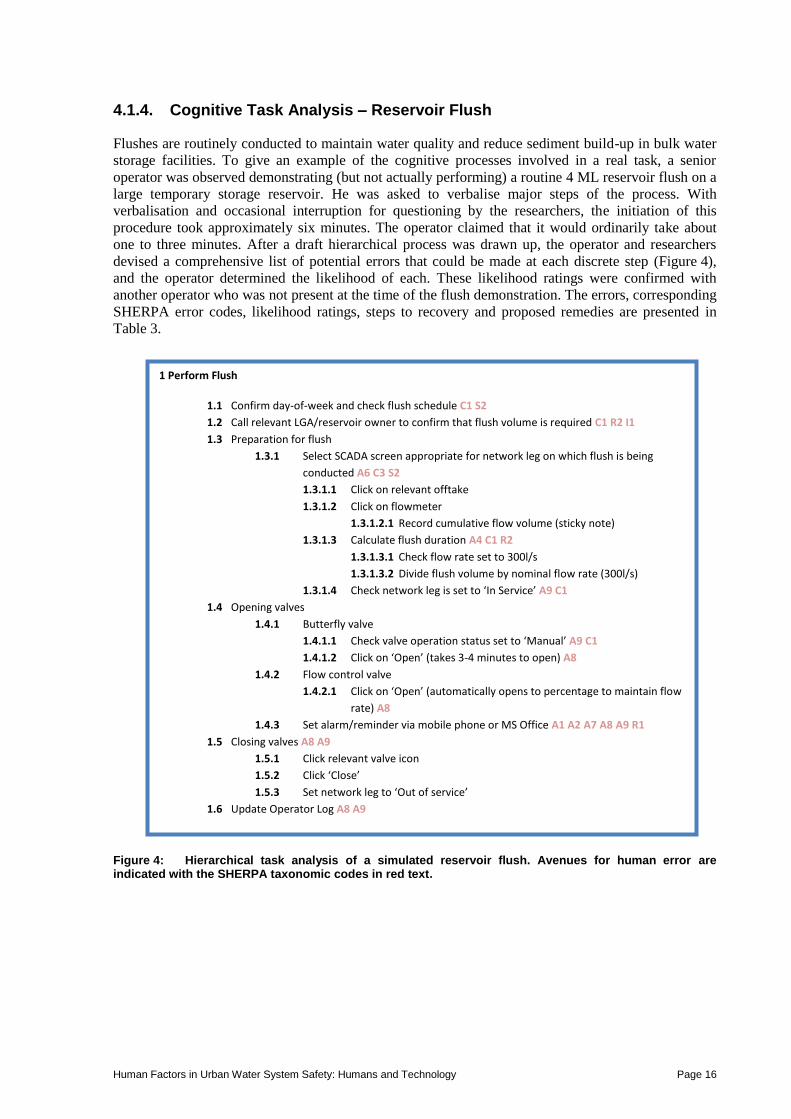
4.1.4. Cognitive Task Analysis – Reservoir Flush
Flushes are routinely conducted to maintain water quality and reduce sediment build-up in bulk water
storage facilities. To give an example of the cognitive processes involved in a real task, a senior
operator was observed demonstrating (but not actually performing) a routine 4 ML reservoir flush on a
large temporary storage reservoir. He was asked to verbalise major steps of the process. With
verbalisation and occasional interruption for questioning by the researchers, the initiation of this
procedure took approximately six minutes. The operator claimed that it would ordinarily take about
one to three minutes. After a draft hierarchical process was drawn up, the operator and researchers
devised a comprehensive list of potential errors that could be made at each discrete step (Figure 4),
and the operator determined the likelihood of each. These likelihood ratings were confirmed with
another operator who was not present at the time of the flush demonstration. The errors, corresponding
SHERPA error codes, likelihood ratings, steps to recovery and proposed remedies are presented in
Table 3.
Figure 4: Hierarchical task analysis of a simulated reservoir flush. Avenues for human error are indicated with the SHERPA taxonomic codes in red text.
1 Perform Flush
1.1 Confirm day-of-week and check flush schedule C1 S2
1.2 Call relevant LGA/reservoir owner to confirm that flush volume is required C1 R2 I1
1.3 Preparation for flush
1.3.1 Select SCADA screen appropriate for network leg on which flush is being
conducted A6 C3 S2
1.3.1.1 Click on relevant offtake
1.3.1.2 Click on flowmeter
1.3.1.2.1 Record cumulative flow volume (sticky note)
1.3.1.3 Calculate flush duration A4 C1 R2
1.3.1.3.1 Check flow rate set to 300l/s
1.3.1.3.2 Divide flush volume by nominal flow rate (300l/s)
1.3.1.4 Check network leg is set to ‘In Service’ A9 C1
1.4 Opening valves
1.4.1 Butterfly valve
1.4.1.1 Check valve operation status set to ‘Manual’ A9 C1
1.4.1.2 Click on ‘Open’ (takes 3-4 minutes to open) A8
1.4.2 Flow control valve
1.4.2.1 Click on ‘Open’ (automatically opens to percentage to maintain flow
rate) A8
1.4.3 Set alarm/reminder via mobile phone or MS Office A1 A2 A7 A8 A9 R1
1.5 Closing valves A8 A9
1.5.1 Click relevant valve icon
1.5.2 Click ‘Close’
1.5.3 Set network leg to ‘Out of service’
1.6 Update Operator Log A8 A9

Human Factors in Urban Water System Safety: Humans and Technology Page 17
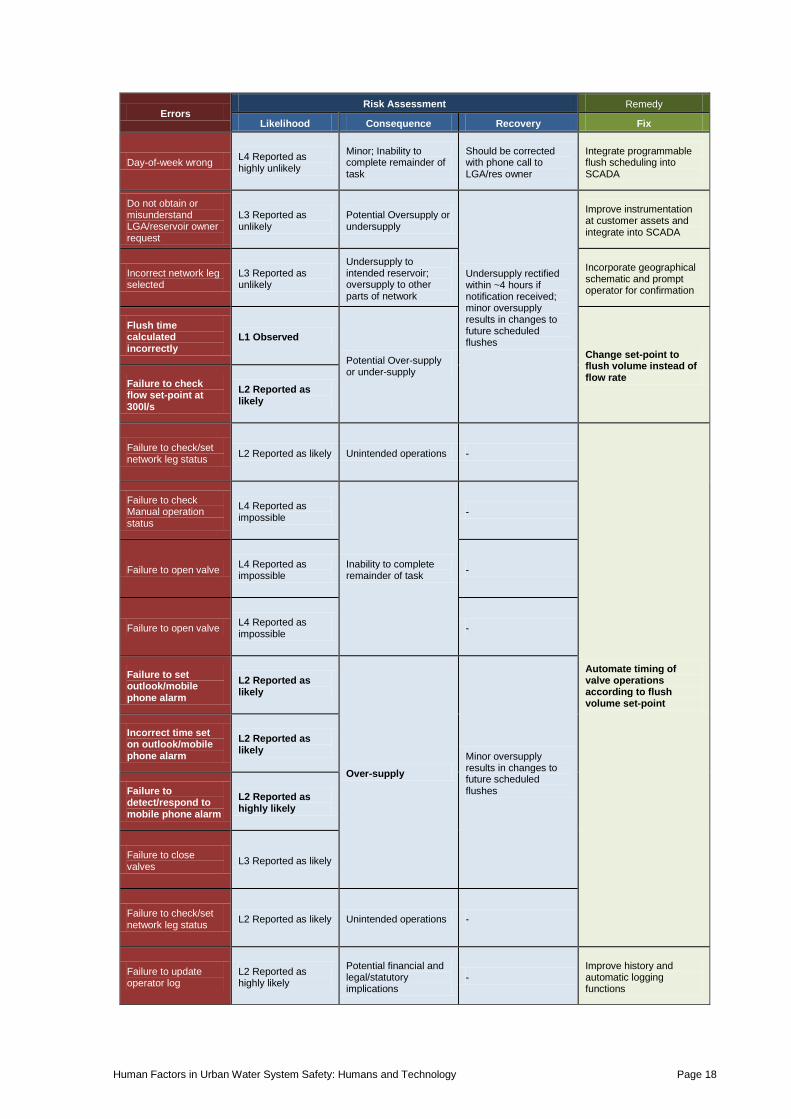
Table 3: Potential Errors in the Flush Task, with Corresponding SHERPA Taxonomic Codes.
Errors Classification
Action Checking Retrieval Communication Selection
Day-of-week wrong C1 Check omitted S2 Wrong selection made
Do not obtain or misunderstand LGA/reservoir owner request
C1 Check omitted R2 Wrong info obtained
I1 Info not communicated
Incorrect network leg selected
A6 Right op on wrong object
C3 Right check on wrong object
S2 Wrong selection made
Flush time calculated incorrectly
A4 Op too little/much
C1 Check omitted
R2 Wrong info obtained
Failure to check flow set point at 300l/s
C1 Check omitted
Failure to check/set network leg status
A9 Op incomplete
C1 Check omitted
Failure to check Manual operation status
A9 Op incomplete
C1 Check omitted
Failure to open valve A8 Op omitted
Failure to open valve A8 Op omitted
Failure to set outlook/mobile phone alarm
A8 Op omitted
Incorrect time set on outlook/mobile phone alarm
A7 Wrong op on right object; A2 Op mistimed
Failure to detect/respond to mobile phone alarm
A9 Op incomplete
R1 Info not obtained
Failure to close valves A8 Op omitted; A9 Op incomplete
Failure to check/set network leg status
A9 Op incomplete
C1 Check omitted
Failure to update operator log
A8 Op omitted; A9 Op incomplete
I1 Info not communicated
Human Factors in Urban Water System Safety: Humans and Technology Page 18
Errors Risk Assessment Remedy
Likelihood Consequence Recovery Fix
Day-of-week wrong L4 Reported as highly unlikely
Minor; Inability to complete remainder of task
Should be corrected with phone call to LGA/res owner
Integrate programmable flush scheduling into SCADA
Do not obtain or misunderstand LGA/reservoir owner request
L3 Reported as unlikely
Potential Oversupply or undersupply
Undersupply rectified within ~4 hours if notification received; minor oversupply results in changes to future scheduled flushes
Improve instrumentation at customer assets and integrate into SCADA
Incorrect network leg selected
L3 Reported as unlikely
Undersupply to intended reservoir; oversupply to other parts of network
Incorporate geographical schematic and prompt operator for confirmation
Flush time calculated incorrectly
L1 Observed
Potential Over-supply or under-supply
Change set-point to flush volume instead of flow rate
Failure to check flow set-point at 300l/s
L2 Reported as likely
Failure to check/set network leg status
L2 Reported as likely Unintended operations -
Automate timing of valve operations according to flush volume set-point
Failure to check Manual operation status
L4 Reported as impossible
Inability to complete remainder of task
-
Failure to open valve L4 Reported as impossible
-
Failure to open valve L4 Reported as impossible
-
Failure to set outlook/mobile phone alarm
L2 Reported as likely
Over-supply
Minor oversupply results in changes to future scheduled flushes
Incorrect time set on outlook/mobile phone alarm
L2 Reported as likely
Failure to detect/respond to mobile phone alarm
L2 Reported as highly likely
Failure to close valves
L3 Reported as likely
Failure to check/set network leg status
L2 Reported as likely Unintended operations -
Failure to update operator log
L2 Reported as highly likely
Potential financial and legal/statutory implications
- Improve history and automatic logging functions
Human Factors in Urban Water System Safety: Humans and Technology Page 19
4.1.4.1. Cognitive Issues
The most outstanding omission in the system was the lack of functionality to control the timing and/or
volume of water movement through the network off-takes. These parameters have to be calculated and
monitored by the operators according to the demands of the customer reservoirs. The crucial system
set-point was not attached to the variable directly under control (flush volume); instead, it was
attached to a variable of a higher control order (flow rate). This is similar to asking a driver to reach
the speed limit by monitoring and controlling their acceleration for an unspecified period of time,
rather than simply monitoring their velocity. Targeting variables at an inappropriate control order
necessitates additional mental calculations (or heuristics, both of which can be grossly inaccurate) and
introduces the need for additional monitoring – in this case timing, which was not supported by the
system, thus further necessitating the introduction of external devices with their own potential human
factors issues.
Further to the issue of inappropriate targeting, error can be introduced at several steps of the flush
process:
1. The operators determine complete flush volume on readings from a cumulative flow meter
which can be reset at any time; and
2. Flushes are performed at prescribed intervals, which may correspond to extremely busy periods.
This issue pertains to a flush being initiated and an incident or high-workload situation
subsequently developing; a flush would not be performed strictly to schedule if such a situation
was already underway3.
4.1.4.2. Human Error Potential
The procedure demonstrated by the operators represents a creative work-around which has developed
because basic functionality for the flush task is not built into the system. Throughout the task analysis
process, the operator who assisted us came across as very optimistic with respect to the likelihood of
human error. From an outsider’s perspective, however, it seems at least logically possible that the
operators could commit fundamental errors, such as selecting the wrong reservoir at the very outset.
The operator did, however, mention that forgetting to close the valves during reservoir flushes is easy
during busy periods, and reported that it occurs with an appreciable frequency – approximately 2-3
times a month. Because the majority of storage reservoirs and balance tanks are kept well below
capacity, the consequences of overfilling from an ill-timed flush operation are generally not severe,
but if the reservoirs are at or near capacity, overfilling can occur.
4.1.4.3. Proposed Solution
A general solution to the potential problems identified would be to automate some aspects of the task.
To address the problem of control order, flush volume should be used as a set-point (rather than flow
rate), and the timing of the valve operations should be automated. The flush process should be
combined with a confirmation/validation process that geographically depicts the part of the network or
particular asset targeted by the action, which would reduce the likelihood of operators inadvertently
performing actions on wrong parts of the network. The potential effectiveness of the first part of this
solution was corroborated in discussions with the operators, who indicated a strong willingness for
routine operations like flushes to be managed by the system. However, because two fundamental
parameters tend to fluctuate – supply capacity and local demand – the operators were not in favour of
full automation.
4.1.5. Summary
The control system for water distribution is inefficient and struggling to support the operators in their
duties. In the context of recent organisational changes, this is not surprising. Short-term gains could be
3 Assuming adequate communication between the control room and customer regarding supply levels.
Human Factors in Urban Water System Safety: Humans and Technology Page 20
made by addressing problems in a piecemeal fashion, but the only way to ensure a robust solution
would be a thorough evaluation and overhaul of instrumentation, networking process control, alarm
rationalisation, interface design and appropriate allocation of system functions to automation.
Fortunately, both management and operators are well aware of the system limitations and steps are
being taken to procure a new and more stable system.
4.2. Advanced Water Treatment
The advanced water treatment plant visited by the team is relatively new infrastructure in the Water
Grid. It uses cutting edge water treatment technology to recycle treated wastewater, which is sold to
industrial users and residential sections of the Water Grid with dual-reticulation systems. The plant
uses a process of sedimentation, microfiltration, reverse osmosis and advanced oxidation, and is
capable of producing 70 Ml of water in a 24-hour period. Current production averages 20-23 Ml per
day.
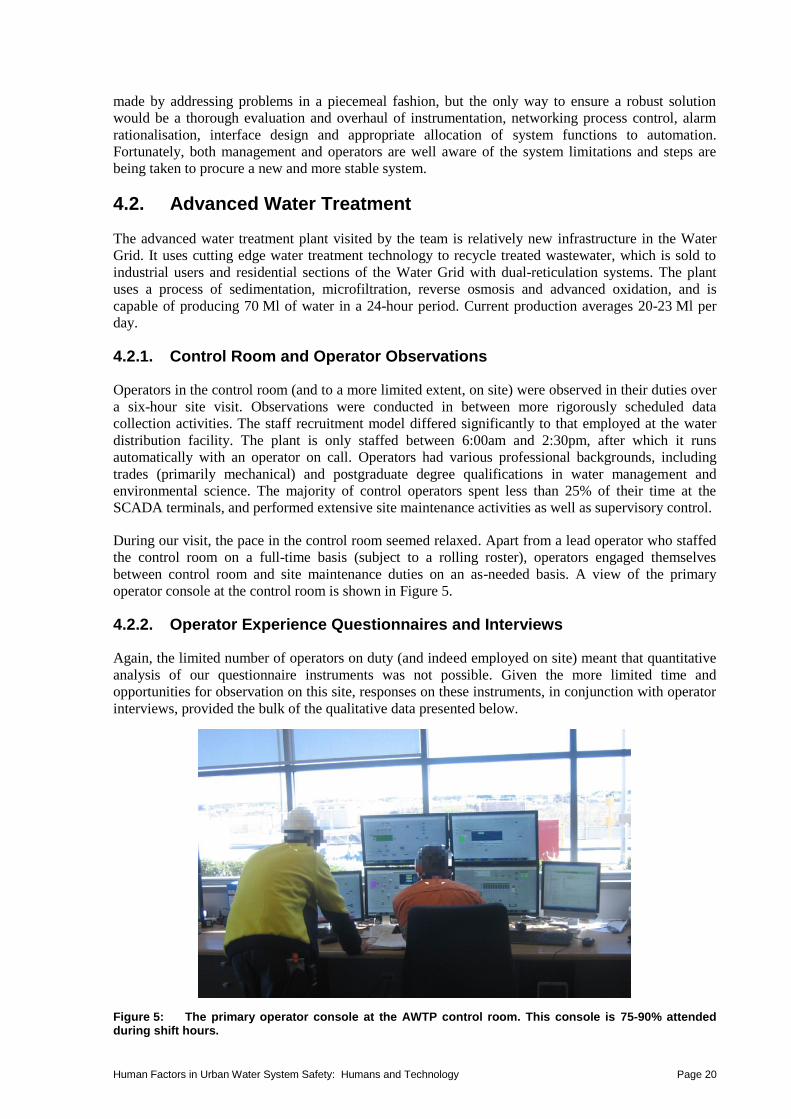
4.2.1. Control Room and Operator Observations
Operators in the control room (and to a more limited extent, on site) were observed in their duties over
a six-hour site visit. Observations were conducted in between more rigorously scheduled data
collection activities. The staff recruitment model differed significantly to that employed at the water
distribution facility. The plant is only staffed between 6:00am and 2:30pm, after which it runs
automatically with an operator on call. Operators had various professional backgrounds, including
trades (primarily mechanical) and postgraduate degree qualifications in water management and
environmental science. The majority of control operators spent less than 25% of their time at the
SCADA terminals, and performed extensive site maintenance activities as well as supervisory control.
During our visit, the pace in the control room seemed relaxed. Apart from a lead operator who staffed
the control room on a full-time basis (subject to a rolling roster), operators engaged themselves
between control room and site maintenance duties on an as-needed basis. A view of the primary
operator console at the control room is shown in Figure 5.
4.2.2. Operator Experience Questionnaires and Interviews
Again, the limited number of operators on duty (and indeed employed on site) meant that quantitative
analysis of our questionnaire instruments was not possible. Given the more limited time and
opportunities for observation on this site, responses on these instruments, in conjunction with operator
interviews, provided the bulk of the qualitative data presented below.
Figure 5: The primary operator console at the AWTP control room. This console is 75-90% attended during shift hours.

Human Factors in Urban Water System Safety: Humans and Technology Page 21
4.2.2.1. Alarms
The alarm system stood out immediately as more sophisticated and functional than the one examined
at the water distribution facility. This was not particularly surprising given that the plant is new and
quite constrained in size. However, the use of advanced water treatment technologies (microfiltration,
reverse osmosis, UV disinfection) and the higher degree of automation mean that the control network
is not necessarily less complex. In the interview process, the operators did report that more
improvements were required, but stated that the functionality of the current system was a vast
improvement over the first few years following the establishment of the plant.
Grouping of correlated alarms was in place to prevent alarm flooding and operators reported that it
worked well. However, an unintended consequence of alarm groupings was the occasional situation in
which fault diagnosis was impeded, as parts of the process control logic and corresponding interface
are highly detailed and sequential. Operators suggested that improvements to drill-down functionality,
and one-click localisation of alarms to the relevant SCADA screen, would solve these problems.
A recent introduction to the system, universally appreciated by the operators, was the ability to shelve
nuisance alarms on the basis of a number of criteria, including priority, type and physical location.
4.2.2.2. Opportunities for operator feedback
It was reported that getting changes made to the system was overly restrictive. Also, some decisions
pursued by control system administrators (see below in Section 4.2.2.3) had unintended consequences
on operator workload.
4.2.2.3. Information Support
Operators generally felt that the system met their information support needs. Criticism of the SCADA
displays and navigation hierarchy was minor and piecemeal. However, operators claimed that some
aspects of general system function, particularly those pertaining to network security, required
extensive work-arounds which significantly increased the time required to perform simple routine
tasks. The most outstanding example was the removal of Microsoft office from SCADA terminals,
which the operators use for daily reporting. Previously, operators would dump trending information
directly into Excel and produce a report in approximately 15 minutes, but the introduction of strict
network security protocols meant that a complicated data transfer procedure had to be followed, which
often took over two hours.
4.2.2.4. Automation
The plant was designed to run unstaffed, and does run outside of the eight hours staff are onsite, with
one operator on call (i.e., with access to alarms via mobile phone). Significant improvements to
overall water supply system security in the last few years have created conditions of low demand for
recycled water, which means that the plant’s full capacity for automation has not yet been realised.
Abnormal events during automatic running are dealt with in a conservative fashion, with thresholds
for automatic shutdown set relatively low.
4.2.3. Analysis: Compliance with Best Practice
The system demonstrated better compliance to 2007 EEMUA best practice guidelines than the system
analysed at the bulk water distribution facility. A senior operator/maintainer completed the SCADA
design checklist and rated 21 of the 40 items as compliant. Minor departures included the following
items in Table 4.
Human Factors in Urban Water System Safety: Humans and Technology Page 22
Table 4: Departures from 2007 EEMUA Best-Practice Guidelines.
Best-Practice Departure Comments
Use of colour not restricted to alarm functions. Colour is used to designate functional properties in schematics, such as operational status. Recommendations are that displays are primarily monochrome, with the excellent alerting properties of colour assigned to alarm functions only.
No one-click integration of alarms to relevant screens/schematics.
Click-to-navigate functionality reduces the operators' reliance on memory and saves time navigating to the appropriate screen to deal with the problem. The lack of this functionality is particularly problematic if the operators' mental model of the network is inconsistent with the SCADA system. Alarm documentation including detailed information on fault diagnosis and step-by-step instructions for remedying the situation should be available at a mouse click.
Rectangles used in overview screen to designate functionally different plant components.
Major system components should be differentiated symbolically. This was a major omission in an otherwise good human-machine interface.
4.3. Comparison Between Sites: Alarm System Benchmark and Classification
Converging evidence from the research methods was used to evaluate alarm system performance
against the EEMUA (2007) benchmarks. System performance is classified according to a number of
dimensions, with outcomes categorised along a five-point scale (overloaded, reactive, stable, robust
and predictive). The guidelines clearly state that the final category could probably not be achieved
with current technology, so a classification of ‘robust’ could be considered in line with best practice.
Like many qualitative, discrete approaches to assessment, there are instances in which criteria are met
for some aspects but not others. Thinking of the performance benchmark as a continuum therefore
makes the task of assessment considerably easier. The benchmark classification document is too large
to be included in the body of this report, but can be accessed at
https://www.dropbox.com/sh/eqjqmvdb9e2euk5/YX2QjENJla. Blue arrows designate the BWTA placements on the
performance continuum, green arrows the AWTP. The BWTA alarm system can be characterised
largely as reactive, which means that considerable improvements are required. The AWTP system, on
the other hand, meets the criteria for a stable system, but a few key omissions prevent it from
achieving the best possible ranking.
4.4. Comparison to Other Industries
Portions of the operator experience questionnaire were developed for a cross-industry survey of alarm
systems in the chemical and power generation industries (Bransby and Jenkinson, 1998). This study
was commissioned by the United Kingdom Health and Safety Executive, and represents the first and
largest of its kind. Ninety-six control room operators across thirteen sites participated. Response
distributions from this survey are depicted in the pie charts in Figure 6. We could not recruit a
sufficient number of operators to perform a formal statistical comparison to these data (because
sufficient numbers do not exist), but for the purposes of qualitative comparison, the responses of
individual operators from the two sites we visited are superimposed.
This exercise suggests that the operators’ perceptions of the alarm systems, whilst variable, do not
differ dramatically to those in the other industries. There were a few notable exceptions, however,
mostly in how the distribution operators felt the alarm systems supported their activities during
incidents and network upsets. They were unanimous in their declaration of the system as a nuisance,
with one operator stating that the alarm list was not referred to at all under these conditions. Given that
the systems investigated in the previous survey represent the technology and management practices of
15 years ago, this is cause for some concern.

Human Factors in Urban Water System Safety: Humans and Technology Page 23

Human Factors in Urban Water System Safety: Humans and Technology Page 24
Figure 6: Findings of this report against previous survey in chemical and power industries (Bransby and Jenkinson, 1998). Pie charts depict previous survey results, white drops represent responses of distribution operators, black drops advanced water treatment operators.

Human Factors in Urban Water System Safety: Humans and Technology Page 25
5. DISCUSSION
The research described in this report has shown that applying a human factors-style approach can find
system potential deficiencies and offer user-centred design solutions to help ensure a safe, productive
and reliable water system. A recap of the main findings is presented below, followed by conclusions,
recommendations and avenues for further research.
5.1. Summary of Main Results
The key findings are that there is considerable room for improvement in human factors issues such as
alarm handling and interface design, although there were important differences between the two sites
in terms of the sociotechnical reach of operations, the nature and complexity of the operators’ roles,
and – importantly – the necessity and urgency of change.
At the BWTA control room, many avenues for improving system stability and reducing operator
workload were found. The BWTA control room does not operate along traditional process control
lines, and at times the operators’ role can be more readily likened to military command-and-control,
e.g., detailed task preparation for major network maintenance, working out isolation strategies and
coordinating workers in the field. The complex monitoring and communication role of the operator in
this context requires extensive support from the supervisory control system, and this was found to be
inadequate in several ways. Alarm flooding was common, operator interfaces suffered from a lack of
consistency and integration, and tasks were not appropriately delegated to human operators and system
automation – for example, up to 50% of the operators’ time was spent manually maintaining an
inefficient and potentially highly disordered log. In no small part, the problems identified at the
BWTA control room are problems of inheritance owing to the recent changes in the sector, and efforts
are underway to improve both technical and human aspects of the system.
The AWTP control room, on the other hand, represents state-of-the-art process control. Being newly-
commissioned, it represented a considerably better integrated process control system. A sophisticated
and highly consistent alarm management philosophy was in place, alarm flooding did not occur, and
operators’ criticism of the SCADA system was only minor. However, the system fell short of the
highest standards of industry best practice in regard to the lack of click-to-navigate functionality for
alarms and the lack of online alarm documentation.
Similar applied research studies in other technical domains have found similar issues. Operator
evaluations of alarm systems did not differ substantially to user-centred evaluations in the chemical
and power industries, although the extent to which the BWTA alarm system did not assist operators
during abnormal situations stood out as a potentially serious problem. There are other industries in
which the acquisition of new assets and implementation of new technologies proceeds in a way that
does not adequately consider the human element. Research using a very similar human factors toolkit
showed that control rooms in the minerals processing industry (Li et al., 2011) have a similar pattern
of poor human-technology integration.
5.2. Future Research
Our research activities were subject to time and funding limitations, and many other facets of risk
management in the water sector deserve empirical attention. Principal among them are the inter- and
intra-organisational communication issues uncovered in Stage 1. Whilst not strictly within the remit of
a human factors approach (at least not from the user-centred perspective adopted in Stage 2), these
problems resonate strongly with aspects of risk management and accident prevention frameworks
proposed by the likes of Rasmussen (1997), Reason (1990) and Hollnagel (2004). At the time of
writing, amalgamation of the Water Grid entities had been put forward as a priority by the newly-
elected State Government. The consequential effects of this amalgamation will provide fertile ground
for research into government influence and organisational issues.

Human Factors in Urban Water System Safety: Humans and Technology Page 26
Opportunities for observation and data collection in this project were limited to routine control room
operations. This was owing to the extreme logistical difficulty of gaining access to control room
facilities during incidents and emergencies, not to mention the risks and attached ethical
considerations. Exploration of human factors issues surrounding abnormal situations would probably
have to assume a retrospective approach, and there is no shortage of examples where this approach has
been successfully applied in other industries, notably in mining (Horberry and Cooke, 2010). A review
of documented emergency management procedures could be undertaken relatively easily, and the
procedures could be tested in desktop simulations (Fuller et al, 2012). It is easy to argue, however, that
the lack of any real emergency seriously limits the validity of such simulation approaches, particularly
when the control room is geographically separated from the location of the emergency (as it is with
water distribution).
5.3. Conclusions and Recommendations
Work presented in this report is an encouraging start to a fuller understanding the role of the human
operator in the water sector, which should lead to improvements in efficiency and stability of system
function. To achieve the best possible outcomes, broader applications of the same approach are still
required. This section will outline a prescriptive approach to user-centred design and evaluation. This
should be seen as part of an ongoing and iterative process, which should be clearly situated within a
broader risk management framework.
As discussed in the opening sections of this report, modern approaches to safety and risk management
view the user as a dynamic, integral part of a sociotechnical system, rather than limiting the focus
simply to improvements in technological sophistication and reliability. Improper understanding of user
interactions leaves ‘human error’ as an encompassing stop-rule in investigations when things go
wrong and, quite inevitably, little progress toward system improvement can be made. This stands in
contrast to a clear consideration of the needs and abilities of users, and the inclusion of them in design
and procurement decisions, which is the recommended course of action for addressing human factors
issues in complex industrial systems.
5.3.1. Human-Centred Design
The philosophy of user-centred design is neatly encapsulated in the following statement by usability
pioneer Donald Norman:
“. . . user-centred design emphasises that the purpose of the system is to serve the user, not to
use a specific technology, not to be an elegant piece of programming. The needs of the users
should dominate the design of the interface, and the needs of the interface should dominate
the design of the rest of the system.” (Norman 1986).
Our discussions with control room operators and observations of work practices revealed several
departures from this ideal, and one of the key messages emerging from this research is that operator
expertise is an underutilised resource. The following section outlines the principles of user-centred
design prescribed in ISO 13407:1999, which is a set of process guidelines to help optimise human-
computer interactions.
1. Active involvement of users and a clear understanding of user and task requirements.
a) Approaches including cognitive task analysis (see Section 5.1.4) ensure that the user’s
activities and potential for errors are systematically understood. Findings from task
analysis exercises should be directly linked to development processes. An example from
the present research was the finding that the SCADA system did not adequately support a
routine activity (reservoir flush), forcing operators to derive error-prone (if creative)
work-arounds.

Human Factors in Urban Water System Safety: Humans and Technology Page 27
b) Involving operators in higher-level decision-making processes is also empowering, and
gives them a sense of value, responsibility and ownership. Findings from Stage 1 of this
project indicated that consultation with operators regarding procurement of fluoridation
equipment was clearly lacking. Had a more mature approach been used, one of the latent
conditions leading to the North Pine fluoridation incident would probably have been
eliminated.
2. Appropriate allocation of function between users and technology.
a) Allocation of function is one of the more difficult aspects of this approach, and has been
labelled (somewhat mischievously) a ‘black art’ (Sheridan, 2000). Nonetheless, even a
relatively brief interview process can reveal inefficiencies which can be remedied quite
simply through automation, as we discovered in talking to distribution operators about the
excessive time demands and vagaries of maintaining the operator log.
3. Multi-disciplinary design.
a) Commissioning of a software interface for a complex sociotechnical system frequently
requires expertise from a wide range of domains, including:
i. Most importantly, the end user;
ii. Management, including those with financial responsibility for the commission;
iii. Application domain specialists (e.g., process control engineers, chemists,
microbiologists);
iv. IT personnel (e.g., systems analyst/engineer, programmer);
v. User interface/interaction designer;
vi. Human factors and human-computer interaction specialist; and
vii. Technical documentation authors and trainers.
In a wide range of work contexts, the gap between end-users and new technology is widening, which
introduces problems which did not exist before the technology was introduced (Vicente, 2005). It is
only through the application of human-centred methods that technology and humans can be
appropriately integrated in a work system. The key message emerging from this project is that the
water sector has not embraced a risk management framework which shows adequate consideration of
the dynamic interactions between infrastructure and equipment, workers, management, regulators,
government and consumers. Doing so will ultimately reduce the likelihood of adverse events and
ensure the security of water grid operations into the future.
Human Factors in Urban Water System Safety: Humans and Technology Page 28
APPENDIX
System Overview
South East Queensland (SEQ) is a major Australian population centre. Brisbane City and the regional
centres of Moreton Bay, Gold Coast, Sunshine Coast and Ipswich have a combined population of
approximately 2.5 million people, and SEQ is expected to reach over 4 million by 2031 (Queensland
Government, 2011). Water supply to South East Queensland is managed by three government-owned
companies. Seqwater holds responsibility for catchment management, treatment storage and production
(recycling and desalination), Linkwater manages bulk water transport, and the Water Grid Manager is
responsible for oversight and strategic direction. The focus of this investigation is the operational side of
the water grid – treatment and distribution.
Treatment, Storage and Recycling
South East Queensland’s drinking water is sourced from 12 storage and flood mitigation dams with a
combined capacity of 2.22 million megalitres. Recycled water is produced at three advanced water
treatment facilities with a combined production capacity of 232ML/day, and currently distributed to
industrial and agricultural customers. A desalination plant with a capacity of 133ML/day produces water
which is supplied to residential customers in the southern legs of the SEQ water grid.
Conventional water treatment processes (Coagulation-Flocculation-Sedimentation-Filtration-Disinfection)
take place at the majority of South East Queensland’s 46 water treatment facilities. Depending on the risks
associated with source water, some plants use additional advanced treatment processes including UV
oxidation and activated carbon filtration. The largest water treatment facility is located at Mt Crosby,
approximately 25km from the Brisbane CBD. This is the only treatment plant which is staffed 24 hours a
day and serves as a control hub for other major treatment plants in the grid. Site operations are monitored
through a networked SCADA system running on a Ci-tect software platform.
Bulk Water Transport
Linkwater’s transport infrastructure includes 28 balance tanks and reservoirs, 22 pump stations, six water
quality treatment facilities and 535km of transport pipelines. Network operations are centrally managed
through a control room consisting of five independent SCADA platforms, which control different
geographical sections of the network. Infrastructure localities are stored in a GIS system which is not
integrated into the SCADA networks. The 24/7 central control room is generally staffed by two operators
during daylight hours and one operator at night. Control room facilities are regularly used by network
engineers and management personnel. The organisation of the SCADA platforms is a consequence of
relatively recent asset amalgamation (previously, local government authorities had the responsibility for
water grid operations within their geographically-defined boundaries). At the time of writing, Linkwater
had put out a tender for the design and installation of an integrated SCADA network.
The final stage of water supply to the majority of SEQ customers is through gravity-fed storage reservoirs
and balance tanks. Consumption from a typical urban storage reservoir is approximately 1-2ML per day.
Reservoir levels are monitored by the organisation, and flushes (level top-ups) are conducted on a routine
basis, usually three times a week. Most pumping and transport operations are undertaken at off-peak
electricity tariff periods, between 11pm and 6am.
The extensive infrastructure network has a very active maintenance schedule. Maintenance operations
often require entire sections of the network to be isolated, which involves the coordinated activity of
control room operators, who determine an appropriate isolation strategy to ensure water supply to the
affected network area; together with fitters, electricians and other field personnel who act under the
direction of the control room, manually opening/closing valves, bringing equipment on/off line, etc.
These major responsibilities are undertaken almost exclusively from the control room, which acts as a
communication hub and low-level ‘command-and-control’ facility for operational aspects of the
organisation. This distinguishes the control room somewhat from others in process control domains, in that
tasks tend to be discrete and monitoring occurs over a much longer time scale. It is only when emergencies
and incidents require multi-organisation coordination that the control responsibilities are shared with an
incident room. Seven operators with various trade and technical backgrounds are employed.

Human Factors in Urban Water System Safety: Humans and Technology Page 29
REFERENCES
Cloete, S.R., Horberry, T.J., and Head, B.W. (2011). Human factors in urban water system safety: Stage 1:
Initial findings. Urban Water Security Research Alliance Technical Report No. 46.
Fuller, R., Cliff, D. and Horberry, T. (2012). Optimising the Use of an Incident Management System in
Coal Mining Emergencies. Australian and New Zealand Disaster and Emergency Management
Conference, Brisbane, 16 – 18, April 2012. Available at: http://anzdmc.com.au/proceedings.pdf
Head, B.W. (2010). Water policy: Evidence, learning and the governance of uncertainty. Policy and
Society, 29, 171-180.
Hollnagel, E. (2004). Barriers and Accident Prevention. Aldershot, Hampshire.
Horberry, T. and Cooke, T. (2010). Using the Critical Decision Method for Incident Analysis in Mining.
Journal of Health and Safety Research and Practice, 2(2), 10-23.
Horberry, T., Burgess-Limerick, R. and Steiner, L. (2010). Human Factors for the Design, Operation and
Maintenance of Mining Equipment. CRC Press, Boca Raton, FL.
Hrudey, S. E., and Hrudey, E. J. (2004). Safe Drinking Water: Lessons From Outbreaks in Affluent Nations. London: IWA Publishing.
International Standards Organisation (1999). Human-centered design processes for interactive systems.
ISO-13407
Jamieson, G. A., and Vicente, K. J. (2005). Designing Effective Human-Automation-Plant Interfaces: A
Control-Theoretic Perspective. Human Factors: The Journal of the Human Factors and Ergonomics Society, 47(1), 12-34. doi: 10.1518/0018720053653820
Li, X., Powell, M and Horberry, T. (2012). Human factors in control room operations in mineral
processing: Elevating control from reactive to proactive. Journal of Cognitive Engineering and
Decision Making, 6(1), pp 88-111. doi 10.1177/1555343411432340
Meshkati, N. (1991). Human factors in large-scale technological systems' accidents: Three Mile Island,
Bhopal, Chernobyl. Organization Environment, 5, 133-154.
Nachreiner, F., Nickel, P., and Meyer, I. (2006). Human factors in process control systems: The design of
human–machine interfaces. Safety Science, 44(1), 5-26. doi: 10.1016/j.ssci.2005.09.003
EEMUA (2007). Alarms systems: a guide to design, management and procurement. London: The
Engineering Equipment and Materials Users’ Association (EEMUA).
Norman, D. A., and Draper, S. (Eds.), (1986). User Centered System Design: New Perspectives on Human-
Computer Interaction. Hillsdale, NJ: Lawrence Erlbaum Associates
Rasmussen, J. (1997). Risk management in a dynamic society: A modelling problem. Safety Science, 27,
183-213.
Reason, J. (1990). Human Error. Cambridge: Cambridge University Press.
Sheridan, T. B. (2000). Function allocation: algorithm, alchemy or apostasy? International Journal of Human-Computer Studies, 52(2), 203-216.
Simpson, G., Horberry, T. and Joy, J (2009). Understanding Human Error in Mine Safety. Ashgate Press,
Farnham UK.
van Eerd, D., Cole, D., Irvin, E., Mahood, Q., Keown, K., Theberge, N., . . . Cullen, K. (2010). Process and
implementation of participatory ergonomic interventions: a systematic review. [Review].
Ergonomics, 53(10), 1153-1166. doi: 10.1080/00140139.2010.513452
Sheridan, T. B. (2000). Function allocation: algorithm, alchemy or apostasy? International Journal of
Human-Computer Studies, 52(2), 203-216.
Stanton, N.A. (2004). Systematic Human Error Reduction and Prediction Approach (SHERPA). In N.
Stanton et al. (Eds.) Handbook of Human Factors and Ergonomics Methods. CRC Press, Boca
Raton, FL.
Vicente, K.J., V., and Christoffersen, K. (2006). The Walkerton E.coli outbreak: A test of Rasmussen's
framework for risk management in a dynamic society. Theoretical Issues in Ergonomics Science, 7,
93-112.
Wu, S., Hrudey, S., French, S., Bedford, T., Soane, E., and Pollard, S. (2009). A role for human reliability
analysis (HRA) in preventing drinking water incidents and securing safe drinking water. Water
Research, 43(13), 3227-3238. doi: 10.1016/j.watres.2009.04.040

Urban Water Security Research Alliance
www.urbanwateralliance.org.au