human factors and wireless network...
TRANSCRIPT
UMINF 06.34
Human Factors andWireless Network Applications
More Bits and Better Bits
Greger Wikstrand
Department of Computing Science,Umea University
Umea 2006

Department of Computing ScienceUmea UniversitySE–901 87 Umea, Sweden
Copyright c© 2006 Greger Wikstrand and co-authors except as [email protected], [email protected]
ISSN 0348–0542 ISBN 91–7264–205–X UMINF 06.34
Printed by Print & Media, Umea University, Umea, 2006.

Abstract
Imagine a taxi driver wanting to watch a football game while working.Events in the game cannot be predetermined, the driver’s available atten-tional resources vary and network connections change from non-existing toexcellent, so it will be necessary to develop a viewing application that canadapt to circumstances. This thesis presents a system model and sketchesa framework for design and run time adaptations. The model has threelayers: user/usage, application and network. Quality of service metrics areproposed for each layer. A particular emphasis is placed on the differencebetween the user/usage layer and the application layer. Satisfaction at theformer means a job well done, a match played to your liking etc. Satisfactionat the latter means good picture quality, nice colours etc. The thesis con-tinues by identifying and describing elements required to build the systemused by the taxi driver.
Three studies are presented where either bandwidth or delay are variedat the network level. Video is better the higher the bandwidth; animationscan be used as a complement. They are shown to be better than low qualityvideo but worse than high quality video for watching a football game. Bettervideo in the form of higher frame rates turned out to be worse for playinga card game over the Internet. A possible explanation is the distractionexperienced when the image is updated constantly. Another result of ourstudies is that users can adapt their mental effort to the actual load whengiven feedback on the network delay affecting a computer game.
The results mentioned above show that it is possible to compensate forpoor network performance. For the user, improved network performance isgenerally more satisfactory. Early multicast collision detection is a methodfor improved multicast performance in high load IEEE 802.11 networks.Prioritised repeated eliminations multiple access is a method for multicastand other traffic which can be used alone or in an IEEE 802.11 network.Probabilistic performance analysis and simulations show that both protocolsdrastically reduce the time spent in collisions and improve throughput com-pared to IEEE 802.11. Some of the formulae are applied to EY-NPMA aswell; they are used to estimate performance and to estimate optimal operat-ing parameters more efficiently than with previously known methods.
i

Sammanfattning
I avhandlingen beskrivs ett hypotetiskt system som kan anvandas av mobilaanvandare, bland andra taxichaufforer, som exempelvis vill folja en viktigfotbollsmatch. Flera faktorer staller till problem: Ibland star bilen still ochforaren har inget annat att tanka pa an matchen. Ibland kor denne runt meden kund som inte vill bli stord av matchen. Dessutom kan det vara svart atttitta pa rorliga bilder och kora bil samtidigt. I och med att bilen kors runthar man ocksa olika bra anslutning till Internet vid olika tillfallen det kanvariera mellan inget alls, en dalig GSM/GPRS forbindelse (8 kbps) och ensnabb WLAN anslutning (100 Mbps).
I avhandlingen presenteras en tre-lagers modell som kan anvandas foratt beskriva den har typen av applikationers kvalitet. Modellen delas in itre lager: natverk, applikation och anvandare/anvanding. Det sistnamndalagret ligger utanfor det tekniska systemet och definieras av att det ar darde verkliga informationsutbytet sker. Pa applikationsnivan samlas data in,packas och packas upp i samband med natverkstransport och visas sedanfor anvandaren. Det ar ocksa har som eventuell interaktion sker medanvandaren. Natverkslagret ar ansvarigt for andmalsenlig transport av data.
De tre lagren ar omsesidigt beroende av varandra. Dalig prestanda pa ettlager paverkar de andra lagren och tvartom. Tre studier har genomfortsav hur problem pa natverkslagret i form av begransad bandbredd och hogfordojning paverkar anvandarna.
Lag bandbredd ger lag videokvalitet vilket inte uppskattas av anvandarnamen genom att skifta till animeringar som fungerar med lagre bandbreddkan man anda fa anvandarna nojda. Om anvandarna maste valja mellandalig videokvalitet och animeringar valjer de som ser sig som fotbollskun-niga det forstnamnda och de som ser sig som okunniga men dock fotbolls-fans valjer det sistnamnda.
Men i en annan studie dar anvandarna spelade bluffstopp mot varandraover ett datanatverk fick vi ett annat resultat. Dar var det negativt med hogrevideokvalitet (bilder per sekund). En forklaring kan vara att anvandarnadistraherades mer av hogre bildfrekvens.
I den tredje studien studerades vad som hander i Pong om man laggerin fordrojningar i spelet. Sedan tidigare visste man att det blir svarare attspela med fordrojningar sarskilt om man inte marker dem. Vi stallde ossfragan om man kan kompensera for dem genom att informera anvandarnaom dem. Det visade sig att anvandare som far information med i vartfall en prediktiv visning lattare anpassar sin mentala insats till uppgiftenssvarighetsgrad.
Det ar alltsa inte bara mojligt utan ibland ocksa onskvart att utnyttja enlagre bandbredd fran anvandarens perspektiv. Med det sagt finns det anda
ii

langt fler situationer dar det ar battre med battre natverksprestanda. Pong-spelet var roligare med lagre delay. Videon uppfattades som battre medhogre bandbredd i den forstnamnda studien.
Multicast, dar ett paket skickas till flera anvandare i stallet for att de skafa varsin, identiska paket, ar ett viktigt verktyg for att fa battre prestanda ivideoapplikationer. Tyvarr ar det inbyggda stodet for multicast i den viktigaIEEE 802.11 standardfamiljen for tradlosa natverk mycket outvecklat. Ettstort problem ar att det inte gar att veta om ett paket har kommit fram ellerom det har forsvunnit i en, mycket trolig, krock.
Vi har vidareutvecklat och anpassat en foga kand krockdetektionsmekan-ism fran 80-talet for anvanding i IEEE 802.11 natverk. Den anpassade algo-ritmen kallar vi EMCD vilket ar en forkortning for ‘‘Early Multicast CollisionDetection’’ eller tidig krockupptackt for multicast. Vi har presenterat en nysannolikhetsbaserad modell for att berakna algoritmens prestanda undermaximal belastning. Modellen som har verifierats genom simuleringar kanaven anvandas for att berakna optimala parametrar for algoritmen. Algo-ritmen har visats kraftigt reducera risken for oupptackta kollisioner ochreducerar den tid som gar at for dem.
EMCD-algoritmen inspirerade till att utveckla en ytterligare algoritm sominte bara kan upptacka utan ocksa undvika kollisioner: PREMA som star for‘‘Prioritized Repeated Eliminations Multiple Access’’ eller prioriterad kanal-atkomst med upprepade eliminationer. Det finns tva viktiga skillnader mel-lan hur de fungerar. I EMCD bygger kollisionsdetektionen pa rektan-gelfordelade slumptal och en enda upptacktsomgang. I PREMA anvandsi stallet geometriskt fordelade slumptal och upprepade omgangar. Effek-ten blir att man med stor sakerhet far en enda vinnare. Aven for PREMApresenteras en sannolikhetskalkylsbaserad prestandaanalys for maxlastfal-let vilken stods av simuleringar.
Samma formler kan anvandas for att approximativt skatta prestanda iEY-NPMA som ar en narliggande algoritm. Den var tankt att anvanda iHiperlan/1; en standard som aldrig fick nagot kommersiellt genombrott.Anvander man den modell som vi presenterar i avhandlingens sista studiekan man med ganska god noggrannhet berakna optimala parameterar forEY-NPMA med en berakningsinsats O(mY S) mot O(mES×mY S) for tidigarekanda algoritmer.
iii

iv

Preface
This Ph.D. thesis contains two parts with an opening introduction. The firstpart consists of three papers (A–C) and the second part of three papers (D–F).
Paper A Wikstrand G, Sun J. Determining utility functions for streaminglow bit rate football video. Technical Report UMINF 04.14, Dept. ofComputing Science, Umea University, SE–901 87 Umea, Sweden, 2004.Accepted for publication at IASTED International Conference on Inter-net and Multimedia Systems and Applications, IMSA 2004.
Paper B Wikstrand G, Soderstrom U. Internet card play with video confer-encing. In SSBA 2006. 2006; 93–6.
Paper C Wikstrand G, Schedin L, Elg F. Effects of delay and delay visu-alization on Pong players. Technical Report UMINF 06.42, Dept. ofComputing Science, Umea University, SE–901 87 Umea, Sweden, 2006.
Paper D Nilsson T, Wikstrand G, Eriksson J. A collision detection methodfor multicast transmissions in CSMA/CA networks. To appear in:Wireless Communications and Mobile Computing 2006;doi:10.1002/wcm.421. Copyright c© 2006 John Wiley & Sons Limited.Reproduced with permission.
Paper E Wikstrand G, Nilsson T, Dougherty MS. Prioritized repeated elimi-nations multiple access: A novel protocol for wireless networks, 2006.Submitted for publication to IEEE/ACM Transactions on Networking.c© 2006 IEEE. Reprinted with permission.
Paper F Wikstrand G, Nilsson T. Untruncated eliminations in the EY–NPMAMAC protocol: Performance and optimality, 2006. Submitted for pub-lication to IEEE Communications Letters.c© 2006 IEEE. Reprinted with permission.
v

Other Reports, Articles and Papers
In addition to the preceding works that are included in the thesis, the fol-lowing reports, articles and conference papers have been produced by theauthor in relation to the thesis.
[1] Nilsson T, Wikstrand G, Eriksson J. Early multicast collision detectionin CSMA/CA networks. In Gerla M, Omidyar CG, eds., MWCN 2002.IEEE, Piscataway, NJ, USA, 2002; 294–8.doi:10.1109/MWCN.2002.1045740.
[2] Wikstrand G, Eriksson S. Football animations for mobile phones. InBertelsen OW, Bødker S, Kuutti K, eds., Proc. of NordiCHI ’03. ACMPress, New York, NY, USA, 2002; 255–8.doi:10.1145/572020.572059
[3] Wikstrand G. Improving User Comprehension and Entertainment inWireless Streaming Media. Licentiate thesis, Umea University, Umea,Sweden, 2003.
[4] Wikstrand G, Eriksson S, Ostberg F. Designing a football experiencefor a mobile device. In Rauterberg M, Menozzi M, Wesson J, eds., Proc.of Interact’03. IOS Press, Amsterdam, The Netherlands, 2003; 940–3.
[5] Wikstrand G, Sun J. On the duration and limits of quality of serviceguarantees. Technical Report UMINF 06.36, Dept. of ComputingScience, Umea University, SE–901 87 Umea, Sweden, 2006.
[6] Wikstrand G, Schedin L, Elg F. High and low ping and the game ofPong effects of delay and feedback. Technical Report UMINF 06.41,Dept. of Computing Science, Umea University, 2006. Accepted forpublication at Network and System Support for Games 2004.
[7] Wikstrand G. Network, application and usage a three layer frame-work for QoS-aware service design. In Ghinea G, Chen SY, eds., DigitalMultimedia Perception and Design. Idea Group Publishing, Hershey,PA, USA, 2006; 266–83.
[8] Wikstrand G, Eriksson S, Ostberg F, Sun J, Appelgren O. Designinga mobile soccer experience final report from BASTARD-project.Technical Report UMINF 06.35, Dept. of Computing Science, UmeaUniversity, SE–901 87 Umea, Sweden, 2006.
vi

Acknowledgment
It is hardly original of me to want to thank a lot of people for their variouscontributions to my research and this thesis. My gratitude is no less heartfeltfor being unoriginal. Many of those who deserve thanks are listed belowbut at least as many are not. If you are one of those, please let me know soI can include your name in the second edition. ¨
I would like to thank Else Nygren, Werner Schneider and Alexander Allardand all the other people at the (now defunct) centre for human–computerstudies at Uppsala University. I performed my master thesis there on thedesign of the human–machine interface at electrical power dispatch centersin Sweden. I would also like to thank all the people at Vattenfall with whomI co–operated. The thesis was my first foray into human factors research.
I would like to thank Alain Colmerauer at the Universitee de la Mediter-rannee in Marseille for encouraging me to become a researcher.
I would like to thank Martin Helander, then director of the national gradu-ate school of human–machine interaction, with whom I first started my Ph.D.studies. I would also like to thank my colleagues there: Tilmann Hasselhorn,Lisbeth Almen, Nalini Supramaniam, Fredrik Elg, Hakan Alm, Peter Sven-marck, Martina Berglund, Sidney Dekker, Rita Kovardanyi, Erik Hollnageland all the others at the division of Industrial Ergonomics and in the restof the university. Being a student in the national school was enormouslyrewarding in terms of well–organized courses and contacts with other Ph.D.students and researchers in the field, especially at KTH. I would like to thankall of them for being part of the atmosphere of the school.
I would like to thank my colleagues at Ericsson: Tor Minde, GunnarHeikila, Erik Rosenqvist, Andreas Dekaro, Gothe Lindahl, Erik Jonsson, Kris-ter Svanbro, Tommy Arngren, Marika Stalnacke, Arne Simonsson and allthe others. It was my work there that lead me into this field.
The present thesis is the result of my work at Umea University. I wouldlike to thank all those I have collaborated with. Jerry Eriksson, not least,for helping me secure a position at the department of Computing Science.Professor Lars–Erik Janlert for being my supervisor and allowing me tofind my own way. Professor Haibo Li for taking an interest in my research.
vii

Frank Drewes and Bo Kagstrom for providing much helpful feedback onthis thesis.
I extend my gratitude to professor Mark Dougherty of Hogskolan Dalarnafor helping me find a new working environment when family circumstancesforced me to leave Umea. I would like to thank all the new colleagues Ihave gained there for their support, in particular Jerker Westin, Siril Yellaand Pascal Rebreyend.
Most of all I would like to thank all my collaborators and co–authors. Ifthere is a thesis today it is as much the result of their work as my own.Staffan Eriksson and Frida Ostberg were vital to the Bastard–project. OscarAppelgren played an important role in the same project. Jiong Sun and UlrikSoderstrom were very helpful with their expertise in the application layer ofnetworked multimedia. Lennart Schedin and Fredrik Elg were instrumentalin the Pong–project.
My friend and colleague, Thomas Nilsson, deserves his own paragraph.We have worked together since 2001 when he performed his master thesisunder me at Ericsson. That work lead to his and my first publication at ascientific conference. Expansions of the same work also lead to his and myfirst publication in a scientific journal. We shared an office at the universityfor close to two and a half–years, until I had to leave Umea. There hasbeen a division of labor between us in our research on how to get morebits (higher channel utilization) in wireless networks where I have mostlyprovided the probabilistic analysis and Thomas Nilsson has performed simu-lations. Nonetheless, we have co–operated closely and the result is collective.
I would also like to thank all the technical and administrative staff in Umea,and elsewhere. Without their efforts no work could be performed. I am alsograteful to all the master thesis students and other students that have con-tributed to my research efforts. In particular: Qin Lu, Haishu Zhang, JonasErshag, Lennart Schedin, Patrik Veraja, Thomas Nilsson, Patrik Ekstromand Marika Malmgren.
Finally, I would like to thank my family, in particular my wife MargarethaJosefsson, for all their support and my parents for raising me to be curiousand interested in research.
viii

Contents
1 Introduction 11.1 Scenario . . . . . . . . . . . . . . . . . . . . . . . . . . . . . . . . . . 11.2 Hypothetical System . . . . . . . . . . . . . . . . . . . . . . . . . . . 21.3 Elements of a Solution . . . . . . . . . . . . . . . . . . . . . . . . . 41.4 Research Process . . . . . . . . . . . . . . . . . . . . . . . . . . . . 51.5 Research Goals and Scope . . . . . . . . . . . . . . . . . . . . . . . 6
2 Quality of Service 72.1 Background . . . . . . . . . . . . . . . . . . . . . . . . . . . . . . . . 72.2 Intrinsic or Not? . . . . . . . . . . . . . . . . . . . . . . . . . . . . . 92.3 Quality of Service Taxonomies . . . . . . . . . . . . . . . . . . . . 102.4 A Three-Layer Model . . . . . . . . . . . . . . . . . . . . . . . . . . 202.5 Using the Model as a Design Aid . . . . . . . . . . . . . . . . . . 27
3 Better Bits — Papers A–C 333.1 Streaming Multimedia . . . . . . . . . . . . . . . . . . . . . . . . . 333.2 On the Duration and Limits of Quality of Service Guarantees 363.3 Conversational Multimedia . . . . . . . . . . . . . . . . . . . . . . 393.4 Networked Games . . . . . . . . . . . . . . . . . . . . . . . . . . . . 413.5 Summary . . . . . . . . . . . . . . . . . . . . . . . . . . . . . . . . . . 42
4 More Bits — Papers D–F 454.1 Wireless Networks . . . . . . . . . . . . . . . . . . . . . . . . . . . . 464.2 Multicast in IEEE 802.11 Networks . . . . . . . . . . . . . . . . . 474.3 The Proposed Algorithms EMCD and PREMA . . . . . . . . 504.4 Summary . . . . . . . . . . . . . . . . . . . . . . . . . . . . . . . . . . 54
5 Discussion 555.1 Alternative Explanation . . . . . . . . . . . . . . . . . . . . . . . . . 555.2 Cognitive Quality of Service Reconsidered . . . . . . . . . . . . 575.3 Are the Results Generalisable? . . . . . . . . . . . . . . . . . . . . 595.4 Network Performance . . . . . . . . . . . . . . . . . . . . . . . . . 60
ix

Contents
6 Conclusion 636.1 Findings . . . . . . . . . . . . . . . . . . . . . . . . . . . . . . . . . . 646.2 Contributions . . . . . . . . . . . . . . . . . . . . . . . . . . . . . . . 646.3 Future Work . . . . . . . . . . . . . . . . . . . . . . . . . . . . . . . . 66
A Determining Utility Functions for Streaming Low Bit Rate Soccer Video 79A.1 Introduction . . . . . . . . . . . . . . . . . . . . . . . . . . . . . . . . 80A.2 Related Work . . . . . . . . . . . . . . . . . . . . . . . . . . . . . . . 80A.3 Experimental Method . . . . . . . . . . . . . . . . . . . . . . . . . . 81A.4 Results . . . . . . . . . . . . . . . . . . . . . . . . . . . . . . . . . . . 83A.5 Discussion . . . . . . . . . . . . . . . . . . . . . . . . . . . . . . . . . 87A.6 Conclusion . . . . . . . . . . . . . . . . . . . . . . . . . . . . . . . . . 88
B Internet Card Play with Video Conferencing 91B.1 Introduction . . . . . . . . . . . . . . . . . . . . . . . . . . . . . . . . 92B.2 Method . . . . . . . . . . . . . . . . . . . . . . . . . . . . . . . . . . . 92B.3 Results . . . . . . . . . . . . . . . . . . . . . . . . . . . . . . . . . . . 96B.4 Discussion . . . . . . . . . . . . . . . . . . . . . . . . . . . . . . . . . 96B.5 Conclusion . . . . . . . . . . . . . . . . . . . . . . . . . . . . . . . . . 98
C Effects of Delay and Delay Visualization on Pong Players 101C.1 Introduction . . . . . . . . . . . . . . . . . . . . . . . . . . . . . . . . 102C.2 Method . . . . . . . . . . . . . . . . . . . . . . . . . . . . . . . . . . . 103C.3 Results . . . . . . . . . . . . . . . . . . . . . . . . . . . . . . . . . . . 106C.4 Conclusion . . . . . . . . . . . . . . . . . . . . . . . . . . . . . . . . . 108
D A Collision Detection Method for Multicast Transmissions in CSMA/CANetworks 113D.1 Introduction . . . . . . . . . . . . . . . . . . . . . . . . . . . . . . . . 114D.2 Related work . . . . . . . . . . . . . . . . . . . . . . . . . . . . . . . 115D.3 Early Multicast Collision Detection . . . . . . . . . . . . . . . . . 118D.4 Analytical Evaluation . . . . . . . . . . . . . . . . . . . . . . . . . . 124D.5 Simulation Results . . . . . . . . . . . . . . . . . . . . . . . . . . . . 129D.6 Conclusion . . . . . . . . . . . . . . . . . . . . . . . . . . . . . . . . . 133
E Prioritized Repeated Eliminations Multiple Access: A Novel Protocol forWireless Networks 139E.1 Introduction . . . . . . . . . . . . . . . . . . . . . . . . . . . . . . . . 140E.2 Proposed Algorithm PREMA . . . . . . . . . . . . . . . . . . . 143E.3 Analytical Performance Evaluation . . . . . . . . . . . . . . . . . 144E.4 Simulation Results . . . . . . . . . . . . . . . . . . . . . . . . . . . . 149E.5 Priority Mechanism . . . . . . . . . . . . . . . . . . . . . . . . . . . 154
x

Contents
E.6 PREMA Modifications for Hidden Terminals . . . . . . . . . . . 159E.7 Conclusion . . . . . . . . . . . . . . . . . . . . . . . . . . . . . . . . . 162
F Untruncated Eliminations in the EY–NPMA MAC Protocol: Performanceand Optimality 171F.1 Introduction . . . . . . . . . . . . . . . . . . . . . . . . . . . . . . . . 172F.2 Analysis . . . . . . . . . . . . . . . . . . . . . . . . . . . . . . . . . . . 173F.3 Numerical Results . . . . . . . . . . . . . . . . . . . . . . . . . . . . 174F.4 Conclusion . . . . . . . . . . . . . . . . . . . . . . . . . . . . . . . . . 177
xi

Contents
xii

Chapter 1
Introduction
This chapter outlines a hypothetical system for highly mobile users allowingthem to spectate a football game and interact with other spectators. Thesystem is inspired by the Arena project. Certain elements of the systemneed further study and there is a brief description of what I and others havedone in the area. Finally the research goals and scope is described.
1.1 Scenario
Suppose you are an immigrant working as a taxi driver. Tonight yourfavourite team is playing a very important game but you have to work soyou can not stay at home and watch the game on satellite television or followit on the Internet. Fortunately for you, your team provides a mobile servicefor fans like you.
In order to bring you this service the provider has had to deal with arange of problems: (cf. [9–12])
• During your shift you sometimes drive around with or without cus-tomers and have little attentional resources to spare.
• At other times you are parked waiting for your next customer withnothing else to do.
• Sometimes you are downtown where traffic is dense and the mobilenetwork provides high service levels. Sometimes you are in the coun-tryside where the opposite is true.
• Some of your passengers may be fans like you but most of your timein the car will be spent alone or with uninterested people thus takingaway some of the social dimensions of sports fandomship.
• The mobile phone you are using has limited display and processingresources.
1

1 Introduction
• Even though the game is mostly interesting to you there are parts thatyou could do without while other parts like the winning goal are sinequa non to you.
• Even though you are a huge fan, your network budget is limited andthe total amount of data received must be limited accordingly.
1.2 Hypothetical System
In order to overcome these problems the provider has developed a mobileservice where several different solutions and approaches are combined toprovide an overall experience that you can enjoy and be willing to pay foreven though you are working and watching at the same time. The hypothet-ical system is illustrated in Figure 1.1. The solutions used include:
• An always best connected (ABC) capable device is used. It selectsthe best available wireless connection from among WLAN, WiMAX,WCDMA, GSM etc based on current service level requirements, avail-able connections and pricing options. [13]
• Improved multicast support for WLANs enables higher bandwidth inhot spots. Improved MAC algorithms allow higher bandwidth andprovide improved service differentiation for both unicast and multicasttraffic in WLANs, see Chapter 4 and Papers D–F.
• Together with improved multicast support for WCDMA the improvedWLANs enable a new centralised pre-caching scheme that will enablerevisiting highlights of the game at will, [14].
• Scalable video is used to provide the best possible experience of thegame when appropriate.
• Video is complemented with animations for low bandwidth situationsand to provide additional insights into the game play, see Chapter 3,Paper A and [2, 4, 8].
• Fans can select auditory commentary biased towards their own team[10].
• Fans are able to chat, play games and interact with each other us-ing text messaging or conversational multimedia (CMM) services, seeChapter 3 and Papers B and C.
2

1.2 Hypothetical System
Figure 1.1: An overview of the complete system. Audio, video and positions are captured,encoded, streamed over a mobile or other wireless network and finally displayed in amobile terminal. Illustration by Staffan Eriksson.
3

1 Introduction
• The user is provided with feedback on network conditions and so on inorder to tune user expectations to the achievable system service level,see Chapter 3 and Paper C.
• An overall controller is responsible for providing the optimal me-dia mix based on a negotiation between the user, the application andthe network. The controller takes into account factors such as theusers available attentional resources, the level of interestingness in thecurrent game, available network resources, remaining budget for thegame, the user’s level of knowledge, static and dynamic user prefer-ences etc. See Chapter 2.
1.3 Elements of a Solution
Development of the hypothetical system described above must be guided byan understanding of quality of service (QoS). A useful model of the systemin question is also required. In Chapter 2, an overview of existing quality ofservice taxonomies is presented. After that a system model based on threelayers: network, application and user/usage is introduced and a quality ofservice taxonomy relevant to the three-layer model is presented. There isalso a discussion of how the model and the taxonomy can be used to guidedesign-time and run-time adaptations in order to achieve an optimal userexperience.
In the following two chapters there is a description of how elements ofthe hypothetical system can be built. The elements have been evaluatedand the results are described. In Chapter 3, efforts to improve the overallexperience based on adaptations in the application layer is described as wellas the results at the user/usage level of those adaptations. In Chapter 4,improvements at the network layer are described and so is the impact ofthose improvements on the next higher layer, the application layer.
There is ample evidence for a causal link from the network layer to theapplication layer and from that layer to the user/usage layer. For instance,in the case of streaming, video higher network capacity will allow higherbit-rate video which will lead to a better experience at the user level. Inthe hypothetical system described above there are many other factors andinteractions to consider. For example, in a low-bandwidth situation, wherethe user is presented with low-bitrate video, the experience can be improvedby using the bits in a better way, e.g. through animations, or by providingmore bits and higher bitrate video, e.g. through network improvements. Theimprovements for the user are similar but not identical with these solutions.
4

1.4 Research Process
1.4 Research Process
I started working in this area in 2001 as a research project manager at Eric-sson (Erisoft) AB in Umea. I have continued working in the area ever since.My team at Ericsson was charged with devising ways to provide a largenumber of users in a hot-spot with an interactive multimedia experiencethat would supplement their spectating of an ongoing sport event. A basicpremise was that the users would use their own personal digital assistants(PDA) and connect through a wireless local area network (WLAN) to a local‘‘event server’’. So we could not use any special hardware and very littlespecial software at the client side.
Anyone who is familiar with the constraints imposed by a standard IEEE802.11 WLAN with a large number of users knows that the throughput isseverely limited both on an aggregate, system level and for each user, seePaper F. We would have to assume that the service would see a variableusage level, for instance, after a goal or other significant event many userswould want to watch a replay. We would have a severe ‘‘bandwidth’’ shortageas well as long delays and latencies.
Solutions to the network problem include careful site planning and twonew protocols for more reliable multicast transmissions in a WLAN, Pa-pers D and E and [1]. We must also ensure that the available bits are used asefficiently as possible. Ideas include a new remote pre-caching strategy andthe use of animations instead of or to supplement video, Chapter 3, Paper Aand [2,4,5,8,14]. We needed to know what would be helpful in providing theuser with the best possible event experience. One example in this areas isthat we realised (through literature studies) that some people only come toan event in order to be with a loved one [15]. Assuming that these personswould be rather bored by the event itself we considered the possibility ofproviding them with a computer game through which they could interactwith other similarly minded people in the audience, Papers B and C. Nat-urally, most of the focus on this level was not on that but rather on whatmotivates and engages sport spectators, cf. [15].
Most of the work at Ericsson was conducted in a four-person project team.We also worked in collaboration with Umea university, by engaging studentsin various projects and through a collaboration with Staffan Eriksson atthe School of Design. There was a separate but related project headed byAnders Broberg at the Dept. of Computing Science [16]. Research was alsoperformed by others [17]. The later work at the university was conductedin various groups, please see the Conclusion and the Acknowledgement formore information on who I worked with.
5

1 Introduction
1.5 Research Goals and Scope
This thesis is in the field of human factors in wirelesss computer networks.Studies in this field can lead to new insights not available from a traditionalmedia quality or quality of service perspective. Insights into what users valuewhen using such systems allow improvements to the underlying systems andvice versa. For instance, information about network service levels, e.g. delay,can allow users to adapt their behaviour, the application itself can be changedto accommodate the delay or the network can be improved to eliminate thedelay for certain traffic classes.
These examples show that a single problem can be approached at severaldifferent levels. Research regarding such problems should address andattempt to solve the problems at all those levels. In this thesis the problemsinherent with multimedia applications in wireless networks are addressed atthree levels: the network, the application and the user/usage levels.
The goal of this thesis is to address the problems of the hypotheticalsystem described above by providing and studying some of the elements thatconstitute it. Three classes of multimedia applications have been considered:streaming multimedia, conversational multimedia and networked games. Ineach class, a single exemplar is studied, viz streaming football, a card gameand the computer game Pong. WLAN capacity is also studied and improvedupon.
The thesis is limited to multimedia applications in wireless networks andto the wireless networks required to support them. The work is also limitedto devices such as mobile phones with limited memory, interaction possibil-ities, screen size, processing power and so on. In the experimental studiesin the thesis computers are used to simulate such limited devices.
6

Chapter 2
Quality of Service
In this chapter, we turn to the issue of what quality might mean to a userof the hypothetical system from Chapter 1. Understanding the concept ofquality in this context is important for three main reasons: 1) The servicewill not sell if users do not appreciate it. 2) Our conception of quality willhelp guide development efforts and design-time decisions. 3) The conceptcan be operationalised and used for run-time scheduling of media streamsand resources. It is not sufficient to have a quality concept. A system modelis also required, not least, to map user level concepts to terms useful in theunderlying applications and the supporting infrastructure and vice versa.
2.1 Background
Quality of Service is a term that has been in use for a long time and a termwith an exponentially increasing usage, see Figure 2.1. Usage has increasedmeasured both in terms of the number of records and as a proportionof the total number of records in Inspec. Earlier, the notion was used inconnection with non-computer systems, e.g. the electric grid where it refersto the current keeping a certain frequency etc, cf. [18]. Increasingly, the termhas been used in relation to computer and other communication networks.Not surprisingly, with the present wide-spread usage the term has come tohave different meanings to different people, cf. [19].
According to the Oxford English Dictionary the quality (of something) isthe ‘‘nature, kind or character (of something)’’ and more specifically it is‘‘the degree or grade of excellence, etc. possessed by a thing’’. The ITU(ITU-T Recommendation E.800) defines Quality of Service as ‘‘the collectiveeffect of service performance which determines the degree of satisfactionof a user of the service’’. The definition implicitly excludes external factorssuch as the actual content, the user’s characteristics and environment. Suchexternal factors can have a powerful influence on the degree of satisfaction.
7

2 Quality of Service
1960 1965 1970 1975 1980 1985 1990 1995 2000 2005
101
102
103
Year
Num
ber
of r
ecor
ds
1960 1965 1970 1975 1980 1985 1990 1995 2000 2005
10−4
10−3
10−2
Fra
ctio
n of
all
reco
rds
Figure 2.1: The number of hits (blue,solid line) and their relative frequencies (green,dashed line) for the search “quality of service” or “qos” in Inspec from 1960 to 2001.Both y-axes are logarithmic.
The terms ‘‘system performance’’ and ‘‘network performance’’ are oftenused as synonyms of Quality of Service, or rather they are used by differentpeople to mean the same thing [20]. What the IETF calls Quality of Service,the ITU and ETSI call Network or System Performance. In this thesis, thefocus is on the quality of service as experienced by the end user.
Does quality of service refer to something experienced by the user orsome intrinsic property of a technical system? New terms are introduced inscience to improve our ability to make distinctions and to be more precise.This field is no exception. Researchers propose new terms to refer to thequality of service as experienced by the user, quality of perception (QoP) [21],quality of experience (QoE) [22] and cognitive quality of service (CQoS) [3].In this thesis, the approach is to retain existing terms and place them in asystem model to increase their precision while acknowledging the currentmeanings.
Quality of Service (QoS) is a complex concept in another way. It has atleast three meanings:
• It refers to the performance of underlying layers as judged by them-selves, the IETF interpretation.
• It refers to the performance of offered by one layer to the one aboveit and as judged by the upper layer, the ITU interpretation.
8

2.2 Intrinsic or Not?
• It refers to the mechanism used to provide that quality of service andis measured in terms relevant to the layer offering the service, e.g. [23].
It is important to know what is referred to by quality of service. Who is thejudge of the quality and on which scale is it measured? How can measuresused in one layer be compared to measures used in another layer? Ourquality of service concept should make us able to determine what can andshould be done at each layer to improve quality of service.
2.2 Intrinsic or Not?
When distinguishing between the intrinsic system performance level and theimpact that it has on the user it is important to note a property can be notice-able to the user but remain on the system performance level. Distinguishingbetween the following concepts is helpful when discussing measures andmeasurements in general:
1. The variable, e.g. distance.
2. The metric, e.g. meters or yards.
3. The method, e.g. triangulation or estimation.
4. The measurer, e.g. a person, a machine or a person and a machine.
Consider streaming video quality, it is sometimes measured in terms of thefidelity of the streamed copy vis-a-vis the original [3, 24]. If the degradationis small or unnoticeable the quality is considered to be high. The fidelitycan be measured in several different ways. One might ask a human judgeto compare the copy and the original and rate the degradation or whichversion is better etc. This is often called a subjective measurement. Onemight also have a machine, e.g. a piece of software, rate the degradation a so-called objective measurement. There are researchers working on waysto estimate the ‘‘subjective’’ rating of a certain copy using ‘‘objective’’ methodsbut here problems present themselves. For instance, users like vivid coloursand sharp contours what then is the quality of a copy which is generallydegraded except colours and contours which are exaggerated [25, 26]?
Regardless of how the measurements are made the same variable, fidelity,is being measured although with different metrics, methods and measurers.In my opinion, fidelity is an intrinsic system level property and not directlypart of the degree of satisfaction of the user even if it has a strong indirectinfluence. Also, within the scope of this thesis fidelity can be expected to berather low. It may be more important that the user is able to understandwhat happens in the streaming video than if the video looks good or not.
9

2 Quality of Service
2.3 Quality of Service Taxonomies
Later in this chapter, a three-layer model of networked applications is intro-duced. But we begin by examining a number of existing taxonomies. Theselected articles were found through a search in Inspec for taxonomies,reviews etc of Quality of Service.
The existing taxonomies are contrasted to a three-layer model. A fewwords to introduce the model: The layers are network, application anduser/usage. The network layer is responsible for end-to-end data transport.Information is captured, packaged, processed, displayed and made interac-tive in the application layer. The user/usage layer is outside the technicalsystem. This layer is related to higher level concepts such as meaning.
2.3.1 Vogel et al
Vogel et al [27] introduced a five-category classification of quality of ser-vice parameters. End-to-end delay and bit rate belong to the performance-oriented category. The format-oriented category encompasses video resolu-tion, frame rate and compression schemes. The synchronisation-orientedcategory is concerned with skew between audio and video.1 The cost-oriented category has elements such as connection, transmission and copy-right fees. Finally, the user-oriented category contains things like subjectiveimage and sound quality.
Vogel et al’s categories are shown hierarchically in Figure 2.2 and inrelation to the three-layer model in Table 2.1. End-to-end delay and bitrate are concepts that can be applied to both the network layer and theapplication layer depending on how things are viewed. Delay and low bitrate at the network layer will certainly lead to delay and a low bit rate at theapplication layer but having those problems at the application layer does notnecessarily mean that the problems exist at the network layer. Connectionand transmission costs are clearly network related while the copyright feesare related to the content being viewed and not the way it is viewed andis placed at the user/usage level. As has been discussed above, subjectivequality is not a proper user level concept even though a user is involved inthe measurement. The concepts used in this taxonomy are mainly in theapplication layer.
1See [28] for a thorough treatment of the impact of skew on perceived quality.
10

2.3 Quality of Service Taxonomies
main
performance
format
synchronization
cost
user
end-to-end delay
bit-rate
video resolution
frame rate
compression scheme
skew
connection
transmission
copyright
subj. imagequality
subj. soundquality
Figure 2.2: An overview of Vogel et al [27].
11

2 Quality of Service
Table 2.1: Vogel et al in relation to the three-layer model.
Network Application user/usage
Performanceend-to-end delay
bit rate
Format
video resolutionframe ratevideo com-
pression schemeSynchronisation skew
Costconnection cost
transmission cost copyright fees
User
subjectiveimage quality
subjectivesound quality
2.3.2 Sabata et al
Sabata et al [29] presented a QoS taxonomy based on three types of perfor-mance parameters: timeliness, precision, and accuracy. These parametersare used at two different levels in a system: the application level and theresource level.
The timeliness category includes delay, scheduling, jitter, (temporal) syn-chronisation and ‘‘the statistical distribution of each of one of the aboveparameters.’’2 The precision category includes content precision (meaning),representation precision (data), precision jitter, precision synchronisation andthe ‘‘statistical distribution of the above parameters.’’ The accuracy categoryincludes the accuracy of the content and the representation and their statis-tical distributions.
The authors suggest that there are combinations of these categories, e.g.throughput is a combination of precision and timeliness. Their model alsocovers issues like security and policies. They are beyond the scope of thisthesis.
Sabata et al’s categories are more comprehensive at the user layer thanthe Vogel et al taxonomy, see Table 2.2. They also explicitly recognise theduality between the resource and the application layer. Their resource layeris a somewhat broader concept than the network layer used in this thesisas it includes not only the network but also the hardware on which theapplications run.
2One may note that both delay and jitter are measures of the statistical distribution, i.e. themean and the variance.
12

2.3 Quality of Service Taxonomies
Table 2.2: Sabata et al in relation to the three-layer model.
Network Application user/usage
Timeliness
delayscheduling
synchronisationPrecision representation precision content precisionAccuracy representation accuracy content accuracy
2.3.3 Chalmers and Sloman
Chalmers and Sloman [30] divided QoS characteristics into two groups: tech-nology based and user based. The technology based characteristics weredivided into three categories: timeliness, bandwidth, and reliability. Theuser-based characteristics were also divided into three groups: perceivedQoS, cost, and security.
The timeliness category has three variables: delay, response time and jitter.The bandwidth category also has three variables: system and applicationlevel data rate and transaction rate. Reliability has five variables: mean timeto failure, mean time to repair, mean time between failures, percentage oftime available, loss or corruption of data.
The criticality category has just one variable: importance rating/prior-ity. The perceived QoS category has the following variables: picture detail,picture colour accuracy, video rate (frame rate), video smoothness, audioquality and video/audio synchronisation. The cost category has the per-useand per-unit cost variables. Finally, the security category has the followingvariables: confidentiality, integrity, non-repudiation and authentication butthat is more or less beyond the scope of this thesis.
The Chalmers and Sloman hierarchy is presented in Figure 2.3 and inrelation to the three-layer model in Table 2.3. Their hierarchy has the toplevels user and technology but both levels are mostly concerned with thenetwork and application layers. They are concerned with technical mattersand not the actual usage and meaning of the communication.
The timeliness and reliability categories can be used on both the networkand the application levels in the three-layer model. Transaction rate andimportance can be interpreted as user/usage level variables. That dependson how they are defined and used.
13

2 Quality of Service
main
technology
user
timeliness
bandwidth
reliability
pqosperceived QoS
cost
security
delay
response time
jitter
system level data rate
application level data rate
transaction rate
mean time to failure
mean time to repair
mean time between failures
percentage of time available
loss or corruption of data
picture detail
picture color accuracy
video rate
video smoothness
audio quality
audio video synchronization
per-use
per-unit
confidentiality
integrity
non-repudiation
authentication
criticallity importance rating
Figure 2.3: An overview of Chalmers and Sloman’s taxonomy [30].
14

2.3 Quality of Service Taxonomies
Table 2.3: Chalmers and Slomans categories in relation to the three-layer model.
Network Application User/Usage
TechnologyTimeliness
delayresponse time
jitterBandwidth data rate data rate transaction rate
Reliability
mttfmttrmtbf
% of time availableloss or corruption
UserPerc. QoS
detailcolour accuracy
video ratevideo smoothness
audio qualityskew
Cost per-use/per-unit
Security
confidentialityintegrity
non-repudiationauthentication
Criticality importance
15

2 Quality of Service
video QoS metrics
objective
subjective
frame-based
bit rate-based
packet-based
loss- or corruption-based
PSNR-based
delay based
ACR
DCR
PC
SSCQE
SCDSE
OBE
Figure 2.4: An overview of Curcio’s metrics.
2.3.4 Curcio
Curico [24] defined two main categories of (mobile) video QoS metrics: ob-jective and subjective.
The objective category has six sub-categories: frame-based, bit rate-based,packet-based, loss- or corruption-based, PSNR-based, and delay based.
The subjective category also has six sub-categories: Absolute CategoryRating (ACR), Degradation Category Rating (DCR), Pair Comparison (PC),Single Stimulus Continuous Quality Evaluation (SSCQE), Simultaneous Dou-ble Stimulus for a Continuous Evaluation (SDCSE), and Object-Based Evalu-ation (OBE).
The hierarchy is presented in Figure 2.4. It is evident that all the categoriesand sub-categories/variables belong to the application layer in the three-layer
16

2.3 Quality of Service Taxonomies
model a table is superfluous.
2.3.5 LeRouge et al
LeRouge et al [31] introduced four categories to describe ‘‘medical video-conferencing system quality’’: technology, usability, physical environmentand human element attributes.
The technology attributes have the following subcategories: motion han-dling, image resolution, audio clarity, synchronisation, reliability, peripheralsophistication, ‘‘ergonomic’’, and interoperability.
The usability attributes have the following subcategories: ease of use, easeof learning/training, convenience, usefulness, affordability, ‘‘allows patientcare focus’’, and security.
The physical attributes have the following subcategories: facilitating decor,quiet/soundproof, privacy, adequate space, adequate lighting, and suitabletemperature.
The human elements attribute have the following subcategories: adaptabil-ity, consultant congeniality, patient education/telemedicine orientation, tech-nical support, coordinator management, and scheduling.
LeRouge et al’s taxonomy is presented graphically in Figure 2.5. Thetaxonomy is mostly concerned with concepts related to the two top layersin the three-layer model or concepts external to the model. The physi-cal attributes and the human elements attributes categories fall outside thethree-layer model. The technology attributes concepts belong at the applica-tion layer with the exception of those things directly related to the physicalhardware. Some of the usability attributes subcategories fall somewhere atthe borderline between the application and user/usage levels, e.g. ease ofuse. The ‘‘allows patient care focus’’ subcategory is a clear example of a user/usage layer concept.
2.3.6 Kota and Marchese
Kota and Marchese [19] present a model from the ITU for the classificationof application QoS requirements based on two variables: packet loss toler-ance (error tolerant and error intolerant) and delay tolerance (interactive,responsive, timely and non-critical). For instance, telnet is an interactive,error intolerant application while fax is an error tolerant, non-delay-criticalapplication. IP QoS objectives are introduced as packet transfer delay, delayvariation, packet loss ratio and packet error ratio.
17

2 Quality of Service
MVSQ
technology
usability
physical environment
human element attributes
motion handling
image resolution
audio clarity
synchronization
reliability
peripheral sophistication
ergonomic
interoperability
ease of use
ease of learning/training
convenience
usefulness
affordability
allows patient care focus
security
facilitating decor
quiet/soundproof
privacy
adequate space
adequate lighting
suitable temperature
adaptability
consultant congeniality
patient education/telemedicine orientation
technial support
coordinator management
scheduling
Figure 2.5: An overview of LeRouge et al [31].
18

2.3 Quality of Service Taxonomies
2.3.7 Gozdecki et al
Gozdecki et al [20] based their view of Quality of Service on a general modelconsisting of three levels: ‘‘assessed QoS’’, ‘‘perceived QoS’’ and ‘‘intrinsicQoS’’, [32] cited in [20]. They map the Quality of Service level of the IETFand the Network Performance model of ITU/ETSI to the intrinsic level. TheITU/ETSI QoS level is mapped to the perceived level.
The perceived level is divided into four inter-related units: The QoS re-quirements of the customer, the QoS offered by the provider, the QoSachieved by the provider and the QoS perceived by the customer. Ideally,these four things are all the same. They [20] do not delve further into whatthe customer level QoS might actually be except to say that it has network-and non-network-related components. There must be a meaningful and con-sistent mapping between the network-related components of QoS and thenetwork performance parameters. The mapping itself is not defined.
At the intrinsic level they propose the following minimum set of metrics:Bit rate, Delay, Jitter and Packet loss rate. Another important aspect is theapplicability of the model, e.g. if it is uni- or bidirectional in relation to thetraffic direction or if the QoS is guaranteed or statistical.
2.3.8 Jin and Nahrstedt
Jin and Nahrstedt [33] divide QoS specifications into three layers. The userspecifies his/her expectations at the user layer. These are then translatedmanually or automatically into an application-layer specification. This map-ping is supposed to be independent from any knowledge of the underlyinginfrastructure. Finally, this specification is translated into a concrete andspecific resource-layer specification.
The user-layer specification is specified in terms of perceptive media qual-ity (excellent to bad), window size (big, medium, small), pricing model andrange of price (high, medium, low). The application-layer specification isexpressed in terms of quantitative issues (frame rate, resolution), qualita-tive issues (e.g. synchronisation schemes) and adaptation rules. Finally, theresource-layer is concerned with the same general issues as the applicationlevel but expressed in other terms such as throughput, delay, jitter, memorysize and as more concrete adaptation rules.
2.3.9 Discussion
It is clear, even from the simple enumeration above, that existing taxonomiesare of various types and scope. Gozdecki et al [20] make a valid pointwhen they distinguish between intrinsic, perceived and assessed Quality of
19

2 Quality of Service
Service. I do not share their interpretation of these concepts. The intrinsicQoS is what the system does, they call this network performance. It mighteven be called system performance; the system is more than the network.Naturally there is a distinction between the perceived and the assessed qualityof service but the difference is generally small. The perceived quality ofservice is probably only accessible through the assessed quality of service.The distinction seems academic.
The subjective categories in [24] are variants on the same theme: fidelity.How faithful to the original is the degraded, transmitted copy? The so calledobjective category is more in line with the other taxonomies in this review. [3]
There is a distinction between user-related and system-related aspects ofQuality of Service [20,30,31,33]. Not all user-related aspects have anything todo with the system [20,33]. Those aspects do not have to be excluded from auseful model of quality of service. They are an integral part of the experienceand have a considerable influence on user satisfaction, cf. [31]. The ITU-Tdefinition of quality of service attempts to distinguish the component of thesatisfaction which originate with system performance. It is not clear thatsuch distinctions are possible. All pertinent factors influencing the ‘‘degreeof satisfaction’’ need consideration.
2.4 A Three-Layer Model of Networked Applications
This section introduces a three-layer model of networked applications [3, 7].The model has been used informally in the previous section. It is introducedmore formally here. The layers are, as before, user/usage, application andnetwork. Similar three-layer models have been used by other researchers,e.g. [13, 33, 34]. The layers are defined as follows, also see Figure 2.6:
• The user/usage layer is concerned with anything ‘‘above’’ the hard-ware/software layers such as for instance ‘‘watching football’’, ‘‘playinga game’’, ‘‘talking to a friend’’. It is here that the meaning of the appli-cation resides and it is here that the utility of the application must beultimately judged.
• The application layer is concerned with enabling the usage mentionedabove. The analogue of the previous could be ‘‘streaming video’’, ‘‘amobile game’’, and ‘‘conversational multi-media’’.
• The network layer is concerned with the transport of data and so onas well as connecting various pieces of the application with each other.Concepts on this layer include ‘‘broadband’’, ‘‘WCDMA’’, ‘‘WLAN’’.
20

2.4 A Three-Layer Model
Figure 2.6: Examples of concepts in each layer of the model. Note that there is noone-to-one correspondence between layers, e.g. streaming video can be used for otherpurposes than watching football. [7]
21

2 Quality of Service
Layer
Variable
SubVariable
Metric
Network
Throughput Delay Corruption
bits/s packets/s transactions/s delay jitter BER PER
Figure 2.7: Network Layer Hierarchy
Each of the three layers interact with and put constraints on the otherlayers. For instance a person wishing to follow a football game on his orher mobile phone might use a streaming video application over a mobilenetwork. As the user roams around reception changes and the networkservice level becomes variable and so does the streaming video quality.
Adaptations can take place in all layers of the model. In the network layer,the user might change his mobility pattern to favour better reception or paymore for premium network services. In the application layer, the user mightswitch to a different viewing mode, e.g. from streaming video and audio toaudio only. In the usage layer, the user might even decide to do somethingcompletely different. In principle, it is possible for agents in each of thelayers to cause changes in the other layers or their own layer in order toimprove the adaptation.
The following describes most of the quality of service measures we useand some others in addition to the ones mentioned earlier in this chapter.Placing the quality measures in the model is important because it allows usto decide which measures are more important in a given application.
2.4.1 Network Layer
In the network layer mostly ‘‘objective’’ performance measures are used.The most basic concepts are delay and throughput. The latter is sometimesknown as bitrate or bandwidth [35]. Delay variability is called jitter and issometimes more important than the delay itself [35]. Especially in wirelessnetworks, corruption, e.g. packet loss, is important as it affects both delay
22

2.4 A Three-Layer Model
and throughput [36–41]. If packets are lost, throughput goes down. Therewill be a delay if the packet is retransmitted.
These three variables and some related metrics are shown in Figure 2.7.Bits, packets and transactions per second are throughput metrics. Althoughsimilar they are not the same. A transaction might require more than onepacket. Packets come in different sizes. There is also a trade-off betweenpacket size and throughput as longer packets are more easily corrupted.Corruption is measured as bit-error rate (BER) and packet-error rate (PER).
In most of the studies presented in this thesis, throughput, measured asbits per second or channel utilisation, is the main network layer variable. De-lay is used in some of the papers. In Paper A, different levels of throughputare simulated by using different encoding bit rates for video and animations.This simulates the effects of various network layer throughput. In Paper B,different levels of throughput at the network layer are simulated by usingdifferent spatial and temporal video resolutions. In Paper C, different lev-els of delay at the network layer are simulated by buffering packets in theapplication. In the ‘‘more bits’’ papers, D–F, channel utilisation and through-put are used as the principal evaluation metrics. Packet delivery ratio, acorruption metric, and delay is used in Paper D as additional network levelmeasures.
2.4.2 Application Layer
There are many application-layer, service-level measures. In streamingvideo and conversational multimedia, for instance, there is a host of mea-sures, both objective and subjective, regarding the fidelity of the video com-pared to an (imagined) original, cf. [24].
There are several subjective fidelity measures, e.g. [25, 36, 42–44]. In thedouble stimuli continuous quality scale a human judge express a level ofpreference between an original and a degraded version [25]. In some otherapproaches, the judge is asked to compare the degraded version with animagined ‘‘broadcast quality’’ or the ‘‘live event’’ [43, 44]. In cases whereonly a small level of degradation is to be expected an error detection andannoyance level approach might be feasible [28, 42].
There are also many ‘‘objective’’ measures of service levels here [25,35,41].For video, peak signal to noise ratio is often used, e.g. when comparing videocodecs [25,41]. Other common measures are bitrate, frame rate, spatial andchromatic resolution and so on [35].
Some measures try to predict, based on objectively measurable features ofthe video, how a human judge would subjectively rate the service level. Suchmeasures include the moving pictures quality metric [41] and the perceptualdistortion metric [25].
23

2 Quality of Service
It is much harder to define a single set of variables and metrics to measurequality at the application layer than at the other two layers. The functionalityat the network layer is clearly defined and limited and so are the metricsand variables proposed above. The user/usage layer is more complex but aset of variables is available.
In this thesis, few independent variables are used at the application layer.In the Bastard study (Paper A), video encoding bitrate is used. In the MoCostudy (Paper B), spatial and temporal video resolution is used. In the Pongstudy (Paper C), game latency is used. The reason for using only a fewmetrics and only one in each study was to limit the number of independentvariables and also to avoid in some way the enormous complexity of whatconstitutes quality in this layer.
2.4.3 User/Usage Layer
In traditional usability work, e.g. the ISO 9241-11 standard [45], usability isseen as having three components: efficiency, effectiveness, and satisfaction.The first two can be seen as aspects of ‘‘performance’’. Traditional humanfactors adds yet another component to this: the load on the worker, cf.[46, 47]. This component can not be ignored since in a mobile or nomadiccontext keeping the load at the right level might be crucial for safety reasons,cf [11].
Task performance must be measured in ways that are relevant to eachapplication. For video, examples include the ability to read lips, recognisefaces and emotions, understanding of the presented material and recall ofthings presented in the usage session [43, 44, 48].
Also, the relative importance of each of the three variables will differbetween domains. For games, usage layer quality measures can include thelevel of fun and enjoyment as well as the ability to win the game or geta high score. Specifically for conversational multi-media measures mightinclude how well meaning is conveyed and agreed upon [49].
Here, three variables are used at the user/usage level: the performanceachieved in the usage, the load required of the user and the emotional state,including satisfaction, induced in the user by the usage.
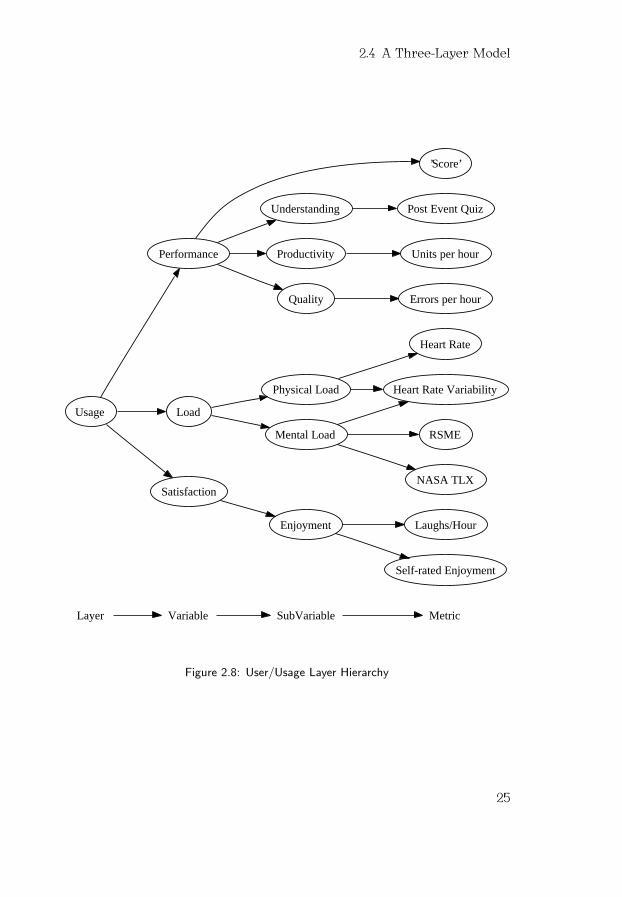
Figure 2.8 shows a model of relevant user/usage layer level measures.Some of them are used in the research presented here. Quality and produc-tivity is not really measured. Physical load was deemed as irrelevant. Moreelaborate measures of enjoyment/satisfaction were avoided, e.g. laughs/hour.The following metrics are used:
• Performance is measured using self-reports (‘‘did you understand?’’ etc,Papers A and B, post-clip quizzes (Paper A) and game score (Paper C).
24
2.4 A Three-Layer Model
Layer Variable SubVariable Metric
Usage
Performance
Load
Satisfaction
’Score’
Understanding
Productivity
Quality
Physical Load
Mental Load
Enjoyment
Heart Rate
Heart Rate Variability
RSME
NASA TLX
Laughs/Hour
Self-rated Enjoyment
Post Event Quiz
Units per hour
Errors per hour
Figure 2.8: User/Usage Layer Hierarchy
25

2 Quality of Service
mental load
performance
satisfaction
emotional background e.g. fandom
experience
content previous knowledge
throughput
frame rate codec
media quality
...
Figure 2.9: Spectating sports using streaming multimedia, an example of interactionbetween the layers. The arrows do not necessarily imply a one way interaction or asimple linear relation.
Subjective understanding is naturally not the same as the score on aquiz but on the other hand, if users believe that they understand wemust respect that to some extent.
• Load, specifically mental load or effort, is measured using the ratingscale mental effort (RSME) [50]. It is a simple and validated scale [51].
• Satisfaction is measured using self-reports. In the Bastard project weasked if the participants considered the clip as good and interestingfootball. In the Pong project we simply asked the participants if theyhad enjoyed the previous game.
2.4.4 Example
A model of how different variables and so on might interact to form a totalsatisfaction of the user in the context of the hypothetical system from theintroduction is shown in Figure 2.9. The total satisfaction together with the
26

2.5 Using the Model as a Design Aid
load and the user performance constitute the user/usage level quality ofservice.
The network-level throughput allows the application-layer streaming-med-ia controller to choose a satisfying combination of parameters, e.g. framerate and codec, which in turn affect the objective and subjective media quality(fidelity). This in turn affects the satisfaction directly, and indirectly throughthe performance and the mental workload. By performance we mean howwell the user is able to understand the meaning conveyed; it is hard to besatisfied if one can hardly see a thing. Increased mental workload can bothincrease and decrease the overall impression. It will also lead to differentlevels of performance as the mental load approaches or supersedes theavailable cognitive capacity [52].
External factors also influence the overall satisfaction, e.g. the user’s emo-tional predisposition, the actual content being transmitted and the user’sprevious knowledge in the field. A knowledgeable user will more easily un-derstand highly corrupted video. Seeing your favourite team win a game ismore satisfying than seeing them lose, especially if you are a huge fan andso on. Other external factors which might influence the overall satisfactioncan be enumerated but are indicated with an empty ellipse in the figure.(Also see Chapter 3.)
The model advises us that we can do things in one layer to compensatefor problems in another layer. For instance, we can drop application layerquality if the ‘‘home’’ team is doing badly so that the user does not have tosee them ‘‘crushed’’. Or we can implement a synchronisation algorithm inthe application layer to compensate for problems in the network. But weare also advised that the layers are connected. A change in any of the layerswill propagate through the system and affect all layers.
2.5 Using the Model as a Design Aid
This three-layer, quality of service model is introduced with the goal that itshall be used in the development of networked applications. In the following,there is a brief description of how the model can be used at design- and run-time to provide a better user experience.
2.5.1 Design-Time Adaptations
In the design of networked multimedia applications several competenciesare involved, but not necessarily in the same design project. For exam-ple, the media level might use a network that was optimised by an externalagency for media data transport. Sometimes, competence from all levels
27

2 Quality of Service
will be gathered in one project. Regardless of whether the design work iscoordinated or not across the levels, designers at each level might benefitfrom knowledge about the other levels. At other times, a cross-layer ap-proach will be required. The following are examples of how more or lessradical design changes on one layer have had effects on the other layers.
Real-time communication between two people, for instance between air-craft pilots and the air traffic control centre or between people watchingthe same television show, has been oral. In the aviation case, problems atthe network level (AM radio) have lead to problems at the application level(poor sound quality) which in turn has lead to errors at the user/usage level(misunderstandings). The AM radio stands to be replaced with a text-basedchat system. In one study, the effects were multi-faceted [53]: Pilots pre-ferred using text in the cruise phase. Cognitive workload increased slightly.The roles of the pilots shifted so that the non-flying pilot became more ac-tive. There were no general effects on situation awareness. When text andoral chat between non-collocated television viewers was studied, youngerparticipants preferred the text chat and vice versa [54].
If two persons play with a ball remotely, does it matter if it is a real ball thatthey kick physically and where the distance is bridged through a networkwith the help of sensors and actuators or if the same game is played on acomputer screen? In both cases exactly the same information is transmittedover the network. Yes, the game is more fun when played with a real ball,participants also said they got to know the other player better and the audioand video quality in the conversational multimedia application used was ratedas higher [55].
In our work, we have shown how animations can in some ways be betterthan video, Paper A. We have also shown that there is a significant impact ofhow these animations are presented as a two dimensional top-down viewor as a perspective view emulating a television camera [2].
2.5.2 Run-Time Adaptations
Run-time adaptations are necessary in a sufficiently variable environment,cf. [56]. When the network level contains at least one wireless link and theuser is mobile the service level that it can provide will be highly variable [57].It is evident that run-time adaptation at one or more levels can allow moreefficient functioning at the other levels. The user is the most adaptableagent in the system. By making the user aware of conditions in the lowerlayers of the system the user will be able to adapt at the usage level. ThePong study presented here (Paper C) shows an example of how users aremore able to adapt the effort they put into playing the game when they areprovided with feedback on the network delay.
28

2.5 Using the Model as a Design Aid
Dra
win
gs c
reat
ed a
nd C
opyr
ight
© G
rege
r W
ikst
rand
200
3 gr
eger
@cs
.um
u.se
Ope
rato
r W
orks
tatio
n(s)
Mob
ile O
pera
tor
Dev
ice
Mob
ile O
pera
tor
Exp
ert
Con
trol
Roo
m O
pera
tor
Content Media Network
WLA
N
GS
M
...
UM
TS
TC
P
IP
UD
P
Aud
io
Vid
eo
Gra
fix
...
SC
AD
A
E-m
eet-
in
gs
...
Content Media Network
WLA
N
GS
M
...
UM
TS
TC
P
IP
UD
P
Aud
io
Vid
eo
Gra
fix
...
SC
AD
A
E-m
eet-
in
gs
...
Network
WLA
N
GS
M
...
UM
TS
TC
P
IP
UD
P
Net
wor
k co
ntro
ller
Med
ia
cont
rolle
r
Use
r co
ntro
ller
SC
AD
A
syst
em
Net
wor
k co
ntro
ller
Med
ia
cont
rolle
r
Use
r co
ntro
ller
CQ
oS
Res
ourc
e A
lloca
tor
CQ
oS
Res
ourc
e A
lloca
tor
Network
WLA
N
GS
M
...
UM
TS
TC
P
IP
UD
P
Network
WLA
N
GS
M
...
UM
TS
TC
P
IP
UD
P
Network
WLA
N
GS
M
...
UM
TS
TC
P
IP
UD
P
Network
WLA
N
GS
M
...
UM
TS
TC
P
IP
UD
P
Figure 2.10: A framework for run-time QoS adaptation
29

2 Quality of Service
A system with run-time adaptation at each level is presented in Figure 2.10.In the figure there is a box called SCADA system. The intention is to illus-trate a process control system. The supervisory control and data acquisitionsystem (SCADA) will be able to provide information about system state whichmight be crucial for adaptations in the conversational multimedia subsystem.For instance, in a crisis situation communication cost might be totally negli-gible.
Back to the framework. An adaptation agent is introduced to control eachlayer. An overall QoS adaptation agent co-ordinates adaptation efforts acrossthe levels, cf. [58]. The adaptation agents are responsible for gathering dataabout system performance at their level and for implementing decisionsfrom the overall adaptation agent. Agents have one or more of the followingthree abilities at the reporting side: reporting past and current performanceat the level, predicting future performance, presenting options for adaptation.
A system for dynamic mapping from user/usage level quality of serviceterms (QoP) to network level terms has been proposed [59]. Other systemsfor mapping from application level terms to network level terms have beenproposed, e.g. [33]. In the Bastard study, we proposed a simple mechanismto allow the user to select the appropriate media mix [4]. The controls areshown in the lower right corner of the user interface in Figure 2.11. Theuser selects the desired mix between of animation and video and selects thedesired video quality level by tapping on the controls. Instant feedback onthe per-unit price is given next to the controls 5.20 in this case.
The entire always best connected (ABC) concept is a good example of howa system connects to the best available wireless network based on a set ofquality of service criteria, e.g. [13]. A further example is the simple prioriti-sation mechanism provided in PREMA (Paper E). This mechanism makes itpossible for a user to get the desired quality of service at the network level.Adaptations might also take place at the application layer. One example is aproposed video conference system where the system automatically switchesbetween cameras, e.g. close-up on speaker or overview, in order to improvethe user experience [60].
30

2.5 Using the Model as a Design Aid
Figure 2.11: A prototype user interface to the studied hypothetical system. Video inthe background is overlaid with an animation. The animation can be annotated withteam centre of mass, defence line and a ball trace by using the controls on the right.The controls in the bottom right corner of the display allow the user to select a mixbetween video and animation. “5.20 kr/min” is the current per minute price for thisservice level. [4]
31

2 Quality of Service
32

Chapter 3
Better Bits — Papers A–C
This chapter summarises three of the studies in this thesis and adds someadditional results, Papers A–C. Paper A is concerned with some aspects ofthe hypothetical system described in the introduction, i.e. with the streamingvideo and its alternative streaming animations. In Paper B, conversationalmultimedia is studied. Four persons play a card game where lying andcatching lies are important. The game is played over the Internet withCMM as a replacement for the usual eye-to-eye contact when players sitaround the same table. Finally, in Paper C, we study the impact of latencyon a networked game. The following sections provide some backgroundand summarise the main results.
3.1 Streaming Multimedia
Spectating sports is a favourite pastime of many. Often this is done bywatching a sports event through television, sometimes by following it on theradio or reading about it in the newspaper. Sometimes it is done by watchingthe event on site. We predict that in the future, consumers will want to havea personalised sports spectating experience even on the move.
Knowing what enlightens and emotionally involves a spectator is not easy;very little research has been conducted in the area [61]. There seems to bethree main factors which interact and influence the spectator’s reactions toa sports event: his or her level of knowledge of the sport in question, hisor her level of fandom for the event participants, and the outcome of theactual event itself. Some of the things we do know is that: [2]
• The enjoyment of seeing one’s favourite team is higher for more highlyidentified sports fans [15].
• Both highly and lowly identified fans enjoy a narrow win more than awin by a great margin [15].
33

3 Better Bits
• The levels of drama, suspense, novelty, and effectiveness are positivelycorrelated with the enjoyment of watching a game [10].
• Hearing a commentator with a bias to the fan’s preferred team in-creases the enjoyment of watching the game [10].
• Spectators with a high or low knowledge level are relatively quiet dur-ing a game but spectators with a medium knowledge show relativelystrong reactions to relevant events in the game [62].
In recent years, there has been a movement towards ‘‘enhancing the ex-perience’’ for sport spectators by providing them with new information innew ways. There are four underlying trends behind the movement:
• More information is gathered from the sports event, e.g. position [63,64], heart rate, breathing, and additional cameras [65].
• Information from the event is distributed in new ways, e.g. DVB [66],the Internet [17] and mobile networks [65, 67].
• New ways of interacting with the information and the event are madeavailable, e.g. on-line betting, blurring the spectator/participant distinc-tion, cf. [16].
• Mobile and Internet technology has allowed viewing and interactingwith the event through new devices, e.g. game consoles and mobilephones, and in new contexts, e.g. while moving, at home, at the event.
In the Bastard project, we deal with a situation where a user wants toaccess this kind of service as described in the introduction. The biggestproblems are access cost and network-layer, service-level variability. As auser moves around and as other conditions change in the network, differentbandwidth is available and at different prices. There is a similar problem inthe user/usage layer. The user will exhibit different levels of interest duringa game and also will not be interested in paying for maximum bandwidththroughout a game as that would be prohibitively expensive.
We devised a solution in the application layer which meets the require-ments posed by the network in the form of variable service levels and fromthe user in terms of different cost as a function of time. Our proposed so-lution is to code the game both as video (Figure 3.1a) and as position basedanimations (Figure 3.1b). The positions would then be rendered as simplegraphics in the user terminal. Streaming the positions would require lessthan 1 kbps while the video might go as high as 350 kbps. Together thetwo different modes provide a wide range of requirements on the network.
34

3.1 Streaming Multimedia
(a) Video (b) Animation
Figure 3.1: A video 3.1a frame from the experiment and the corresponding animation3.1b frame. From Paper A.
The system would then switch between different levels of video quality andthe simple, position-based graphics based on input from the user as well asnetwork conditions and the (cost of) available bandwidth.
It turned out that the position based animations are more popular than wehad imagined, especially among users who were not as knowledgeable in thetarget sport in comparison to low bandwidth (20 kbps) video. Almost all theparticipants prefer high-quality video; their secondary choice was 39% forlow bitrate video and 49% for animations, Paper A. Further analysis througha binomial logistic regression has shown that self-reported football knowl-edge was a signficant factor B = 0, 735 for low bit-rate video as a secondhand choice and B = −1, 000 for animations. Self-reported football fandomalso has a significant effect (B = 0, 714) on the preference for animations. Inother words: people who like football but do not know a lot about it preferthe animations.
The animations were easier to understand while the video was more emo-tionally effective. Figure 3.2 illustrates how a secondary task affected theperceived emotional effectiveness and the video quality. Video quality wasjudged to increase with low bit-rate video when the secondary task washarder, Paper A and [2, 4].
35

3 Better Bits
None Easy Hard5
6
7
8
9
10
Secondary task
Em
otio
nal E
ffect
iven
ess
animation28kbps video384kbps video
(a) emotional effectiveness
None Easy Hard4
5
6
7
8
9
10
11
Secondary task
Vid
eo q
ualit
y
animation28kbps video384kbps video
(b) video quality
Figure 3.2: Significant interactions between coding and secondary task. From Paper A.
3.2 On the Duration and Limits of Quality of ServiceGuarantees
In Chapter 2, a run-time adaptation mechanism was proposed. If such amechanism should exist, would users like the bitrate to adapt often or seldomand would they like to have a larger or a smaller variance if the averagebit-rate was the same? An experiment was devised to study these questions.1
The experiment was conducted in two parts. In both parts the video qualityswitched automatically between predefined quality levels. In the first part,video quality was varied less (30, 40, 50, 60, 70 kbps) or more (10, 30, 50,70, 90 kbps) and the quality was varied often (every 15 s) or seldom (30 s).There were two clips 600 seconds long. In the second part, the same clipsas in Paper A was used but cut to a uniform length of 80 seconds. Qualitywas varied by shifting randomly between animations, low and high bit-ratevideo, often (every 10 s), medium often (20 s) or seldom (40 s). The exacttreatments are described in Table 3.1.
The clips were played in an emulated mobile phone on a computer screenwith RealPlayer used to display the video. The transitions between differentquality levels were achieved using a SMIL-file which was generated for eachuser. At each transition it was equally likely to move to each of the otherquality levels except the current one.
1A full report on the experiment is given in [5].
36

3.2 On the Duration and Limits of Quality of Service Guarantees
Table 3.1: The treatments. From [5].
Treatment Part 1 Part 31 LLA1 LHB2 L13 M2 H32 HLA HHB M1 H2 L33 LHA LLB H1 L2 M34 HHA HLB H3 M2 L1
1 Low dwell time, Low bit rate variability range,clip A.
2 Low dwell time, High bit rate variability, clip B.3 Low dwell time, clip 1.
3.2.1 Results
Both application and user/usage level measures were used to rate the clipsby the 48 participants. Because of random software crashes useful data wasavailable from 32 of them in the first part and 46 in the second part. As faras we can ascertain, the crashes were random and not related to any specificusers or treatments.
The results were analysed using multivariate analysis of variance (MANOVA)in SPSS, see Table 3.2. A significance level of p < .05 was used. There weresignificant main interactions between range of variance and dwell time for‘‘easy to understand’’ and ‘‘pay SEK 25’’. There were significant main effectsof range of variance on ‘‘overall impression’’, ‘‘interesting sequence’’, ‘‘ac-ceptability’’, ‘‘pay SEK 5’’, and ‘‘compared to TV’’. There were significant maineffects of dwell time on the ‘‘compared to live’’ variables. With a significancelevel of p < .0013, i.e. correcting for the family-wise error only the effectson ‘‘easy to understand’’ and ‘‘interesting sequence’’ were significant.
The significant interactions were followed up by a test of simple effects.There were no significant simple effects of range of variance but the datasuggests that a high range of variance should be accompanied by a highdwell time and vice versa.
The significant main effect of dwell time is hard to analyse. The averagerating was 1.32 with low dwell time and 1.03 with high dwell time. Bothvalues are close to the end of the scale. We have no good explanation forthis result.
The averages underlying the significant main effects on range of varianceare shown in Table 3.3. It is clear that a low range of variance is betterthan a high one. The reason for this might be that users value low qualitymuch lower than high quality. Video quality ratings are not a linear functionof bitrate. In a previous experiment, we had shown that for clips from thesame game could be fitted to a second-degree curve so that ratings increasedmuch more rapidly for lower bit-rates than for higher ones the averagefor overall impression corresponding to low and high range of variance
37

3 Better Bits
Table 3.2: Main effects and interactions, part 1. From [5].
Average SignificanceDwell time Low High
Range Low High Low HighDwelltime Range
Dwelltime×Range
Overall impression1 2.69 2.37 2.56 2.19 0.651 0.021 0.827Easy to understand 2.63 1.75 2.50 2.44 0.492 0.003 0.010Interesting sequence 3.00 2.00 3.38 2.69 0.303 0.005 0.581Good and exciting
football 2.69 2.81 3.69 3.81 0.107 0.659 1.000Acceptability ofvideo quality 2.56 2.06 2.19 2.00 0.541 0.032 0.315
SEK 1?2 4.56 5.50 4.44 5.31 0.201 0.352 0.851SEK 5? 3.56 2.94 4.06 3.94 0.244 0.047 0.178SEK 25? 2.38 1.75 1.50 1.81 0.365 0.486 0.043Compared to live 1.25 1.38 1.06 1.00 0.041 0.711 0.270Compared to radio 2.88 2.81 3.81 4.13 0.072 0.439 0.249Compared to TV 1.56 1.31 1.38 1.19 0.479 0.035 0.755Compared tonewspaper 4.44 4.44 4.69 4.44 0.840 0.529 0.529
Quiz score3 2.75 2.88 2.94 2.75 0.886 0.924 0.6321 The variables were rated as integers from 1 (‘‘bad’’) to 7 (‘‘good’’).2 The question for the SEK X rows was: ´If it would cost SEK X to watch a clip
like the one you just saw with your favourite team in a decisive game, would itbe very expensive (1) to very inexpensive (7)?
3 The quiz score ranged from 0 to 6.
Table 3.3: Average values of variables with a significant range main effect. From [5].Range
Low HighOverall impression 2.63 2.28Interesting sequence 3.19 2.34Acceptability of video quality 2.38 2.03SEK 5? 3.81 3.44Compared to TV 1.47 1.25
38

3.3 Conversational Multimedia
conditions would be 3.1 and 2.9 respectively [3]. The values are slightlyhigher but the trend is the same. So the explanation for this result mightwell be that users hate low quality much more than they love high quality.
Not surprisingly, as we only altered the dwell time, there are no interestingor significant effects in the second part. The lack of an effect of dwell timeis called ‘‘duration neglect’’ and has been reported by others, cf. [68]. Thiseffect is problematic for the approach where a service level is negotiatedfrom end-to-end in the network and then regularly renegotiated. Statisticalquality of service guarantees may be more easily implemented and have thesame value to the end-user.
3.3 Conversational Multimedia
Conversational Multimedia, or CMM, is used as the underlying application intelemedicine, teleconferencing and many other telepresence systems. Voiceand video calls are simple forms of CMM. Often, CMM systems are used toallow collaboration and co-operation on a common task. It has been shownthat at least for more complex tasks, voice and video is better than just voiceeven if the participants do not notice the difference [49]. It has also beenshown that at least 15–16 frames per second (fps) are required for manytasks such as lip reading [48].
If a little video is a good thing, more must be even better? We know, forinstance from Paper A, that alternative presentation formats might be prefer-able under some circumstances. Higher frame rates may lead to poorer per-formance in a computer supported collaborative work (CSCW) setting [69].In one study, lie detection performance was poorest with medium-qualityvideo [70].
In order to study this we conducted an experiment where groups of fourstudents played Bluffstopp against each other. Bluffstopp is a card gamewhere lying and detecting lies are rewarded. We let them play against eachother over the Internet using multicast audio and video to allow them to seeand hear each other. Video quality was the independent variable with eitherhigh or low frame rate and high or low spatial resolution.
The setup used is illustrated in Figure 3.3. This is the experiment leaderview. The participants only saw the three other participants and the gameitself, upper right corner of this view.
It turns out that the participants preferred the lower frame rate condition.An explanation for this might be that the video was more of an annoyancethan a help. The participants’ primary focus was probably on the game and itis possible that their gaze was drawn to the video more often with the higher
39

3 Better Bits
Figure 3.3: The experiment leaders view. The participants would only see the Appletand their three co-participants. From Paper B.
40

3.4 Networked Games
Figure 3.4: The Pong game used in the project. A (faint) shadow on the left providesfeedback to the user about the delay. From Paper C.
frame rate. However, no confirmation of this phenomenon was found in aliterature search.
3.4 Networked Games
A basic problem in networked games is that one or more users might bedelayed in relation to each other or to a central server if there is one. Thiswill have an effect on the user/usage layer as users will try to compensatefor the resulting lack of responsiveness and inconsistent behaviour whichresults [71].
Existing solutions on the network layer are mostly concerned with orbased on providing or obtaining differential quality of service or guaranteedquality of service. They will not be discussed further here.
On the application layer many different solutions have been suggested.The most common might be so-called dead reckoning [72]. Other solutionsare based on being able to go back to a previously known safe state, e.g.time warp and trailing state synchronisation [73]. The first solution is basedon retracing the execution back to a safe point. The second solution isa simplified version of the first. In it, a delayed version of the game isrun as a special process. When a problem occurs its state is copied to allparticipating entities. Yet another type of solution is to avoid inconsistency
41

3 Better Bits
between different entities by using time buckets or breathing time buckets[74,75]. In this type of solution each message is delayed at the receiving endfor a period of time which is dependent on the known delay between thesending and receiving processes until it is safe to assume that all recipientshave received all the messages for that time step.
Each of the three different types of solutions creates problems in theusage layer while attempting to solve problems in the network layer. Deadreckoning leads to inconsistencies when it turns out that the simulated trackdiffers from the actual track. Time warp creates huge inconsistencies whenthe game suddenly moves back to a previous state. Time buckets introduceadditional delay but mostly avoid inconsistencies.
We studied a solution which made a change in the application layer [6].It was aimed at making the user in the usage layer more adapted to thedelay problems in the network, cf. [71]. In a simple two-player game, Pong,we introduced a delay as well as some sort of feedback to the user aboutthe level of the delay, Figure 3.4 and cf. [76]. It turns out that having thefeedback does let the user adjust to the level of the delay in a better way,i.e. the mental effort was more adapted to the delay and the user was moretolerant to the delay Figure 3.5. Other researchers have performed a similarstudy regarding collaborative virtual environments [76].
3.5 Summary
In this chapter, Papers A–C are summarised and expanded upon. The mainmessage of this chapter is that poor network performance can be compen-sated for in several ways in the application layer. Sometimes the net resultis improved quality of service at the user/usage layer. Having said that, goodnetwork performance is still better than poor network performance, seePapers A and C in particular. The main results are:
• Switching to a different media stream can have a profound impact onthe user/usage level quality of service. (Paper A)
• More resources at the application layer does not necessarily producehigher quality of service at the user/usage layer. (Paper B)
• Giving the user feedback about network problems allows the user toadjust his or her behaviour to match leading to improved user/usagelayer quality of service. (Paper C)
42
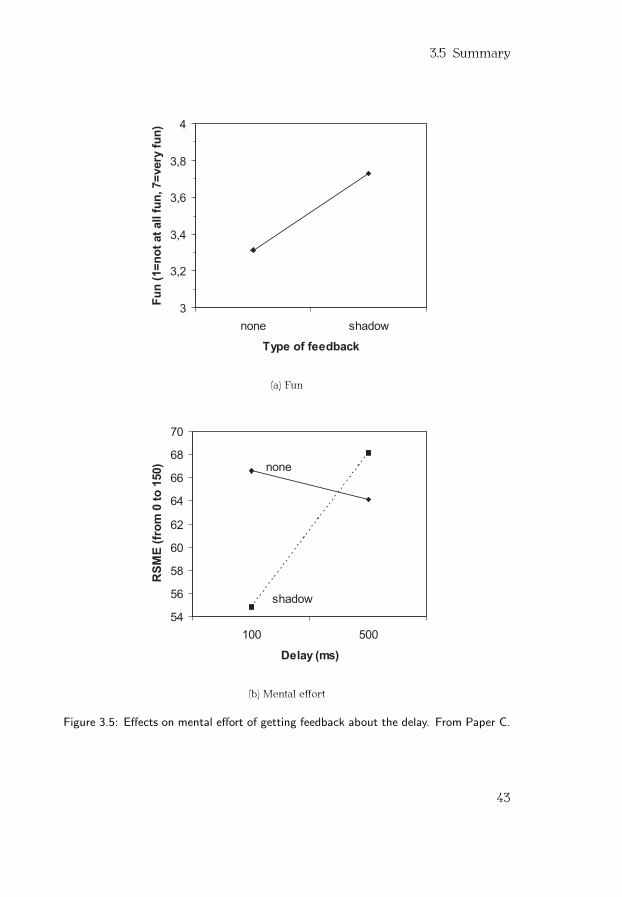
3.5 Summary
(a) Fun
(b) Mental effort
Figure 3.5: Effects on mental effort of getting feedback about the delay. From Paper C.
43

3 Better Bits
44

Chapter 4
More Bits — Papers D–F
The network layer1 is naturally very important in any networked applicationand the focus of much work in the system performance and quality of serviceresearch and development communities. We realised early on that currentwireless standards, viz IEEE 802.11 [77], are inadequate for the kinds ofapplication domains we are interested in. The main problem is their inabilityto provide access to a large number of simultaneous users with acceptableperformance levels. Because of the way they operate, they do not exhibitacceptable performance when there is heavy load and many users.
One of our proposed solutions, the ‘‘smart cache’’ [14], relies on reason-ably performing multicast but at that time it was not at all available in theIEEE 802.11 standard except perhaps if the point coordination function (PCF)would be used which was on the other hand not implemented in most com-mercially available products. Further, the research presented in this the-sis indicates that higher throughput and lower delays are preferable eventhough there are ways to compensating for deficient connections, Chapter 3.
The experiments presented in the previous chapter were based on simu-lated network performance levels. In this chapter, two methods which wouldenable those performance levels in reality are presented. Early MulticastCollision Detection (EMCD) improves multicast traffic performance signif-icantly in 802.11 networks with mixed multicast and unicast traffic. Priori-tised Repeated Eliminations Multiple Access (PREMA) performs significantlybetter than 802.11 networks under saturation conditions.
This chapter is organised as follows: First, wireless networks in generaland 802.11 and EY-NPMA networks in particular are introduced. Then theproblems with multicast are outlined and some known solutions are pre-sented. After that EMCD and PREMA are introduced and performanceresults are given.
1As the term is used in this thesis.
45

4 More Bits
4.1 Wireless Networks
This thesis is concerned with single-hop wireless computer networks. Suchnetworks are either centralised with a common controller, e.g. mobile2 andsatellite networks, or decentralised with emergent control, e.g. wireless lo-cal area networks (WLAN) where the system control is an emergent featureof the actions taken by individual nodes rather than as directed by a basestation. Hybrid networks exist, e.g. the 802.11 standards provide two modes:the distributed co-ordination function (DCF) and the point co-ordination func-tion (PCF). The central controller, called the access point can enter the latterstate when it has access to the channel. Here the scope is limited to purelydecentralised networks.
Several standards exist for such WLANs. The IEEE 802.11 family of stan-dards (WiFi) is probably the most well-known but other standards exist, e.g.Hiperlan/1 and 2 and Bluetooth (which might or might not be classified asa WLAN standard). To appreciate the work presented in this thesis at leasta superficial understanding of 802.11 and of the EY-NPMA mechanism ofHiperlan/1 is required. Short descriptions are provided below. More detaileddescriptions are found in Sections D.2, E.1 and F.1.1 of the papers.
IEEE 802.11 The DCF mechanism used in IEEE 802.11 networks is basedon the carrier sense multiple access with collision avoidance algorithm(CSMA/CA). A number of stations form a network. Access to the networkis granted in the following way: stations sense the channel, if it is idle for asufficient period of time called the inter frame space (IFS) a station with apacket to transmit will start to decrease its back-off counter (BO) each timeit senses the channel idle during a period of time called a slot. If the chan-nel is not idle, i.e. another station has begun transmitting the procedurestarts over. When the BO reaches zero the station will transmit its messageand wait for an acknowledgement (ACK) from the receiver. If no ACK isreceived the assumption is that the packet was lost in a collision. The stationnow selects a new BO from the contention window (0, CW ) where CW isdoubled after each collision up to a maximum called CWmax and reset toCWmin after a successful transmission. [77]
EY-NPMA In elimination yield non-preemptive priorities multiple access(EY-NPMA), the node is required to sense the channel idle for a periodof time after the previous transmission called the channel synchronisationinterval, followed by a number of priority assertion slots. If no nodes with ahigher priority have done so, the node will transmit a priority assertion burst
2Some might prefer the term ‘‘cellular’’.
46

4.2 Multicast in IEEE 802.11 Networks
and will then start competing with the other nodes with the same priorityby transmitting a burst the length of which is sampled from a truncatedgeometric distribution. At the end of the burst, the node will sense thechannel idle during the survival verification slot. Most likely, it will now bethe only node left but it is possible that it is not. For that reason, the nodewill sample a random uniform number of yield slots during which it willsense the channel idle before transmitting the main message. In brief, thenode with the highest priority, longest burst and shortest yield period willbe allowed to transmit. [78]
Advantages IEEE 802.11 networks work relatively well under low-load con-ditions and with hidden terminals. EY-NPMA networks work well underlow-load and saturation conditions at least as long as there are no hiddenterminals and the number of stations is limited [79, 80].
Problems There are many problems with the two mechanisms describedabove. One of the problems with 802.11 is the way the size of the contentionwindow is regulated. Some of the known solutions include slower decreaseof its size and the selection of optimal contention windows based on the cur-rent load. A main problem with EY-NPMA is that it does not work very wellwith hidden terminals, i.e. when there are terminals/nodes/stations whichare not in range of each other but are trying to transmit simultaneously tonodes which are in range of the other nodes.
4.2 Multicast in IEEE 802.11 Networks
Multicast traffic, i.e. the single transmission of a packet to a set of wirelessreceivers, is essential for multimedia services such as streaming multimediaat a hot spot, or conversational multimedia. Without multicast each mediastream must be transmitted once for each recipient, thus using N times moreof the capacity without providing any additional benefits. However, multicastsupport in 802.11 networks is severely deficient. This is even stated in thestandard [77].
The multicast problems stem from a common source the inability todetect lost multicast packets. Ordinarily, collisions are detected by the lackof an ACK. With multicast, sending ACKs is not practical. Which stationshould transmit it? And if one station does not receive a certain packet,does that warrant retransmission to all stations? The lack of a collisiondetection capability does not only mean that it is impossible to know when toretransmit a package. In 802.11 networks, the contention window is adjusted
47

4 More Bits
when collisions are detected. Since multicast collisions are not detected thecontention window remains at CWmin for multicast traffic.
A number of solutions intended to provide more reliable multicast havebeen proposed in the literature. Some solutions are presented in Paper Dand a hierarchical overview is presented in Figure 4.1. The proposed so-lutions can be grouped into three main categories: Channel Reservation,Collision Detection and Collision Resolution.
Channel Reservation In channel reservation techniques, nodes transmit reser-vation messages to disallow other stations from transmitting during the mul-ticast transmission. The reservation message can be a burst, the length ofwhich is determined by the priority of the station in question, as in Black-burst [81].
Other schemes rely on some variation of the standard request to send/ clear to send (RTS/CTS) exchange used between unicast stations underhidden terminal conditions. In the unicast case a single sender transmits theRTS packet and receives the CTS packet from a single receiver. In multicast,the problem, just as with ACK packets, is to determine which stations shouldtransmit the CTS packet. In robust multicast there is a single designated CTSsender [82]. In BMW the stations take turns to transmit the CTS packet inround-robin fashion [83].
In other schemes, all or many stations transmit the CTS sequentially orsimultaneously. In the sequential case either all stations transmit in turn [84]or some stations transmit with a random mini-back-off similar to the yieldphase of EY-NPMA [85]. In the parallel case, either a single CTS packet isdetected based on the threshold effect3 [86] or by using orthogonal codes [87].
Collision Detection Collision detection techniques are based on making apause during the transmission to sense the channel and detect any othertransmitting stations. In CSMA/TCD all stations pause at a fixed point in thetransmission [88]. If the propagation delay is sufficiently large collisions willbe detected. Our solution, EMCD described below, is an adaptation of theRom algorithm, Paper D and [1,89]. The main difference from CSMA/TCD isthat the pause is made at a time sampled from a uniform random distributionallowing collision detection even with negligible propagation delays. Thealgorithm is described in more detail later and in Paper D.
3Stations sufficiently close to the receiver will ‘‘drown’’ the transmissions from more remotestations. The capture effect only works if the second closest station is sufficiently fartheraway from the receiver.
48

4.2 Multicast in IEEE 802.11 Networks
Rel
iabl
e W
irel
ess
Mul
ticas
t
Col
lisio
n R
esol
utio
nC
hann
el R
eser
vatio
nC
ollis
ion
Det
ectio
n
EY
-NPM
APR
EM
AW
ikst
rand
, Nils
son
& D
ough
erty
RT
S/C
TS
No.
of
CT
S re
spon
ders
Bla
ckbu
rst
Sobr
inho
& K
rish
naku
mar
CSM
A/T
CD
Lo
& M
ouft
ahR
om A
lgor
ithm
Rom
EM
CD
Nils
son,
Wik
stra
nd &
Eri
ksso
n
1n
BM
WR
ound
-rob
in C
TS
Lis
t of
Rx
fram
esT
ang
& G
erla
Rob
ust M
ultic
ast
Des
igna
ted
CT
S se
nder
Tou
rrilh
esPa
ralle
llSe
quen
tial
Cap
ture
Eff
ect
Stro
nges
t sen
der
assu
med
rec
eive
dT
ang
& G
erla
OFD
ML
ott,
Sita
lov,
Lin
sky
& L
iA
ll re
spon
d in
turn
Sun,
Hua
ng, A
rora
& L
aiSo
me
dela
yed,
fee
dbac
k ba
sed
prot
ocol
Kur
i & K
aser
a
Figure 4.1: Different approaches to more reliable wireless multicast.
49

4 More Bits
Collision Resolution Collision resolution protocols such as EY-NPMA andPREMA are based on certain beneficial properties of parallel independentgeometric distributions as explained in Papers E and F. Although neither ofthe protocols have been used to improve multicast performance in 802.11networks it would certainly be possible just as it was possible to adapt theRom algorithm to form EMCD which operates well within 802.11 networks.The two algorithms are described in the following sections and in Papers Dand E.
4.3 The Proposed Algorithms — EMCD and PREMA
The two algorithms proposed in this thesis have been mentioned brieflyabove. Early multicast collision detection (EMCD) was primarily intendedto detect collisions among multiple multicast senders and between multicastand unicast transmitters. Detecting collisions is beneficial for two main rea-sons: First of all, it allows retransmission of the colliding packet at a latertime. Secondly, it makes it possible to adjust the contention window as isdone for unicast traffic in 802.11 networks. This is not implemented nortested here. While EMCD only affords collision detection, prioritised re-peated eliminations multiple access (PREMA) also allows conflict resolution.It is virtually guaranteed (p ≈ 0.99) that there will be a single winner after aPREMA contention.
Algorithm 1 Early Multicast Collision Detection, from Paper Dsuccess = false, bo = 0, retries = 0while ¬ success AND retries≤ Rmax do
Perform backoff/collision avoidancePerform Vanguard Transmission Tv , duration from (D.3.1)if CCA() = busy then
retries = retries + 1jam until end of CDIbo ∈ U {0, CWmin}
elsePerform main transmission Tm
success = trueend if
end while
50

4.3 The Proposed Algorithms EMCD and PREMA
EMCD The EMCD algorithm is presented as pseudo code in Algorithm 1(reproduced from Paper D). Basically, first a station with a multicast trans-mission performs the basic carrier sensing and backoff procedure that any802.11 station would perform. It would then start transmitting but after acertain random number of slots (> 0) sampled from a discrete uniform distri-bution it would pause and sense the channel. If the channel is idle, the stationassumes that there is no collision and transmits the rest of the packet. If thechannel is busy, the station assumes that there is a collision and transmitsa noise burst to warn any stations that have not already paused of the colli-sion. The pausing and the jamming must be performed within the collisiondetection interval (CDI) allowing the truncation of failed transmissions.
Obviously the probability of detecting a collision is higher if there aremore colliding stations and if the collision detection interval is longer. Onthe other hand, with a longer collision detection interval more time is wastedon collisions before the transmissions are truncated. A full analysis of theperformance of the algorithm is presented in Paper D. In Figure 4.2 theanalytically derived and simulated performance is shown. The case n = 1, i.e.all stations pause simultaneously corresponds roughly to ordinary multicastin 802.11. No collisions will be detected but some overhead is added. Usingas few as three or five different slots in which stations are allowed to pausegreatly increases performance. The channel utilisation with EMCD is almosttwice as high as with standard 802.11 multicast. Further results can be foundin Paper D.
PREMA The PREMA algorithm is presented in the form of pseudo code inAlgorithm 2 (reproduced from Paper E). As in EMCD an initial transmissionis performed followed by a carrier sense operation but there are two maindifferences between the algorithms. In PREMA the initial transmission is anoise burst rather then meaningful data and the length of transmission is notsampled from a uniform but from a geometric distribution with parameterq. All nodes selecting a shorter burst length than the longest one will beeliminated from the contention. On average and with standard parameters,less than two nodes will remain after the first elimination; to bring thatnumber down, the elimination is repeated h times. Letting h = 4 is often agood choice.
Analytical and simulated performance results are presented in more detailin Paper E. Channel utilisation as a function of the number of nodes from theanalytical and simulated models is presented in Figure 4.3. Unlike the EMCDfigures which were presented for multicast traffic this figure is concernedwith unicast traffic. It is quite obvious that PREMA far outperforms IEEE802.11 and that it is slightly better than EY-NPMA.
51

4 More Bits
0 10 20 30 40 500.35
0.4
0.45
0.5
0.55
0.6
0.65
0.7
0.75
0.8
0.85
Number of stations
Cha
nnel
util
izat
ion
ρ
Simulated, n=1Simulated, n=3Simulated, n=5Analytical, n=1Analytical, n=3Analytical, n=5
Figure 4.2: Channel utilisation ρ as a function of the number of stations k with CWl = 15, simulated and analytical. The relative mean square error is ≈ 2.1%. (Reproducedfrom Figure D.4.)
Algorithm 2 Prioritised repeated eliminations multiple access, from Paper E: startSense channel idle for Tifs
idleSlots = 0, i = 1while idleSlots < h do
if Ai = tx then . Sample from stoch. var. Ai
TRANSMITNOISE(τ )else // Ai =cs
if busy =SENSECHANNEL(τ ) thengoto start
elseidleSlots = idleSlots + 1
end ifend ifi = i + 1
end whileTRANSMITMESSAGE(Tm)
52

4.3 The Proposed Algorithms EMCD and PREMA
0 50 100 150 200 250 300 350 400 450 5000.2
0.3
0.4
0.5
0.6
0.7
0.8
0.9
1
Number of nodes n
Cha
nnel
util
izat
ion
ρ
PREMA802.11EY−NPMAtree−splitting
(a) Analytical
0 50 100 150 200 250 300 350 400 450 500
0.4
0.5
0.6
0.7
0.8
0.9
Number of nodes n
Cha
nnel
util
izat
ion
ρ
PREMADQRAP
PREMA−β802.11
(b) Simulated
Figure 4.3: Channel utilisation of DQRAP, PREMA-β, 802.11, PREMA and a generictree-splitting algorithm. n = 2, · · · , 500. (Reproduced from Figure E.2.)
PREMA has two advantages over EY-NPMA. First of all, because the geo-metric distribution is untruncated, it does not have any problems with per-formance under high load conditions, cf. Paper F. Secondly, because weallow tweaking the probabilities and probability distributions governing the
53

4 More Bits
behaviour of each node it is possible to fine-tune the priorities of each node.Suppose for instance that a base priority node samples the length of theirinitial elimination from Geo(q = 0.5) and that some other stations sampletheir lengths from Geo(q = 0.5)+1 then the latter nodes will have twice thepriority of the former ones, i.e. their throughput will be twice that of thebase priority nodes. One advantage is that the nodes do not have to knowanything about the traffic, number of nodes etc, to achieve this.
4.4 Summary
This chapter introduces the WLAN reliable multicast problem and sum-marises the papers in Part II. Two MAC algorithms, EMCD and PREMA, aredescribed and compared to a number of other MAC algorithms, among themIEEE 802.11 and EY-NPMA. EMCD can be used to dramatically improve mul-ticast performance and reliability in an IEEE 802.11 network. PREMA canbe used like EMCD or as a stand-alone MAC algorithm. Because PREMAhas a flexible and accurate service differentiation mechanism it can be usedas a building block in a quality of service aware system. EY-NPMA is similarto PREMA and some of the formulae used to analyse one can be used toanalyse the other.
54

Chapter 5
Discussion
This chapter discusses and challenges the work presented in the thesis. Analternative explanation for the results in Paper A is discussed. The rela-tionship between quality of service, the system model and other concepts,such as quality of perception and quality of experience, is examined. Theexternal validity of the results is discussed. Finally, the results from Part IIare discussed.
5.1 Alternative Explanation
The finding that more bandwidth is not necessarily better, contradicts someearlier research. It is often the case that more bandwidth is better, e.g. inthe case of streaming video. There is plentiful experimental evidence thathigher bit-rate video is better than lower bit-rate video. Log-like or S-curvescan be used to map from bitrate to utility streaming video. Log-like curvessay that higher bit-rates are better up to a limit where no additional benefit isvisible. S-curves also take into account that utility is generally not negative.These curves are used for two reasons. The first reason, is that they canbe fitted to experimental data for given content, codecs etc. They describethe relationship between video bitrate and user ‘‘utility’’ rather well. Thesecond reason to use them is that they can be used for automatic schedulingand prioritisation either within or between media streams. Bitrate changescorrespond to movements along one curve. Switching between differentcodecs is seen as moving from one curve to another. [90, 91]
It is possible that this is the case with the animations and the high qualityvideo from the Bastard project. This means that animations are not in-herently better than low bitrate video, they just happen to have a slightlydifferent utility curve, Figure 5.1. In the figure, the actual data points fromPaper A for ‘‘overall impression’’1 are plotted as stars and hypothetical log-
1This variable was pooled with acceptability to form ‘‘video quality’’ in Paper A. The data pointsin the figure are from before the pooling.
55

5 Discussion
100
101
102
0
0.5
1
1.5
2
2.5
3
3.5
4
4.5
5
Approximate bit rate
Ove
rall
impr
essi
on
Bastard, exp 2Bastard, exp 1Fitted log−curve for videoFitted log−curve for animation
Figure 5.1: The results from the Bastard experiment interpreted in terms of log-likeutility curves.
like curves are plotted as blue dashed lines. In another experiment, bit-ratesfrom 10 to 90 kbps in steps of 10 kbps were tested on users [3]. The re-sults were fitted to a second-degree curve which is shown as a solid blackline. This curve is close to the fitted log curve for video providing someconfirmation of the alternative explanation.
However, there are some things contradicting this simple explanation.One is the fact that video regardless of bit rate is slightly higher on theemotional than on the cognitive effectiveness scale whereas the animationsachieve the same score on both scales. Another is the fact that the prefer-ence for either format is so heavily influenced by the user’s subject matterexpertise.
The results from the MoCo project, Chapter 3 and Paper B, totally contra-dict the claim that utility curves are always (strictly) growing with increasingbandwidth as in that case utility in some way actually decreased. Althoughthe results may come from a weak experiment they are confirmed by otherstudies, cf. [69, 70].
This justifies the addition and elaboration of the user/usage layer. With-out it, one would be confined to talking about multimedia quality in termsof fidelity, acceptability and so on all application layer concepts. But asdifferent applications or modalities e.g. video and animations are not reallycomparable it is impossible to choose the best representation at that layer.
This last sentence raises an interesting point. Are the animations and
56

5.2 Cognitive Quality of Service Reconsidered
normal video different applications or modalities? At the user/usage layerthe activity remains the same, i.e. watching football, and the two mediastreams can be presented within a unified user interface. What is a modalityby the way? Some would claim that vision is a modality while others wouldsay that text and video are separate modalities. Clearly, the limits are fluidand a strict definition might be needed.
5.2 Cognitive Quality of Service Reconsidered
In my licentiate thesis, cognitive quality of service (CQoS) was defined asfollows: [3]
If a message is transmitted over different communication chan-nels then the channel which allows a human viewer, in relationto his or her viewing purposes, the best understanding and themost appropriate emotional response to the original event hasthe highest Cognitive Quality of Service.
The definition is vague. It seems to suggest that CQoS is concerned onlywith one-way communication. It also suggests that two variables shouldbe optimised at once (understanding, emotional response) which is clearlyimpossible as anyone familiar with the ordering operator should know. Itfurther suggests that there is something which we can call ‘‘the most appro-priate’’ emotional response.
A further problem with the concept as such is that there are other com-peting concepts, e.g. quality of perception (QoP) and quality of experience(QoE), see Chapter 2. Introducing a new concept should also add somethingworthwhile.
The solution has been to entirely discard the concept as such and abandonany attempts at defining it. I have not used ‘‘CQoS’’ after my licentiate thesis.What remains is a conviction, partially based on the literature review inChapter 2, that there is a confusion regarding what is important to the user,i.e. if the video looks good or if it is useful and interesting. Even thoughthere might often be a positive correlation between the two this is not alwaystrue. Many things influence that ultimate ‘‘utility’’ as seen by the user: e.g.the media quality, the context in which the media is used, the user’s subjectmatter expertise and emotional predispositions (e.g. fandom) and not leastthe actual meaning being conveyed.
Suppose for instance that you are interested in an adventure story. Youhave the choice of having it told orally by a friend, reading it from a book,listening to the same book being read by an actor (on the radio, on a disc,
57

5 Discussion
in the car, at home, while jogging), seeing it as a play at your local theatre,seeing it as a made-for-television movie, seeing it as a cinema movie at amovie theatre near you or at home on your television set as a broadcast,VHS, DVD, HD-DVD etc. In each case only the basic plot will remain thesame. The impact it will have on you will be totally different. Who has notdiscussed the eternal question - which is better, the book or the movie? [22]
But how does one compare these different formats in terms of mediaquality? How does one weigh a font with 99,5% legibility (if there is such athing) in the book version against the VHS movie with a mean opinion score(MOS) of 3,7 (or whatever)? Clearly, a comparison cannot be made at thislayer. If a comparison is to be made, it must be made at a higher layer thanthat which is available to the computer. First of all, it must be clear what ismeant with a higher layer.
It is very popular to make a distinction between data, information andknowledge. These concepts can be mapped to the three layer-model pre-sented in this thesis. The network is concerned with the transport of data.At a higher layer, applications are concerned with the coding, transport, dis-play processing and manipulation of information. At the user/usage layerthe user assimilates, processes, manipulates and responds to this informatione.g. interacts with it on a knowledge level.
For each of these layers there needs to be an appropriate apparatus formeasuring, discussing and maybe even paying for the quality in a way thatis appropriate to that layer. For instance, if we are to choose between twoavailable network connections we must have some way to compare the twoso that we can choose between them. However, the choice cannot be madeentirely on the network layer alone. Which is better of 30 kbps at SEK5 / min and 300 kbps at SEK 50 / min? In the same way, the selectionbetween different media streams cannot be made entirely at the applicationlayer. Would you rather hear something you liked with lower audio qualityor something you did not like but with higher audio quality?
It is like the story of the man on all four under a street light. A friendcomes over and sees that he is searching for something and joins him onthe pavement. After a while of unsuccessful searching the friend says: ‘‘Ithink we have looked everywhere and found nothing. What is it that youhave lost?’’ The first man answers: ‘‘I dropped my keys over there’’, he sayspointing to a dark alley, ‘‘but it is much too dark to search there.’’ For thisman, the the choice was clear: application layer quality is more importantthan user/usage layer quality.
The preceding paragraphs have hopefully made it clear that my decisionto abandon the problematic CQoS definition does not in any way diminishthe need for a workable definition of ‘‘quality of service’’ at the user/usagelayer.
58

5.3 Are the Results Generalisable?
In the human factors discipline there are three traditional main conceptsthat have been studied and used to evaluate systems: (1) performance, (2) loadand (3) satisfaction. In a traditional setting, e.g. the factory floor, performanceis what allows the factory to show a profit. Keeping the load level acceptableis important in order to keep the workers healthy. Without satisfaction inthe work being performed it is unlikely that the workers will keep comingback to work every day. Naturally, these three variables all interact, e.g. it ishard to perform well if you are overloaded and undersatisified.
I decided to use those three variables to describe quality of service at theuser/usage layer. Naturally, with all the research that has been going on inhuman factors and related fields there is a plethora of metrics, measure-ment methods etc. I decided early on to stick with simple ‘‘paper and pen’’measures; there is one exception in the Pong study. The exact metrics touse and the weight to give each of them must be decided on a case-by-casebasis. As more and more application domains are explored by researchersthere are also more and more metrics available.
The last ten years has seen a great deal of interest in computer gamesand other applications where fun, which I see as a component of satisfaction,is the important concept. Metrics (e.g. laughs per hour) and measurementmethods have been developed because fun is after all a rather elusive con-cept. How fun is it to play a game with five researchers in white lab coats andclipboards looking over your shoulder constantly asking you if you are hav-ing fun? I choose to study fun and other components of satisfaction throughthe rather more simple way of a single self-report question. Since differenttreatments have provided significant differences in the results I concludethat the method has been sufficient.
5.3 Are the Results Generalisable?
My plan, ever since I started my Ph.D. studies at Umea University has beento study three different application domains: streaming multimedia, conver-sational multimedia and networked games. Before my licentiate thesis I hadonly covered the first of those three fields. Since then, I together with others,performed an experiment in each of the other two application domains. Theresults of those experiments are described in Papers A–C and summarisedin Chapter 3.
Traditional video quality research tends to use dull, boring more or lessnonsensical video clips as stimuli. All in order to have maximally general-isable results. When one starts to look at other clips which are not boringand which have an emotional meaning to the judges one will already have
59

5 Discussion
more specific results. It will be hard to know how much of the judgementwill be on the video quality and how much will be on the content itself.
In my research I have attempted to separate the two - as far as that ispossible of course. As discussed above this inevitably leads to a loss ofgenerality. For instance, a test to measure understanding of a football videoclip is hardly usable for another football clip and definitely not for a clipfrom a skiing competition. Other aspects are more general, e.g. mentalload can be measured in the same way for a range of applications. Thesame is true, but perhaps to a lesser extent, for satisfaction.
So the components of quality of service at the user/usage layer are inher-ently more specific than at the application layer. At least if one stays withinone application at that layer. At the network layer, even more generality ispossible as the network layer generally does not know, nor care about whatis transported on it.
Thus, for any specific application, things will be rather more specific on theuser/usage layer. If one looks across applications and domains one will findthat some things are reusable and most certainly that the framework andthe model presented here are generalisable. The fact that it has been suc-cessfully applied to three application domains (streaming multimedia, CMMand games) supports that assertion.
5.4 Network Performance
PREMA was originally developed as an improved version of EMCD. It ismuch more than that since it provides higher collision avoidance probabil-ities. With PREMA, it is more certain that a station can make a correctassessment whether it is alone on the channel or not. Can PREMA be usedlike EMCD as a way to improve multicast performance in IEEE 802.11? Theanalysis is trivial if one ignores the EIFS. The probability distribution forthe number of stations that enter the first elimination phase is given in (D.4)and the additional idle time from backoffs is given in (D.12). They are thenintegrated into (E.10). The calculations are not given here but it would bevery surpising if PREMA and IEEE 802.11 is not more efficient than EMCDand IEEE 802.11.
It comes down to the fact that the elimination phase in PREMA is slightlylonger than the collision detection interval in EMCD but in PREMA a singlewinner is almost always elected whereas in EMCD the only chance to have asingle winner is if there is a single entrant. Consider a numerical examplewith 10 stations, CW = 16 and a collision detection interval of 7 slots asrecommended in Paper D. In the worst case, all 10 stations will enter thefirst elimination in PREMA. The contention phase will be about 15 slots long
60

5.4 Network Performance
and a single winner will be selected with a probability of about 0.99. InEMCD the collision detection interval will always be 7 slots long but a singlewinner will only be elected if there is a single entrant. The probability ofthat is 0.38. The geometric distribution gives the number of trials to get onesuccess, in this case 2.6 attempts. So, one backoff and 15 elimination slotswill be needed to get a winner with PREMA while 2.6 backoffs and 18 slotswill be needed to get a single winner with EMCD. This shows that PREMAcan be used as an EMCD replacement.
Another interesting question is the power consumption in PREMA. With,for instance, 50 stations and a bursting probability of q = 0.5 each stationwill burst in at least 2 slots on average in each contention and 50 contentionsare required before a station transmits. So a station is required to transmitin about 100 burst slots before transmitting a package which might be about300 slots long. We are currently working on a protocol where a stationwould only send a single burst in each elimination. The result would bea reduction in power consumption of 1/8. Depending on the parameterschosen the power consumption in IEEE 802.11 could be higher or lower.The big power drain in that protcol is collisions. In the example above2.6 transmissions would be made for each success so the wasted power ismuch higher. It is possible to choose a more optimal CW leading to fewercollisions and lower power consumption.
61

5 Discussion
62

Chapter 6
Conclusion
In this thesis some elements required for building a football entertainmentsystem for mobile fans have been described and analysed.
A system model comprising three levels has been introduced together withsome quality variables and metrics for each level. Variables and metrics forthe more conceptually limited network layer are easily defined. Variablesfor the user / usage layer are also easy to define but the relative importanceof each variable and the relevant metrics for each variable must be definedon a case-by-case basis. An abundance of metrics are available from thehuman-computer interaction (HCI) and human factors literature. The rele-vant variables and metrics for the application layer are still not fully defined.A plethora of metrics exist, even for a narrow field like streaming video.Here even more than at the user / usage layer relevant variables and met-rics must be decided on a case-by-case base or at least for each applicationand domain.
The empirical research presented in this thesis has been aimed at find-ing out more about how to design the elements of the hypothetical system.Streaming video was examined in the Bastard project and what to do if videoquality was low due to low bandwidth was examined. The solution was toeither accept the low bandwidth and switch to animations or obtain morebandwidth and present high-quality video. Conversational multimedia wasstudied in the MoCo project. The effects of latency in a game was studiedin the Pong project.
These services rely on efficient wireless networks and two algorithms,EMCD and PREMA, to that end are introduced in the thesis. With the helpof them it will be possible to obtain much higher channel utilisation thanin a standard IEEE 802.11 network especially for multicast. PREMA is alsoefficient as a way to provide nodes with a desired level of relative and absolutepriorities.
63

6 Conclusion
6.1 Findings
The following are some of the more concrete findings from the researchpresented in this thesis:
• Providing feedback about problems, e.g. latency, will allow the user toadapt more adequately to the situation.
• There are powerful low bandwidth alternatives to video, e.g. anima-tions.
• Regardless, better network performance is often better than the workarounds.
• The two protocols presented perform better than IEEE 802.11 becausethey avoid and detect collisions more efficiently through the use ofprobing transmissions.
6.2 Contributions
This section describes the contributions of the work presented in this thesisand my contributions to that work.
Quality of Service Model The main contribution of this thesis might well bethe three-layer model and the related quality of service taxonomy presentedin Chapter 2. It is probably at least as far as I know the most com-prehensive model presented to date even though it is certainly not the firstto consider all three layers. The model was first presented in my licentiatethesis [3], improved upon in a book chapter [7] and finally fleshed out here.
Determining Utility Functions for Streaming Low Bit Rate Soccer Video Thismight well be the first experimental evaluation of using stylised sports ani-mations. A further contribution is the usage of the rating scale mental effort(RSME) to measure video-induced mental workload. Another important con-tribution is the result that more (bits) is not always better; that depends onthe purpose and the person using the application.
I designed the experiment and performed the analysis. Oscar Appelgrenbuilt the automated test procedure. Frida Ostberg designed the footballknowledge test and the clip comprehension tests. Staffan Eriksson built theanimations and selected the video clips. All of us contributed to the actualexperiments. Jiong Sun contributed to the analysis and it might have been hisidea to pool some of the variables to make the results more comprehensible.
64

6.2 Contributions
Internet Card Play with Video Conferencing In this and the following paper,basically the same metrics were used as in the Bastard studies further con-firming their generalisability. The somewhat surprising result that lowerframe rates are better are confirmed by other researchers and might spurfurther work by others.
Ulrik Soderstrom and I designed and carried out the experiments together.I performed the analysis of the user results and Ulrik analysed the videoperformance. The paper was written jointly.
Effects of Delay and Delay Feedback on Pong Players Apart from providingfurther generalisation of the three-layer model by applying it to a networkedgame the main contribution of this paper is the confirmation of the hypoth-esis that people who are given delay feedback will be better able to adapt tothe delay when playing Pong [71].
I came up with the idea for the experiment and recruited Lennart Schedinto carry it out. We jointly designed the experiment and wrote the article.Fredrik Elg contributed to the analysis and background material in the ar-ticle.
A Collision Detection Method for Multicast Transmissions in CSMA/CA NetworksA contribution of this paper is adaptation of the Rom algorithm to a modernIEEE 802.11 network. A further contribution, possibly the main contribution,is the probabilistic performance model for saturation conditions which isderived in the paper. Unlike most such models for IEEE 802.11 it takesinto account the extended interframe space (EIFS) used after a collision isdetected. Finally, we have provided simulation results for both saturated andunsaturated networks with mixed standard and EMCD traffic.
The wireless network capacity problem had been identified in the Arenaproject. Thomas Nilsson was recruited to work on the problem under mysupervision at Ericsson. Thomas came up with the original algorithm andperformed initial simulations (published in another paper). In the paperpublished here, I performed the probabilistic performance analysis whileThomas implemented the simulations. We jointly executed backgroundchecks and related work. Decisions on what to analyse and what to simulatewere made jointly. The article was written in tight collaboration betweenThomas and me.
Prioritised Repeated Eliminations Multiple Access: A Novel Protocol for WirelessNetworks Using elimination bursts is not a new idea it was first introducedin Hiperlan/1 but this paper makes several contributions: It introduces re-peated eliminations which make it possible to select a desired transmission
65

6 Conclusion
success probability. It presents a probabilistic performance model with ex-act formulations, exact approximations and more normal approximations tomake it possible to predict performance to a desired degree of accuracy.Simulation results are presented for both saturated and low load conditions.A version of DQRAP for distributed wireless networks is presented. Vari-ants of the basic algorithm, PREMA, for hidden terminal conditions areintroduced. A priority mechanism for bursting protocols is introduced andcompared analytically to two common priority mechanisms for CSMA/CAnetworks.
Mark Dougherty came up with the initial idea of performing repeatedEMCD collision detection checks in pairs of two slots (flip-flop). I performedinitial simulations (in Matlab) and was able to deduce basic performancecharacteristics. An important finding was that paired slots were unneces-sary as the same collision avoidance performance would be obtained in halfthe time with a single slot operation (flip-flip). For the article I performedthe analytical evaluations and Thomas the simulation based evaluations (inGloMoSim). The article was written jointly by Thomas and me with someinput from Mark.
Untruncated Eliminations The main contributions of this paper are: a) Intro-ducing exact approximations from the field of applied probability to studyEY–NPMA performance; b) The observation that truncating the eliminationphase is not really that helpful; c) A more efficient approach O(mY S)instead of O(mES ×mY S) to deriving optimal operating parameters forEY–NPMA.
I have done most of the work on this article. I have performed the analysisand simulations and have also written most of the text. Nonetheless, the workhas benefited enormously from input from Thomas Nilsson.
6.3 Future Work
Here are some of the things that I would like to continue working on orwould like to see others work on in the future.
• The observation from the Pong study regarding feedback about net-work conditions allowing people to adapt better. Current mobile phonesprovide some feedback about reception conditions, e.g. signal strength.Is this enough or would users be helped by further information onavailable bit-rate for video, delay for interactive applications etc? Is asingle universal network condition tell-tale better than providing some-what more detailed information? Is it possible to combine the three
66

6.3 Future Work
basic network layer variables (throughput, delay and corruption) intoa single display?
• Thomas Nilsson, Lennart Bondesson and myself are currently workingon a more energy-efficient bursting protocol. In ‘‘traditional’’ burstingprotocols (EY–NPMA and PREMA) most bursts are wasted. The idealwould be to retain the nice properties of parallel geometric distribu-tions on which the protocols are based while minimising the numberof stations bursting in each slot.
• The work presented in this thesis has many things in common withthe work on quality of perception by Ghinea et al. It would be veryinteresting to collaborate with them in an attempt to present a ‘‘unifiedworld-view’’.
• It has already been stated that there are many conditions where thingsare more straightforward in terms of higher throughput leading tohigher bit-rates leading to an improved user experience. It wouldbe very interesting to continue probing to find the borderline wherethings become less simple.
• The work presented in the thesis has been focused on design timeimprovements. I would like to work more to develop the the runtime adaptation schemes, methods and controllers required in a realapplication.
67

6 Conclusion
68

References
[1] Nilsson T, Wikstrand G, Eriksson J. Early multicast collision detection inCSMA/CA networks. In Gerla M, Omidyar CG, eds., MWCN 2002. IEEE,Piscataway, NJ, USA, 2002; 294–8. doi:10.1109/MWCN.2002.1045740.
[2] Wikstrand G, Eriksson S. Football animations for mobile phones. InBertelsen OW, Bødker S, Kuutti K, eds., Proc. of NordiCHI ’03. ACMPress, New York, NY, USA, 2002; 255–8. doi:10.1145/572020.572059.
[3] Wikstrand G. Improving User Comprehension and Entertainment inWireless Streaming Media. Licentiate thesis, Umea University, Umea,Sweden, 2003.
[4] Wikstrand G, Eriksson S, Ostberg F. Designing a football experiencefor a mobile device. In Rauterberg M, Menozzi M, Wesson J, eds., Proc.of Interact’03. IOS Press, Amsterdam, The Netherlands, 2003; 940–3.
[5] Wikstrand G, Sun J. On the duration and limits of quality of serviceguarantees. Technical Report UMINF 06.36, Dept. of Computing Sci-ence, Umea University, SE–901 87 Umea, Sweden, 2004.
[6] Wikstrand G, Schedin L, Elg F. High and low ping and the game of Pong effects of delay and feedback. Technical Report UMINF 06.41, Dept.of Computing Science, Umea University, 2006. Accepted for publicationat Network and System Support for Games 2004.
[7] Wikstrand G. Network, application and usage a three layer frame-work for QoS-aware service design. In Ghinea G, Chen SY, eds., DigitalMultimedia Perception and Design. Idea Group Publishing, Hershey,PA, USA, 2006; 266–83.
[8] Wikstrand G, Eriksson S, Ostberg F, Sun J, Appelgren O. Designinga mobile soccer experience final report from the BASTARD-project.Technical Report UMINF 06.35, Dept. of Computing Science, Umea Uni-versity, SE–901 87 Umea, Sweden, 2006.
69

References
[9] Pascoe J, Ryan N, Morse D. Using while moving: HCI is-sues in fieldwork environments. ACM ToCHI 2000; 7(3): 417–37.doi:10.1145/355324.355329.
[10] Bryant J, Raney AA. Sports on the screen. In Zillman D, Vorderer P,eds., Media Entertainment The Psychology of its Appeal. LawrenceErlbaum Associates, Mahwah, NJ, USA, 2000; 153–74.
[11] Colbert M. User experience of communication before and during ren-dezvous: interim results. Personal Ubiquitous Comput. 2005; 9(3): 134–141. doi:10.1007/s00779-004-0318-3.
[12] Oulasvirta A, Tamminen S, Roto V, Kuorelahti J. Interaction in 4-second bursts: the fragmented nature of attentional resources in mo-bile HCI. In CHI ’05. ACM Press, New York, NY, USA, 2005; 919–28.doi:10.1145/1054972.1055101.
[13] Fodor G, Eriksson A, Tuoriniemi A. Providing quality of service in al-ways best connected networks. IEEE Communications Magazine 2003;41(7): 154–63. doi:10.1109/MCOM.2003.1215652.
[14] Svanbro K, Lindahl G, Jonsson E, Rosenqvist E, Wikstrand G. A sys-tem and a method relating to communication of data. Patent applicationWO 03/069507 A1, Telefonaktiebolaget L M Ericsson, Stockholm, Swe-den, 2003.
[15] Wann DL, Melnick MJ, Russell GW, Pease DG. Sport fans: the psychol-ogy and social impact of spectators. Routledge, New York, NY, USA,2000.
[16] Andersson N, Broberg A, Branberg A, Janlert LE, Jonsson E, HolmlundK, Pettersson J. Emergent interaction a pre-study. Tech. Rep. UMINF01.16, Umea university, Dept of Comp. Science, SE–901 87 Umea, Swe-den, 2001.
[17] Danielsson K, Wiberg C. IT basketball - a sporty virtual environment:an evaluation of usability, presence, and interest in service. In BødkerK, Pedersen MK, Nørbjerg J, Simonsen J, Vendelø MT, eds., Proc. IRIS25. The IRIS Association, Goteborg, Sweden, 2002; CD ROM.
[18] Pages J. On the quality of public electricity supply. Revue Francaise del’Electricite 1968; 41(223): 14–21.
[19] Kota S, Marchese M. Quality of service for satellite IP networks: a sur-vey. International journal of satellite communications and networking2003; 21: 303–49. doi:10.1002/sat.765.
70

References
[20] Gozdecki J, Jajszczyk A, Stankiewicz R. Quality of service terminologyin IP networks. IEEE Communications Magazine 2003; 41(3): 153–9.doi:10.1109/MCOM.2003.1186560.
[21] Ghinea G, Thomas JP. Quality of perception: User quality of servicein multimedia presentations. IEEE Transactions on Multimedia 2005;7(4): 786–9. doi:10.1109/TMM.2005.850960.
[22] Jain R. Quality of experience. IEEE Multimedia 2004; 11(1): 96–95.doi:10.1109/MMUL.2004.1261114.
[23] Pulakka K. A dynamic control system for adjusting prices and quality ofservice in DS enabled networks. In Network Control and Engineeringfor QoS and Mobility. Kluwer Academic Publishers, Norwell, MA, USA,2003; 241–52.
[24] Curcio I. Mobile video QoS metrics. International Journal of Comput-ers & Applications 2002; 24(2): 41–51.
[25] Winkler S. Visual fidelity and perceived quality: Toward comprehensivemetrics. In Rogowitz BE, Pappas TN, eds., Human Vision and ElectronicImaging VI Proceedings of SPIE. SPIE, Bellingham, WA, USA, 2001;114–25. doi:10.1117/12.429540.
[26] Lin WS, Gai YL, Kassim AA. Perceptual impact of edge sharpness inimages. Vision, Image and Signal Processing, IEE Proceedings– 2006;153(2): 215–23. doi:10.1049/ip-vis:20050110.
[27] Vogel A, Kerherve B, von Bochmann G, Gecsei J. Distributed mul-timedia and QoS: A survey. IEEE Multimedia 1995; 2(2): 10–9.doi:10.1109/93.388195.
[28] Steinmetz R. Human perception of jitter and media synchronization.IEEE Journal on Selected Areas in Communications 1996; 14(1): 61–72. doi:10.1109/49.481694.
[29] Sabata B, Chatterjee S, Davis M, Sydir JJ, Lawrence TF. Taxonomy forQoS specifications. In Object-Oriented Real-Time Dependable Systems,1997. Proceedings., Third International Workshop on. IEEE, Piscataway,NJ, USA, 1997; 100–7. doi:10.1109/WORDS.1997.609931.
[30] Chalmers D, Sloman M. A survey of quality of service in mobile com-puting environments. IEEE Communications Surveys 1999; 2(2).
71

References
[31] LeRouge C, Garfield MJ, Hevner AR. Quality attributes in telemedicinevideo conferencing. In Proceedings of the 35th Annual Hawaii Interna-tional Conference on System Sciences. IEEE Computer Society, IEEE,Piscataway, NJ, USA, 2002; 2050–9.
[32] Hardy WC. QoS Measurement and Evaluation of TelecommunicationsQuality of Service. Wiley, 2001.
[33] Jin J, Nahrstedt K. QoS specification languages for distributed multi-media applications: A survey and taxonomy. IEEE Multimedia 2004;74–87. doi:10.1109/MMUL.2004.16.
[34] Lu L, Kitagata G, Suganuma T, Kinoshita T. Adaptive user interface formultimedia communication system based on multiagent. In AINA 03.IEEE, Piscataway, NJ, USA, 2003; 53–8. doi:10.1109/AINA.2003.1192843.
[35] Wang Y, Claypool M, Zuo Z. An empirical study of RealVideo per-formance across the internet. In Internet Measurement Workshop.ACM SIGCOMM, ACM Press, New York, NY, USA, 2001; 295–309.doi:10.1145/505202.505239.
[36] Fong ACM, Hui SC. Low-bandwidth internet streaming of multimedialectures. Engineering Science and Education Journal 2001; 10: 212–8.
[37] Ghinea G, Thomas JP. Impact of protocol stacks on quality of perception.In Proc. of Int. Conf. on Multimedia and Expo. IEEE, New York, NY,USA, 2000; 847–50. doi:10.1109/ICME.2000.871492.
[38] Hands D, Wilkins M. A study of the impact of network loss and burstsize on video streaming quality and acceptability. In Diaz M, OwezarskiP, Senac P, eds., IDMS’99. Springer Verlag, Berlin, DE, 1999; 45–57.
[39] Koodli R, Krishna CM. A loss model for supporting QoS in multimediaapplications. In ISCA CATA–98. ISCA, Cary, NC, USA, 1998; 234–7.
[40] Patel D, Turner LF. Effects of ATM network impairments on audio-visualbroadcast. IEE Proceedings Vision, Image, and Signal Processing2000; 147: 436–44.
[41] Verscheure O, Frossard P, Hamdi M. Joint impact of MPEG-2 encodingrate and ATM cell losses on video quality. In IEEE Globecom. IEEE,Piscataway, NJ, USA, 1998; 71–6.
[42] Moore MS, Foley JM, Mitra SK. Comparison of the detectability andannoyance value of embedded MPEG–2 artifacts of different type, size,and duration. Proceedings of the SPIE 2001; 4299: 90–101.
72

References
[43] Kies JK, Williges RC, Rosson MB. Evaluating desktop video conferenc-ing for distance learning. Computers & Education 1997; 28: 79–91.
[44] Procter R, Hartswood M, McKinlay A, Gallacher S. An investigationof the influence of network quality of service on the effectiveness ofmultimedia communication. In Proceedings of the international ACMSIGGROUP conference on Supporting group work. ACM Press, NewYork, NY, USA, 1999; 160–8. doi:10.1145/320297.320315.
[45] ISO. Ergonomic requirements for office work with visual display ter-minals (VDTs) - part 11: Guidance on usability. ISO Standard, 1998.
[46] Wilson G, Sasse MA. Listen to your heart rate: counting the cost ofmedia quality. In Proceedings of the International Workshop on Affectin Interactions. 1999; 16–20.
[47] Wilson G, Sasse M. Do users always know what’s good for them? InProc. of People and Computers XIV. 2000; 327–39.
[48] Barber PJ, Laws JV. Image quality and video communication. InDamper RI, Hall W, Richards JW, eds., Proceedings of the IEEE In-ternational Symposium on Multimedia Technologies and Future Ap-plications. Pentech Press, London, UK, 1994; 163–78.
[49] Veinott ES, Olson J, Olson GM, Fu X. Video helps remote work: speakerswho need to negotiate common ground benefit from seeing each other.In CHI ’99: Proceedings of the SIGCHI conference on Human factorsin computing systems. ACM Press, New York, NY, USA, 1999; 302–309.doi:10.1145/302979.303067.
[50] Ziljstra FRH. Efficiency in work behavior. A design approach for mod-ern tools. Ph.D. thesis, Delft University, Delft, The Netherlands, 1993.
[51] Verwey WB, Veltman HA. Detecting short periods of elevated work-load: A comparison of nine workload assessment techniques. Journalof Experimental Psychology 1996; 2(3): 270–85.
[52] Wickens CD. Engineering psychology and human performance.HarperCollins, New York, NY, USA, 2nd edn., 1992.
[53] Muller T, Giesa HG. Effects of airborne data link communication ondemands, workload and situation awareness. Cognition, Technology &Work 2002; 4(4): 211–28. doi:10.1007/s101110200020.
73

References
[54] Geerts D. Comparing voice chat and text chat in a communication toolfor interactive television. In NordiCHI’06. ACM, New York, NY, USA,2006; TBA.
[55] Mueller FF, Agamanolis S. Sports over a distance. Computers in En-tertainment 2005; 3(3): 1–11. doi:10.1145/1077246.1077261.
[56] Holland JH. Adaptation in Natural and Artificial Systems. The MITPress, Cambridge, MA, USA, 1992.
[57] Satyanarayanan M. Fundamental challenges in mobile comput-ing. In PODC ’96. ACM Press, New York, NY, USA, 1996; 1–7.doi:10.1145/248052.248053.
[58] Yuan W, Nahrstedt K, Adve SV, Jones DL, Kravets RH. GRACE-1: Cross-layer adaptation for multimedia quality and battery en-ergy. IEEE Transactions on Mobile Computing 2006; 5(7): 799–815.doi:10.1109/TMC.2006.98.
[59] Ghinea G, Magoulas GD, Siamitros C. Intelligent synthesismechanism for deriving streaming priorities of multimedia con-tent. IEEE Transactions on Multimedia 2005; 7(6): 1047–53.doi:10.1109/TMM.2005.858391.
[60] Inoue T, ichi Okada K, Matsushita Y. Learning from tv programs: ap-plication of tv presentation to a videoconferencing system. In UIST’95: Proceedings of the 8th annual ACM symposium on User inter-face and software technology. ACM Press, New York, NY, USA, 1995;147–154. doi:10.1145/215585.215967.
[61] Zillman D, Vorderer P. Preface. In Zillman D, Vorderer P, eds., MediaEntertainment - The Psychology of its Appeal, N/A. Lawrence ErlbaumAssociates, Mahwah, New Jersey, USA, 2000; .
[62] Knecht RS, Zenger BR. Sports spectator knowledge as a predictor ofspectator behavior. International Journal of Sport Psychology 1985; 16:270–279.
[63] Orad. Orad reveals an array of technological innovations for sportsbroadcasting and webcasting at nab 2001. Press release, 2001.
[64] Eerola S, Haanpaa T. Tracking system – end report. Tech. rep., WorldOrieentering Championships 2001, 2001.
74

References
[65] Konberg T, Ohult C, Delsing J. Measuring breathing– and heart ratedata with distribution over wireless IP networks. In IMTC 2003, vol. 2.IEEE, 2003; 888–91.
[66] Rafey RA, Gibbs S, Hoch M, Le Van Gong H, Wang S. Enablingcustom enhancements in digital sports broadcasts. In Diel S, CappsMV, eds., Web3D ’01. ACM Press, New York, NY, USA, 2001; 101–7.doi:10.1145/363361.363384.
[67] Olsson D, Nilsson A. MEP: A media event platform. Mobile Networksand Applications 2002; 7(3): 235–244. doi:10.1023/A:1014530813946.
[68] Hands DS, Avons SE. Recency and duration neglect in subjective assess-ment of television picture quality. Applied Cogntive Psychology 2001;15: 639–57. doi:10.1002/acp.731.
[69] Matarazzo G, Sellen A. The value of video in work at a distance: additionor distraction? Behaviour & Information Technology 2000; 19(5): 339–48.
[70] Horn DB, Karasik L, Olsen JS. The effects of spatial and temporal videodistortion on lie detection performance. In CHI ’02: CHI ’02 extendedabstracts on Human factors in computing systems. ACM Press, NewYork, NY, USA, 2002; 714–715. doi:10.1145/506443.506561.
[71] Vaghi I, Greenhalgh C, Benford S. Coping with inconsistency due tonetwork delays in collaborative virtual environments. In Proc. VRST’99.ACM Press, New York, NY, USA, 1999; 42–9. doi:10.1145/323663.323670.
[72] Aggarwal S, Banavar H, Khandelwal A, Mukherjee S, Rangarajan S. Ac-curacy in dead-reckoning based distributed multi-player games. In Pro-ceedings of ACM SIGCOMM 2004 workshops on NetGames ’04. ACMPress, New York, NY, USA, 2004; 161–165. doi:10.1145/1016540.1016559.
[73] Cronin E, Filstrup B, Kurc AR, Jamin S. An efficient syn-chronization mechanism for mirrored game architectures. InProc. NETGAMES. ACM Press, New York, NY, USA, 2002; 67–73.doi:10.1145/566500.566510.
[74] Diot C, Gautier L. A distributed architecture for multiplayer interactiveapplications on the internet. IEEE Network 1999; 13(4): 6–15.
[75] Steinman JS. Breathing time warp. In PADS ’93: Proceedings of theseventh workshop on Parallel and distributed simulation. ACM Press,New York, NY, USA, 1993; 109–18. doi:10.1145/158459.158473.
75

References
[76] Gutwin C, Benford S, Dyck J, Fraser M, Vaghi I, Greenhalgh C. Revealingdelay in collaborative environments. In Proc. CHI ’04. ACM Press, NewYork, NY, USA, 2004; 503–10. doi:10.1145/985692.985756.
[77] O’Hara B, ed. Wireless LAN Medium Access Control (MAC) and Phys-ical Layer (PHY) Specifications. IEEE, New York, NY, USA, 1999.
[78] ETSI, F–06921 Sophia Antipolis Cedex, France. Broadband Radio Ac-cess Networks (BRAN); HIgh PErformance Radio Local Area Network(HIPERLAN) Type 1; Functional Specification, EN 300 652 V1.2.1 edn.,1998.
[79] Cho K, Shin H, Lee J. Performance analysis of HIPERLAN channelaccess control protocol. IEICE Transactions on Communications 2002;E85–B(10): 2044–50.
[80] Anastasi G, Lenzini L, Mingozzi E. HIPERLAN/1 MAC protocol: Sta-bility and performance analysis. IEEE Journal on Selected Areas inCommunications 2000; 18(9): 1787–98.
[81] Sobrinho JL, Krishnakumar AS. Real-time traffic over the IEEE 802.11medium access control layer. Bell Labs Technical Journal 1996; 1(2):172–87. doi:10.1002/bltj.2023.
[82] Tourrilhes J. Robust broadcast: Improving the reliability of broadcasttransmissions on CSMA/CA. In PIMRC, vol. 3. IEEE, New York, NY,USA, 1998; 1111–5. doi:10.1109/PIMRC.1998.731349.
[83] Tang K, Gerla M. MAC reliable broadcast in ad hoc networks. InMILCOM 2001, vol. 2. IEEE, Piscataway, NJ, USA, 2001; 1008–13.doi:10.1109/MILCOM.2001.985991.
[84] Sun M, Huang L, Wang S, Arora A, Lai TH. Reliable MAC layer multi-cast in IEEE 802.11 wireless networks. Wireless Communications andMobile Computing 2003; 3(4): 439–53. doi:10.1002/wcm.129.
[85] Kuri J, Kasera SK. Reliable multicast in multi–access wireless LANs.Wireless Networks 2001; 7(4): 359–69. doi:10.1023/A:1016631911947.
[86] Tang K, Gerla M. MAC layer broadcast support in 802.11 wirelessnetworks. In MILCOM 2000, vol. 1. IEEE, Piscataway, NJ, USA, 2000;544–8. doi:10.1109/MILCOM.2000.905017.
[87] Lott M, Sitalov A, Linsky E, Li H. Performance analysis of multicasttransmission in WLAN. In VTC 2003-Spring, vol. 2. IEEE, Piscataway,NJ, USA, 2003; 1223–7. doi:10.1109/VETECS.2003.1207822.
76

References
[88] Lo WF, Mouftah HT. Collision detection and multitone tree search formultiple-access protocols on radio channels. IEEE Journal on SelectedAreas in Communications 1987; 5(6): 1035–40.
[89] Rom R. Collision detection in radio channels. In Local Area and Mul-tiple Access Networks. Computer Science Press, Inc., Rockville, MD,USA, 1986; 235–49.
[90] Liao RRF, Campbell AT. A utility–based approach for quantitative adap-tation in wireless packet networks. Wirel. Netw. 2001; 7(5): 541–57.doi:10.1023/A:1016730812076.
[91] Thang TC, Jung YJ, R YM. Modality conversion for qos management inuniversal multimedia access. Vision, Image and Signal Processing, IEEProceedings– 2005; 152(3): 374–84. 10.1049/ip-vis:20045084.
[92] Cole T, ed. Wireless LAN Medium Access Control (MAC) and PhysicalLayer (PHY) Specifications Amendment: Medium Access Control(MAC) Quality of Service Enhancements. IEEE, p802.11e/d13.0 edn.,2005.
[93] Xu W, Campbell G. A distributed queueing random access protocol fora broadcast channel. SIGCOMM Comput. Commun. Rev. 1993; 23(4):270–278. doi:10.1145/167954.166263.
77