human development research paper 2010/46 measuring key...
TRANSCRIPT

Human DevelopmentResearch Paper
2010/46Measuring Key Disparities
in Human Development:The Gender Inequality Index
Amie Gaye,Jeni Klugman,
Milorad Kovacevic,Sarah Twigg
and Eduardo Zambrano
United Nations Development ProgrammeHuman Development ReportsResearch Paper
December 2010
Human DevelopmentResearch Paper
2010/46Measuring Key Disparities
in Human Development:The Gender Inequality Index
Amie Gaye,Jeni Klugman,
Milorad Kovacevic,Sarah Twigg
and Eduardo Zambrano

United Nations Development Programme Human Development Reports
Research Paper 2010/46 December 2010
Measuring Key Disparities in Human Development:
The Gender Inequality Index
Amie Gaye, Jeni Klugman, Milorad Kovacevic, Sarah Twigg and Eduardo Zambrano
Amie Gaye is Policy Specialist at the Human Development Report Office of the United Nations Development Programme. E-mail: [email protected] Jeni Klugman is Director of the Human Development Report Office of the United Nations Development Programme. E-mail: [email protected] Milorad Kovacevic is Head of Statistics at the Human Development Report Office of the United Nations Development Programme. E-mail: [email protected] Sarah Twigg is Research Consultant at the Human Development Report Office. E-mail: [email protected] Eduardo Zambrano is Associate Professor at the Department of Economics at the Orfalea College of Business, Cal Poly. E-mail: [email protected]
Comments should be addressed by email to the author(s).

Abstract Gender inequality remains a major barrier to human development. Girls and women have made major strides since 1990, but they have not yet gained gender equity. In this paper, we review ways to measure and monitor gender inequality, providing a critique of existing measures including the first global gender indices that were launched in the 1995 Human Development Report – the Gender-related Development Index and the Gender Empowerment Measure - and introduce a new index that is presented in the 2010 Human Development Report. The Gender Inequality Index, which addresses the key criticisms of previous measures, is unique in including critical issues of educational attainment, economic and political participation, and reproductive health issues and in accounting for overlapping inequalities at the national level. As such, it represents an important advance on existing global measures of gender equity. Measures of the disadvantages for women raise awareness of problems, permit monitoring of progress towards gender equity objectives and help keep governments accountable. In this light, the Gender Inequality Index is designed to reveal the extent to which the realization of a country’s human development potential is curtailed by gender inequality, and provides empirical foundations for policy analysis and advocacy efforts. We also compare our results with the results of alternative gender inequality indices, finding significant variation in rankings across the various indices due largely to differences in the elements of gender inequality they seek to measure.
Keywords: Gender inequality, gender index, human development, measurement. JEL classification: D63, O15, C8, J16 The Human Development Research Paper (HDRP) Series is a medium for sharing recent research commissioned to inform the global Human Development Report, which is published annually, and further research in the field of human development. The HDRP Series is a quick-disseminating, informal publication whose titles could subsequently be revised for publication as articles in professional journals or chapters in books. The authors include leading academics and practitioners from around the world, as well as UNDP researchers. The findings, interpretations and conclusions are strictly those of the authors and do not necessarily represent the views of UNDP or United Nations Member States. Moreover, the data may not be consistent with that presented in Human Development Reports.

1
1. INTRODUCTION
Gender equity is an intrinsic dimension of human development. If girls and women are systematically
denied freedoms and opportunities, this is not consistent with human development. Gender equality also
has instrumental value for human development—there is much country level evidence showing how
investments in women and girls can be a vehicle to promote long-term prospects for growth prospects and
human development.1
Equity is enshrined in the UN Charter and the “promotion of gender equality and the empowerment of
women” is the third Millennium Development Goal. Several major international agreements have urged
governments to take steps to ensure that both women and men enjoy equal rights, opportunities and
responsibilities – such as the Nairobi Forward Looking Strategy for Advancement of Women (1985) and
the Beijing Platform for Action (1995).
Global, regional and national reports have investigated and exposed key dimensions of gender disparities.
The 1995 global report on gender highlighted areas of progress, but also noted that women still
outnumbered men two to one in terms of illiteracy in 1995, and girls constituted around 60 percent of
those without access to primary school. According to the Report women’s labour force participation was
only around 40 percent, and women only occupied 10 percent of parliamentary seats. The Report also
highlighted that of the 1.3 billion people in poverty, 70% were women. The recent regional report for
Asia–Pacific, the 2005 Arab States Report and the 2007 Azerbaijan report are among recent human
development reports that have examined gender differences in detail. The 2010 Asia Pacific Report for
example, identifies women’s lack of power and voice as the heart of gender inequality in the region and
calls for economic, legal and political barriers facing women to be addressed simultaneously. The
Azerbaijan report also noted that gender disparities in the labour market reflect the inequality of
opportunities for men and women.2
In order to know whether progress is being made toward the policy objective of gender equality, relevant
indicators and monitoring is needed. This is a difficult endeavour – in part because of conceptual
complexities and deficient data, but also because some aspects do not readily lend themselves to
quantitative measurement.
1 (Permanyer, 2009). 2 UNDP 2010a Asia-Pacific HDR; UNDP 2005a Arab States HDR; and UNDP 2007 Azerbaijan National Human Development Report (NHDR).

2
It is nonetheless clear that women and girls still fare badly on important fronts. Their labour force
participation rate continues to hover around 51 percent, compared with around 83 percent for males.
Women's reproductive health needs are too often neglected. Many developing countries do not provide
qualified birth attendants, good prenatal or postnatal care or emergency care during deliveries. Maternal
mortality averages 400 deaths per 100,000 births globally3, but ranges as high as 822 deaths per 100,000
births in low human development countries. And the global average for women in parliament is still only
16 percent. These are examples of just a few domains where gender inequalities persist.
This paper reviews the challenge of measuring and monitoring gender inequality, and introduces the new
index that is presented in the 2010 Human Development Report4. As highlighted below, the Gender
Inequality Index (GII) is unique in its focus on critical issues of educational attainment, economic and
political participation, and reproductive health issues and in accounting for overlapping inequalities at the
national level. As such, it represents an important advance on existing global measures of gender equity.
The GII is designed to reveal the extent to which the realization of a country’s human development
potential is curtailed by gender inequality, and provides empirical foundations for policy analysis and
advocacy efforts.
This paper is structured as follows. The next section examines the limitations of the Gender-related
Development Index and the Gender Empowerment Measure which were introduced by the 1995 Human
Development Report, as well as the strengths and weaknesses of other post-1995 gender indices. In this
light, Section 3 proposes a new approach, called the Gender Inequality Index (GII). Section 4 highlights
some of the key results and insights from the GII, while section 5 compares those results and the elements
of gender inequality that the GII seeks to measure with alternative gender inequality indices. The final
section concludes.
2. A REVIEW OF EXISTING MEASURES OF GENDER DISPARITIES
Measures of the disadvantages affecting women have played an important role in raising awareness of
problems, and helping to keep governments accountable. As a result of broad collective efforts –
including on the part of the International Labour Organization, World Bank, the OECD and World
Economic Forum, the amount of data that incorporates a gender perspective has increased considerably
3 (UNICEF 2008) 4 (UNDP 2010b)
3
since the early 1990s. The extent to which basic indicators are systematically available on a gender
disaggregated basis has improved enormously -- for example school enrolments, most health data, and
employment in different sectors of the economy. Much better information is also available for specific
issues, such as reproductive health5 and violence against women,6 although as we see below, there are
still large gaps.
One of the key challenges in evaluating progress in gender equality has been quantifying important
dimensions. For example, the notion of women’s empowerment is difficult to evaluate and measure.7
Time-use is another area which may in principle be easier to measure, but in practice is very difficult. The
same is true for asset ownership (see below).
A number of composite measures of gender disparities are now available. The potential advantages of a
composite index are that it provides a good summary of a complex multidimensional problem that is
easily interpretable. This can help to understand the complexities of gender relations, and facilitate
comparisons across time and countries. This in turn can attract public interest and capture the attention of
policy makers. Single summary numbers also allow for national and subnational rankings, which are
useful for advocacy purposes and to motivate government policy responses.
The first global indices designed to reflect gender disparities were the Gender-related Development Index
(GDI) and Gender Empowerment Measure (GEM) that were launched in the 1995 HDR.8 Since their
introduction, the two measures have been used as advocacy and monitoring tools by UNDP and other
developmental partners. In Korea for example the GEM has been used for lobbying purposes, which
reportedly led to government actions to address the low representation of women in political and
economic sectors.9
The GDI was developed to capture gender inequalities in an overall assessment of well-being. The HDI –
which is a composite measure of well being comprising achievements in health, education and incomes --
is penalised if gender inequality exists in any of the three dimensions. Thus an advantage of the GDI is
its clarity of purpose. The index’s overarching concept, development, is well theorized and measured in
much the same terms as the UNDP’s HDI.10 The more the GDI differs from the HDI, the larger the
5 (Abdullah, 2000) (Ransom & Yinger, 2002) 6 (Kelly, Kennedy, & Horvath, 2008) 7 (Beneria & Permanyer, 2010) 8 (UNDP HDR, 1995) This report was released prior to the Beijing conference on women and development. 9 Schuler, 2006 and UNDP 2005b. 10 (Anand and Sen, 1995)

4
measured inequality.11 But because the GDI cannot be interpreted independently of the HDI, it cannot be
interpreted on its own as an indicator of gender gaps in well-being. Because of this some critics have
called the GDI a “false start” because it is not a true measure of gender inequality.12
The GEM was introduced as a complementary measure of gender equality in political, economic and
decision making power. The three dimensions included are (i) control over economic resources,
measured by men and women’s earned income; (ii) economic participation and decision making,
measured by women and men’s share of administrative, professional, managerial, and technical positions;
and (iii) political participation and decision making, measured by male and female shares of
parliamentary seats. The measure usefully captures some aspects of female empowerment,13 although it
has been criticised as having an unclear conceptual basis and questioned as to the appropriateness of the
indicators.14
These pioneering efforts gained some public visibility, supported by annual updates in the Human
Development Report, and signalled the importance of collecting and disaggregating data by gender in
country level analysis, including in National HDRs.15 A number of later indices have actually used
aspects of the GDI and GEM, as we shall see below. But both indices also attracted critical debate about
how to construct a valid and reliable index with gender-differentiated data. Overall, the GDI and GEM
have not had nearly as much success as the HDI in academic or policy circles. The GDI has frequently
been misunderstood as a direct measure of gender inequality (which it is not). Both had conceptual
problems in the underlying components as well as empirical problems relating to data availability.
These measures have also been criticized for their conceptual and methodological limitations and they
have been frequently misinterpreted.16 The key drawbacks can be summarised as follows:
a. The measures combine absolute achievements alongside relative aspects. This means, among
other things, that countries with low absolute levels of income cannot approach gender equity,
even if there is total parity in incomes. The GDI is very strongly correlated with the level of
GDP, while the gap in education and health indicators is not as well reflected. Because of this the
11 (Klasen, 2006) 12 (Dijkstra, 2006) 13 There are generally four dimensions of women’s empowerment identified in the literature: economic, human and social, political and cultural. For useful discussion see (Ibrahim & Alkire, 2007), (Kabeer, 2005) and (Luttrell, Quiroz, & Scrutton, 2009) 14 (Klasen, 2006) 15 Including the UNDP 2005c Korea NHDR, the UNDP 2004 Jordan NHDR and UNDP 2003 Bolivia NHDR. 16 See Dijkstra, 2006, Hawken and Munck 2009, Klasen, 2006 and Schuler, 2006 for good overviews of the critiques.

5
GDI is also not clearly differentiated from the HDI. Similarly the GEM uses income levels
(adjusted by gender gaps) rather than gender gaps in income. Because income levels tend to
dominate the GEM, high income countries are generally on top of the classification, regardless of
the extent to which women achieve equally in the included dimensions.
b. The GDI is often misinterpreted as a measure of gender inequality – whereas it is actually a
measure of how much (assuming a specific level of aversion to gender inequality) gender
inequality reduces a given country’s level of human development. While this shows the human
development costs of gender inequalities in basic human development, it does not really measure
the position of women as compared to men in society.
c. The indicators do not always correspond to the underlying concept. For example, “Legislators,
Senior Officials and Managers” is used in the GEM to measure Economic Participation and
Decision-making instead of political participation and decision-making.
d. Other issues have been raised around the selection of indicators. For example, the health
component of the GDI – life expectancy at birth – raises issues of whether women’s biological
advantage in longevity should be considered as a gender gap, and whether the measure should
consider the ‘potentially alive’ – in order to take into account ‘missing girls.’17
e. Each of the indicators in the GEM arguably suffers from urban, elite bias. For example, the
economic component is measured by female share of economic decision-making positions, which
does not include agricultural or informal work (in which most women around the world labour),
or work in the lower levels of the formal economy, nor does it measure the unpaid labour of care
work. Therefore work-related aspects of empowerment are not measured for a broad part of the
female population. Similar criticisms exist for other indicators in the GEM.
f. Over-reliance on imputations for missing data. In particular, for the estimated income shares, data
is frequently unavailable and thus ultimately required imputations for over three quarters of the
countries in the sample. Because the income component was the most important driver of the
wedge between the HDI and the GDI, the overall measure was significantly weakened by these
data shortcomings.
17 (Klasen, 2004)

6
Partly as a result of these problems, a whole range of other gender-related well-being indices have
proliferated. These tackle important aspects of gender inequality in different ways, although, as we argue
below, none have been able to provide a comprehensive picture of the levels of gender inequality
experienced within and across countries.18
For example, Social Watch introduced a Gender Equity Index (GEI) which measures gender equity in
education, participation in the economy, and empowerment. It has been published annually since 2004 - it
was estimated for 104 countries in 2004 and expanded to 156 countries by 2009. Its key conceptual
innovation was the inclusion of the dimensions presented separately in the GDI and GEM. The education
dimension is measured by adult literacy rate and primary, secondary and tertiary level enrolments. The
economic participation dimension uses two indicators—percentage of women in non-agricultural paid
jobs and gaps in estimated female and male incomes (taken from HDRO estimates). And the
empowerment dimension uses shares in professional and technical positions, administrative and
managerial positions, as well as the share of parliamentary seats and ministerial positions held by women.
The GEI is constructed by first identifying gender gaps in each dimension—ratio of female to male scores
on each indicator. For each country, the weight of the reference female population in relation to the male
population is also calculated. The gap in each dimension is weighted by the inverse of the weight of the
reference female population. For each dimension, the average of the indicators of the gaps is calculated.
The values of the dimensions are categorised from 1 to 4. The index itself is the arithmetic average of the
three dimensions. While the approach has the advantage of being simple and easy to understand, it only
allows for comparison of the degree of inequality between countries without reflecting the absolute levels
of gender inequality at the country level. This means that the GEI is basically a ranking exercise, and is
less useful for tracking changes over time at the country level. Moreover, the averaging of categorical
variables can be problematic as the rankings that arise are sensitive to the specific numbers used to label
each of the categories.
The World Economic Forum’s Gender Gap Index (GGI), introduced in 2006, includes five dimensions of
gender inequality – economic participation, economic opportunity, political empowerment, educational
attainment and health and well being. These are measured using 14 indicators-- the same indicators used
in the GDI, GEM, and GEI, to which the sex ratio at birth is added. The GGI is calculated for 154
countries and is published annually. The index is calculated by converting data into male/female ratios,
which are then truncated according to an “equality benchmark” and a somewhat elaborate weighting
18 (Hawken & Munck, 2009); (Agarwal, 1994); (Agarwal, 2003) and (Permanyer, 2009) provide excellent critiques.

7
procedure,19 which makes interpretation of the index and comparisons over time difficult. The index
originally used gender gaps as well as female-specific measures, like the number of years a woman has
been head of state. It has been revised over time to address criticisms – for example, so that the GGI now
only takes into account the ratios of achievement between women and men and no longer includes women
specific measures. This index also relies on HDRO’s estimated earned incomes which suffer various
limitations as discussed above.
In 2000, Dijkstra and Hammer developed the Relative Status of Women Index (RSWI). This index
focuses only on the relative scores between men and women by taking their arithmetic mean in the three
components of health, education and income (the same three as the HDI). Beneria and Permanyer (2010)
describe the RSWI as one of the “simplest and most appealing” indexes presented in the literature so far.20
It has the advantage of measuring gender gaps without taking into account countries overall development
levels. The values of RSWI are also only weakly related to income levels – thus addressing one of the
criticisms of the GDI. However, because the index allows for “full compensation,” higher achievement in
one dimension can fully offset lower achievement in another – which may not be desirable if the different
dimensions have intrinsic value. Use of the arithmetic mean for the ratios of men’s and women’s
achievements can also lead to non-intuitive results – because it is an additive function while the ratios are
multiplicative. And, because the gender gaps favouring men and women are all combined in a single
formula, it is not possible to identify the level of contribution of each of the three subcomponents to the
overall levels of gender inequality.21
The OECD’s Social Institutions and Gender Index (SIGI), published in 2009, takes a different tack,
focussing on critical societal norms and institutions which affect how women fare -- using family code,
physical integrity, son preference, civil liberties and ownership rights. It has been applied to 102 non-
OECD countries. The SIGI is built around the overarching concept of social institutions, and therefore is
focused not on gendered outcomes but rather on gendered institutions and processes. Because of this it
encompass a range of issues largely ignored by other indices. A key criticism of the index, similar to the
GEI, is that confusion in interpretation can occur due to the combination of different sorts of indicators –
19 For example, the GGI’s data driven weighting scheme assigns higher weights to indicators with lower standard deviations relative to those of other indicators of the same conceptual dimension, and the weighting scheme calculated for the 2006 index is used in subsequent versions of the index. But it is unclear, for example, why a ban on women holding seats in parliament in a certain country should be considered less of a problem simply because many other countries also have a similar ban. When the weighting of indicators thus derived is combined with the theory-driven weights at the level of the conceptual dimensions, the result is a weighting scheme that is complex and open to many questions. See (Hawken & Munck, 2009) 20 (Beneria & Permanyer, 2010) and (Permanyer, 2009) 21 (Permanyer, 2009)
8
some reflect a comparison of the positions of women and men, and others focus on the restriction of the
rights of girls and women while making no contrast to the situations of boys and men.
New in 2010 is the Economist Intelligence Unit’s Women’s Economic Opportunity Index (WEOPI). The
index involves both quantitative and qualitative indicators that measure specific attributes of the
economic environment for women employees and entrepreneurs in 113 countries. There are five
dimensions - labour policy and practice, women’s economic opportunity, access to finance, education and
training, women’s legal and social status and the general business environment - which are made up of a
total of 26 indicators. The overall results are the average of the scores across the five categories. As with
the SIGI, the WEOPI seeks to show the extent to which underlying institutions affect women’s equality of
access to opportunities.
Each of these gender indices makes valuable contributions to the understanding of gender disparities
around the world. However, as described above, each suffers from inherent shortcomings in their
empirical scope, methodology or execution. It is in this light that we have designed the new GII measure.
3. INTRODUCING THE GENDER INEQUALITY INDEX
For an index to serve as a synthetic measure of gender disparities, the point of departure must be
conceptual clarity and meeting of basic methodological standards. Building on recent reviews that
helpfully summarized and clarified the key critiques, we propose a new way forward.
The Gender Inequality Index is designed to capture women’s disadvantage in three dimensions -
empowerment, economic activity and reproductive health - for as many countries as data of reasonable
quality allow. The GII shows the loss in human development due to inequality between female and male
achievements in these dimensions. It was designed taking as basis the association-sensitive welfare
indices studied in Seth (2009). Specifically, the proposed Gender Inequality Index is based on the
aggregation of achievements in society by using a general mean of general means of different orders—the
first aggregation is by a geometric mean across dimensions; these means, calculated separately for women
and men, are then aggregated using a harmonic mean across genders. This specific form of the index, as a
harmonic mean (across genders) of geometric means (across indicators), was first proposed in Zambrano
(2010a) and further studied, axiomatically, in Zambrano (2010b).

9
In 2010, the global Human Development Report estimated the GII for 138 countries. The GII captures
aspects that were traditionally measured using separate empowerment and development indices. We argue
however, that the issues should be considered using a more holistic approach, and for this reason we
propose one synthetic measure.22
The GII usefully highlights the country’s performance in the dimensions of reproductive health,
empowerment and economic participation. The norms, or ideals, are set at zero for the adverse
reproductive health outcomes of adolescent fertility23 and maternal mortality rates, and at parity with male
achievements on the education, economic, and political fronts. The score can thus be interpreted as
characterizing where a country lies in reference to normative ideals for key indicators of women’s health,
empowerment, and economic status. We now turn to explain the dimensions and indicators chosen for
inclusion.
3.1 SELECTION OF DIMENSIONS AND INDICATORS
Amartya Sen, among others, has noted that women’s ability to find employment outside the home, earn
an independent income, be literate, and to be educated participants in decisions that affect them both
inside and outside the home, are critical. But well into the 21st century, the choice of dimensions for a
global measure of how women and girls fare still faces huge data limitations.
We carefully reviewed candidates for inclusion, bearing in mind some basic criteria for indicator selection
(OECD, 2008):
Conceptual relevance: strongly related to human development definitions and theory, so that the
indicators measure what they are supposed to measure.
Non-ambiguity: simple to interpret and monotonic such that higher (lower) values of the indicator
suggest better (worse) outcomes in the respective dimension.
Reliability: based on data that have been standardized in terms of definitions, statistical quality,
and processing, ideally by a single reputable organization.
Value added: each indicator should clearly add new information not captured by the remaining
indicators (i.e. not redundant).
22 Various other gender indices have also adopted this approach – including Social Watch, Gender Equity Index and the World Economic Forum’s Global Gender Gap Index. 23 Defined as the number of births per 1,000 women ages 15-19.

10
Power of discrimination: the distribution of each indicator should differentiate well between
countries, especially to avoid bunching amongst those at the top or bottom of the distribution.
For the global Human Development Report, an additional but critical concern is data availability – we
want to cover as many countries in the world as possible. For a small number (fewer than 3 percent of the
total), missing values can be modelled and imputed. There should be a reasonable expectation that the
indicators will be updated on a regular basis in the future and, if possible, several past time points should
be available
Data availability and reliability remains a major constraint. In particular, while we have a better
understanding of the importance of time use in thinking about well-being, and valuable data relating to
this for some countries, this information is not generally available or regularly collected. The same is true
of ownership of economic assets by women, despite its crucial importance.24 Another key dimension that
is sadly both prevalent but not well documented is domestic violence. For participation in decision-
making, some community level indicators would be valuable, but nothing comparable is available.
Likewise, a gender breakdown of electoral turnout is available for only a handful of countries. Hence it
remains very difficult to capture the political, economic and social freedoms that are inherent in women’s
human development.25
We sought to capture key aspects of women’s experience related to empowerment, the labour market and
reproductive health. We selected indicators on the basis of their conceptual and practical relevance, the
data reliability, international comparability, reasonable country coverage and frequency of availability.
(Figure 1) summarizes the dimensions and indicators, all of which have reasonable country coverage.
Data sources are largely international data agencies – that is, maternal mortality ratio (MMR) estimates
are from UNICEF’s 2010 State of the World Children’s Report, adolescent fertility rate data are from the
2008 revision of the World Population Prospects produced by United Nations’ Department for Economic
and Social Affairs (UNDESA), female and male shares of parliamentary seats are from the Inter-
parliamentary Union’s (IPU) database and labour force participation rates are from the International
Labour Organization. Educational attainment at secondary or higher education levels come from Barro
and Lee.26
24 (Agarwal, 1994) (Agarwal, 2003) 25 (Sen, 1999: 3-53) and (UNDP, 1990: 10) 26 (Barro & Lee, 2010)

11
Figure 1– Components of the Gender Inequality Index
Note: the size of the boxes reflects the relative weights of the indicators and dimensions. Source: HDR 2010, p 91
The choice of dimensions and indicators can be justified as follows:
Reproductive Health
Two indicators are used to capture countries reproductive health situations. The maternal mortality ratio,
which reflects the priority put on the well-being of women during childbirth, is a clear signal of women’s
status in the society. Current global estimates of maternal mortality – more than 500,000 women die each
year because of complications related to childbirth – remain unacceptably high.27 The risk of death in
childbirth, appallingly high in many countries around the world, could be reduced through the provision
of basic education, access to contraceptives, the provision of antenatal health services, and skilled
attendance of births. But such services are denied to too many women in the 21st century. Many
interventions that can decrease maternal mortality, such as providing women in childbirth with a trained
birth attendant, are inexpensive. Some interventions, such as bans on female genital mutilation and
discouraging teenage fertility and other harmful traditional practices, are less about spending and more
about leadership in changing social norms.
There is enormous variation in maternal mortality rates across societies, even at similar income levels.
For example, Costa Rica and Iran both have a GNI (PPP) of approximately $11,000, yet Iran’s MMR is
more than four times that of Costa Rica’s. Indonesia’s GNI (PPP) of $3,936 is slightly above that of
Mongolia’s ($3,594), yet Indonesia’s MMR of 420 is more than 9 times that of Mongolia’s. Maternal
27(UNICEF 2008)

12
mortality in the US is similar to Bulgaria and Lithuania and 11 times that of Ireland, the best country on
this front. It is important to note that the maternal mortality ratio is a model-based estimate for the
majority of developing countries where the vital registration system either is nonexistent or is in the
process of developing.
The other indicator utilised is the adolescent fertility rate for 15-19 year olds. 28 This indicator highlights
that reproduction is not only risky, it often begins too early. Many girls have children at such a young age
that their health is compromised and future opportunities are limited. For example, research in Mexico
among poor women suggests that early childbearing is associated with poor living conditions, lower
monthly earnings, and decreased child nutrition.29 Bearing a child while very young may reflect a lack of
meaningful options outside of taking on the role of mother. Premature pregnancy and motherhood pose
considerable health, economic, and social risks to teenage girls. Early childbearing tends to prevent them
from achieving a higher level of education, and often destines them to low-skilled jobs at best. The
younger a girl is when she becomes pregnant, the greater the health risks for herself and her baby.
Maternal deaths related to pregnancy and childbirth are an important cause of mortality for girls aged 15–
19 worldwide, accounting for nearly 70,000 deaths each year. The risk of death during child birth is five
times higher in teenage births, in part because their bodies are not yet fully developed.30
Empowerment
Education, especially higher levels of attainment, brings empowerment because it strengthens people’s
capacity to question, reflect and act on one’s condition and increases access to the information needed to
do so. Educated women are more likely to enjoy satisfying work, to use their voices in public debate, to
be able to care for their own health and that of their family, and to take other initiatives. In this light
education is particularly important in strengthening the agency of women. Women’s education also has
instrumental importance for economic growth and children’s health31 by fostering the capacity to absorb
new information on health, nutrition, and hygiene and to stimulate and facilitate children’s learning. For
example, a study in rural Zimbabwe revealed that education and paid work positively affected the
likelihood that a woman will access contraception and antenatal care.32 The degree to which families
28 We would have preferred to examine fertility only for girls below 18 years of age, but these data are not readily available. Age-specific fertility rates are usually presented in 5-year age groupings, with the youngest of reasonable quality being 15-19 years. Considering when the pregnancy under normal gestation would have started, for all but those births in the last 15 months of the interval, the pregnancies are to teenagers below 18 years of age. 29 (Greene and Merrick, 2008) and (Buvinic, 1998) 30 (Rowbottom, 2007) 31 (Desai, 2010) 32 (Becker, 1997)

13
decide to assure that girls receive as much education as boys is affected by their perception of future job
opportunities available for educated versus non-educated offspring.33
Our second indicator is the share of female and male seats in parliament. Women have traditionally been
disadvantaged throughout the world in the political arena, at all levels of government. Unfortunately the
measures available in this area are sparse. Estimates for parliamentary representation at the national level
reflect women’s visibility in political leadership and society more generally, and the extent to which
women can hold high offices. While this measure has the broadest country coverage, it excludes political
participation at the community and local levels.
There are other crucial elements of empowerment, but internationally comparable measures do not exist.
For example, violence against women, both inside and outside the home, is an important and revealing
issue, but it is not internationally measured with consistency and comparability. General insecurity -
including strife - can also pose particular risks to women’s physical safety as well as their participation in
society, but here too we do not have the data.
Labour market
In measuring economic activity, we decided to rely on female and male labour force participation rates.
While some women choose not to participate in the formal labour market, or drop out to attend to unpaid
family care responsibilities (care of children and/or elderly family members),34 relative labour force
participation can be taken to reflect the degree of economic activity of women versus men. However, we
know that much of women’s work, especially in the home and in family businesses, is unpaid, and that
women’s informal work is undercounted, thus labour force participation does not accurately reflect
women’s work efforts.
Further, it is well known that there are significant barriers to women’s full participation in the economy.
We also know, for example, that the gender wage gap persists at around 17 percent in OECD countries –
ranging from 38 percent in South Korea to 9 percent in Belgium.35 Sex segregation in the workforce
remains a daunting barrier to equality. For example, women’s representation in occupations that have
decision-making responsibilities—managers and analysts—falls well below that of men’s. Women are
33 (Clemens, 2004) 34 In a capabilities framework we are concerned about the expansion of choices – which would also include people choosing not to work, but who prefer to engage in other activities, like child raising, 35 (OECD , 2009)

14
more likely to work in the service industry than men—in Latin America, 80 percent of women versus 45
percent of men work in services.36
Labour force participation, as traditionally measured, ignores the important contributions of women in
unpaid work and may perpetuate the undervaluing of these critical activities. Yet, unfortunately data are
too scarce to remedy these issues. Data on earned incomes and consumption are especially weak at the
global level. Per capita consumption data, when available, do not account for inequalities in intra-
household distribution of resources. The unemployment rate was considered but was ultimately
dismissed due to the fact that this is not well-measured and, in poor countries, is largely an urban
phenomenon. Few rural women tended to be counted among the unemployed and the urban informal
sector also tends to be excluded.
Finally we do recognise that some of the indicators will not have much inter-temporal variation, in part
due to infrequent measurement. In particular this is the case for the education indicators and maternal
mortality ratios.
3.2 METHODOLOGY
Building on the approach established by the Human Development Index, we followed the basic normative
approach which says that all dimensions are of equal importance. Another basic principle is that women
and men should fare equally irrespective of the level of human development achieved by a given country.
The methodology integrates this normative approach with statistical principles to produce a composite
index that captures the disparity between women and men, as well as the association between disparities
across dimensions.
The GII is based on the general mean of general means of different orders. The combination of means, the
harmonic mean of geometric means, makes the GII to be both distribution and association-sensitive,
essentially meaning that the GII captures the inequality between women and men and is sensitive to
changes in association between indicators. It penalises more those countries where one gender performs
badly on all the indicators. This was achieved by first aggregating by the geometric mean across
dimensions separately for women and men, and then by aggregating by the harmonic mean across
genders. Appendix 1 provides details of the method, which is summarised here in terms of five steps.
36 (Desai, 2010)
15
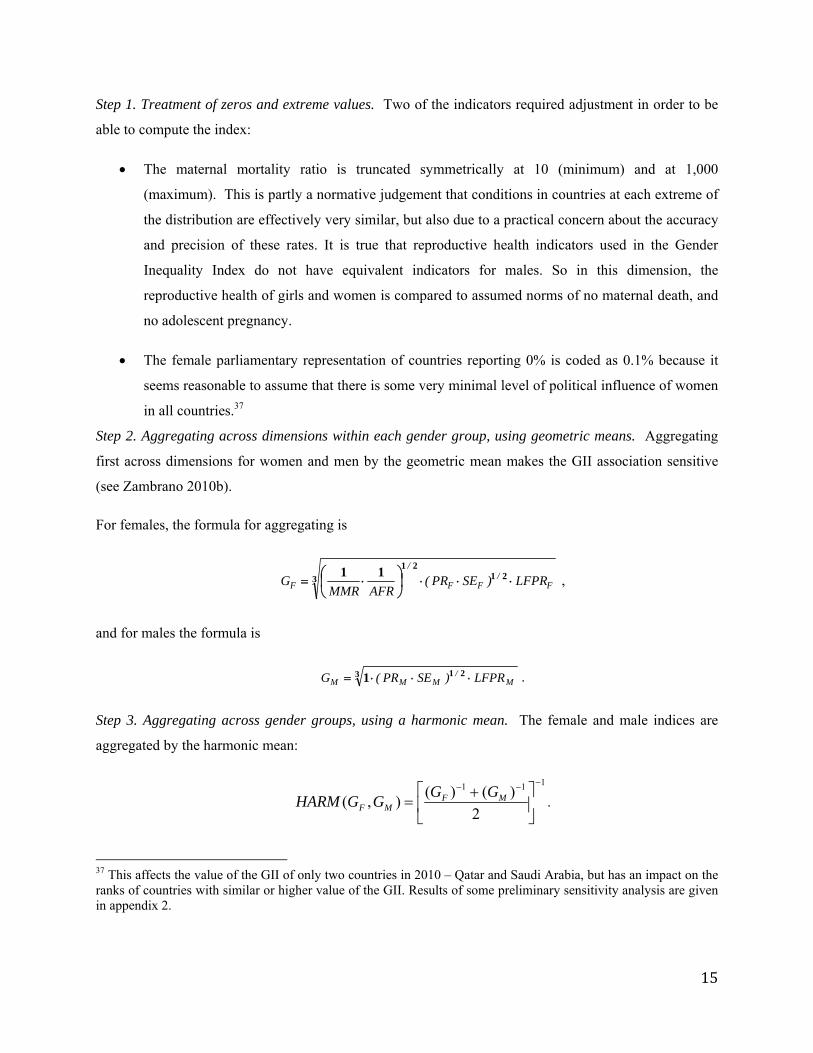
Step 1. Treatment of zeros and extreme values. Two of the indicators required adjustment in order to be
able to compute the index:
The maternal mortality ratio is truncated symmetrically at 10 (minimum) and at 1,000
(maximum). This is partly a normative judgement that conditions in countries at each extreme of
the distribution are effectively very similar, but also due to a practical concern about the accuracy
and precision of these rates. It is true that reproductive health indicators used in the Gender
Inequality Index do not have equivalent indicators for males. So in this dimension, the
reproductive health of girls and women is compared to assumed norms of no maternal death, and
no adolescent pregnancy.
The female parliamentary representation of countries reporting 0% is coded as 0.1% because it
seems reasonable to assume that there is some very minimal level of political influence of women
in all countries.37
Step 2. Aggregating across dimensions within each gender group, using geometric means. Aggregating
first across dimensions for women and men by the geometric mean makes the GII association sensitive
(see Zambrano 2010b).
For females, the formula for aggregating is
3 2121
11F
/FF
/
F LFPR)SEPR(AFRMMR
G
,
and for males the formula is
3 211 M/
MMM LFPR)SEPR(G .
Step 3. Aggregating across gender groups, using a harmonic mean. The female and male indices are
aggregated by the harmonic mean:
111
2
)()(),(
MF
MF
GGGGHARM .
37 This affects the value of the GII of only two countries in 2010 – Qatar and Saudi Arabia, but has an impact on the ranks of countries with similar or higher value of the GII. Results of some preliminary sensitivity analysis are given in appendix 2.

16
Using the harmonic mean of geometric means within groups captures the inequality between women and
men and accounts for association – or overlap -- across dimensions.
Step 4. Calculating the geometric mean of the arithmetic means for each indicator. The reference
standard for computation of inequality is obtained by aggregating female and male indices using equal
weights and then aggregating the indices across dimensions:
3 LFPRtEmpowermenHealthG M,F
where 2111
/AFRMMR
Health
, 2/SEPRSEPRtEmpowermen MMFF , and
2
MF LFPRLFPRLFPR
.
Note that Health should not be interpreted as an average of corresponding female and male indices but as
half the distance from the norms established for the reproductive health indicators—fewer maternal
deaths and fewer adolescent pregnancies.
Step 5. Calculating the Gender Inequality Index. Comparing the equally distributed gender index to the
reference standard yields the Gender Inequality Index, MF
MF
G
GGHarm
,
),(1 , which ranges from 0 (no
gender inequality across dimensions) to 1 (total gender inequality across dimensions).
The application of the method is illustrated by computation of the Gender inequality index for Brazil.
Brazil’s performance on the relevant indicators, as given in 2010 HDR (Statistics Annex, Table 4), is as
follows: maternal mortality ratio is 110 deaths per 100,000 births, which is below the world’s average of
273, while the adolescent fertility rate of 75.6 percent is above the world average (53.7). The
parliamentary representation of women at 9.4 percent of seats is well below the world average of 16.2
percent. At the same time the gap in attainment at secondary and higher education is in favour of women
(2.5 percentage points higher for women relative to men), in contrast to the world gap of about 10
percentage points in favour of men. Finally, although the Brazil’s gap in labour force participation
17
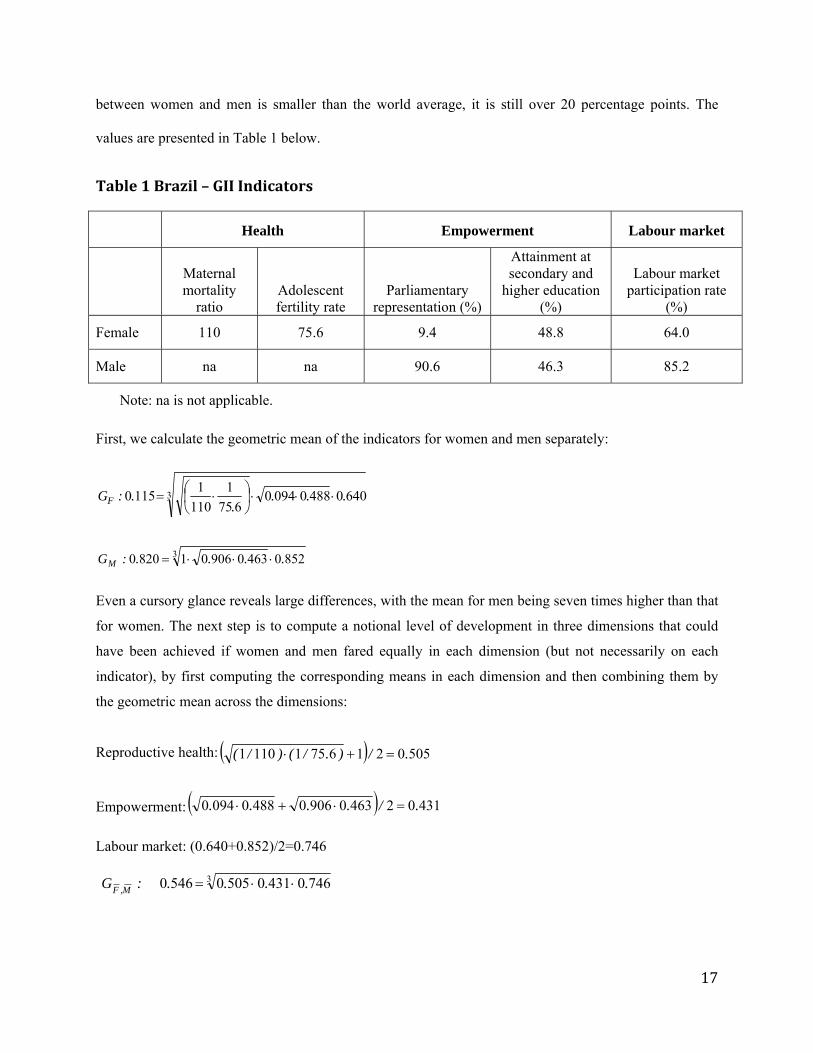
between women and men is smaller than the world average, it is still over 20 percentage points. The
values are presented in Table 1 below.
Table 1 Brazil – GII Indicators
Health Empowerment Labour market
Maternal mortality
ratio Adolescent fertility rate
Parliamentary representation (%)
Attainment at secondary and
higher education (%)
Labour market participation rate
(%)
Female 110 75.6 9.4 48.8 64.0
Male na na 90.6 46.3 85.2
Note: na is not applicable.
First, we calculate the geometric mean of the indicators for women and men separately:
3 640048800940675
1
110
11150 ...
..:GF
3 85204630906018200 ....:GM
Even a cursory glance reveals large differences, with the mean for men being seven times higher than that
for women. The next step is to compute a notional level of development in three dimensions that could
have been achieved if women and men fared equally in each dimension (but not necessarily on each
indicator), by first computing the corresponding means in each dimension and then combining them by
the geometric mean across the dimensions:
Reproductive health: 50502167511101 ./)./()/(
Empowerment: 431024630906048800940 ./....
Labour market: (0.640+0.852)/2=0.746
3 7460431050505460 ....:G M,F

18
The next step is to average the two geometric means obtained for women and men separately by the
harmonic mean, representing the average achievement of the country in the three dimensions – this
accounts for differences between women and men as well as for association between dimensions:
1
8200
1
1150
1
2
12010
...:)G,G(Harm MF
Finally, the Gender Inequality Index is obtained as a relative loss to human development due to uneven
achievements for women and men:
6320546020101 ../.G/)G,G(HarmGGII M,FMFM,F
Brazil’s GII score of 0.632 gives it a ranking of 80th overall out of the 138 countries for which we
calculate the GII – putting it in the bottom half of countries in terms of gender equality as measured by
the GII. As noted above, Brazil’s GII score suffers due to a high adolescent fertility rate, very low
representation of women in parliament and a relatively high gap in labour force participation between
women and men.
4. RESULTS AND INSIGHTS
The GII is applied to 138 countries around the world, covering all regions and parts of the HDI spectrum.
The results reveal that gender inequalities substantially erode human development achievements in all
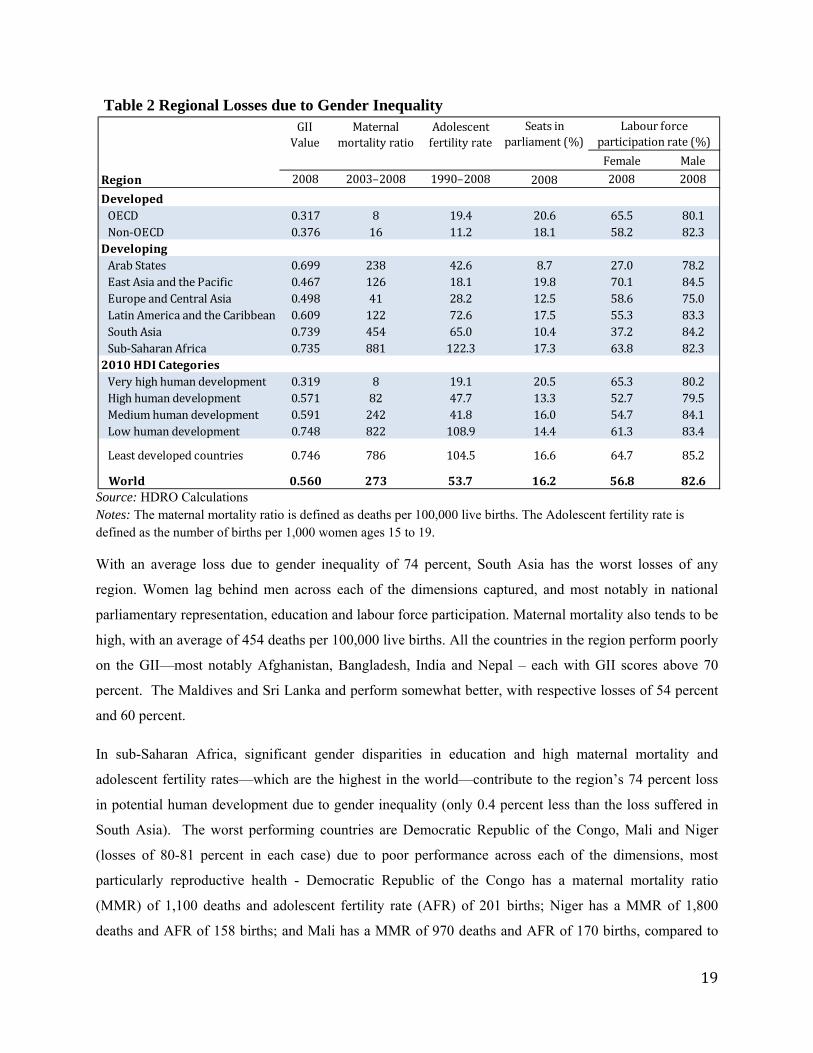
countries and regions, but with significant variation. Table 2 summarises the regional and world
average losses due to gender inequality and the losses experienced in some of the key dimensions
measured by the GII.38 The estimated global loss due to gender inequality is 56 percent, with the largest
losses concentrated in South Asia, sub-Saharan Africa and the Arab States. The group averages range
from 32 percent in developed OECD countries, to 74 percent in South Asia.
38 Country classifications are based on HDI quartiles. A country is in the very high group if its HDI is in the top quartile, in the high group if its HDI is in percentiles 51–75, in the medium group if its HDI is in percentiles 26–50 and in the low group if its HDI is in the bottom quartile.
19
Table 2 Regional Losses due to Gender Inequality
Source: HDRO Calculations Notes: The maternal mortality ratio is defined as deaths per 100,000 live births. The Adolescent fertility rate is defined as the number of births per 1,000 women ages 15 to 19.
With an average loss due to gender inequality of 74 percent, South Asia has the worst losses of any
region. Women lag behind men across each of the dimensions captured, and most notably in national
parliamentary representation, education and labour force participation. Maternal mortality also tends to be
high, with an average of 454 deaths per 100,000 live births. All the countries in the region perform poorly
on the GII—most notably Afghanistan, Bangladesh, India and Nepal – each with GII scores above 70
percent. The Maldives and Sri Lanka and perform somewhat better, with respective losses of 54 percent
and 60 percent.
In sub-Saharan Africa, significant gender disparities in education and high maternal mortality and
adolescent fertility rates—which are the highest in the world—contribute to the region’s 74 percent loss
in potential human development due to gender inequality (only 0.4 percent less than the loss suffered in
South Asia). The worst performing countries are Democratic Republic of the Congo, Mali and Niger
(losses of 80-81 percent in each case) due to poor performance across each of the dimensions, most
particularly reproductive health - Democratic Republic of the Congo has a maternal mortality ratio
(MMR) of 1,100 deaths and adolescent fertility rate (AFR) of 201 births; Niger has a MMR of 1,800
deaths and AFR of 158 births; and Mali has a MMR of 970 deaths and AFR of 170 births, compared to
GII Value
Maternal mortality ratio
Adolescent fertility rate
Female Male
Region 2008 2003–2008 1990–2008 2008 2008
Developed OECD 0.317 8 19.4 65.5 80.1 Non‐OECD 0.376 16 11.2 58.2 82.3Developing Arab States 0.699 238 42.6 27.0 78.2 East Asia and the Pacific 0.467 126 18.1 70.1 84.5 Europe and Central Asia 0.498 41 28.2 58.6 75.0 Latin America and the Caribbean 0.609 122 72.6 55.3 83.3 South Asia 0.739 454 65.0 37.2 84.2 Sub‐Saharan Africa 0.735 881 122.3 63.8 82.32010 HDI Categories Very high human development 0.319 8 19.1 65.3 80.2 High human development 0.571 82 47.7 52.7 79.5 Medium human development 0.591 242 41.8 54.7 84.1 Low human development 0.748 822 108.9 61.3 83.4
Least developed countries 0.746 786 104.5 64.7 85.2
World 0.560 273 53.7 56.8 82.6
17.3
Seats in parliament (%)
20.618.1
16.6
16.2
2008
Labour force participation rate (%)
20.513.316.014.4
8.719.812.517.510.4

20
the regional average MMR of 881 deaths and AFR of 122 births. Mauritius and Burundi perform
relatively better, with respective losses of 47 percent and 63 percent.
Women in the Arab States are affected by unequal labour force participation, which is only around half
the global average, and poor educational attainment—less than one third of women over the age of 25
have completed secondary education. Tertiary enrolment for women is relatively high, however, and, with
an increase of 45 percentage points since 1970, now exceeds that of men in the Arab States--there are 132
females for every 100 males in tertiary education.
At the other end of the spectrum, the developed OECD countries top the list as being closer to gender
equality – with eight countries registering less than 25 percent loss in human development due to gender
inequality: Netherlands, Denmark, Sweden, Switzerland, Norway, Belgium, Germany and Finland. The
gap in labour force participation remains marked however – standing at about 66 percent for women as
compared to 80 percent of men.
Countries in Europe and Central Asia have few women in parliament, though they are close to parity in
educational attainment and employment, and they have low maternal mortality ratios. For example, in
Lithuania, fewer than one in five parliamentarians are women, but the maternal mortality ratio -- of 11
deaths per 100,000 births – is low, secondary education rates are high and two thirds of women
participate in the labour market compared with about three in four men.
Regional patterns reveal that reproductive health is the largest contributor to gender inequality around the
world (Figure 2). Women in sub-Saharan Africa suffer the most in this dimension, followed by South
Asia and the Arab States and Latin America and the Caribbean. The Arab States and South Asia also
exhibit relatively weak female empowerment and unequal labour force participation.

21
Figure 2 Loss due to Gender Inequality by region
Source: HDR 2010, P93
Map 1 shows the pattern of GII results at the country level, and reinforces the regional picture
summarised above.
Map 1 Gender Inequality Index across 138 Countries
Note: Countries are categorized according to GII scores into four quartiles, reflecting a relative grouping with 34-35 countries in each. The associated threshold values of the GII are 0.280, 0.512, 0.674. Source: HDRO, based on 2010 Human Development Report

22
At the country level the GII ranges from 17 percent (Netherlands) to 85 percent (Yemen). But
tremendous variation in gender inequality exists. With a GII of 17 percent, the Netherlands is the country
which is closest to gender equality. The country has very low maternal mortality (6 deaths per 100,000
births), among the world’s lowest adolescent fertility rate (3.8 births per 1,000 women ages 15-19) and is
close to parity in educational attainment, political participation and employment. Yemen is the country at
the other end of the spectrum, with a GII score of 85 percent. Only 20 percent of women in Yemen are
in the labour force, women hold less than 1 percent of seats in parliament and only 8 percent of the female
population has attended secondary school. The country also has a high maternal mortality ratio of 430
deaths per 100,000 births and an adolescent fertility rate of 68 births per 1,000 women.
The bottom 10 countries (in descending order) are Cameroon, Côte d’Ivoire, Liberia, Central African
Republic, Papua New Guinea, Afghanistan, Mali, Niger, the Democratic Republic of the Congo and
Yemen, with an average GII of 0.79. Saudi Arabia is another country with high gender inequality, and
which is an interesting case. The country shows high human development, with a global HDI ranking of
55, an HDI of 0.75 and income per capita of nearly $25,000. However, despite good female educational
attainment, women are nearly absent from parliament, and female labour force participation rates are only
one-fourth those for men, giving the country a GII value of 0.76, and a ranking of 128 out of 138
countries.
For the bottom 20 countries the average maternal mortality ratio is about 915 deaths per 100,000 live
births and the adolescent fertility rate is 111 births per 1,000 women ages 15–19, both well above the
global averages of 273 deaths and 54 births. Moreover, there is only one woman for every eight men in
parliament.
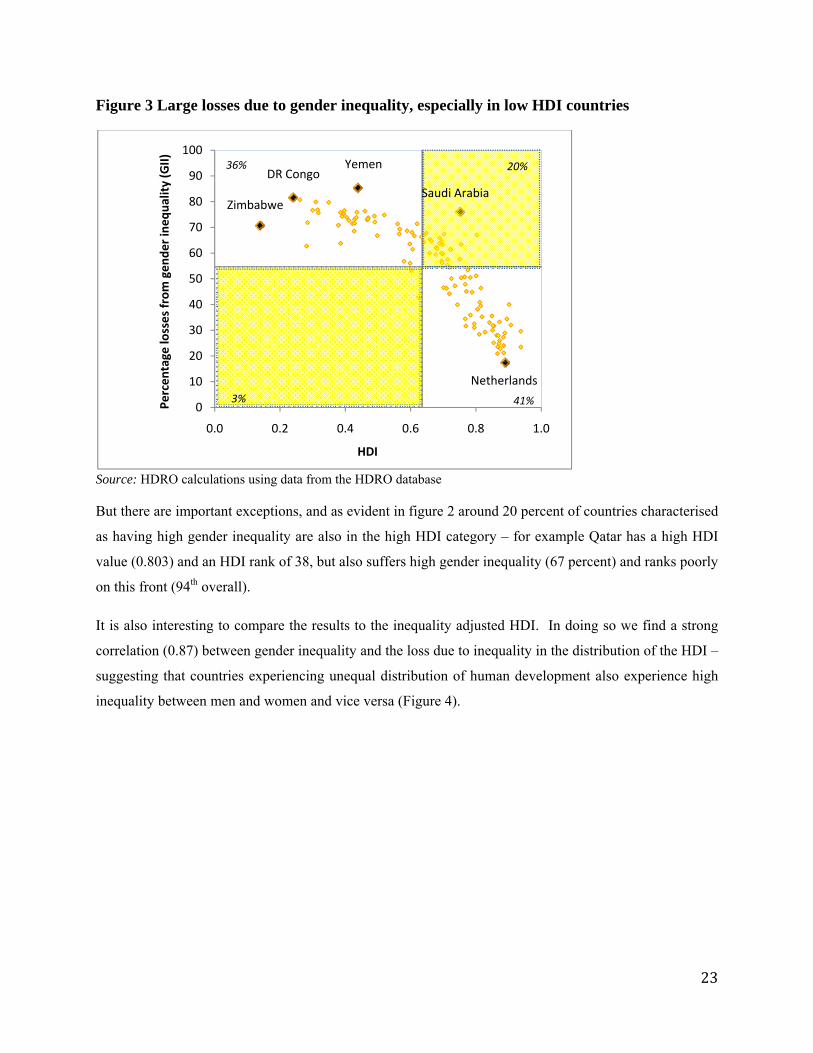
More generally, all of the bottom ranked HDI countries have high levels of gender inequalities on
multiple dimensions. This is shown in Figure 3. All 30 low HDI countries included in the 2010 GII have
a GII score exceeding 50 percent; whereas among the high and very high HDI countries, only 26 out of
the 74 included in the index have values that high. This suggests that gender equity is a key correlate of
low HDI, and vice versa.
23
Figure 3 Large losses due to gender inequality, especially in low HDI countries
Source: HDRO calculations using data from the HDRO database
But there are important exceptions, and as evident in figure 2 around 20 percent of countries characterised
as having high gender inequality are also in the high HDI category – for example Qatar has a high HDI
value (0.803) and an HDI rank of 38, but also suffers high gender inequality (67 percent) and ranks poorly
on this front (94th overall).
It is also interesting to compare the results to the inequality adjusted HDI. In doing so we find a strong
correlation (0.87) between gender inequality and the loss due to inequality in the distribution of the HDI –
suggesting that countries experiencing unequal distribution of human development also experience high
inequality between men and women and vice versa (Figure 4).
0
10
20
30
40
50
60
70
80
90
100
0.0 0.2 0.4 0.6 0.8 1.0
Percentage
losses from gender inequality (GII)
HDI
20%
3%
36%
41%
Zimbabwe
Netherlands
Saudi Arabia
DR CongoYemen

24
Figure 4 Loss due to gender inequality compared to multidimensional inequality
Source: HDR 2010, P94
For example, Central African Republic, Democratic Republic of the Congo, Mali and Mozambique each
experience losses in HDI due to inequality of greater than 55 percent and also have GII values above 70
percent (ranking them last in terms of loss due to inequality and in the bottom 30 countries in terms of
gender inequality). In the middle of the spectrum we see Ghana, Egypt and Guatemala; each with loss
due to gender inequality of around 72 percent and losses due to inequality of around 30 percent; and
Paraguay, Columbia and the Dominican Republic each experience loss in human development due to
gender inequality of around 65 percent and losses due to inequality of 20 percent. In addition, 8 of the 10
best performing countries in terms of gender equality are also among the 20 countries that experience the
smallest losses in human development due to inequality.
5. COMPARING RESULTS WITH OTHER GENDER INDICES
As noted in Section 2 above, the various gender indices measure gender inequality in different ways – and
because the underlying conceptual frameworks differ, so too do the results. Still, given the commonality
of objectives it is interesting to review and contrast the results and pictures which emerge. We do this for
the GDI and GEM, GGI, GEI, SIGI and WEOI.

25
There are 93 countries for which the GII, GDI and GEM are calculated and we find very little rank order
correlation between the three indices—only 0.4. The different method of aggregation, which reduces the
extent to which a high achievement in one dimension can compensate for a low achievement in another,
partly explains this lack of correlation.
The comparison of GDI rank and GII rank shows some interesting results (Figure 5). For example, the
Republic of Moldova gains 41 places, China 29 places and Viet Nam 23 places on the GII as compared to
the GDI. The gain results mainly from relatively low maternal mortality and adolescent fertility rates
combined with high levels of female labour force participation. In additional Qatar and Saudi Arabia lose
47 and 39 places respectively. The huge lose is largely explained by relatively low female labour force
participation rates and the absence of females in parliament. Absence of income from the measure also
erodes advantages these countries had previously on the income dimension of the GDI.
Figure 5 Difference in ranks GII as compared to GDI
Source: Authors’ computations based on data from 2010 HDR and 2009 HDR
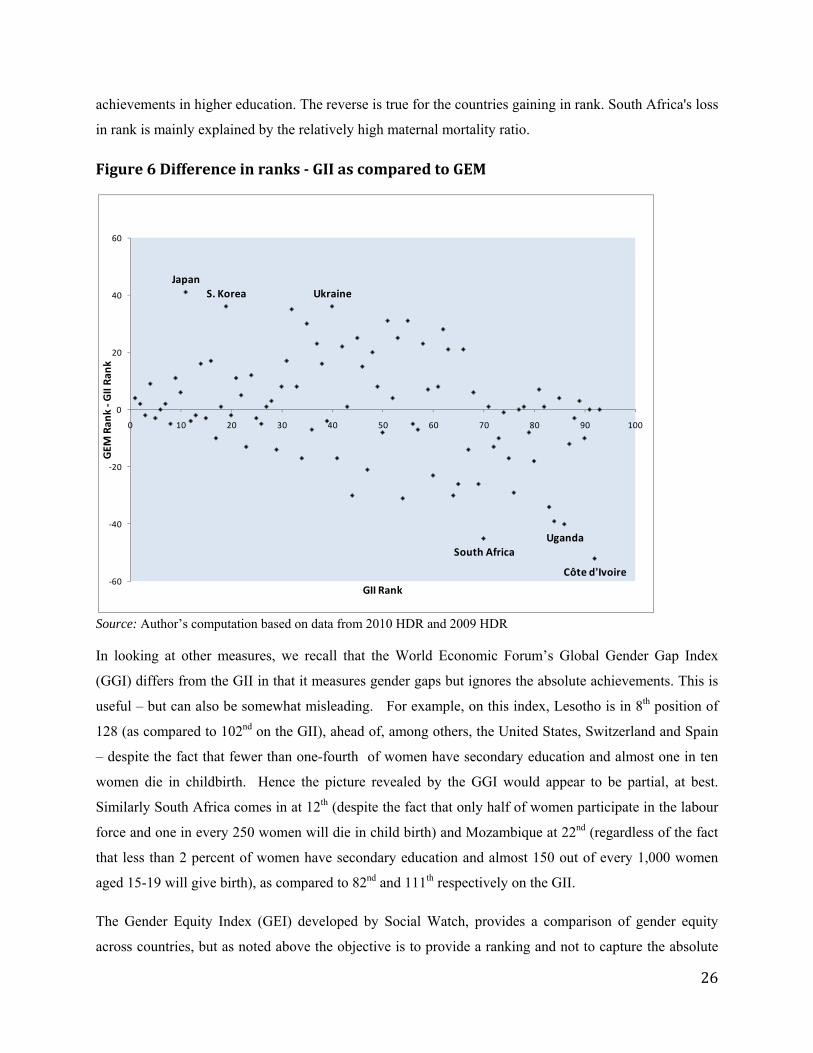
In contrast, different rankings emerge relative to the GEM, as shown in Figure 6. Côte d’Ivoire, South
Africa and Uganda fare poorly worse on the GII, losing 52, 45 and 40 places in rank respectively. While
Japan gains 41 places and South Korea and Ukraine each gain 36 places in rank. Both Côte d’Ivoire and
Uganda have relatively high maternal mortality and adolescent fertility ratios; and low female
China
Moldova
Viet Nam
Panama
Qatar
Saudi Arabia
‐60
‐50
‐40
‐30
‐20
‐10
0
10
20
30
40
50
0 10 20 30 40 50 60 70 80 90 100
GDI Rank ‐GIIRank
GII Rank
26
achievements in higher education. The reverse is true for the countries gaining in rank. South Africa's loss
in rank is mainly explained by the relatively high maternal mortality ratio.
Figure 6 Difference in ranks GII as compared to GEM
Source: Author’s computation based on data from 2010 HDR and 2009 HDR
In looking at other measures, we recall that the World Economic Forum’s Global Gender Gap Index
(GGI) differs from the GII in that it measures gender gaps but ignores the absolute achievements. This is
useful – but can also be somewhat misleading. For example, on this index, Lesotho is in 8th position of
128 (as compared to 102nd on the GII), ahead of, among others, the United States, Switzerland and Spain
– despite the fact that fewer than one-fourth of women have secondary education and almost one in ten
women die in childbirth. Hence the picture revealed by the GGI would appear to be partial, at best.
Similarly South Africa comes in at 12th (despite the fact that only half of women participate in the labour
force and one in every 250 women will die in child birth) and Mozambique at 22nd (regardless of the fact
that less than 2 percent of women have secondary education and almost 150 out of every 1,000 women
aged 15-19 will give birth), as compared to 82nd and 111th respectively on the GII.
The Gender Equity Index (GEI) developed by Social Watch, provides a comparison of gender equity
across countries, but as noted above the objective is to provide a ranking and not to capture the absolute
JapanS. Korea Ukraine
South AfricaUganda
Côte d'Ivoire‐60
‐40
‐20
0
20
40
60
0 10 20 30 40 50 60 70 80 90 100
GEM Rank ‐GII Rank
GII Rank

27
levels of gender inequality within countries. The top and bottom ranking countries on the GEI are similar
to those identified by the GII – Sweden, Finland and Norway are all in the top 5, and Yemen, Benin and
Cote d’Ivoire are all in the bottom 10. There are however some surprises: Rwanda ranks fifth on the GEI,
but is 83rd on the GII. Other notable differences include the Philippines, which is ranked 13th on the GEI
and 78th on the GII, and Colombia which is ranked 18th on the GEI and 95th on the GII. These differences
appear to arise because of the inclusion of reproductive health on the GII –both countries perform
relatively very poorly on this dimension as compared to their performance in the dimensions of
empowerment and labour force participation. It is also useful to recall that the GII is association
sensitive. This clearly highlights that the indexes are measuring different things – one showing the loss to
potential human development caused by gender inequality, and the other the situation of women relative
to men as compared across countries.
The SIGI, as noted above, is focused not on gendered outcomes, but rather on the institutions that
influence such outcomes. By focusing on the root causes behind gender inequalities, SIGI is a useful
complement to track reforms and social institutions affecting the gender based inequalities measured by
the GII. In 2009 the top 5 countries (out of 102 non-OECD countries) suffering the lowest discrimination
in social institutions based on SIGI rankings were Paraguay, Croatia, Kazakhstan, Argentina and Costa
Rica. In contrast these countries rankings on the GII are 85, 30, 67, 60 and 51 respectively. These
contrasting results underline the need to examine why countries making strong institutional and policy
efforts to promote gender equity still experience significant losses in human development due to gender
inequality. This may raise issues around implementation, cultural and other constraints, as well as
questions about the time needed for reforms to take effect.
Finally, the recently released WEOI, like the SIGI, focuses on the institutions that affect women’s
participation - in this case in relation to women’s economic opportunities. Specifically, the WEOI
considers the laws, regulations, practices, customs and attitudes that allow women to participate in the
workforce under conditions roughly equal to men, whether as wage-earning employees or as owners of a
business. One data related constraint is that the focus is limited to the formal sector, which means that the
measure likely provides better insights for developed countries and urban elites in developing countries
than for developing countries more generally. Nonetheless it is notable that the top 5 ranked countries on
the WEOI – Sweden, Belgium, Norway, Finland and Germany – are also in the top 10 on the GII. And 4

28
of the bottom 5 – Togo, Cote d’Ivoire, Yemen and Sudan39 – also score poorly on the GII, with rankings
of 115, 130, N/A, 138 and 106 respectively.
6. CONCLUSIONS
Significant progress has been made in measuring women’s status and well-being. However, substantial
challenges remain. First, there is a lack of gender disaggregated data for many important aspects of
women’s status and well-being. Second, even when there are measures available for many countries, they
may not be available for those countries where gender is a particularly salient issue. Third, time series
data for indicators measured consistently are usually not available. Finally, in order for international
comparisons to be meaningful, consistent measures are needed. Thus, some of the more interesting
aspects of gender – including property ownership, participation in community life and decision making,
seats on boards, and gender based violence -- are not included in any of the indices.
The GII is unique in that it focuses on critical issues of educational attainment, economic and political
participation, as well as female-specific health issues. None of the existing gender gap measures
incorporate a reproductive health indicator, which is very pertinent to the other choices women can make.
Adolescent fertility raises important questions of whether young women have access to contraceptives
and to sex education to help them make informed choices. The method allows us to combine issues
where women’s status is considered in relation to men’s with issues where a male counterpart does not
exist, namely reproductive health.
In sum, the GII casts important light on gender disparities in health, empowerment and labour market
participation across 138 countries in the world. It yields new and important insights on gender gaps in
well-being and empowerment. It shows that some societies disadvantage women in critical dimensions,
thereby pointing to the need for more proactive public policies. By looking at the component indicators,
the GII give pointers to areas needing critical policy intervention.
39 Chad is the 5th country in the bottom 5 on the SIGI, however no GII could be computed for this country due to insufficient data.

29
BIBLIOGRAPHY
Abdullah, R. (2000). A Framework on Indicators for Action on Women’s Health Needs and Rights after Beijing. Kuala Lumpur: Malaysia: Asian- Pacific Resource and Research Centre for Women.
Agarwal, B. (2003). Gender and Command over Property: A Critical Gap in Economic Analysis and Policy in South Asia . Journal of Agrarian Change , Vol. 3 184-224.
Agarwal, B. (1994). Gender and command over property: A critical gap in economic analysis and policy in South Asia. Journal World Development , (10) 1455-1478.
Bardhan, K., & Klasen, S. (1999). UNDP's Gender-Related Indices: A Critical Review. World Development (7) , 985-1010.
Barro, R., & Lee, J. (2010). A New Data set of Educational Attainment in the World, 1950 to 2010. NBER Working Paper 15902.
Becker, S. (1997). Incorporating Women's Empowerment in Studies of Reproductive Health: an example from Zimbabwe. Paper presented at the Seminar on Female Empowerment and Demographic Processes , Lund.
Beneria, L., & Permanyer, I. (2010). The Measurement of Socio-economic Gender Inequality Revisited. Development and Change , 375-399.
Buvinic, M. (1998). “The costs of adolescent childbearing: Evidence from Chile, Barbados, Guatemala, and Mexico.” Studies in FamilyPlanning 29(2), 201-209. Clemens, M. (2004). The Long Walk to School: international education goals in historical perspective. Development and Comp systems .
Desai, M. (2010). “Hope in Hard Times: Women’s Empowerment and Human Development.” Human Development Research Paper 14. United Nations Development Programme, Human Development Report Office, New York.
Dijkstra, A. (2006). Towards a Fresh Start in Measuring Gender Inequality: a contribution to the debate. Journal of Human Development , Vol 7, 275-283.
Greene, M and T. Merrick. (2008) Poor Health, Poor Women. How reproductive health affects poverty, World Bank. http://www.icrw.org/docs/ECSP_Focus_Greene.pdf Hawken, A., & Munck, G. (2009). Cross-National Indices with Gender-Differentiated Data: What Do They Measure? How Valid Are They? Technical background paper for the forthcoming UNDP Asia Pacific Human Development Report on gender . UNDP.
Hogan, M., Foreman, K., Naghavi, M., Ahn, S., Wang, M., Makela, S., et al. (2010). Maternal Mortality for 181 countires, 1980-2008: a systematic analysis of progress towards Millenium Development Goal 5. The Lancet .

30
Ibrahim, S., & Alkire, S. (2007). Agency and Empowerment: A Proposal for Internationally Comparable Indicators. University of Oxford: OPHI Working Paper.
Kabeer, N. (2005). Gender equality and women's empowerment: a critical analysis of the thrid millenium development goal. Gender and Development , vOL 13, 13-24.
Kelly, L., Kennedy, L., & Horvath, M. (2008). The Next Step: Developing Transnational Indicators on Violence Against Women. In Y. Ertürk, addendum to the Report of the Special Rapporteur on Violence Against Women, its Causes and Consequences (p. A/HRC/7/6/Add.5). New York: UN: General Assembly.
Klasen, S. (2004). Gender Related Indicators of Well-being. World Institute for Development Economic Research: Working Paper UNU-WIDER Research Paper.
Klasen, S. (2006). UNDP's Gender-Related Measures: Some Conceptual Problems and Possible Solutions. Journal of Human Development and Capabilities , Vol 7 243-274.
Klasen, S., & Shuller, D. (2009). Reforming the Gender-Related Development Index (GDI) and the Gender Empowerment Measure (GEM): Some Specific Proposals. Ibero America Institute for Econ. Research (IAI) Discussion Papers 186 .
Luttrell, C., Quiroz, S., & Scrutton, C. (2009). Understanding and Operationalising Empowerment. Paper prepared for the poverty-wellbeing platform. London.
OECD . (2009). Coutnry Profiles: Gender Equality and Social Indicators. OECD Development Centre.
Permanyer, I. (2009). The Measurement of multidimensional gender inequality: continuing the debate. Journal of Social Indicators Research , Online ISSN 1573-02921. Springer, Netherlands.
Ransom, E., & Yinger, N. (2002). Making Motherhood Safer: Overcoming Obstacles on the Pathway to Care. 2002: Population Reference Bureau.
Rowbottom, S. (2007). Giving girls today and tomorrow: Breaking the cycle of adolescent pregnancy. New York: United Nations Population Fund.
schuler, D. (2006). The Uses and Misuses of the Gender-related Development Index and Gender Empowerment Measures: A Review of the Literature. Journal of Human Development: Vol. 7 , 161-181.
Sen, A. (1999). Development as Freedom. Oxford: Oxford University Press.
Seth, S. (2009). Inequality, Interactions and Human Development. Journal of Human Development and Capabilities, Vol 10 , 375-396.
Seth, S. (2010). A Class of Association Sensitive Multidimensional Welfare Indices, Vanderbilt University Econmics Department Working Paper. Washington..
UNDP. (1990). Defining and Measuring Human Development. In UNDP, Human Development Report 1990 (pp. 9-16). New York: United Nations.

31
UNDP (1995). Human Development Report 1995: Gender and Human Development, UNDP, New York.
UNDP (2003). Informe de Desarrollo Humano de Genero en Bolivia, UNDP, La Paz.
UNDP (2004). Jordan Human Development Report 2004: Building sustainable livelihoods, UNDP, Amman
UNDP (2005a) Arab States Human Development Report: Empowerment of Arab Women, UNDP, New York
UNDP (2005b). Discussion: revisiting the GDI and GEM, HDRStats-Net Consolidated Reply, UNDP, HDRO
UNDP (2005c). Korean Human Development Report: Gender, UNDP, Seoul.
UNDP (2007) Azerbaijan National Human Development Report: Gender Attitudes in Azerbaijan - Trends and Challenges, UNDP, Azerbaijan.
UNDP (2010a). Asia-Pacific Human Development Report 2010: Power, Voice and Rights: a Turning Point for Gender Equality in Asia and the Pacific, UNDP, Colombo.
UNDP (2010b). Human Development Report 2010 The Real Wealth of Nations: Pathways to Human Development, UNDP, New York
UNICEF (United Nations Children's Fund (2008). Progress for Children: A Report Card on Maternal Mortality. New York. Zambrano, E. (2010a). Gender Inequality Do's and Don'ts. California Polytechnic State University Economics Department Working Paper, San Luis Obispo. Zambrano, E. (2010b). On the Measurement of Gender Inequality. California Polytechnic State University Economics Department Working Paper, San Luis Obispo.
32
APPENDIX 1. DESIGNING THE GENDER INEQUALITY INDEX40
First we introduce the notation. The achievements of women and men in three dimensions of a society’s
human development is measured by five indicators, and expressed by a 2x5 matrix X, where row i=1,2,
contains the achievements , j=1,…,5 corresponding to the five indicators for gender i. The entries in X
are positive numbers, with a high value of representing a high accomplishment of gender i in
dimension j.
We are looking for a composite index of inequality between women and men across five indicators which
satisfy some basic properties of a well defined inequality measure, such as scale invariance, gender
symmetry, inequality aversion, and also the right kind of association sensitivity. Scale invariance means
that if all indicators are multiplied by the same positive constant, the relative positions of both genders,
and the relative position of all indicators for each gender, remain the same, and thus gender inequality
remains the same. Gender symmetry refers to the index treating women and men the same, as all
important differences between them are intended to be captured by X. The inequality aversion property
means that the mean preserving spread of the achievements across indicators and genders increase
inequality. Finally, the association sensitivity of the index we seek means that gender inequality increases
under increasing association across indicators indicating that the more likely it is for a particular gender to
have the relatively high achievement in all dimensions, the higher the gender inequality in that country.41
A class of measures that satisfy these properties can be built from considering welfare indices defined
through computing general mean of general means. We present a particular form for two gender groups,
five indicators and the aggregation across indicators with elasticity of substitution of one which implies
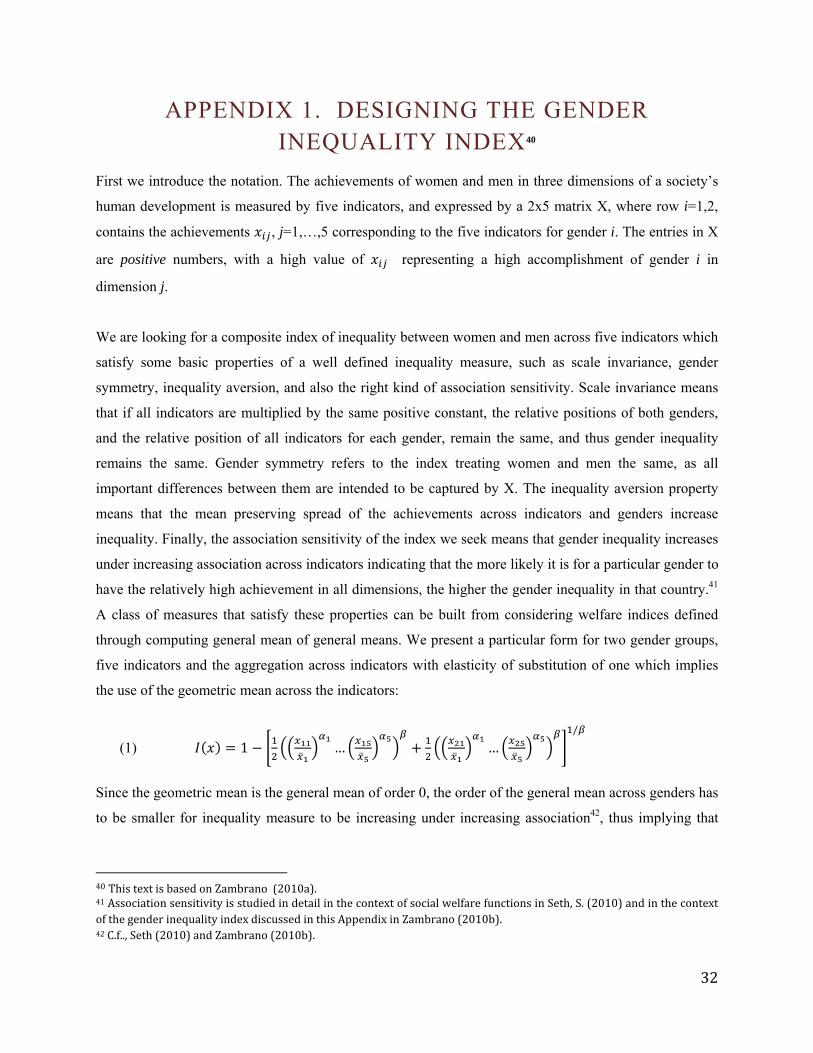
the use of the geometric mean across the indicators:
(1) 1 … …/
Since the geometric mean is the general mean of order 0, the order of the general mean across genders has
to be smaller for inequality measure to be increasing under increasing association42, thus implying that
40 This text is based on Zambrano (2010a). 41 Association sensitivity is studied in detail in the context of social welfare functions in Seth, S. (2010) and in the context of the gender inequality index discussed in this Appendix in Zambrano (2010b). 42 C.f.., Seth (2010) and Zambrano (2010b).
33
0. If 1 the aggregation across genders is by the harmonic mean. The , … , are positive
weights that sum up to one.
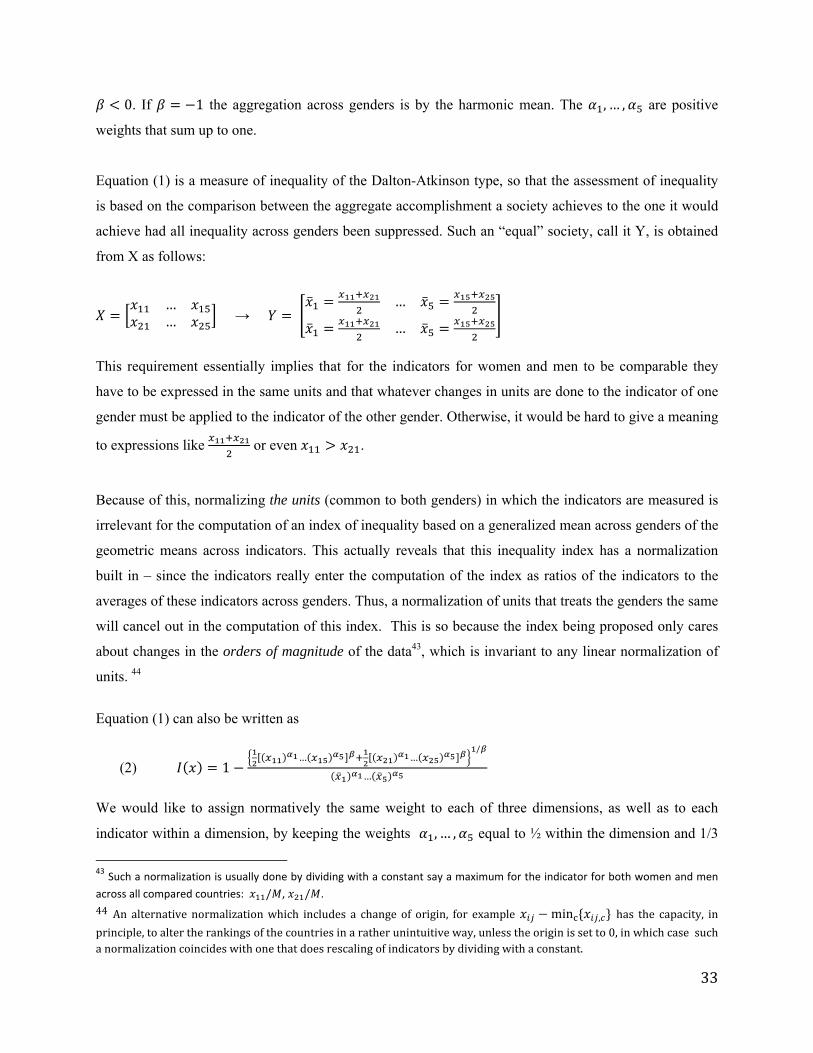
Equation (1) is a measure of inequality of the Dalton-Atkinson type, so that the assessment of inequality
is based on the comparison between the aggregate accomplishment a society achieves to the one it would
achieve had all inequality across genders been suppressed. Such an “equal” society, call it Y, is obtained
from X as follows:
…… →
…
…
This requirement essentially implies that for the indicators for women and men to be comparable they
have to be expressed in the same units and that whatever changes in units are done to the indicator of one
gender must be applied to the indicator of the other gender. Otherwise, it would be hard to give a meaning
to expressions like or even .
Because of this, normalizing the units (common to both genders) in which the indicators are measured is
irrelevant for the computation of an index of inequality based on a generalized mean across genders of the
geometric means across indicators. This actually reveals that this inequality index has a normalization
built in – since the indicators really enter the computation of the index as ratios of the indicators to the
averages of these indicators across genders. Thus, a normalization of units that treats the genders the same
will cancel out in the computation of this index. This is so because the index being proposed only cares
about changes in the orders of magnitude of the data43, which is invariant to any linear normalization of
units. 44
Equation (1) can also be written as
(2) 1… …
/
…
We would like to assign normatively the same weight to each of three dimensions, as well as to each
indicator within a dimension, by keeping the weights , … , equal to ½ within the dimension and 1/3
43 Such a normalization is usually done by dividing with a constant say a maximum for the indicator for both women and men
across all compared countries: / , / .
44 An alternative normalization which includes a change of origin, for example min , has the capacity, in principle, to alter the rankings of the countries in a rather unintuitive way, unless the origin is set to 0, in which case such a normalization coincides with one that does rescaling of indicators by dividing with a constant.

34
between the dimensions. Noting that the first dimension - health, has two indicators, the second
dimension - empowerment, has also two, and the third - labour market, has only one, the (2) becomes
(3) 1
. . . .
/
where . . /2, . . /2, and
/2, represent the dimension means obtained under assumption of gender equality.
The Gender Inequality Index will be equal to 0 if women and men fare equally in each dimension. The
Gender Inequality Index tends to 1 as the harmonic mean on the right hand side tends to zero which is the
case if the gap between women’s and men’s achievements is increasing.
It is important to note that two indicators of health dimension, maternal mortality ratio (MMR) and
adolescent fertility rate (AFR), have a different direction from the other indicators and have to be
transformed in a way that is consistent with the functional form and the normalization. Such a
transformation has to preserve the proportions in the data and to result in a transformed indicator of the
same direction as others - that is an increase in the indicator corresponds to an improvement. Computing
the inverse of MMR and AFR has exactly those two properties. Take for example Latvia with MMR
equal to 10 and Tunisia with MMR equal to 100. The ratio of the two is 10, that is, Tunisia has a level of
MMR that is 10 times higher than that of Latvia. Changing the direction of the indicator but preserving
the factor of proportionality in the relative relationship we have to arrive to an indicator that will assign
value to Latvia that is 10 times higher than the one assigned to Tunisia. We achieve this by taking the
inverse of MMR - for Latvia it is 100,000/10=10,000 and for Tunisia it is 100,000/100=1000.
We arrive to a natural interpretation of the inverse of MMR by first observing that MMR/100,000 is the
probability of the mother dying in a live birth. Then, 100,000/MMR is how many live births, on average,
one has to witness before seeing the mother die during birth. The number for Latvia, 10,000, says that one
has to witness, on average, 10,000 live births before seeing the mother die during birth. The number for
Tunisia is 1,000, case in which one has to witness, on average, 1,000 live births before seeing the mother
die during birth.
The same logic and equivalent interpretation holds for the AFR.

35
Finally, it also makes sense to calculate the loss due to inequality in each dimension. The loss due to
inequality in the first dimension (expressed by two indicators) is given as
1
12
. 12
.
where . . /2. The loss in other dimensions can be obtained in the same
way. However, the GII is not a simple sum of these dimension losses, it also accounts for the association
between dimensions.

36
APPENDIX 2: SUMMARY OF STATISTICAL AND SENSITIVITY ANALYSIS OF THE GII
HDRO undertook extensive statistical and sensitivity analyses of the Gender Inequality Index. These
found that the reproductive health indicators are the most influential in determining the level of gender
inequality, followed by the empowerment indicators – education and parliamentary representation.
The labour force participation rate appears to be a relatively weak indicator: its impact on country
rankings is the smallest (it is weakly correlated to the GII). And if we exclude it we see that 50 percent
countries would change their ranks by at most 2 places, and the next 45 percent of countries rank would
change by 10 places or less. However no other options are available on the economic side for a
sufficiently large number of countries.
We undertook sensitivity analysis of the rankings to three methodological judgments – replacement of
zero parliamentary representation of women in Qatar and Saudi Arabia by 0.1%, truncation of maternal
mortality ratio at 10 and 1000, and the choice of parameter in the general form given by equation (1) of
appendix 1.
It should be recalled that Qatar and Saudi Arabia have zero female parliamentary representation. We
assumed a level of 0.1 percent. Their ranking could improve for up to 26 places if a higher value was
used. However, the use of 0.1% has been justified on the ground that the smallest observed non-zero
value of this indicator is 0.7 percent for Yemen (3 seats out of 412) or 0.2 percent for each seat held by
women. Thus replacing zero percent of seats by any number over 0.1 percent would give an advantage to
Qatar and Saudi Arabia over the actual achievements in other countries. On the other hand because only
one seat held by a woman increases the value of the indicator to 2.6 and 0.7 in these countries
respectively, it would be hard to justify a figure below 0.1 as a replacement.
The weaknesses in MMR estimates are well known. Truncation of the MMR at 10 and 1000, to exclude
outliers, keeps about three-fourths of the countries in the sample at the same ranks as they would have if
the original MMR was used; for the other 35 countries, the rank changed by at least one place, for about
5% or 7 countries, the rank changed by at least 7 places, and for two countries – Saudi Arabia and Qatar -
the ranks changed by 9 and 23 places, respectively. The justification for truncation at 10 and 10,000 is to
avoid the statistical uncertainty in relatively very small numbers – our judgment was that countries with 1
to 10 deaths per 100,000 are performing at effectively the same level of care in terms of reproductive
health, and that differences among these countries are insignificant. Otherwise, a country with only one
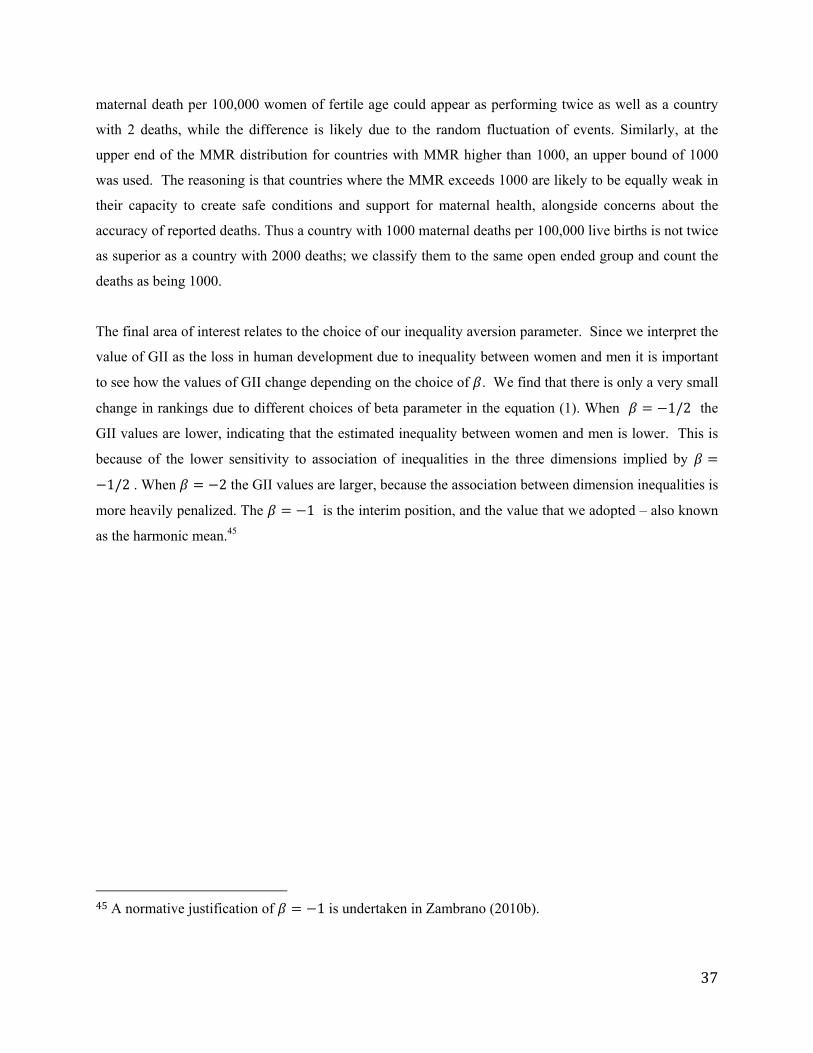
37
maternal death per 100,000 women of fertile age could appear as performing twice as well as a country
with 2 deaths, while the difference is likely due to the random fluctuation of events. Similarly, at the
upper end of the MMR distribution for countries with MMR higher than 1000, an upper bound of 1000
was used. The reasoning is that countries where the MMR exceeds 1000 are likely to be equally weak in
their capacity to create safe conditions and support for maternal health, alongside concerns about the
accuracy of reported deaths. Thus a country with 1000 maternal deaths per 100,000 live births is not twice
as superior as a country with 2000 deaths; we classify them to the same open ended group and count the
deaths as being 1000.
The final area of interest relates to the choice of our inequality aversion parameter. Since we interpret the
value of GII as the loss in human development due to inequality between women and men it is important
to see how the values of GII change depending on the choice of . We find that there is only a very small
change in rankings due to different choices of beta parameter in the equation (1). When 1/2 the
GII values are lower, indicating that the estimated inequality between women and men is lower. This is
because of the lower sensitivity to association of inequalities in the three dimensions implied by
1/2 . When 2 the GII values are larger, because the association between dimension inequalities is
more heavily penalized. The 1 is the interim position, and the value that we adopted – also known
as the harmonic mean.45
45 A normative justification of 1 is undertaken in Zambrano (2010b).