human capital investment responses to skilled migration
TRANSCRIPT

Human Capital Investment Responses to SkilledMigration Prospects: Evidence from a Natural
Experiment in Nepal
Slesh A. Shrestha⇤
University of Michigan
November 15, 2011
Abstract
Brain drain has been perceived as a hindrance to poor countries’ development.However, by increasing the expected returns to education, improved prospects forskilled emigration may stimulate human capital investment at home. Empiricalevidence on the net e↵ect of emigration prospects is scarce, largely because char-acteristics that drive human capital investment also directly a↵ect the decision toemigrate. This paper focuses on a natural experiment that involves the recruit-ment of Nepali men into the British Army, a tradition that originated duringBritish colonial rule in South Asia. In 1993 a change in the education require-ment for Nepali recruits resulted in an exogenous, di↵erential increase in theirskilled versus unskilled emigration prospects. Due to a historical pattern of re-cruitment established in the mid-19th century, Nepali men of Gurkha ethnicitywere disproportionately a↵ected by this change. I use individual-level informationon ethnicity, gender, and age to motivate a set of di↵erence-in-di↵erence and syn-thetic control strategies to estimate e↵ects on educational attainment. Eligiblemen responded to the rule change by raising their schooling by over one year, a30% increase over the average. This increase also occurred for eligible men whodid not emigrate, so there was a net increase in the human capital stock of eligiblemen.
JEL Classification: O15, F22, J61, I21Keywords: migration, human capital investment, return to education, brain drain
⇤Department of Economics, University of Michigan, Ann Arbor, MI 48104. Email [email protected] am grateful to my advisors Dean Yang, Raj Arunachalam, David Lam, Susan Dynarski, and CharlesBrown. I would like to thank Rebecca Thornton, Michael Clemens, and the participants at the 2010NEUDC Conference for many helpful suggestions and discussion. All errors and omissions are my own.
1

1 Introduction
“Brain drain” describes the emigration of skilled workers, mainly from developing
to developed countries. It hinders countries’ long-run economic growth by depleting
their scarce human capital. In 2000 more than 12 million individuals from developing
countries with tertiary education, 20 percent of their educated workforce, were living
in OECD countries.
A new literature in skilled emigration emphasizes the e↵ect of future emigration
opportunities on human capital accumulation. The reasoning behind these “brain gain”
models is that migration prospects raise the expected returns to education and encour-
age individuals at home to increase their human capital investment. If enough skilled
individuals eventually decide not to emigrate, it can lead to a net increase in human
capital stock at home.1 While these new theoretical predictions challenge the negative
view of skilled emigration, empirical evidence is scarce because migration prospects
are endogenous. This paper overcomes the problem by identifying a natural experi-
ment that exogenously and di↵erentially raised emigration prospects for skilled versus
unskilled individuals at home.
The experiment involves a change in the British Gurkha Army recruitment regula-
tions. The British Gurkha Army is the unit of the British Armed Forces that is com-
posed of Nepali men of Monglo-Tibeto origins. According to Banskota (1994), since
1857 the Monglo-Tibeto tribes have created a tradition of enlisting in the British Gurkha
Army, and thereby they are collectively referred to as the Gurkha ethnic group.2 Fur-
1Individuals could change their emigration decision in the future for various reasons. The most pop-ular explanation put forward by earlier brain gain papers is that quotas set by immigration authoritiesin destination countries are binding. Hence, even if lots of individuals actively seek to emigrate inthe future, most of them are forced to live in their home country. Other reasons why individualschange their emigration decision, include unanticipated future changes in individuals’ socio-economiccharacteristics as well as changes in their preferences which a↵ect their future emigration choices.
2All the remaining ethnicities in Nepal, excluding the Gurkha ethnic group, are referred to as the“non-Gurkha” ethnic group for the remainder of this paper.
2

thermore, the economic and anthropological data from Nepal indicate that this British
colonial tradition still plays an important financial and cultural role in the Gurkha
communities of Nepal.3 In 1993 the British government changed the educational re-
quirement for the British Gurkha applicants, from requiring no education to requiring
a minimum of 8th grade education. This change was instigated by the modernization
of the British Army following the developments in Eastern Europe in the early 1990s
and the growing use of technology in warfare, as indicated by discussions in the House
of Commons.4 The reform focused on reducing service manpower and increasing tech-
nological capabilities, which were complemented by improving training and education
of soldiers. Because this change was part of the broader restructuring of the British
Army, the timing and the rationale for this change is exogenous to social, economic,
or political characteristics of Nepal. Therefore, it provides a simple natural experiment
where Gurkha men experienced an exogenous increase in skilled emigration prospect
relative to unskilled emigration to a foreign labor market i.e. the British Army.
My empirical approach improves identification compared to the strategies used in
previous studies. The problem in estimating the impact of skilled emigration prospects
on education arises for two reasons: first, unobserved characteristics, such as cultural
norms and values, a↵ect both migration and schooling decisions; and second, an increase
in human capital raises migration incentives by reducing the domestic wage for skilled
workers. Beine et al. (2006) address this problem by instrumenting current migration
prospects with the past emigrant stock. But the same time-invariant characteristics
that a↵ect migration prospects and necessitate the use of an instrumental variable
strategy are also likely to have a↵ected migration in the past, thus undermining the
3For detailed documentation for the cultural significance and the financial contribution of the BritishGurkha among Gurkha communities of Nepal, see Hitchcock (1966); Caplan (1995).
4For detailed documentation of the strategic defense reviews presented to the House of Com-mons regarding the restructuring of the British Army in early 1990s, together with the debate anddiscussions that followed, see the Eighth Defense Review. http://www.parliament.the-stationery-o�ce.co.uk/pa/cm199798/cmselect/cmdfence/138/13802.htm
3
validity of their historical instrument. While McKenzie and Rapoport (2006) argue that
historical migration rates within Mexico are the outcome of early 20th century railroad
networks, it could still be problematic if past migration led to a better assimilation of
foreign ideas, such as value of education, or if individuals with similar characteristics
came to live together in regions with better access to railroads. Therefore, the ideal
experiment would require two groups of individuals from developing countries that
are identical except that skilled emigration prospects exogenously increase for one of
them.5 The change in education requirement of the British Gurkha Army created such
an experiment.
Using Nepal Census data from 2001, I identify individuals’ ethnicity to determine
whether they were a↵ected by this rule change. Since age-invariant ethnic characteristics
could a↵ect education, I use their age at the time of the rule change as the second
criteria to determine their exposure. Given the recruits must be between the age of
1712 and 21 years old, only men who were 21 or younger in 1993 could be a↵ected
by the rule change. I refer to these cohorts as the “eligible” cohort and older cohorts
as the “ineligible” cohort in this paper. The di↵erence-in-di↵erence strategy controls
for all age-varying characteristics and age-invariant ethnic characteristics that could
be correlated with education. As an alternative strategy, I use the synthetic control
method developed by Abadie and Gardeazabal (2003) by constructing a comparison
for the Gurkha ethnic group based on ineligible cohorts’ ethnic characteristics. The
results suggest that the change in the educational requirement induced Gurkha men
of cohorts aged 6 to 12 at the time of the rule change to raise their education by 1.11
5To my knowledge, the only previous study to use a historical event for identification is Chand andClemens (2008). They use the unexpected coup in Fiji as a source of variation to study the e↵ectof emigration prospects on education. However, in contrast to my experiment, emigration prospectsfor the treatment group did not change exogenously but instead they argue that the decline in eco-nomic opportunity at home due to political instability created greater incentive for them to emigrate.In response, they invested in education that increased their likelihood of successfully emigrating tocountries such as Australia.
4
years and cohorts aged 13 to 21 by 0.39 years. The estimates are consistent across the
two strategies, highlighting the robustness of my empirical findings. More importantly,
the rule change did not increase migration rates of eligible Gurkha men and increase in
schooling also occurred for eligible Gurkha men who had not emigrated by 2001, which
means that the rule change increased the net human capital stock of eligible Gurkha
men.
My findings show that skilled emigration can lead to a net increase in human capi-
tal at home, by highlighting a positive impact of migration prospects on human capital
investment. The early literature in skilled emigration ignore this relationship and fo-
cus solely on the loss of human capital from emigration of skilled workers, thereby
concluding that skilled emigration is detrimental to home country’s human capital ac-
cumulation.6 By assuming that productivity increases with greater concentration of
skilled workers, the endogenous growth models of Miyagiwa (1991) and Haque and
Kim (1995) also predict negative impacts on economic growth. However, Mountford
(1997) and Stark et al. (1997) show that endogenizing human capital accumulation
on migration prospects, could raise net human capital stock of low income countries
and improve their economic growth if some skilled individuals eventually decide not to
emigrate. Since the recruitment was limited to 300 individuals annually, majority of
eligible Gurkha men did not join the British Gurkha Army. Therefore, my findings are
consistent with the theoretical predictions and overturn the pessimistic outcomes of the
earlier models.
While Foster and Rosenzweig (1996) and Kochar (2004) show that schooling choices
are a↵ected by educational returns at home, my paper extends their analysis beyond
political boundaries into foreign labor markets. I develop a theoretical model of human
capital and emigration decisions, highlighting the three important factors that drive
6Bhagwati and Hamada (1974) propose the brain drain tax to compensate for the loss incurred bydeveloping countries due to skilled emigration.
5

my results. First, there is a significant increase in income through emigration; second,
there is an educational requirement to emigrate; and third, the likelihood of successfully
emigrating is low. These three factors, which propelled eligible Gurkha men to invest
in education and led to a net increase in their human capital following the rule change,
are also the main drivers of brain gain in other developing countries. Beine et al. (2006)
argue that large income di↵erences between developing and developed countries increase
the perceived benefits of migration, and induce emigration in developing countries.
According to Docquier et al. (2007), popular destination countries such as Australia,
Canada, the United Kingdom, and the EU employ skill-biased immigration policy,
thereby making skilled emigration the most feasible way for individuals from developing
countries to emigrate. They also find that the skilled emigration rate in developing
countries in 2000 was only 7%, despite an increase of 70% over the previous decade.
In line with my findings, Chand and Clemens (2008) show that skill-selective points
systems used by immigration authorities of Australia and New Zealand induced Fijians
to invest in education, resulting in a net increase in the human capital stock of Fiji.
Therefore, the underlying mechanisms of my unique natural experiment are consistent
with economic forces a↵ecting individuals’ education and migration choices in many
developing countries.
The rest of the paper is structured as follows: Section 2 describes the natural ex-
periment. Section 3 presents a theoretical framework that forms the basis of brain gain
models. Section 4 explains the empirical strategy and the data used for causal esti-
mation. Section 5 presents the empirical results. Section 6 presents robustness for the
identification strategy and Section 7 concludes.
6
2 Background
Nepal is a landlocked country surrounded by India on three sides and China to its
north. Its geographical position historically made it a melting ground for people and
cultures from both north and south of its border (Shrestha, 2001). The 1996 National
Living Standard Survey categorizes the population of Nepal into 15 ethnic groups. Out
of them, the Gurkha ethnic group is comprised of 5 Monglo-Tibeto tribal groups– the
Rai, Limbu, Gurung, Magar, and Tamang, who settled in the eastern and central hills
of Nepal during the initial wave of migration from the north.
2.1 British Brigade of Gurkha
The British Brigade of Gurkha is the unit in the British Army that is composed
of Nepali soldiers. Following the Anglo-Gurkha war (1814-1816), the British East In-
dia company and the Government of Nepal signed the treaty of Sugauli on March 4,
1816. The treaty transferred one-third of the territories previously held by Nepal to the
British and allowed them to set up three Gurkha regiments in the British Indian Army.7
The early recruits of the British Gurkha Army included ethnic groups such as the Ra-
jput, Thakuri, Chetri, and Brahman, who migrated from the south and were closely
associated with the ethnicities of India. In 1857, Indian soldiers serving in the British
Indian Army led a mutiny against British rule in South Asia. Although the rebellion
was eventually contained in 1858, the British became wary of Indian nationals serving
in their army. Rathaur (2001) and Caplan (1995) argue that, as a result, the British
stopped recruiting Nepali individuals belonging to the ethnicities that originated from
India into the British Gurkha Army. According to Rathaur (2001) after 1857, the new
Nepali recruits were mainly drawn from the Rai, Limbu, Gurung, Magar, and Tamang
7For details of the Sugauli Treaty see Rathaur (2001).
7
ethnic groups who, unlike other ethnicities in Nepal, had migrated from north and had
no cultural or historical ties with India.8
This ethnicity bias in the recruitment of British Gurkha Army continues to exist to
the present day as the majority of the current British Gurkha soldiers are comprised
of these 5 Monglo-Tibeto tribes. Although the British government no longer uses eth-
nicity as a criteria for selection, the de facto ethnicity bias could be due to the lack
of information on recruitment available for non-Gurkhas, or because non-Gurkhas are
marginalized in the recruitment process as the first stage of selection is conducted by ex-
Gurkha servicemen who are themselves from Gurkha ethnic group. Consequently, this
British colonial tradition has evolved into an important cultural identity and lucrative
economic opportunity for the individuals of the Gurkha ethnic group. The present value
of the lifetime income from serving in the British Gurkha Army for 25 years is estimated
to be $ 1,334,091.81.9 This includes a starting salary of $ 21,000 and a lifelong annual
pension of about $ 15,000 after retirement. According to Caplan (1995), remittances
from Gurkha soldiers and pensions for ex-Gurkha soldiers were the country’s largest
earner of foreign currency until the recent development of tourism and other sources of
migration. Although every year there are only 300 successful applicants, the pay and
pensions of the servicemen are the major source of capital in most Monglo-Tibeto com-
munities in the hills of Nepal, mainly because their alternative employment is limited
to farming.10 The financial benefits of the British Gurkha Army in these communities
is evident from quotes from the Gurkha households documented by Caplan (1995) such
8The preference for Gurkha ethnic men is evident from the letter by the British CommandingRecruitment O�cer to Colonel Berkely, the British Resident at Kathmandu, in the early 1900s inwhich he writes, “I first consider his caste. If he is of the right caste, though his physique is weak, Itake him” (Banskota, 1994).
9See Table 11 for the detailed calculation of the lifetime income for Gurkha soldiers. Other non-financial benefits include the opportunity to permanently settle in the UK along with immediate familymembers.
10The Defense Committee of the House of Commons in 1989 suggested that the annual salary ofBritish Gurkha soldier was 100 times the average income in the hills from where they come from.
8

as, “One of my boys has gone to the Army, we have only that hope.”
Although the appeal of joining the British Gurkha Army is driven by economic
benefits, it also brings cultural prestige to Gurkha communities. Caplan (1995) points
out that Gurkha ex-servicemen as well as their wives are known in their villages by their
titles of the British Army and acquire considerable reputations to become the new elite
in their communities. Hitchcock (1966) reports that many Gurkha villages are named
after the title of their highest ranking British Gurkha o�cer, such as “the Captain’s
village.” These narratives highlight the social, political, and economic stature wielded
by the British Gurkha Army in Gurkha communities of Nepal.
2.2 Natural Experiment: A Change in Education Criteria
Education is an important aspect of the British Gurkha recruitment. Starting from
1993, recruits must have completed at least 8 years of education.11 Prior to this,
however, no formal education was required to join the British Army and the selection
criteria was strictly limited to physical examinations. This change in the education
requirement was instigated by the larger restructuring of the British Army in the early
1990s. Following the end of the cold war, a series of defense reviews termed “Option
for Change” was conducted by the UK Ministry of Defense in order to evaluate the
role of its army in the post-cold war era. It focused on reducing defense expenditure
spurred by the economic benefits of the “peace dividend”12 and, consequently, led to a
reduction in service manpower of the British Army by 18 percent. Furthermore, this
reduction was accompanied by the emphasis on a flexible and modernized force. This
was achieved by incorporating new technologies in weapon systems, communications,
11In 1997, the education requirement was further increased to a minimum of 10 years of education.12Peace dividend is a political slogan popularized by US president George H.W. Bush and UK
Prime Minister Margaret Thatcher after the end of the cold war. It describes the reduction in defensespending undertaken by many western nations, including as the US and the UK, and the subsequentredirection of those resources into social programs and a decrease in tax rates.
9

reconnaissance missions, and intelligence gathering, and by improving education and
training of soldiers. The Option for Change outlined the use of technology in future
warfare and the importance of education for soldiers who use it, and concluded that
“strong defense requires military capability of fighting in a high-technology warfare; the
aim is smaller forces, better equipped, and properly trained” (Eighth Defense Report,
1997). In fact, the trend towards educated soldiers had already begun in the US Army,
as its recruits with a high school diploma increased by 30 percent in the late 1980s.13
Hence, the increase in educational requirement for the British Gurkha was induced by
the modernization of the British Army in response to the increasing role of technology
and the political changes in Eastern Europe and, therefore, it was exogenous to the
socio-political events in Nepal.
3 Theoretical Model
Becker’s model of human capital views education as an investment, where individuals
compare their costs to future benefits. The future benefits from investing in education
is an increase in lifetime income earned domestically when there is no opportunity
to emigrate. Given positive emigration prospects, however, the future benefits should
additionally include expected increase in income earned abroad. Furthermore, the latter
could be larger if either the wage rate per human capital is higher abroad, or income
abroad at all levels of education is greater and education is required to emigrate, or
both. The following theoretical model, based on Docquier et al. (2007), highlights these
positive e↵ects of higher skilled emigration prospects on expected returns to schooling
and, consequently, on educational investment and net human capital stock.
13According to the Tenth Quadrennial Review of US Military Compensation, the recruits who scoredbetter than the median in the Armed Forces Qualification Test (AFQT) increased by 10% in early1990s.
10

Consider a small developing economy, where labor is an important factor of produc-
tion and is measured in e�ciency units. All individuals at birth are endowed with a
unit of e�ciency. They live for two periods, youth and adulthood. There is an educa-
tion program which if opted into during youth, increases the individual’s e�ciency in
adulthood to h > 1. Furthermore, the heterogeneity among individuals is highlighted
by the di↵erences in their cost of the education program, denoted by c, which has
a cumulative distribution F (c) and density function f(c) defined on R+. Suppose the
domestic economy is perfectly competitive so that workers are paid their marginal prod-
uct, denoted by w. In youth, uneducated workers earn w and educated workers earn
w � c. In adulthood, individuals can choose to work abroad, where the wage rate per
e�ciency unit is w > w and the income premium is I > 0. In adulthood, uneducated
workers can either earn w + I if they migrate or w if they don’t. Likewise, educated
workers can earn wh + I if they migrate and wh if they don’t migrate. Individuals
incur a fixed cost in adulthood if they attempt to emigrate, denoted by M . Let the
probability of migration, denoted by p, be the same for both educated and uneducated
workers. Suppose (w+ I �w) � M
p
, which implies that all individuals would choose to
emigrate.14
If individuals are risk neutral so that they choose their education to maximize life-
time income, then the condition for investing in education becomes:
w � c + (1� p) wh + p (wh+ I) �M > w + (1� p) w + p (w + I) �M
14The condition for all educated workers to choose to migrate is wh+I�wh � M
p
and for uneducated
worker, it is w + I � w � M
p
. These conditions imply that an increase in income due to migrationshould be greater or equal to the ratio of the cost and probability of migration. According to the UKDefense Committee, the annual salary of a British Gurkha soldier in 1989 was 100 times the averageincome in Nepal. Furthermore, the financial cost of applying for the British Gurkha is minimal as thereis no application fee and the recruiters visit most Gurkha villages every year during the first stage ofselection process. Moreover, the empirical estimate is interpreted as the average treatment e↵ect onall age eligible Gurkha men, regardless of their future intention of applying to the British Gurkha.
11
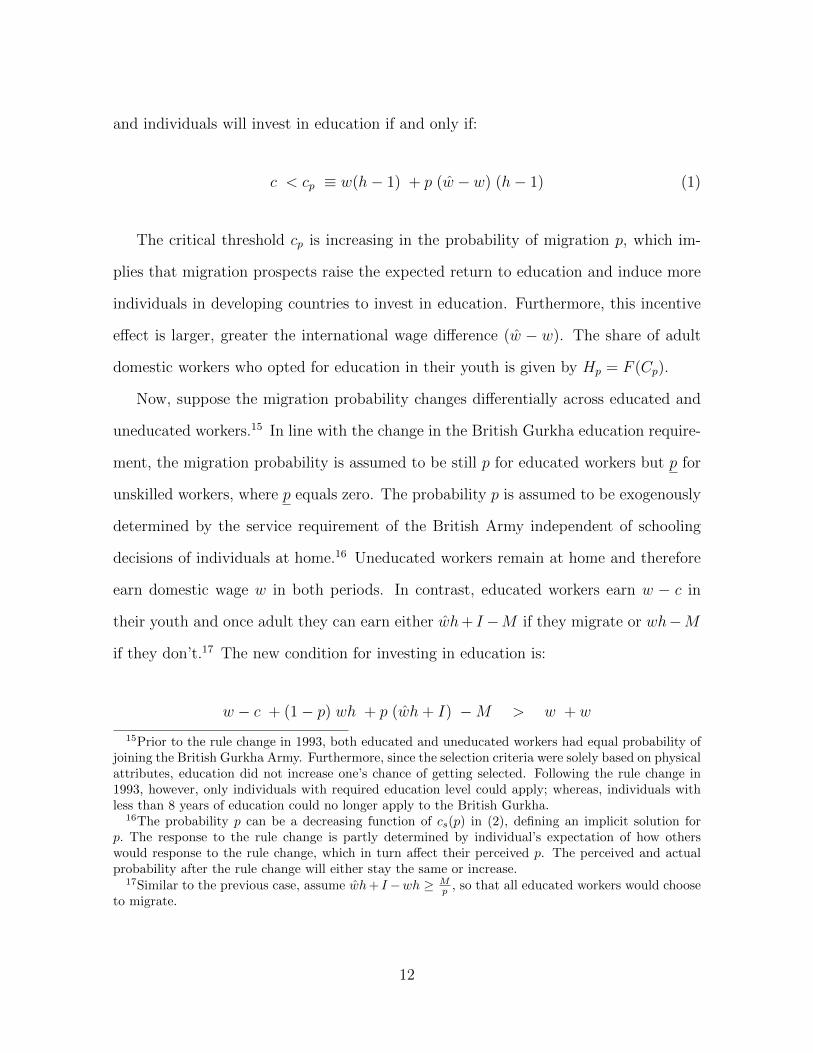
and individuals will invest in education if and only if:
c < cp
⌘ w(h� 1) + p (w � w) (h� 1) (1)
The critical threshold cp
is increasing in the probability of migration p, which im-
plies that migration prospects raise the expected return to education and induce more
individuals in developing countries to invest in education. Furthermore, this incentive
e↵ect is larger, greater the international wage di↵erence (w � w). The share of adult
domestic workers who opted for education in their youth is given by Hp
= F (Cp
).
Now, suppose the migration probability changes di↵erentially across educated and
uneducated workers.15 In line with the change in the British Gurkha education require-
ment, the migration probability is assumed to be still p for educated workers but p for
unskilled workers, where p equals zero. The probability p is assumed to be exogenously
determined by the service requirement of the British Army independent of schooling
decisions of individuals at home.16 Uneducated workers remain at home and therefore
earn domestic wage w in both periods. In contrast, educated workers earn w � c in
their youth and once adult they can earn either wh+ I �M if they migrate or wh�M
if they don’t.17 The new condition for investing in education is:
w � c + (1� p) wh + p (wh+ I) �M > w + w
15Prior to the rule change in 1993, both educated and uneducated workers had equal probability ofjoining the British Gurkha Army. Furthermore, since the selection criteria were solely based on physicalattributes, education did not increase one’s chance of getting selected. Following the rule change in1993, however, only individuals with required education level could apply; whereas, individuals withless than 8 years of education could no longer apply to the British Gurkha.
16The probability p can be a decreasing function of cs
(p) in (2), defining an implicit solution forp. The response to the rule change is partly determined by individual’s expectation of how otherswould response to the rule change, which in turn a↵ect their perceived p. The perceived and actualprobability after the rule change will either stay the same or increase.
17Similar to the previous case, assume wh+ I �wh � M
p
, so that all educated workers would chooseto migrate.
12

and individuals will opt for education if and only if:
c < cs
⌘ w(h� 1) + p (w � w) h + p I �M (2)
The new critical threshold cs
is increasing in skilled emigration probability p, the
di↵erence in wage (w � w), and the foreign income premium I. If I � M
p
, it implies
that cs
> cp
because individuals who could emigrate without education previously, are
now prompted to invest in education in order to earn income premium abroad. To sum
up, emigration prospects raise expected returns to education because of higher wage
rate abroad, and skilled emigration relative to unskilled emigration prospects further
increase expected returns to education because only skilled workers can emigrate and
earn the higher income premium.
After pF (Cs
) fraction of workers migrate abroad in their adulthood, the share of
educated workers who are unable to emigrate relative to all domestic adult workers is:
Hs
=(1� p) F (C
s
)
1 � pF (Cs
)
and Hs
> Hp
if and only if:
p < ep ⌘ F (Cs
) � F (Cp
)
F (Cs
) (1� F (Cp
))(3)
ep < 1 denotes the critical threshold probability of emigration for which the incentive
e↵ect of brain gain exceeds the negative e↵ect of brain drain. Given an extremely low
likelihood of getting selected into the British Gurkha Army, the probability of skilled
emigration through the Gurkha recruitment is likely to be below ep, suggesting that the
rule change would create a net gain in human capital.
13

4 Identification Strategy
The change in the educational requirement in 1993 compelled new recruits to com-
plete at least 8 years of education in order to be eligible for the British Gurkha and,
thereby, increased their skilled emigration prospect relative to unskilled emigration.
The theoretical analysis above suggests that this rule change would increase expected
returns to education and induce individuals to invest in human capital. Furthermore,
because the rule change was exogenous to the socio-economic characteristics of Nepal,
the empirical strategy of comparing the education outcome of individuals who were
a↵ected to those who were not a↵ected by the rule change gives an unbiased estimate
of its e↵ect on domestic schooling.
The individuals’ exposure is jointly determined by their sex, ethnicity, and age.
First, the British Gurkha, in contrast to the other regiments of the British Army, is
exclusively made up of men; therefore, women were not a↵ected. Second, because re-
cruits must be between 1712 and 21 years old, men who were 22 or older in 1993 were
not a↵ected by the rule change.18 Third, considering most British Gurkha soldiers since
1857 have been Gurkha ethnic men, non-Gurkha men were also not a↵ected. Hence, the
e↵ect of rule change on age eligible Gurkha ethnic men is identified via di↵erence-in-
di↵erence estimation, comparing male education between eligible and ineligible cohorts,
within Gurkha and non-Gurkha ethnic groups. The di↵erence in education between the
two cohorts in the Gurkha ethnic group could be correlated with the age-varying un-
observed variables. Therefore, subtracting from this the cohort di↵erence in education
for non-Gurkha ethnic men would net out all age-varying characteristics as well as age-
invariant ethnic characteristics that could directly a↵ect education. The identification
assumption is that in absence of this rule change in 1993, the evolution of education
18As mentioned earlier, cohorts 22 and older are referred to as the “ineligible” cohort and cohorts 21and younger are referred to as the “eligible” cohort.
14
outcomes of men between the two cohorts would not have systematically di↵ered across
Gurkha and non-Gurkha ethnic groups. Furthermore, the di↵erence-in-di↵erence esti-
mate of female education between the two ethnic groups and cohorts serves as a false
experiment to test this identification assumption.
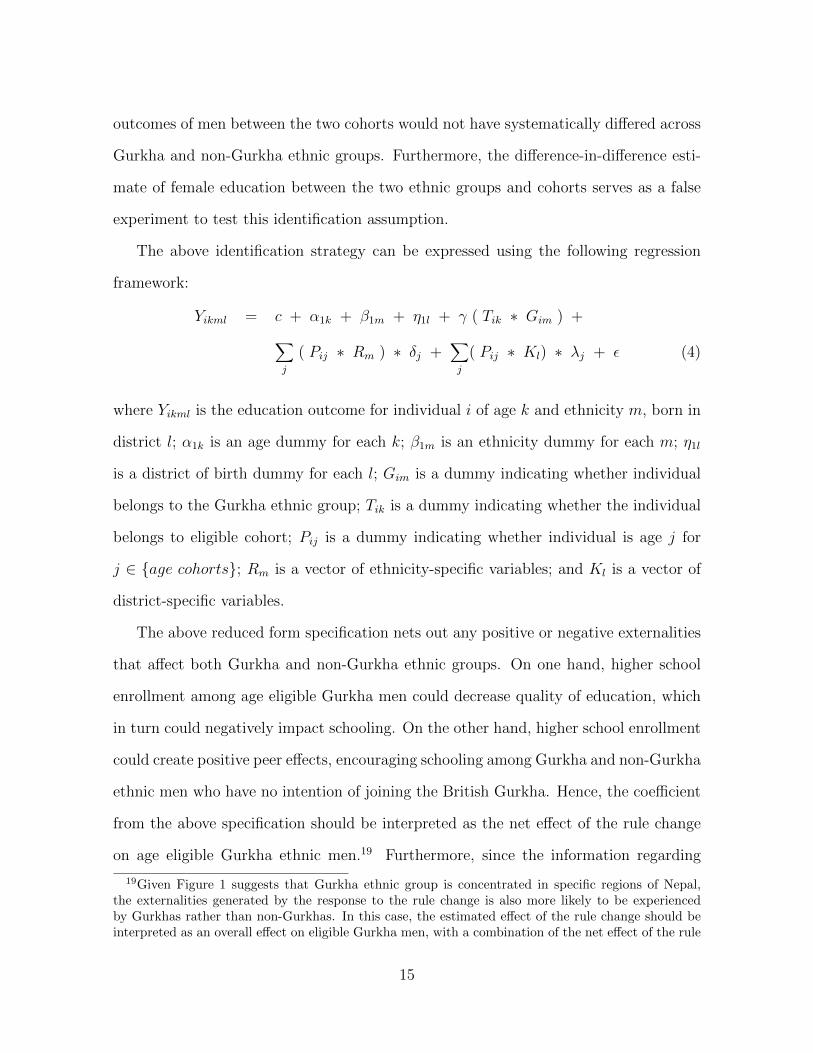
The above identification strategy can be expressed using the following regression
framework:
Yikml
= c + ↵1k + �1m + ⌘1l + � ( Tik
⇤ Gim
) +
X
j
( Pij
⇤ Rm
) ⇤ �j
+X
j
( Pij
⇤ Kl
) ⇤ �j
+ ✏ (4)
where Yikml
is the education outcome for individual i of age k and ethnicity m, born in
district l; ↵1k is an age dummy for each k; �1m is an ethnicity dummy for each m; ⌘1l
is a district of birth dummy for each l; Gim
is a dummy indicating whether individual
belongs to the Gurkha ethnic group; Tik
is a dummy indicating whether the individual
belongs to eligible cohort; Pij
is a dummy indicating whether individual is age j for
j 2 {age cohorts}; Rm
is a vector of ethnicity-specific variables; and Kl
is a vector of
district-specific variables.
The above reduced form specification nets out any positive or negative externalities
that a↵ect both Gurkha and non-Gurkha ethnic groups. On one hand, higher school
enrollment among age eligible Gurkha men could decrease quality of education, which
in turn could negatively impact schooling. On the other hand, higher school enrollment
could create positive peer e↵ects, encouraging schooling among Gurkha and non-Gurkha
ethnic men who have no intention of joining the British Gurkha. Hence, the coe�cient
from the above specification should be interpreted as the net e↵ect of the rule change
on age eligible Gurkha ethnic men.19 Furthermore, since the information regarding
19Given Figure 1 suggests that Gurkha ethnic group is concentrated in specific regions of Nepal,the externalities generated by the response to the rule change is also more likely to be experiencedby Gurkhas rather than non-Gurkhas. In this case, the estimated e↵ect of the rule change should beinterpreted as an overall e↵ect on eligible Gurkha men, with a combination of the net e↵ect of the rule
15

individual’s decision to apply for the British Gurkha are not available, the coe�cient is
also the average treatment e↵ect from the rule change on all age eligible Gurkha men,
regardless of their future intention of applying for the British Gurkha.
The identification strategy can also be generalized to examine the impact of the rule
change for each birth-year cohort in the following regression framework:
Yiklm
= c + ↵1k + �1m + ⌘1l +X
x
( Pix
⇤ Gim
) ⇤ �x
+
X
j
( Pij
⇤ Rm
) ⇤ �j
+X
j
( Pij
⇤ Kl
) ⇤ �j
+ ✏ (5)
Each �x
can be interpreted as the e↵ect of the rule change on Gurkha men of age
x. Since men who were 22 and older were not a↵ected, the coe�cients �x
should be 0
for x � 22. Additionally, the coe�cients �x
should increase as x decreases for x < 22.
Younger age eligible Gurkha men were more likely to be enrolled in school at the time
of the rule change and had more time to complete 8th grade education, putting them
in a better position to respond to the rule change compared to older age eligible men.
The data required for the above identification strategy are obtained from 2001 Nepal
Census for individuals aged 6 to 44 in 1993. It also includes information for individuals
who were living abroad in 2001, abating the concern for potential bias due to selec-
tive attrition.20 The census data are supplemented with Nepal Living Standard Survey
(NLSS) from 1996, which is a household sample survey with greater detail. Table 1
presents summary statistics for the 1,389,705 individuals from the 2001 Census and the
3,373 households from the 1996 NLSS. The averages for some socio-economic charac-
teristics are provided for the entire sample as well as separately for the Gurkha and
non-Gurkha ethnic groups. The Gurkha ethnic group comprises of 16 percent of the
change and net externality among Gurkhas generated by the rule change.20If the entire household moved abroad between 1993 and 2001, then the information on those
individuals are not available. However, the propensity for the entire household to move abroad isextremely low in Nepal.
16

samples in both surveys. Panel A shows that the average level of education for the
Gurkha ethnic group is 3.28, which is slightly lower than the non-Gurkha average of
4.24. Similarly, 18.2% of Gurkha individuals were born in urban districts compared to
34.1% of non-Gurkhas. Panel B suggests that around the time of the rule change, non-
Gurkha households had better access to school facilities than Gurkha households and
46.9% of non-Gurkha households were living in poverty compared to 48.5% of Gurkha
households. Figure 1 shows the map of Nepal with the distribution of Gurkha ethnic
group across 75 regional districts. It suggests that most Gurkha households live in
the northern central region and north east corner of Nepal and predictably, the three
British Gurkha recruitment centers are also located within these regions.
5 Results
The identification strategy can be illustrated with a simple di↵erence-in-di↵erence
table between the eligible and ineligible cohorts in the Gurkha and non-Gurkha ethnic
groups. Table 2 compares educational attainment of Gurkha and non-Gurkha men
who were not a↵ected by the rule change (age 22 - 28) to those who were a↵ected,
either cohort aged 6 to 12 or cohort aged 13 to 21. I use eligible cohort aged 6 to 12
as the preferred cohort of analysis because this younger eligible cohort is most likely
to be enrolled in primary school in 1993 and also have enough time to change their
education in line with the new rule by the time they apply to the British Gurkha.
On the contrary, the ability of older eligible men aged 13 to 21 to respond to the rule
change is determined by the years of education that they have had completed in 1993.
For example, a Gurkha men of age 20 would only be able to successfully respond to the
rule change, if he had at least 7 years of education in 1993. Given the data on their
education in 1993 are not available, the older eligible cohort includes Gurkha men some
17

of whom were a↵ected by the rule change and others who were not.
In both ethnic groups, average education increased over time; but it increased more
in the Gurkha ethnic group. The simple di↵erence-in-di↵erence estimation shows that
Gurkha men of younger eligible cohort (aged 6-12) completed an average of 1.2 more
years of education. This is significantly di↵erence from zero at the 1% level. Panel B
shows that Gurkha men of older eligible cohort (aged 13-21) also raised their education
by 0.28 years, which is less compared to younger eligible cohort but also expected due to
the reasons discussed earlier. Nevertheless, the estimate is also statistically significant
at the 1% level. The two estimates are large in magnitude especially for younger eligible
cohort with an increase in education of 32% over the ineligible cohort. The large impact
of the rule change indicates that the British Gurkha constitutes an attractive foreign
labor market opportunity for Gurkha men. Furthermore, it highlights the role of skilled
emigration prospects on increasing returns to education among individuals who might
otherwise have limited opportunity to benefit from education in the domestic labor
market. This is especially true for Gurkha recruitment as Caplan (1995) notes that
most of the potential recruits come from rural villages of Nepal and if not for the
British Gurkha Army their best alternative source of income is farming.
The above results rely on the assumption that in absence of the rule change, the
di↵erence of educational outcomes between the eligible and ineligible cohorts would not
have systematically di↵ered across Gurkha and non-Gurkha ethnic groups. Table 3
presents a series of control experiments that compare educational attainment between
cohorts and ethnic groups that were not a↵ected by the rule change and therefore,
in contrast to the results in Table 2, should produce di↵erence-in-di↵erence estimates
of zero. Panel A compares education of ineligible cohort aged 22 to 28 with another
ineligible cohort aged 29 to 35 across Gurkha and non-Gurkha men. The di↵erence-in-
di↵erence estimate is 0.28 and not statistically di↵erent from zero at the conventional
18
levels. The control experiment in panel B considers cohort aged 22 to 28 and cohort aged
38 to 44, so that the age di↵erence between the two ineligible cohorts is consistent with
the experiment in panel A of Table 2, in which the age di↵erence between the younger
eligible cohort and ineligible cohort is 9 years. The di↵erence-in-di↵erence is -0.05 and
not statistically di↵erent from zero. Lastly, panel C compares education outcome for
females aged 6 to 12 with 22 to 28, in Gurkha and non-Gurkha ethnic groups. The
di↵erence-in-di↵erence estimate of the e↵ect of the rule change on Gurkha women of
younger eligible cohort is not statistically di↵erent from zero, which is expected given
that women are not eligible for the British Gurkha. These three results, or moreover
the lack of significant results, support the validity of the identification assumption and
suggest that the increase in education for age eligible Gurkha men in Table 2 is likely
caused by the change in the educational requirement for the British Gurkha recruitment.
Tables 4 and 5 present the di↵erence-in-di↵erence analysis by estimating coe�cient
� in equation (4). The specification in column 1 controls for age dummies and ethnicity
dummies and the specification in column 2 additionally controls for district of birth
dummies. Figure 1 shows that Gurkha ethnic groups are concentrated in the northern
central region and north east corner of Nepal. If time-varying regional characteristics
are correlated with education, it could bias the above estimates. I control for di↵er-
ential evolution of geographic regions in columns 3, 4, and 5 by including interactions
of age dummies and district of birth dummies, for all ages and districts. The specifi-
cation in columns 4 and 5 also include interactions of age dummies and district-level
characteristics– total number of primary and secondary teachers in 1994. Moreover,
the specification in column 5 controls for additional time-varying ethnic characteristic
by including the interaction of age dummies and ethnicity-level variable measuring the
travel time to school, obtained from 1996 NLSS. The errors in all specifications are
clustered at the ethnicity level.
19

The estimates in Table 4, column 1 suggest that an increase in educational re-
quirement for the British Gurkha raised the education among younger eligible cohort
by 1.19 years and older eligible cohort by 0.42 years, and both estimates are statisti-
cally significant at the 1% level. More importantly, controlling for various time-varying
regional and ethnic characteristics do not change the magnitude and the statistical sig-
nificance of the estimates for both eligible cohorts, which makes it unlikely that the
results are driven by time-varying characteristics that are correlated with education.
The estimates in column 5, which includes all the controls mentioned earlier, suggest
that Gurkha men from younger eligible cohort raised their education by 1.11 years and
older eligible cohort by 0.39 years. In contrast, the estimates in the three control exper-
iments presented in Table 5, are not statistically di↵erent from zero in all specifications,
thereby strengthening the validity of the main results.
Table 6 shows the e↵ect of the rule change for each eligible birth-year cohort by
estimating �x
s in equation (5) for 6 x 21. The comparison group consists of
ineligible cohort aged 22 to 28. In all specifications, the estimated e↵ect is statistically
significant at the 5% levels for Gurkha men 15 years or younger. The results in column
5 suggest that the rule change raised education for Gurkha men aged 15 by 0.69 years,
aged 12 by 0.95 years, and aged 6 by 1.38 years. Furthermore, in line with the natural
experiment, the e↵ect of the rule change increases with younger age due to the reasons
discussed in the earlier section. If the results are driven by the response to the rule
change, the estimated e↵ects would decrease with age for Gurkha men of eligible cohort
and be zero for all ineligible birth-year cohorts. I test this hypothesis by estimating �x
s
in equation (5) for 6 x 35. The control group comprises of men aged 36 and 37.
The estimates of �x
s are plotted in Figure 2. �x
s fluctuate around zero and statistically
insignificant for all x � 22 and increase as age decreases for x 21, providing further
support for the internal validity of the natural experiment. Moreover, I estimate �x
s
20

for females and plot it in Figure 3. In contrast to Figure 2, the estimates of �s
s are
statistically insignificant for all eligible and ineligible birth-year cohorts.
The rule change induced eligible Gurkha men who had no formal education at
the time of the rule change, to enroll in school for the first time. Table 7 presents
the e↵ect at the extensive margin, by estimating the coe�cient � in equation (4) for
younger eligible cohort, where the dependent variable is a dummy indicating years
of education completed greater than zero. The results in column 5 suggest that the
proportion of young eligible Gurkha men with at least 1 year of education increased by
10 percentage points. Given 51% of age ineligible Gurkha men have no formal education,
the rule change induced 19.5 percent of young eligible Gurkha men who would not have
received any formal education in the absence of the rule change, to enroll in school.
In comparison, Schultz (2004) estimates that the Mexican Progresa Program induced
10 percent of individuals who had no prior education to enroll in school by reducing
educational cost by as much as 75%.21
Individuals who were induced to enroll in school by the rule change and who had
already enrolled prior to the rule change, were further promoted to raise their education
because the new rule required 8 years of education. I estimate the impact at di↵erent
education levels by estimating the di↵erence in di↵erences in the cumulative distribution
function of education between young eligible and ineligible cohorts across Gurkha and
non-Gurkha men who have at least one year of education. Figure 4 depicts the estimates
of �ss from equation (4), with a dummy dependent variable indicating the level of
education completed equal to or greater than s, for each s = 2 to 15.22 Among Gurkha
men of young eligible cohort with at least one year of education, the share of those
21These two results might not be directly comparable as PROGRESA started from higher enrollmentbase and targeted poorest students. Because of these reasons, increasing schooling might have beenharder to achieve in the case of PROGRESA.
22The error terms in these 14 seemingly unrelated regression equations (SURE) are correlated.In Figure 4, the 95 percent confidence intervals for each �ss are adjusted for cross-equation errorcorrelation.
21

with 5 or more years (primary education) increased by 3 percentage points, 8 or more
years (the requirement cuto↵) increased by 6 percentage points, and 13 or more years
(tertiary education) increased by 9 percentage points.
The large impact at upper end of the education distribution is particularly signif-
icant, given Jensen (2010) points out that in developing countries a combination of
costs, low family income, and credit constraints provides a relatively greater hindrance
to secondary schooling compared to primary education as it requires a longer term and
more costly investment. For example, while 67% of Nepali boys in 1996 were enrolled in
primary school, the net enrollment rate in lower secondary level (6-8 years) was merely
23% (1996 NLSS). Additionally, the positive impact on education above 8 years could
be due to the further increase in the British Gurkha educational requirement from 8 to
10 years in 1997, or because higher education increased the likelihood of success with
the introduction of English and mathematics exams in the selection process, or be-
cause eligible Gurkha men who completed 8 years of education to comply with the new
rule continued into higher education. Angrist and Imbens (1995) find similar positive
spillover e↵ects in the United States, where the compulsory attendance laws induced a
fraction of the sample to complete some college as a consequence of constraining them
to complete high school.
In developing countries, socio-economic factors such as access to schools, costs, credit
constraints, and family income, limit individuals from attending school even when they
want to. I examine the e↵ect of these factors on individuals’ response to the rule change,
by separately estimating equation (4) across di↵erent population characteristics. The
results in columns 2 and 3 of Table 8 indicate that the e↵ect of the rule change did not
vary across districts with and without easy access to schooling. However, the di↵erence
in average travel time to school between the bottom and top quantile districts is only
0.3 hours, which reflects the emphasis put by the government on improving access to
22

school in remote areas of Nepal. The results in columns 4 and 5 indicate that the
impact of the rule change was smaller for individuals living in households that are
involved in agricultural production. According to Nepal Living Standard Survey from
2004, more than 10% of school-age children who were not enrolled in school indicated
labor constraint in household work as the main cause of their absenteeism. Furthermore,
more than 20% of the school absenteeism was caused by high financial cost of education.
In oder to examine the role of poverty and credit constraints on schooling, columns
6 and 7 separately estimate the e↵ect of the rule change across household income,
using ownership of television set as a proxy for family wealth. In households that own
a television set, Gurkha men of young eligible cohort raised their education by 1.28
years; whereas, their counterparts living in the household without a television set only
raised their education by 0.76 years. The F-test suggests that estimates are statistically
di↵erent at the 10% level. While these results should be interpreted with caution
due to omitted variable bias, the stratified results, nevertheless, could be potentially
informative given they document the role of poverty and credit constraints in limiting
schooling in developing countries.
The majority of eligible Gurkha men would not join the British Gurkha Army
because only 300 individuals are recruited every year. However, higher education could
increase emigration rates of eligible Gurkha men through other channels besides the
British Gurkha recruitment. I estimate coe�cient � in equation (4), with a dummy
dependent variable indicating whether the individual was living abroad in 2001. Given
everyone in the older eligible cohort would have had the chance to apply for the British
Gurkha Army or pursue other emigration opportunities by 2001, I focus on this cohort
to examine whether the rule change led to greater emigration among eligible Gurkha
men. The estimates in Table 9, panel B suggest that there was no increase in migration
rates among older eligible Gurkha men. The coe�cients in all the specifications are
23
zero and not statistically significant even at the 10% level. On the other hand, Table
10 estimates the e↵ect of the rule change on education of eligible Gurkha men who
had not emigrated by 2001. I estimate coe�cient � in equation (4) by only including
individuals who were living in Nepal in 2001. The results in column 5 suggest that
the rule change raised education of young eligible Gurkha men who had not emigrated
by 1.14 years and older eligible Gurkha men of similar nature by 0.40 years. Both the
estimates are statistically significant at the 1% level. Therefore, the results in Tables
9 and 10 together imply that the increase in educational requirement for the British
Gurkha Army led to a net increase in the human capital stock of eligible Gurkha men.
6 Robustness
In the above empirical estimation, the non-Gurkha ethnic group may not be a valid
comparison for the Gurkha ethnic group because ineligible Gurkha cohorts have sig-
nificantly lower level of education than their non-Gurkha counterparts. To refute the
possibility that the results could be driven by age-varying unobserved ethnic character-
istics, I use a data-driven procedure developed by Abadie and Gardeazabal (2003) to
construct a di↵erent comparison group. The new counterfactual– the synthetic Gurkha
ethnic group– is the convex combination of all non-Gurkha ethnicities that most closely
resemble the Gurkha ethnic group based on the education of age ineligible men. For
each non-Gurkha ethnicity, the average years of education is calculated for each birth
cohort and then ethnicity-weights are assigned to minimize the di↵erence between ed-
ucation of Gurkha and synthetic Gurkha ethnic groups across ineligible cohorts aged
22 to 44.23 Table 12 displays the weights of each non-Gurkha ethnicity in the synthetic
23The ethnicity-weights are calculated from the minimization problem: Choose W to minimize(X
G
�XN
W )(XG
�XN
W ), where W = {(w1, .....wJ
)0 subject to w1+ .....+wJ
= 1, wJ
� 0}. XG
is a(k X 1) vector of average years of education at each age ineligible birth cohorts for the Gurkha ethnicgroup, where 21 k 44. X
N
is a (k X J) matrix with average years of education for k ineligible
24

Gurkha ethnic group.
Figure 5 depicts the years of education completed for Gurkha and synthetic Gurkha
ethnic groups across birth cohorts aged 6 to 44. Education of the synthetic Gurkha
ethnic group closely matches that of the Gurkha ethnic group for ineligible cohorts
aged 22 to 44, suggesting that the eligible cohort of synthetic Gurkha ethnic group
provide a close approximation to the eligible cohort of Gurkha ethnic group in the
absence of the rule change. The di↵erence in education between Gurkha and synthetic
Gurkha ethnic groups for cohorts aged 6 to 21 could be interpreted as the e↵ect of the
increase in the British Gurkha education requirement. Figure 6 shows that education
between Gurkha and synthetic Gurkha ethnic groups diverges considerably for eligible
cohorts and the gap, depicted in Figure 6, becomes larger for younger cohorts, which is
consistent with the results from the di↵erence-in-di↵erence estimation.
The results could have also been obtained entirely by chance. Following Bertrand et
al. (2004), I iteratively apply the synthetic control method to all the non-Gurkha eth-
nicities to examine whether assigning treatment at random produces results of similar
magnitude. In each case, the synthetic control is composed of the weighted combination
of the remaining non-Gurkha ethnicities. Figure 7 displays the results of the placebo
iterations for 10 non-Gurkha ethnicities. The faded lines show the gap in education
between each non-Gurkha ethnicity and its corresponding synthetic version. The gap
for Gurkha ethnic group, depicted by the dark line, is largest compared to any non-
Gurkha ethnicities. More importantly, the education gap between Gurkha and synthetic
Gurkha for eligible cohort is four times larger than the similar gap for ineligible cohort.
Figure 8 shows that this is largest among all ethnicities. Given there are 11 di↵erent
ethnicities, including Gurkha ethnic group, and thereby 11 di↵erent results, the proba-
bility of obtaining the largest e↵ect for Gurkha ethnic group entirely by chance is 1/11
birth cohorts and J non-Gurkha ethnicities.
25

= 0.09. Therefore, it is unlikely that the estimated e↵ect of the rule change on age
eligible Gurkha men could have occurred entirely by chance.
7 Conclusion
The change in the educational requirement for the British Gurkha Army in 1993 led
to an exogenous and di↵erential increase in skilled versus unskilled emigration prospects
for Gurkha men of eligible cohort living in Nepal. Using a set of di↵erence-in-di↵erence
and synthetic control strategies, I find that they responded to the rule change by raising
their human capital investment. I also find that the rule change increased education
for eligible Gurkha men who had not joined the British Gurkha or emigrated else-
where by 2001. These two findings validate the theoretical predictions of the brain gain
models: first, individuals’ human capital investments are endogenous to their migra-
tion prospects; and second, when enough skilled individuals eventually decide not to
emigrate, it leads to a net increase in human capital stock at home.
The underlying mechanism of my unique natural experiment is not di↵erent from
economic factors influencing individuals’ emigration and human capital decisions in
many developing countries. Despite an extremely low chance of getting selected into
the British Gurkha Army, Gurkha men were induced to invest in education following
the rule change because of significant increase in income if they succeeded in joining
the British Army. Docquier et al. (2007) point out that these two factors, widening
international wage gaps and introduction of skilled-biased immigration policies, are
the main reasons for a rapid growth of skilled emigration and for inducing human
capital investment among potential emigrants in developing countries. Nevertheless,
they find that in 2000 the skilled emigration rate in developing countries was only
7%. While the knowledge of the British Gurkha rule change was widespread, similar
26

information about other foreign labor markets may not be as readily available. Jensen
(2010) show that the lack of information regarding returns to education could lead
to underinvestment in human capital. Therefore, it might require an e�cient flow of
information possibly through an active government intervention for individuals at home
to know their educational returns abroad, and consequently, to increase their human
capital investment.
An important implication of my findings is that low-income countries do not have
to wait for improvements in their local productivity to stimulate human capital invest-
ment because high wages in developed countries can motivate individuals in developing
countries to invest in education. While there is little doubt that low levels of schooling
deter economic growth, Schultz (1975) show that returns to schooling are low in a stag-
nant economy, hinting at the possibility of a poverty trap. Oyelere (2009) argue that
poor institutions and political instability, characteristics that are common across many
developing countries, lead to low returns to education. Developing countries spend
large sums of money on increasing human capital investment in order to overcome low
returns and push themselves out of the poverty trap, if it exists. For example, Mexico’s
Progresa Program which provides cash incentive to increase school attendance, costs
almost 0.2 percent of its GDP. Since skilled emigration prospects raise educational re-
turns in developing countries, it could either replace expensive policy interventions like
Progresa or complement these programs, making them more attractive to their potential
recipients.
Interesting future research includes investigating the welfare impact on eligible
Gurkha men who who could not join the British Gurkha Army. Increase in their ed-
ucation could raise their domestic earnings, improve their children’s health outcomes,
and promote long-term economic growth in their regions. Similarly, the rule change also
created numerous positive and negative externalities on other populations that were not
27

directly a↵ected by it. First, an increase in education by Gurkha men could directly af-
fect their peers’ education decisions. On one hand, it decreases the quality of education
by crowding out classrooms; whereas, on the other hand, greater class participation
could lead to a positive learning experience for other classmates. This provides a useful
experiment to investigate peer e↵ects, which is an integral part of education research.
Second, raising Gurkha men’s education could also a↵ect the education of their siblings,
mainly female siblings who were not a↵ected by the rule change. Shrestha (2011) finds
a net decrease in Gurkha females’ education by 7% if they had a male sibling of eligi-
ble cohort living in the same household. Given key socio-economic decisions including
children’s education are taken at household-level, further investigation into the specific
mechanisms governing this intra-household tradeo↵s is important. It would allow for
better evaluation of existing household interventions and development of more e↵ective
policies in the future.
28
References
Abadie, Alberto and Javier Gardeazabal, “The Economic Costs of Conflict: A
Case Study for the Basque Country,”The American Economic Review, 2003, 93 (1),
113–132.
Angrist, Joshua D. and Guido W. Imbens, “Two-Stage Least Squares Estimation
of Average Causal E↵ects in Models with Variable Treatment Intensity,” Journal of
the American Statistical Association, June 1995, 90 (430), 431–442.
Banskota, Purushottam, The Gurkha Connection: A History of the Gurkha Recruit-
ment in the British Indian Army, Nirala Publications, 1994.
Beine, Michel, Frederic Docquier, and Hillel Rapoport, “Brain Drain and Hu-
man Capital Formation in Developing Countries : Winners and Losers,” 2006. Uni-
versity catholique de Louvain, Departement des Sciences Economiques.
Bertrand, Marianne, Esther Duflo, and Sendhil Mullainathan, “How Much
Should We Trust Di↵erences-in-Di↵erences Estimates?,” Quarterly Journal of Eco-
nomics, 2004, 119 (1), 249–275.
Bhagwati, J.N. and K. Hamada, “The Brain Drain, International Integration of
Makets for Professionals and Unemployment,” Journal of Development Economics,
1974, 1, 19–42.
Borjas, George, “Self-Selection and the Earnings of Immigrants,”The American Eco-
nomic Review, 1987, 77.
Caplan, Lionel, Warrior Gentlemen: Gurkhas in the Western Imagination, Berghahn
Books, 1995.
Chand, Satish and Michael A. Clemens, “Skilled Emigration and Skill Creation:
A Quasi-Experiment,” 2008.
Docquier, Frederic, Oliver Lohest, and Abdeslam Marfouk, “Brain Drain in
Developing Countries,”World Bank Economic Review, 2007, 21 (2), 193–218.
Duflo, Esther, “School and Labor Market Consequences of School Construction in
Indonesia: Evidence from an Unusal Policy Experiment,” The American Economic
Review, 2001, 91, 795–813.
29
Foster, Andrew D. and Mark R. Rosenzweig, “Technical Change and Human-
Capital Returns and Investments: Evidence from the Green Revolution,”The Amer-
ican Economic Review, Sept 1996, 86 (4), 931–953.
Gibson, John and David McKenzie, “The Economic Consequences of Brain Drain
of the Best and Brightest: Evidence from Five Countries,”Economic Journal, forth-
coming.
Haque, Nadeem U. and Se-Jik Kim, “Human Capital Flight: Impact of Migration
on Income and Growth,” IMF Sta↵ Papers, 1995, 42 (3), 577–607.
Hitchcock, John Thayer, The Magars of Banyan Hill, Holt, Rinehart, and Winston,
1966.
Jensen, Robert, “The (Perceived) Returns to Education and the Demand for School-
ing,”The Quarterly Journal of Economics, 2010, 125 (2), 515–548.
Kansakar, V.B.S., E↵ectiveness of Planned Resettlement Programme in Nepal,
CEDA, 1979.
Kochar, Anjini, “Urban Influences on Rural Schooling in India,” Journal of Develop-
ment Economics, 2004, 74, 113–136.
Marchiori, Luca, I-Ling Shen, and Frederic Docquier, “Brain Drain in Global-
ization: A General Equilibrium Analysis from the Sending Countries’ Perspective,”
IZA Discussion Paper 4207, 2009.
McKenzie, David and Hillel Rapoport, “Can Migration Reduce Educational At-
tainment? Evidence fromMexico,”World Bank Policy Research Working Paper 3952,
2006.
Mincer, Jacob, “Human Capital and Ecnomic Growth,”Economics of Education Re-
view, 1984, 3 (3), 195–205.
Miyagiwa, Kaz, “Scale Economies in Education and the Brain Drain Problem,” In-
ternational Economic Review, August 1991, 32 (3), 743–759.
Mountford, Andrew, “Can a Brain Drain Be Good for Growth in the Source Coun-
try?,” Journal of Development Economics, 1997, 53(2), 287–303.
30

Oyelere, Ruth Uwaifo, “Understanding Low Average returns to Education in Africa:
The Role of Heterogeneity across Education Levels and the Importance of Political
and Economic Reforms,” July 2009.
Rathaur, Kamal Raj Singh, “British Gurkha Recruitment: A Historical Perspec-
tive,”Voice of History, 2001, 16(2), 19–24.
Schultz, T. Paul, “School Subsidies for the Poor: Evaluating the Mexican Progresa
Poverty Program,” Journal of Development Economics, June 2004, 74 (1), 199–250.
Schultz, Theodore W., “The Value of the Ability to Deal with Disequilibria,”Journal
of Economic Literature, September 1975, 13 (3), 827–846.
Shrestha, Nanda R., The Political Economy of Land, Landlessness and Migration in
Nepal, Nirala Series, 2001.
Shrestha, Slesh A., “Sibling Rivalry in Education: Estimation of Intrahousehold
Trade-o↵s in Human Capital Investment,” August 2011.
Stark, Oded, Christian Helmenstein, and Alexia Prskawetz, “A Brain Gain
with a Brain Drain,” Economic Letters, 1997, 55 (2), 227–234.
Yang, Dean, “International Migration, Remittances, and Household Investment: Ev-
idence from Philippine Migrants’ Exchange Rate Shocks,” The Economic Journal,
2008, 118, 591–630.
31

Table 1: Descriptive Statistics
WholeSample
GurkhaNon-
Gurkha
Panel A: Individual Level Means2001 Census of Nepal
Total Sample 1389705 245148 1144557% of sample - 17.6% 82.4%Literacy Rate 55.2% 53.2% 55.6%male 69.5% 66.9% 70.0%female 41.3% 41.0% 41.4%
Level of Education 4.07 3.28 4.24aged 6-12 in 1993 5.41 5.08 5.48
male 6.17 5.74 6.26female 4.64 4.46 4.68aged 13-21 in 1993 4.89 3.96 5.08male 6.38 5.20 6.61female 3.53 2.95 3.66
aged 22-28 in 1993 3.41 2.33 3.62male 5.08 3.64 5.34female 1.82 1.22 1.95
aged 29-37 in 1993 2.49 1.46 2.71male 3.97 2.44 4.28female 1.02 0.55 1.12
aged 38-44 in 1993 1.88 1.03 2.10male 3.10 1.76 3.42female 0.60 0.30 0.67
Percent of Population Born in Urban 31.3% 18.2% 34.1%aged 6-12 34.7% 21.1% 37.8%aged 13-21 32.7% 19.6% 35.4%aged 22-28 30.3% 17.3% 32.9%aged 29-37 27.8% 15.0% 30.5%aged 38-44 25.6% 13.2% 29.0%
Panel B: Household Level Means1996 NLSS
Total Sample 3373 544 2829% of Sample - 16.1% 83.9%Household Size 5.59 5.27 5.65Access to School 0.38 Hrs 0.54 Hrs 0.35 HrsAccess to Paved Road 9.30 Hrs 14.45 Hrs 8.30 HrsPercent of Household in Poverty 33.5% 48.5% 46.9%
32

Table 2: Mean Education by Cohort and Ethnicity
Level of Education CompletedGurkha Non-Gurkha Di↵erence
Panel A: Experiment 1
Male aged 6 to 12 in 19935.74
(0.018)6.26
(0.009)-0.53(0.610)
Male aged 22 to 28 in 19933.64
(0.031)5.34
(0.016)-1.71(0.922)
Di↵erence2.10**(0.181)
0.92**(0.286)
1.18**(0.329)
Panel B: Experiment 2
Male aged 13 to 21 in 19935.20
(0.026)6.61
(0.013)-1.41**(0.029)
Male aged 22 to 28 in 19933.64
(0.031)5.34
(0.016)-1.71**(0.035)
Di↵erence1.56**(0.041)
1.27**(0.020)
0.29**(0.082)
Notes: This table reports the mean education completed as of 2001 for men of di↵erent cohortsand ethnic groups. While Gurkha ethnic men of age 21 and younger were a↵ected by the rulechange, those who were 6 -12 years old were more likely to have been enrolled in school atthe time of the rule change and, thereby, be in a better position to change their education.On the other hand, the ability of older eligible men aged 13 to 21 to respond to the rulechange is determined by the years of education that they have had completed in 1993.Hence, this older eligible cohort includes Gurkha men some of whom were a↵ected bythe rule change and others who were not.The standard errors are reported in parentheses and are adjusted for within-ethnicity corre-lation between individuals.* indicates significance at the 5 percent level** indicates significance at the 1 percent level
33

Table 3: Mean Education by Cohort and Ethnicity (Falsification Tests)
Level of Education CompletedGurkha Non-Gurkha Di↵erence
Panel A: Control Experiment 1
Male aged 22 to 28 in 19933.64
(0.031)5.34
(0.016)-1.71(0.922)
Male aged 29 to 35 in 19932.58
(0.031)4.56
(0.019)-1.98*(0.767)
Di↵erence1.05**(0.163)
0.78**(0.124)
0.28(0.192)
Panel B: Control Experiment 2
Male aged 22 to 28 in 19933.64
(0.031)5.34
(0.016)-1.71(0.922)
Male aged 38 to 44 in 19931.76
(0.030)3.42
(0.021)-1.66**(0.620)
Di↵erence1.88**(0.260)
1.93**(0.271)
-0.05(0.358)
Panel C: Control Experiment 3
Female aged 6 to 12 in 19934.46
(0.019)4.68
(0.010)-0.22(0.823)
Female aged 22 to 28 in 19931.22
(0.019)1.95
(0.012)-0.73(0.507)
Di↵erence3.24**(0.293)
2.73**(0.248)
0.51(0.362)
Notes: This table reports the di↵erence in di↵erences of average education completed as of2001 for three control experiments. Gurkha men who were 22 or older and all Gurkha womenwere not a↵ected by the rule change.The standard errors are reported in parentheses and are adjusted for within-ethnicity corre-lation between individuals.* indicates significance at the 5 percent level** indicates significance at the 1 percent level
34
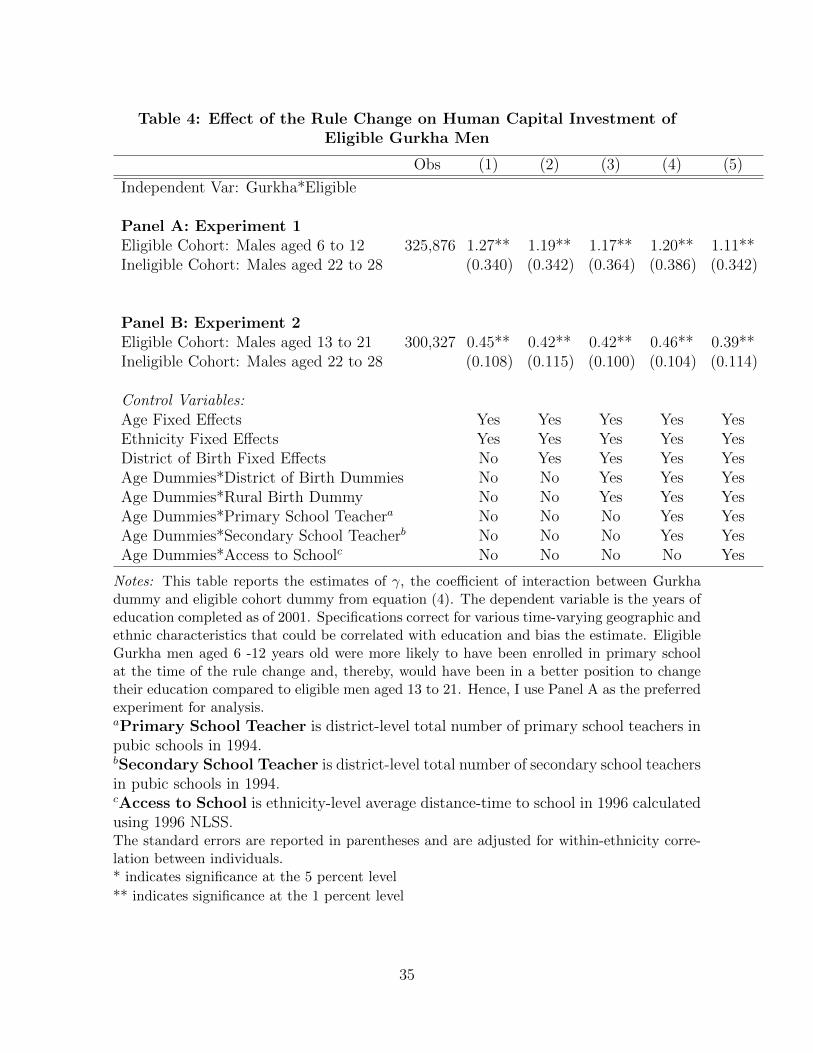
Table 4: E↵ect of the Rule Change on Human Capital Investment ofEligible Gurkha Men
Obs (1) (2) (3) (4) (5)
Independent Var: Gurkha*Eligible
Panel A: Experiment 1Eligible Cohort: Males aged 6 to 12 325,876 1.27** 1.19** 1.17** 1.20** 1.11**Ineligible Cohort: Males aged 22 to 28 (0.340) (0.342) (0.364) (0.386) (0.342)
Panel B: Experiment 2Eligible Cohort: Males aged 13 to 21 300,327 0.45** 0.42** 0.42** 0.46** 0.39**Ineligible Cohort: Males aged 22 to 28 (0.108) (0.115) (0.100) (0.104) (0.114)
Control Variables:Age Fixed E↵ects Yes Yes Yes Yes YesEthnicity Fixed E↵ects Yes Yes Yes Yes YesDistrict of Birth Fixed E↵ects No Yes Yes Yes YesAge Dummies*District of Birth Dummies No No Yes Yes YesAge Dummies*Rural Birth Dummy No No Yes Yes YesAge Dummies*Primary School Teachera No No No Yes YesAge Dummies*Secondary School Teacherb No No No Yes YesAge Dummies*Access to Schoolc No No No No Yes
Notes: This table reports the estimates of �, the coe�cient of interaction between Gurkhadummy and eligible cohort dummy from equation (4). The dependent variable is the years ofeducation completed as of 2001. Specifications correct for various time-varying geographic andethnic characteristics that could be correlated with education and bias the estimate. EligibleGurkha men aged 6 -12 years old were more likely to have been enrolled in primary schoolat the time of the rule change and, thereby, would have been in a better position to changetheir education compared to eligible men aged 13 to 21. Hence, I use Panel A as the preferredexperiment for analysis.aPrimary School Teacher is district-level total number of primary school teachers inpubic schools in 1994.bSecondary School Teacher is district-level total number of secondary school teachersin pubic schools in 1994.cAccess to School is ethnicity-level average distance-time to school in 1996 calculatedusing 1996 NLSS.The standard errors are reported in parentheses and are adjusted for within-ethnicity corre-lation between individuals.* indicates significance at the 5 percent level** indicates significance at the 1 percent level
35

Table 5: E↵ect of the Rule Change on Human Capital Investment ofIneligible Gurkha Men and Eligible Gurkha Women (Falsification Tests)
Obs (1) (2) (3) (4) (5)
Independent Var: Gurkha*Eligible
Panel A: Control Experiment 1Eligible Cohort: Males aged 22 to 28 214,315 0.23 0.23 -0.02 0.03 0.01Ineligible Cohort: Males aged 29 to 35 (0.213) (0.224) (0.186) (0.176) (0.166)
Panel B: Control Experiment 2Eligible Cohort: Males aged 22 to 28 192,046 -0.09 -0.06 -0.48 -0.43 -0.62Ineligible Cohort: Males aged 38 to 44 (0.241) (0.428) (0.261) (0.467) (0.466)
Panel C: Control Experiment 3Eligible Cohort: Females aged 6 to 12 333,055 0.57 0.54 0.12 0.17 -0.09Ineligible Cohort: Females aged 22 to 28 (0.408) (0.407) (0.345) (0.332) (0.351)
Control Variables:Age Fixed E↵ects Yes Yes Yes Yes YesEthnicity Fixed E↵ects Yes Yes Yes Yes YesDistrict of Birth Fixed E↵ects No Yes Yes Yes YesAge Dummies*District of Birth Dummies No No Yes Yes YesAge Dummies*Rural Birth Dummy No No Yes Yes YesAge Dummies*Primary School Teachera No No No Yes YesAge Dummies*Secondary School Teacherb No No No Yes YesAge Dummies*Access to Schoolc No No No No Yes
Notes: This table reports the estimates of �, the coe�cient of interaction between Gurkhadummy and eligible cohort dummy from equation (4). All three experiments estimate thee↵ect on individuals who were not a↵ected by the rule change. Panel A and B estimates thee↵ect on Gurkha men of cohorts, aged 22 to 28. In panel B, the age di↵erence between thetwo cohorts aged 22 to 28 and aged 38 to 44 is the same as in panel A of Table 4. Panel Cestimates the e↵ect on Gurkha women of eligible cohort aged 6 to 12. None of the Gurkhawomen were a↵ected because the recruitment of British Gurkha is limited to men. The lackof significant results in these three control experiments provide support for the validity of theidentification assumption used in Table 4 that the di↵erence in education between the cohortswould have been same across Gurkha and non-Gurkha ethnic groups in the absence of therule change.aPrimary School Teacher is district-level total number of primary school teachers inpubic schools in 1994.bSecondary School Teacher is district-level total number of secondary school teachersin pubic schools in 1994.cAccess to School is ethnicity-level average distance-time to school in 1996 calculatedusing 1996 NLSS.The standard errors are reported in parentheses and are adjusted for within-ethnicity corre-lation between individuals.* indicates significance at the 5 percent level** indicates significance at the 1 percent level
36
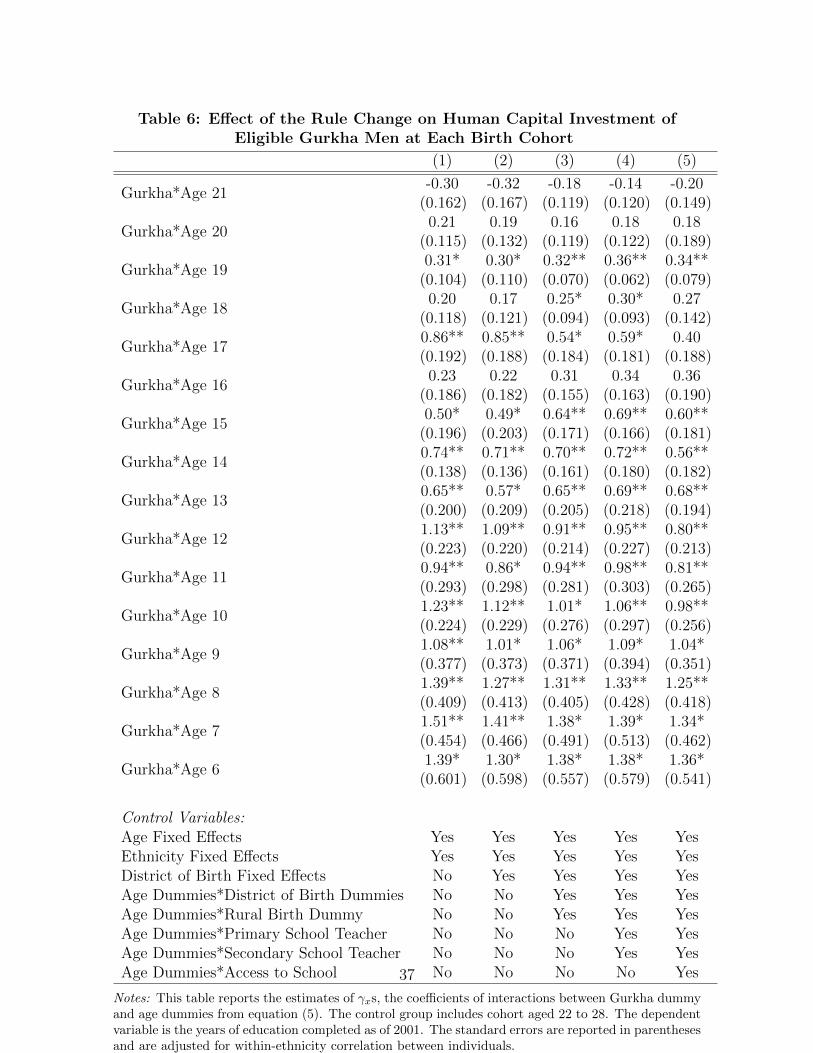
Table 6: E↵ect of the Rule Change on Human Capital Investment ofEligible Gurkha Men at Each Birth Cohort
(1) (2) (3) (4) (5)
Gurkha*Age 21-0.30(0.162)
-0.32(0.167)
-0.18(0.119)
-0.14(0.120)
-0.20(0.149)
Gurkha*Age 200.21
(0.115)0.19
(0.132)0.16
(0.119)0.18
(0.122)0.18
(0.189)
Gurkha*Age 190.31*(0.104)
0.30*(0.110)
0.32**(0.070)
0.36**(0.062)
0.34**(0.079)
Gurkha*Age 180.20
(0.118)0.17
(0.121)0.25*(0.094)
0.30*(0.093)
0.27(0.142)
Gurkha*Age 170.86**(0.192)
0.85**(0.188)
0.54*(0.184)
0.59*(0.181)
0.40(0.188)
Gurkha*Age 160.23
(0.186)0.22
(0.182)0.31
(0.155)0.34
(0.163)0.36
(0.190)
Gurkha*Age 150.50*(0.196)
0.49*(0.203)
0.64**(0.171)
0.69**(0.166)
0.60**(0.181)
Gurkha*Age 140.74**(0.138)
0.71**(0.136)
0.70**(0.161)
0.72**(0.180)
0.56**(0.182)
Gurkha*Age 130.65**(0.200)
0.57*(0.209)
0.65**(0.205)
0.69**(0.218)
0.68**(0.194)
Gurkha*Age 121.13**(0.223)
1.09**(0.220)
0.91**(0.214)
0.95**(0.227)
0.80**(0.213)
Gurkha*Age 110.94**(0.293)
0.86*(0.298)
0.94**(0.281)
0.98**(0.303)
0.81**(0.265)
Gurkha*Age 101.23**(0.224)
1.12**(0.229)
1.01*(0.276)
1.06**(0.297)
0.98**(0.256)
Gurkha*Age 91.08**(0.377)
1.01*(0.373)
1.06*(0.371)
1.09*(0.394)
1.04*(0.351)
Gurkha*Age 81.39**(0.409)
1.27**(0.413)
1.31**(0.405)
1.33**(0.428)
1.25**(0.418)
Gurkha*Age 71.51**(0.454)
1.41**(0.466)
1.38*(0.491)
1.39*(0.513)
1.34*(0.462)
Gurkha*Age 61.39*(0.601)
1.30*(0.598)
1.38*(0.557)
1.38*(0.579)
1.36*(0.541)
Control Variables:Age Fixed E↵ects Yes Yes Yes Yes YesEthnicity Fixed E↵ects Yes Yes Yes Yes YesDistrict of Birth Fixed E↵ects No Yes Yes Yes YesAge Dummies*District of Birth Dummies No No Yes Yes YesAge Dummies*Rural Birth Dummy No No Yes Yes YesAge Dummies*Primary School Teacher No No No Yes YesAge Dummies*Secondary School Teacher No No No Yes YesAge Dummies*Access to School No No No No Yes
Notes: This table reports the estimates of �x
s, the coe�cients of interactions between Gurkha dummyand age dummies from equation (5). The control group includes cohort aged 22 to 28. The dependentvariable is the years of education completed as of 2001. The standard errors are reported in parenthesesand are adjusted for within-ethnicity correlation between individuals.* indicates significance at the 5 percent level
** indicates significance at the 1 percent level
37
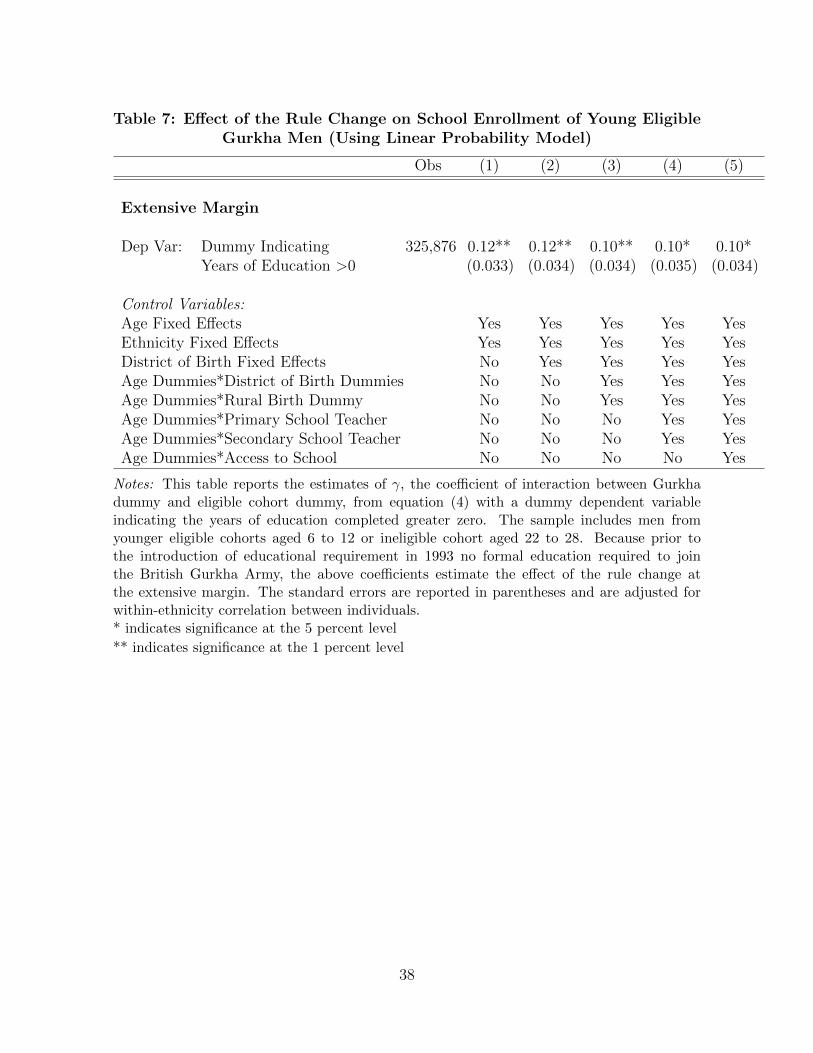
Table 7: E↵ect of the Rule Change on School Enrollment of Young EligibleGurkha Men (Using Linear Probability Model)
Obs (1) (2) (3) (4) (5)
Extensive Margin
Dep Var: Dummy IndicatingYears of Education >0
325,876 0.12**(0.033)
0.12**(0.034)
0.10**(0.034)
0.10*(0.035)
0.10*(0.034)
Control Variables:Age Fixed E↵ects Yes Yes Yes Yes YesEthnicity Fixed E↵ects Yes Yes Yes Yes YesDistrict of Birth Fixed E↵ects No Yes Yes Yes YesAge Dummies*District of Birth Dummies No No Yes Yes YesAge Dummies*Rural Birth Dummy No No Yes Yes YesAge Dummies*Primary School Teacher No No No Yes YesAge Dummies*Secondary School Teacher No No No Yes YesAge Dummies*Access to School No No No No Yes
Notes: This table reports the estimates of �, the coe�cient of interaction between Gurkhadummy and eligible cohort dummy, from equation (4) with a dummy dependent variableindicating the years of education completed greater zero. The sample includes men fromyounger eligible cohorts aged 6 to 12 or ineligible cohort aged 22 to 28. Because prior tothe introduction of educational requirement in 1993 no formal education required to jointhe British Gurkha Army, the above coe�cients estimate the e↵ect of the rule change atthe extensive margin. The standard errors are reported in parentheses and are adjusted forwithin-ethnicity correlation between individuals.* indicates significance at the 5 percent level** indicates significance at the 1 percent level
38
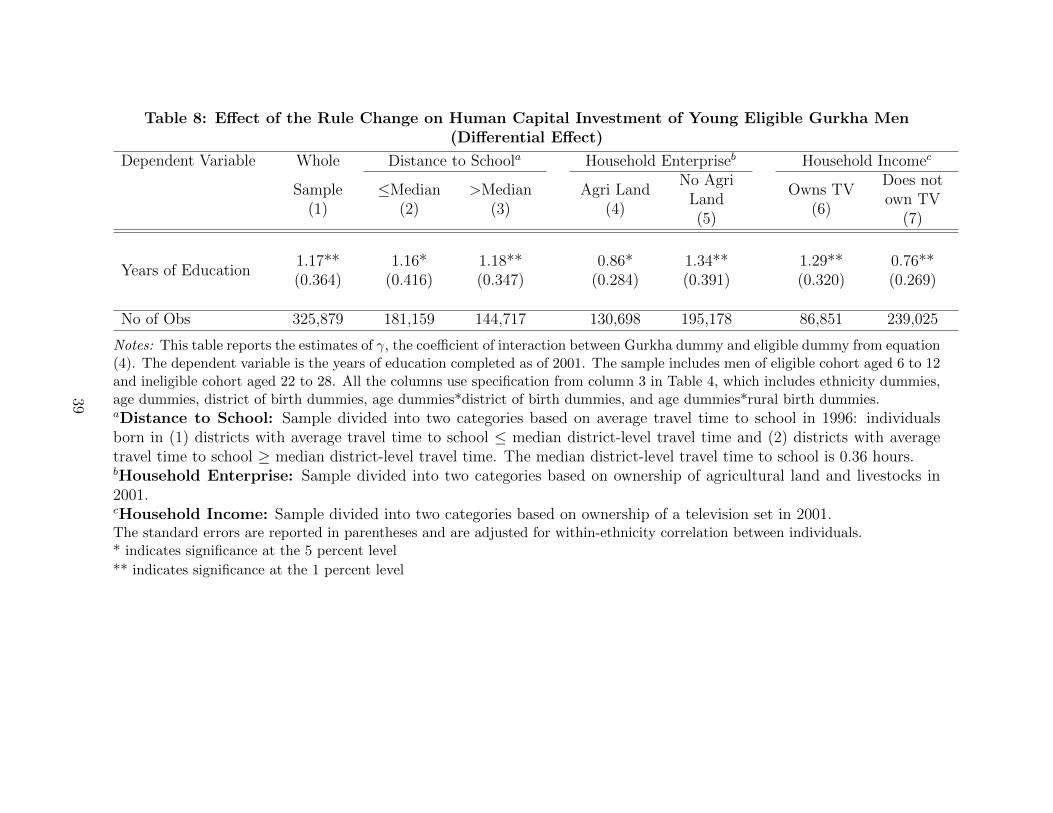
Table 8: E↵ect of the Rule Change on Human Capital Investment of Young Eligible Gurkha Men(Di↵erential E↵ect)
Dependent Variable Whole Distance to Schoola Household Enterpriseb Household Incomec
Sample(1)
Median(2)
>Median(3)
Agri Land(4)
No AgriLand(5)
Owns TV(6)
Does notown TV
(7)
Years of Education1.17**(0.364)
1.16*(0.416)
1.18**(0.347)
0.86*(0.284)
1.34**(0.391)
1.29**(0.320)
0.76**(0.269)
No of Obs 325,879 181,159 144,717 130,698 195,178 86,851 239,025
Notes: This table reports the estimates of �, the coe�cient of interaction between Gurkha dummy and eligible dummy from equation(4). The dependent variable is the years of education completed as of 2001. The sample includes men of eligible cohort aged 6 to 12and ineligible cohort aged 22 to 28. All the columns use specification from column 3 in Table 4, which includes ethnicity dummies,age dummies, district of birth dummies, age dummies*district of birth dummies, and age dummies*rural birth dummies.aDistance to School: Sample divided into two categories based on average travel time to school in 1996: individualsborn in (1) districts with average travel time to school median district-level travel time and (2) districts with averagetravel time to school � median district-level travel time. The median district-level travel time to school is 0.36 hours.bHousehold Enterprise: Sample divided into two categories based on ownership of agricultural land and livestocks in2001.cHousehold Income: Sample divided into two categories based on ownership of a television set in 2001.The standard errors are reported in parentheses and are adjusted for within-ethnicity correlation between individuals.* indicates significance at the 5 percent level** indicates significance at the 1 percent level
39

Table 9: E↵ect of the Rule Change on Migration of Eligible Gurkha Men(Using Linear Probability Model)
Obs (1) (2) (3) (4) (5)
Dependent Var: Dummy IndicatingForeign Residence in 2001
Panel A: Experiment 1Eligible Cohort: Males aged 6 to 12 325,876 -0.01 -0.01 -0.01** -0.01** -0.01**Ineligible Cohort: Males aged 22 to 28 (0.004) (0.004) (0.003) (0.003) (0.003)
Panel B: Experiment 2Eligible Cohort: Males aged 13 to 21 300,327 -0.00 -0.00 -0.00 -0.00 -0.00Ineligible Cohort: Males aged 22 to 28 (0.002) (0.002) (0.001) (0.001) (0.001)
Control Variables:Age Fixed E↵ects Yes Yes Yes Yes YesEthnicity Fixed E↵ects Yes Yes Yes Yes YesDistrict of Birth Fixed E↵ects No Yes Yes Yes YesAge Dummies*District of Birth Dummies No No Yes Yes YesAge Dummies*Rural Birth Dummy No No Yes Yes YesAge Dummies*Primary School Teachera No No No Yes YesAge Dummies*Secondary School Teacherb No No No Yes YesAge Dummies*Access to Schoolc No No No No Yes
Notes: This table reports the estimates of �, the coe�cient of interaction between Gurkhadummy and eligible cohort dummy from equation (4). The dependent variable is the dummyvariable indicating whether the individual is living abroad in 2001. Eligible Gurkha men,especially cohort aged 13 to 21, would have had the opportunity to apply for the BritishGurkha Army by 2001 and also to seek other emigration opportunities. The coe�cients arestatistically insignificant for cohort aged 13 to 21, suggesting that the increase in educationin response to the rule change did not increase their propensity to emigrate. If anything, theemigration is reduced for eligible Gurkha men aged 6 to 12, as suggested by the negative andstatistically significant coe�cients in Panel A.aPrimary School Teacher is district-level total number of primary school teachers inpubic schools in 1994.bSecondary School Teacher is district-level total number of secondary school teachersin pubic schools in 1994.cAccess to School is ethnicity-level average distance-time to school in 1996 calculatedusing 1996 NLSS.The standard errors are reported in parentheses and are adjusted for within-ethnicity corre-lation between individuals.* indicates significance at the 5 percent level** indicates significance at the 1 percent level
40
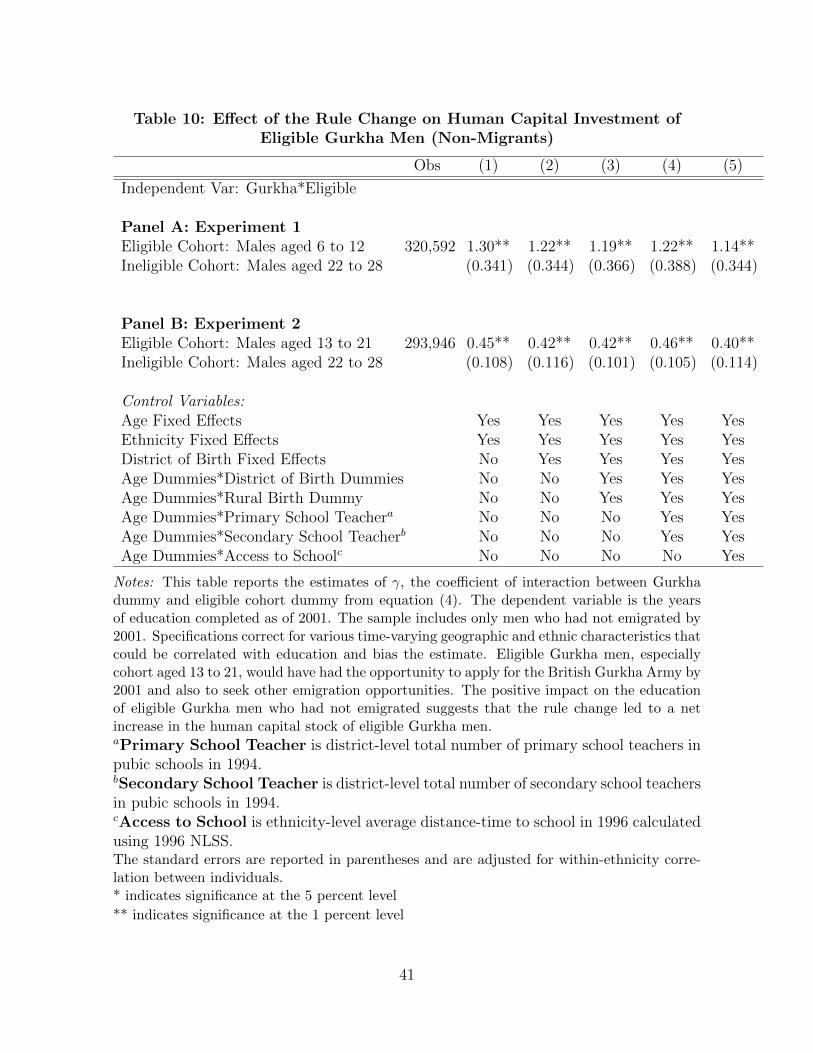
Table 10: E↵ect of the Rule Change on Human Capital Investment ofEligible Gurkha Men (Non-Migrants)
Obs (1) (2) (3) (4) (5)
Independent Var: Gurkha*Eligible
Panel A: Experiment 1Eligible Cohort: Males aged 6 to 12 320,592 1.30** 1.22** 1.19** 1.22** 1.14**Ineligible Cohort: Males aged 22 to 28 (0.341) (0.344) (0.366) (0.388) (0.344)
Panel B: Experiment 2Eligible Cohort: Males aged 13 to 21 293,946 0.45** 0.42** 0.42** 0.46** 0.40**Ineligible Cohort: Males aged 22 to 28 (0.108) (0.116) (0.101) (0.105) (0.114)
Control Variables:Age Fixed E↵ects Yes Yes Yes Yes YesEthnicity Fixed E↵ects Yes Yes Yes Yes YesDistrict of Birth Fixed E↵ects No Yes Yes Yes YesAge Dummies*District of Birth Dummies No No Yes Yes YesAge Dummies*Rural Birth Dummy No No Yes Yes YesAge Dummies*Primary School Teachera No No No Yes YesAge Dummies*Secondary School Teacherb No No No Yes YesAge Dummies*Access to Schoolc No No No No Yes
Notes: This table reports the estimates of �, the coe�cient of interaction between Gurkhadummy and eligible cohort dummy from equation (4). The dependent variable is the yearsof education completed as of 2001. The sample includes only men who had not emigrated by2001. Specifications correct for various time-varying geographic and ethnic characteristics thatcould be correlated with education and bias the estimate. Eligible Gurkha men, especiallycohort aged 13 to 21, would have had the opportunity to apply for the British Gurkha Army by2001 and also to seek other emigration opportunities. The positive impact on the educationof eligible Gurkha men who had not emigrated suggests that the rule change led to a netincrease in the human capital stock of eligible Gurkha men.aPrimary School Teacher is district-level total number of primary school teachers inpubic schools in 1994.bSecondary School Teacher is district-level total number of secondary school teachersin pubic schools in 1994.cAccess to School is ethnicity-level average distance-time to school in 1996 calculatedusing 1996 NLSS.The standard errors are reported in parentheses and are adjusted for within-ethnicity corre-lation between individuals.* indicates significance at the 5 percent level** indicates significance at the 1 percent level
41

Table 11: Lifetime Earnings of British Gurkha Soldier
Timeline Income Present Valueof Incomea
1. Recruitment into the British Gurkha at age 20b
New Entrant $20,880.00 $20,880.00Rifleman (Level 1) $26,037.00 $25,776.63Rifleman (Level 2) $28,068.00 $27,509.45Rifleman (Level 3) $31,000.00 $30,079.27Rifleman (Level 4) $33,320.00 $32,007.06Rifleman (Level 5) $36,842.00 $35,036.38Lance Corporal (Level 1) $38,634.00 $36,373.14Lance Corporal (Level 2) $40,407.00 $37,661.96Lance Corporal (Level 3) $42,224.00 $38,961.97Lance Corporal (Level 4) $44,256.00 $40,428.62Lance Corporal (Level 5) $44,256.00 $40,024.33Corporal (Level 1) $44,256.00 $39,624.09Corporal (Level 2) $44,286.00 $39,254.44Corporal (Level 3) $46,454.00 $40,764.36Corporal (Level 4) $47,539.00 $41,299.31Corporal (Level 5) $48,686.00 $41,872.80Corporal (Level 6) $49,694.00 $42,312.34Corporal (Level 7) $50,779.00 $42,803.81Sergeant (Level 1) $50,779.00 $42,375.77Sergeant (Level 2) $51,424.00 $42,484.90Sergeant (Level 3) $52,727.00 $43,125.78Sergeant (Level 4) $53,392.00 $43,232.99Sergeant (Level 5) $54,432.00 $43,634.36Sergeant (Level 6) $55,471.00 $44,022.58Sergeant (Level 7) $56,512.00 $44,400.24
Subtotal $1,092,355.00 $955,946.58
42

Lifetime Earnings of British Gurkha Soldier (Continued)
2. Retirement from British Gurkha at age 45c
(Between age 45 to 65, the pension is calculatedunder Early Departure Payments Structure)
(i) Between 45 to 55:Highest Pensionable Salary*Years of Service*1/70*(50%+8.3335%)=
56512*25*1/70*58.3335%=$11,773.37
x 10= $117,733.67 $87,562.871st Lump Sum = 3 * Pension $35,320.11 $27,472.74
Subtotal $153,053.78 $115,035.61
(ii) Between 55 to 65:Highest Pensionable Salary*Years of Service*1/70*(75%)=
56512*25*1/70*75%=$15,137.14
x10= $151,371.43 $101,815.75
Subtotal $151,371.43 $101,815.75
(After age 65, the pension is calculated under AFPS 05)
(iii) Between age 65 to 75d:Highest Pensionable Salary*Years of Service*1/70=
56512*25*1/70=$20,182.85
x10= $201,828.57 $122,773.762nd Lump Sum = 3 * Pension $60,548.57 $38,520.11
Subtotal $262,377.14 $161,293.87Total $1,659,157.35 $1,334,091.81
Notes: This table reports the lifetime income of a typical Gurkha soldier, including annualsalary, benefits, and pensions.a Present value of income is calculated using a discount factor of 0.99. If income in the thirdyear of service is $28,068, then the present value of third year’s income is 0.992*28,068 =$27,509.45b Salary structure for British Gurkha soldier is based on “Rates of Pay as of April 2009”published by the UK Ministry of Defensec Pension scheme is based on “Armed Forces Pension Scheme 05: Your Pension SchemeExplained” published by Service Personnel Policy (Pensions), The UK Ministry of Defense onJanuary 2007.
43

Table 12: Ethnicity Weights in the Synthetic Gurkha
Ethnicitya Weight
Cheetry 0.063Brahmin 0.034Tharu 0.094Newar 0.045Kami 0.157Yadav 0.074Muslim 0.095Damai 0.130Sarki 0.233Other 0.076
Notes: This table reports the weights on each non-Gurkha ethnicities in the synthetic Gurkhaethnic group. The weights are calculated to minimize the mean squared di↵erence between theeducation of Gurkha and synthetic Gurkha ethnic groups across ages 22 to 44. Based on themathematical algorithm provided by ?, I chooseW to minimize (X
G
�XN
W )(XG
�XN
W ),where W = {(w1, .....wJ
)0 subject to w1+.....+wJ
= 1, wJ
� 0}. XG
is a (k X 1) vectorof average years of education at each age ineligible birth cohorts for the Gurkha ethnicgroup, where 21 k 44. X
N
is a (k X J) matrix with average years of education fork ineligible birth cohorts and J non-Gurkha ethnicities.
44

Figure 1: Map of Nepal with Concentration of Gurkha Ethnic Group and the British Gurkha Recruitment Centers
45

Figure 2: E↵ect of the Rule Change on Human Capital Investment of Gurkha Men atEach Birth Cohort (Identification Test)
-10
12
6810121416182022242628303234Age in 1993
Notes: The figure above plots �x
s for 6 x 35 from equation (5). Since each �x
estimates the e↵ect of the rule change on Gurkha men of age x in 1993, �x
should bezero for x � 21 and increase as x decreases for x < 21.
46

Figure 3: E↵ect of the Rule Change on Human Capital Investment of Gurkha Womenat Each Birth Cohort (Identification Test)
-2-1
01
6810121416182022242628303234Age in 1993
Notes: The figure above plots �x
s for 6 x 35 from equation (5) for females. Sinceeach �
x
estimates the e↵ect on Gurkha women of age x in 1993 and women were nota↵ected by the rule change, �
x
should be zero for all xs.
47

Figure 4: Di↵erence in Di↵erences in CDF (Estimated from Linear Probability Model)with 95-Percent Confidence Interval
0.0
5.1
.15
.2.2
5
2 3 4 5 6 7 8 9 10 11 12 13 14Years of Education
Notes: The figure plots �s estimated from equation (4) with a dummy dependentvariable indicating the years of education completed greater than or equal to s, foreach s = 2 to 14. The error terms in these 14 seemingly unrelated regression equations(SURE) are correlated. The 95 percent confidence intervals for each �ss are adjustedfor cross-equation error correlation. The sample includes men from younger eligiblecohorts aged 6 to 12 or ineligible cohort aged 22 to 28, with at least 1 year of educationcompleted. Each �s indicate the impact of the rule change at the education level samong Gurkha men of younger eligible cohort with at least 1 year of schooling.
48

Figure 5: Comparison between Gurkha and Synthetic Gurkha
02
46
Year
s of
Edu
catio
n
68101214161820222426283032343638404244Age in 1993
Gurkha Synthetic Gurkha
Notes: The graph above plots the average years of education completed as of 2001at each birth cohort for Gurkha and synthetic Gurkha ethnic groups. The syntheticGurkha is a weighted sum of all the non-Gurkha ethnicities. The weights are calculatedto minimize the squared di↵erence in average education of Gurkha and synthetic Gurkhaethnic groups across birth cohorts aged 22 to 44. Based on the mathematical algorithmprovided by Abadie and Gardeazabal (2003), I choose W to minimize (X
G
�XN
W )(XG
�X
N
W ), where W = {(w1, .....wJ
)0 subject to w1 + ..... + wJ
= 1, wJ
� 0}. XG
is a(k X 1) vector of average years of education at each age ineligible birth cohorts for theGurkha ethnic group, where 21 k 44. X
N
is a (k X J) matrix with average yearsof education for k ineligible birth cohorts and J non-Gurkha ethnicities.
49
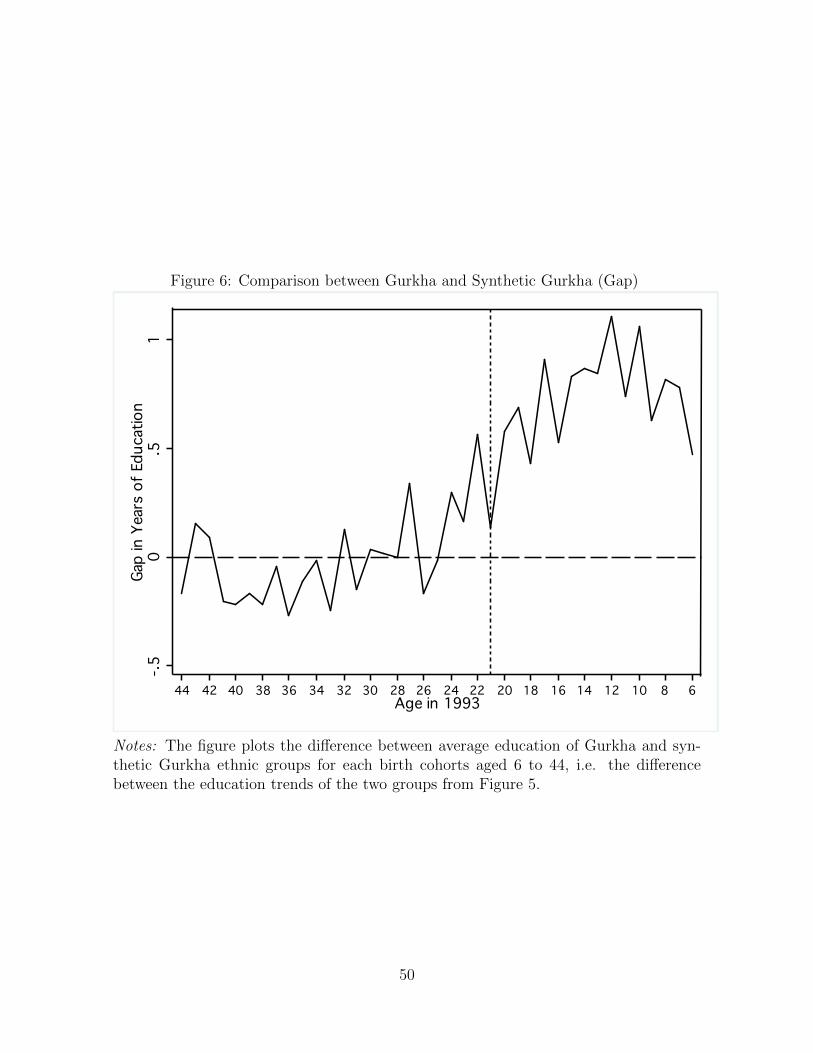
Figure 6: Comparison between Gurkha and Synthetic Gurkha (Gap)
-.50
.51
Gap
in Y
ears
of E
duca
tion
68101214161820222426283032343638404244Age in 1993
Notes: The figure plots the di↵erence between average education of Gurkha and syn-thetic Gurkha ethnic groups for each birth cohorts aged 6 to 44, i.e. the di↵erencebetween the education trends of the two groups from Figure 5.
50
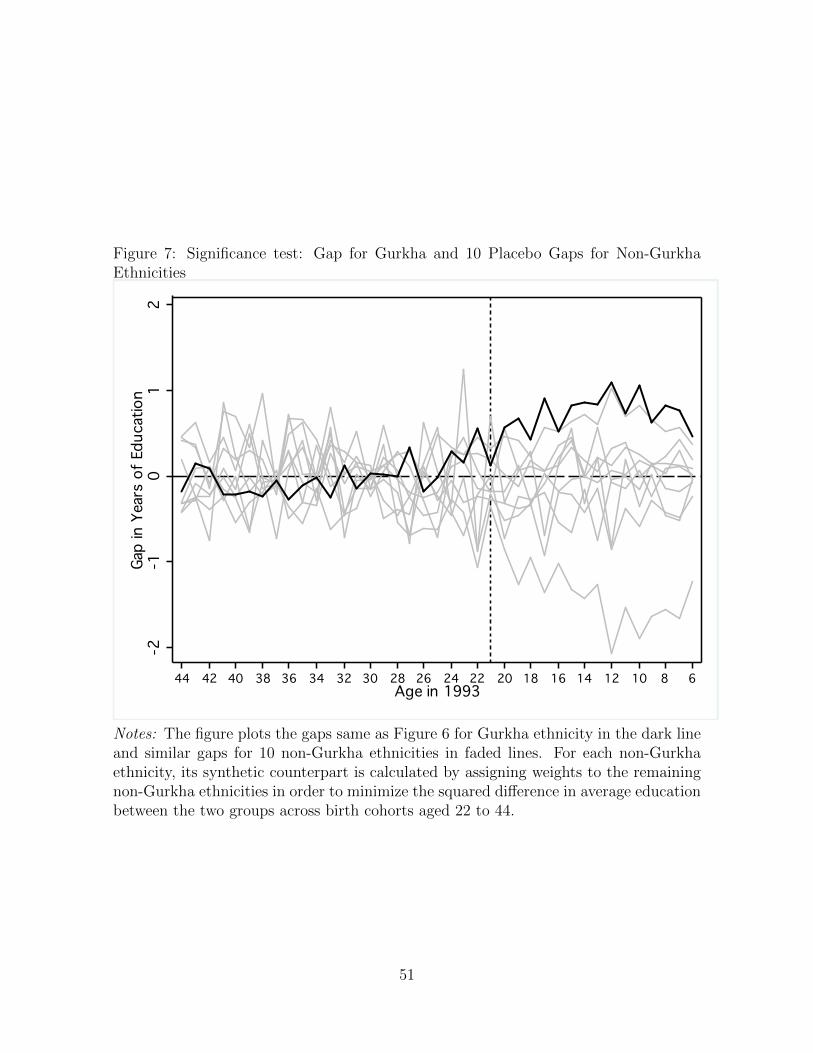
Figure 7: Significance test: Gap for Gurkha and 10 Placebo Gaps for Non-GurkhaEthnicities
-2-1
01
2Ga
p in
Yea
rs o
f Edu
catio
n
68101214161820222426283032343638404244Age in 1993
Notes: The figure plots the gaps same as Figure 6 for Gurkha ethnicity in the dark lineand similar gaps for 10 non-Gurkha ethnicities in faded lines. For each non-Gurkhaethnicity, its synthetic counterpart is calculated by assigning weights to the remainingnon-Gurkha ethnicities in order to minimize the squared di↵erence in average educationbetween the two groups across birth cohorts aged 22 to 44.
51
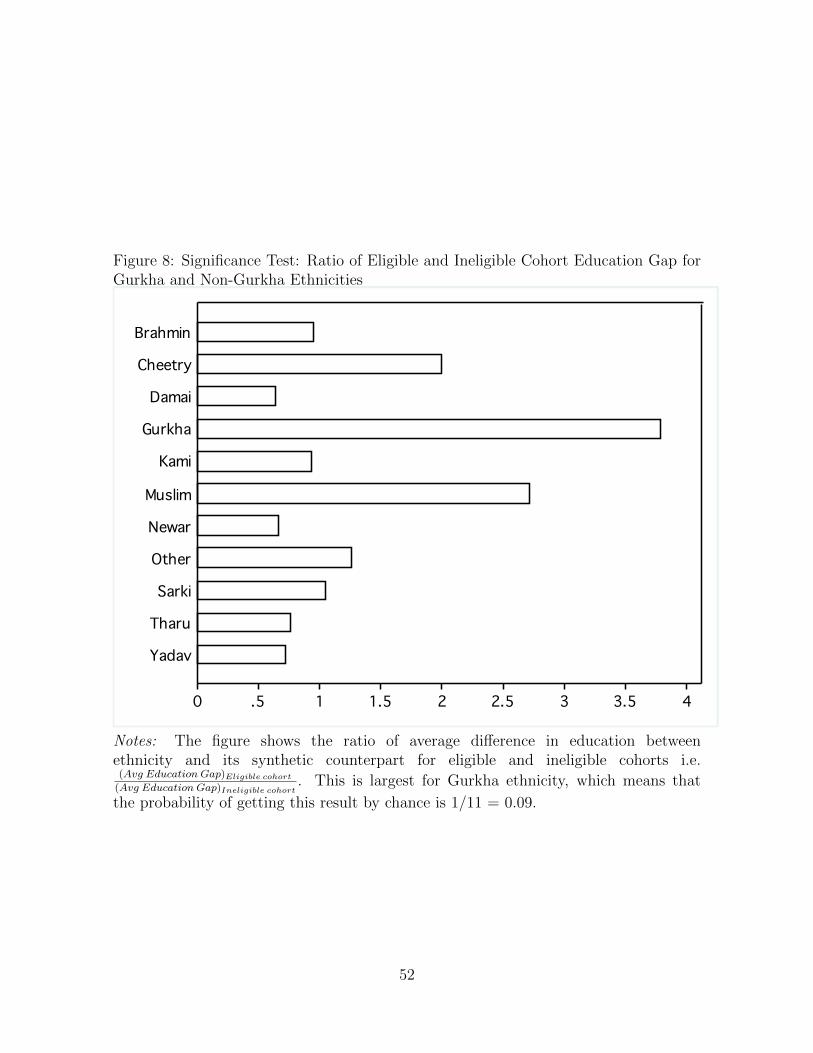
Figure 8: Significance Test: Ratio of Eligible and Ineligible Cohort Education Gap forGurkha and Non-Gurkha Ethnicities
0 .5 1 1.5 2 2.5 3 3.5 4
Yadav
Tharu
Sarki
Other
Newar
Muslim
Kami
Gurkha
Damai
Cheetry
Brahmin
Notes: The figure shows the ratio of average di↵erence in education betweenethnicity and its synthetic counterpart for eligible and ineligible cohorts i.e.(Avg Education Gap)
Eligible cohort
(Avg Education Gap)Ineligible cohort
. This is largest for Gurkha ethnicity, which means that
the probability of getting this result by chance is 1/11 = 0.09.
52