human capital externality, knowledge spillover, and sustainable
TRANSCRIPT
ANNALS OF ECONOMICS AND FINANCE 10-1, 155–198 (2009)
Human Capital Externality, Knowledge Spillover, and
Sustainable Economic Growth*
Xiangcai Meng
Department of Trade and Economics, College of ManagementFuzhou University, Fuzhou, 350002, China
E-mail: [email protected]
and
Azhong Ye
Department of Trade and Economics, College of ManagementFuzhou University, Fuzhou, 350002, China
E-mail: [email protected]
We attempt to introduce human capital externality and endogenous labor-leisure decision into the analytical framework constructed by Uzawa (1965)and Lucas (1988) simultaneously, so as to explore the internal relationshipamong endogenous labor supply, human capital externality and sustainableeconomic growth as well as the choice problem of government’s education pol-icy. The main conclusions of this thesis are as follows: 1. The sound degree ofhousehold’s time endowment allocation and the magnitude of human capitalexternality will work on the height of the steady state’s growth rate on thebalanced growth path. 2. The larger the subjective time preference and thestronger the leisure awareness is, the lower the steady state’s growth rate ofthe country will be; the larger the output elasticity and education investmentexpenditure elasticity of knowledge spillover becomes, the higher the steadystate’s growth rate of the country will be; and vice versa. 3. The governmentcan choose from carrying out lump-sum output taxation or education subsidyto stimulate the adjustment of private labor supply and human capital invest-ment, such that the decentralized economy could be induced to the sustainableoptimal growth state. We employ China’s province level panel data to analyzeempirically, all the main conclusions are supported by the empirical research;meanwhile, we also observed some puzzles which are different from the existingconclusions.
Key Words: Human capital externality; Knowledge spillover; Sustainable eco-nomic growth; Education policy; Panel data model.
1551529-7373/2009
All rights of reproduction in any form reserved.

156 XIANGCAI MENG AND AZHONG YE
JEL Classification Numbers: E10, H52, I20.
1. INTRODUCTION
“The consequences for human welfare involved in questions like theseare simply staggering: Once one starts to think about them, it is hard tothink about anything else.”1, just as Robert E. Lucas, Jr. pointed out,economic growth is an attractive and exciting research field. It has beenverified theoretically and empirically that human capital plays a vital rolein the process of economic growth, and it is also a fundamental element topromote long-term economic growth. In 1988, Lucas made one explanationto human capital externality2, he divided the effect of human capital intointernal effect and external effect, where the former means that individ-ual’s human capital can enhance its own productivity and revenue whilethe latter indicates that the increase of average human capital can promotethe productivity of all production factors. Because little attention has beenpaid to the latter effect when households make their decisions about hu-man capital investment, it is recognized as the human capital externality.Lucas employ an externality parameter ε to measure the degree of externaleffect that average human capital makes on the productivity of each en-terprise3, however, in our analysis we follow the route taken by Grossman(1972) while he analyzed the health human capital4. We think that humancapital externality not only can enhance production factor’s productivity,
* The authors thank National Social Science Foundation for its financial support(Grant No.: 07BJY021) for “The cause analysis and strategy research on the slow growthof Chinese residents’ consumption — Based on the theoretical and empirical angle ofview”. We also thank the ministry of education’s 11th five year scheme of nationaleducation science for its financial grant (Grant No.: DFA070087) for the project ”Theimpact of higher education’s investment risk on household’s education choice”. The au-thors appreciate professor Yaohui Zhao from China Center for Economic Research andprofessor Geraint Johnes from Lancaster University for their help in the preliminaryprocess of searching literature and we are also grateful to the constructive suggestionsgiven by the participants at the 8th China Economics Annual Conference which was heldat Chongqing University, Chongqing City, China and commentators at the Fifth Bien-nial Conference of Hong Kong Economic Association which was held at South WesternUniversity of Finance and Economics, Chengdu City, China. Of course, any possibleerrors belong to the authors.
1Refer to Robert E. Lucas. Jr. On the Mechanics of Economic Development [J] ,Journal of Monetary Economics ,1988 ,(22):3 - 42.
2See also Robert E. Lucas. Jr. On the Mechanics of Economic Development [J] ,Journal of Monetary Economics ,1988 , (22):3-42.
3Robert. J. Barro and Xavier Sala-i-Martin, Economic Growth, Beijing, China SocialSciences Press, 2000, 1st edition, p196-197.
4Grossman, M. The demand for health: a theoretical and empirical investigation,NBER, Occasional paper119, Columbia University Press.

HUMAN CAPITAL EXTERNALITY 157
but also can improve household’s utility level z(t) through increasing thesociety’s average knowledge level. In other words, we assume that the av-erage knowledge level which represents human capital externality entershousehold’s utility function, thus we can study the effect that human capi-tal makes on sustainable economic growth through the general equilibriumframework.
New-classical economists investigate leisure thoroughly through consid-ering it as a normal good which has positive marginal effect, however, in theearly studies of economic growth, such as Uzawa (1965) and Lucas (1988),leisure was neglected (Qing Qianlong, 2005). Actually, leisure is a key ele-ment in contemporary economic fluctuation theory, just as Finn Kydland(1995) pointed out, in business cycle, almost 2/3 output fluctuation wasattributed to the variation of working hours and leisure. Following RyderStafford and Stephan (1976), Ladron. de. Guevara, Ortigueira and Santos(1995), Stokey and Rebelo (1995), we introduce leisure represented by einto household’s utility function, in order to investigate how household’sdecisions on leisure and labor supply affect economy’s steady growth aswell as its effects on human capital externality and education.
The structure of this paper is as follows: Section 2 is literature review,we will tease and comment the existing related literature, so as to deducethe problem discussed in this paper and our novelties. Section 3 is thebasic framework of our model, we postulate the economy’s consumptionand preference, production and technology as well as the flow of knowledgespillover, meanwhile, we simultaneously introduce consumption, leisure andaverage knowledge level into household’s utility function. In section 4,based on endogenous growth theory, we conduct social optimal analysisand comparative static analysis through studying social planner’s problem,at the same time, we also study the effect that endogenous labor supplyand leisure decisions make on economy’s balanced growth path and furtherinvestigate the result which variations of all kinds of parameters makeson steady growth rate. In the following section 5, we concentrate on theequilibrium of decentralized economy and government’s problem on thechoice of education policy, in order to investigate the effect that endogenoustransformation of human capital externality makes on economy’s steadystate. In section 6, we employ China’s province level panel data to makeempirical tests on the main propositions that we have already made in ourtheoretical analysis from the static and dynamic angle of view. The finalpart is our conclusions.
2. LITERATURE RETROSPECTION
In 1776, Adam Smith already took manpower as capital to commencestudies (Zhang Xianji and Zhan Lianfu, 2005; Gao Bei and Hou Xiaohui,

158 XIANGCAI MENG AND AZHONG YE
2007), however, as a concept, human capital was firstly proposed in 1935(J. R. Walsh, 1935). Under the endeavor of Theodore W. Schultz, Gale.Johnson, Kenneth J. Arrow et al, human capital gradually constituted asystematic theory till the late 1950s and early 1960s. As for the discussionof the relationship between human capital and economic growth, we cantrace back to the development of economic growth theory itself. K. J. Ar-row (1962) proposes the learning by doing model, thus he introduces theprocess of obtaining knowledge while individuals participating productioninto endogenous model. Paul. M. Romer (1986) makes modifications tothe production function by introducing externality, he investigates the ex-ternal effect that knowledge spillover which related to technique made onproduction, and this is the earliest research concerning the discussion ofthe relationship between human capital externality and economic growth.Robert E. Lucas, Jr. (1988) uses an external parameter ε to measure thedegree of external effect that average human capital makes on the pro-ductivity of each enterprise, and constructs an endogenous growth modelwhich put human capital externality in center, what’s more, human capitalreveals increasing returns to scale and thus made economic growth sus-tainable, henceforth, human capital became the key element of economicgrowth. After that, Paul. M. Romer (1990), Gene. M. Grossman and El-hana Helpman (1991), Rebelo. S (1991), Philipe Aghion and Peter Howitt(1992) continue to develop endogenous growth theory separately followingthose two directions of endogenous research & development (R&D) and en-dogenous human capital, they think that either human capital or research& development (R&D) could stimulate growth through influencing out-put. But just as Johannes Hers (1998) pointed out “however, the relativeimportance of human capital in stimulating economic growth and the mech-anism through which human capital stimulates growth remain unclear.”5
Hence, we try to introduce labor-leisure decision and knowledge spilloverinto utility function, from the perspective that human capital externalityaffects household’s utility, we study the relationship among human capitalexternality, knowledge spillover and sustainable economic growth, and thisis a new research method which differentiates our paper to the existingliterature.
Different from the earlier endogenous economic growth theory, Jones(1995), Redding (1996), Sjogren (1998), Keller (1996) and Arnold (1998),Funke and Strulik (2000) attempt to introduce human capital investmentand research & development (R&D) into a unique framework, they tryto make meaningful considerations from a complementary view of angle.Klenow. Peter J. (1998), Cannon and Edmund (2000), Teles. Vladimir K
5Johannes Hers. Human capital and economic growth: a survey of the literature, cpbreport, 1998, 02.

HUMAN CAPITAL EXTERNALITY 159
(2005), Mengistae. Taye (2006) study the application situation of the en-dogenous growth theory. Robert. Barro (1991) investigates the relationshipbetween education, human capital and economic growth, and verified thecapability to explain economic phenomenon of endogenous growth models;what’s more, Barro (2000), Chu and others (1995), Tanzi and Chu (1998)also make studies on these aspects, although these research has paid muchattention to the combination of human capital externality and research &development (R&D), however, no research has already made a very goodintegration of the measurement of human capital externality and research& development (R&D). We employ the level of knowledge spillover z(t) tomeasure human capital externality, and try to unify human capital exter-nality and knowledge spillover into an unique framework, which is also oneof the novelties of our research.
As for the aspects of government education expenditure, human cap-ital and economic growth, Cronovich (1997, 1998) explore the theoreti-cal possibility of effects that government expenditure made on endogenoustechnological improvement and economic growth. Ross. Capolupos (2000)constructs an endogenous model whose human capital was accumulatedthrough government public education expenditure, and explores the rela-tionship between education taxation, human capital accumulation and eco-nomic growth. The research conducted by Gupta and Verhoeven (2001),Gupta, Verhoeven and Tiongson (1999) reveals that the scale and efficiencyof government education investment play a very important role in the pro-cess of promoting society’s economic performance. Shuanglin Lin (2001)studies the effect that different kinds of taxation made on human capi-tal accumulation and economic growth. Although these literature recog-nized that government expenditure indeed made contributions to economicgrowth, little attention has been paid to the functioning mechanisms be-tween government education investment and economic growth. Therefore,following the ideas expressed by Gradus and Smulders (1993), Smuldersand Gradus (1996) and Chen, Lai and Shieh (2003) in their models, wecombine knowledge spillover level Z(t), education investment expenditureG(t) and economic output Y (t) together via employing an equation whichmeasures the flow of knowledge spillover, thus we can analyze the interac-tion mechanisms between them, which also constitutes one of the noveltiesin our research.
Furthermore, some literature explores the relationship between incomedistribution, equality, human capital and economic growth, such as Glommand Ravikumar, 1992; Zhang, 1996,2003; Bovenberg and Jacobs, 2005. Be-sides, some paper studies the relationship between institution and economicgrowth, for example, Daron Acemoglu, 2007. However, these work has littleconnection with the focus of our research. Literature relating to the em-pirical studies on the relationship between human capital externality, labor

160 XIANGCAI MENG AND AZHONG YE
supply decisions as well as leisure and economic growth is relatively scarce.However, empirical literature about the interactions between education in-vestment, human capital accumulation and economic growth is relativelyabundant, Rob A. Wilson and Geoff Briscoe (2004) made a very compre-hensive and elaborate review6. Thereafter, Keller (2006) investigates howeducation affects economic growth in developed countries, and reveals thatthe lagged 10 years’ enrollment rate of high school and university educationhave obvious effect on per capita growth. Jamison and Hanushek (2006)make use of data from more countries and find out that the quantity andquality of education both have important effect on per capita growth rate.Obviously, these empirical literature studies the short-run relationship be-tween education, human capital accumulation and economic growth, butignores to analyze the long-term dynamic effect. Therefore, in this paper,we will employ vector auto-regression model to inquire the inner dynamicrelationship between them and we will also apply panel data model to makecomparisons, which compose the empirical innovations in our research.
3. THE BASIC FRAMEWORK OF THE MODEL
In this paper, at first, we assume that the whole economy is composed ofa government and a representative family. Secondly, we suppose that theeconomy’s representative household not only is the commodity’s consumer,but also is the producer of our economy7, and the family just produce onehomogenous commodity8, this commodity can be either used for consump-tion or paying for government taxation, as well as education expenditureinvestment. Thirdly, without the loss of generality, we assume the timeendowment of the household is 1 in this paper, where m(t) is used forworking, e(t) is set aside for leisure and the residual time ν(t) is used foraccumulating human capital. Finally, as for population growth, we followthe method taken by Barro and Sala-i-Martin (1995), we standardize thepopulation at time 0 to 1, then the population at time t is L(t) = ent, of
6See Rob A. Wilson and Geoff Briscoe. The impact of human capital on economicgrowth: a review, Third report on vocational training research in Europe: backgroundreport. Luxembourg: Office for Official Publications of the European Communities,2004, Cedefop Reference series, 54.
7Barro and Sala-i-Martin (1995) proved that, an economy which segregates the house-hold sector and the production sector, also named enterprise sector, is equivalent to aeconomy whose theoretical framework is that household directly participate in produc-tion, refer to Barro and Sala-i-Martin, Economic Growth, Beijing, China Social SciencesPress, 2000, 1st edition; there is another advanced textbook written by professor LiutangGong, Advanced Macroeconomics, Wuhan, Wuhan University Press, 2005. 4.
8Here homogeneous commodity means that the commodity can easily transfer fromcapital goods to consumption goods, and vice versa, this is the hypothesis often used bygrowth literature, refer to Barro and Sala-i-Martin, 1995.

HUMAN CAPITAL EXTERNALITY 161
which n is the growth rate of population, if C(t) is the total consumptionat time t, then c(t) = C(t)/L(t) is the per capita consumption of eachhousehold.
3.1. Consumption and PreferenceDifferentiating from the study method employed by Uzawa (1965) and
Lucas (1988), we assume that at time t the average knowledge level z(t) af-fects the representative household’s utility; furthermore, the average knowl-edge level z(t) is affected by average output y(t) and per capita governmenteducation expenditure g(t), in order to study human capital externality.Therefore, the representative household’s utility not only comes from percapita consumption c(t) and leisure e(t), but also comes from the econ-omy’s average knowledge level z(t) at time t, which reflects the economicactivity participant’s ability and can enhance household’s capability to en-gage in production activities, hence, it can bring positive utilities to thehousehold9, the representative household want to maximize the followingtotal utility10:
max∫ ∞
0
u[c(t), e(t), z(t)] · exp(nt) · exp(−ρt)dt (1)
Equation (1) assumes that the household wants to achieve maximizationon the sum of discount values about all the instantaneous utility functionsu[c(t), e(t), z(t)], where ρ is the subjective time preference, u[c(t), e(t), z(t)]is the instantaneous utility function, and uc > 0, ucc < 0, ue > 0, uee < 0,uz > 0, uzz < 0, uce > 0, ucz > 0, uez > 0 were satisfied. Furthermore, thefollowing Inada conditions were also held: limc→0 uc →∞; limc→∞ uc → 0;lime→0 ue → ∞; lime→∞ ue → 0; limz→0 uz → ∞; limz→∞ uz → 0. Toguarantee that equation (1) can be solved, we adopt the assumption thatρ > n as Barro and Sala-i-Martin (1995). For simplicity of our model andanalytical process, we set the instantaneous utility function as the followinglogarithm linear form11:
u[c(t), e(t), z(t)] = ln c(t) + ε ln e(t) + ω ln z(t) (2)
9Here we treat this positive utility resulted from the positive human capital exter-nality, so we can call z(t) knowledge spillover level, which measures the magnitude ofexternality.
10In order to show the clear relationship between each variable and time t, we don’tomit t here; however, for convenience to express, without loss of clearness, time t can beomitted.
11Actually, for a more general form of the widely used Cobb—Douglas utility function:
u(c(t), e(t), z(t)) =(c(t)e(t)εz(t)ω)1−θ−1
1−θ, although the model in our paper may become
more complex, the main conclusions will be still correct and robust.

162 XIANGCAI MENG AND AZHONG YE
In the above equation, the parameters ε and ω are positive constants, andeach measures the effect degree that leisure and average knowledge levelmade on consumer’s utility.
3.2. Production and TechnologyWe assume that the household in the economy only needs one input of
element to produce: effective human capital, which is the adjusted laborsupply through human capital, according to the study conducted by Duffyand Papageorgiou (2000). From the previous assumption, we know thatthis production not only can be used to consume and pay for the taxationlevied by the government, but also can be spent on education investment.Based on the method taken by Lucas (1988), we don’t take physical capitalinto consideration, and assume the form of the production function as thefollowing:
Y (t) = m(t) · h(t) · L(t) = u(t) · h(t) · exp(nt) (3)
Where Y (t) is the total output, h(t) is the average human capital level.The purpose of human capital investment for a household is to accumu-
late human capital, or broadly speaking, it is to accumulate technologicalcapital or knowledge. As the existence of human capital externality, the ac-cumulation of human capital such as full-time school education and on thejob training is non-convex. We make modifications to the postulate abouthuman capital accumulation made by Uzawa (1965) and Lucas (1988), andwe take the effect of depreciation factor made on human capital accumu-lation, that is the variation of human capital equals the multiplication ofthe time devoted into study and the existing human capital level minus thedepreciation of human capital, then we have12:
h(t) = B · ν(t) · h(t)− d · h(t) = [B(1− e(t)−m(t))− d] · h(t) B > 0 (4)
Of which, h(t) is the increment of human capital, and indicates the out-come of human capital accumulation, B is the parameter which measuresthe human capital efficiency and reflects the productivity of the educationsector, d indicates the depreciation speed of human capital.
3.3. Knowledge Spillover LevelBased on the idea of modeling externality by Uzawa (1965), Lucas (1988),
Romer (1986, 1989), Barro (1995, 1996), Zhang and Lee et al. (2003),Tamura (2006), we assume that the knowledge level in economy is a func-tion of output plane and education expenditure amount. The reasons are
12In this paper, we treat human capital like physical capital that they will discountwhile time elapses, therefore, we introduce the discount term d · h(t), and this makesour human capital accumulation function different from the form given by Lucas (1988),which makes this paper’s economic intuition more dominant.

HUMAN CAPITAL EXTERNALITY 163
as follows: on the one hand, output Y (t) is the main source of income,which determines the development level of education and accumulationplane of knowledge; on the other, education expenditure G(t) supplied bythe government can promote the development of education via enhancingthe knowledge amount. As a result, the flow equation of knowledge spilloverlevel is assumed as follows13:
Z(t) = Y (t)αG(t)β (5)
In the above equation, parameters α and β are positive constants, andsatisfy α + β = 1, α and β represents the elasticity of knowledge spilloverlevel Z(t) to output amount Y (t) and the elasticity of knowledge spilloverlevel Z(t) to education expenditure G(t).
4. EQUILIBRIUM ANALYSIS OF SOCIAL PLANNER’SECONOMY
In section 3, we have already constructed the analytical framework ofthis paper through assuming preference, technology and externality. Inthe following part, we will analyze the social planner’s decision problem,in order to study the inner relationship between endogenous labor supply,knowledge spillover and economic growth as well as when the economy isin the steady state, how the variation of each kinds of parameters affectconsumption, government and economic growth.
4.1. Social Planner’s Decision ProblemAssume there is a social planner in the economy14, what he considers is
the welfare of the whole society. As what we employs in this paper is therepresentative household, hence, the social planner’s welfare maximizationcan be given by the following optimal problem1516:
maxm,e,g
∫ ∞
0
(ln c(t) + ε ln e(t) + ω ln z(t)) · exp(nt) · exp(−ρt)dt (6)
13This equation enables us to measure the magnitude of human capital externalityby employing the flow of knowledge level, which differentiates our analysis with Lucas(1988), who made use of the output elasticity parameter of human capital to measureexternality, and this is one of the novelties of our paper.
14Social planner, which is also named as central planner, please refer to Robert J Barroand Sala-i-Martin (1995), Economic Growth, Beijing, China Social Sciences Press, 2000,1st edition.
15As C(t) = m · h(t) · ent − G(t), indicates that total consumption is equal to totaloutput minus the part spent on education expenditure, divide both sides of this equationby ent and we can get the per capita variable expression.
16Based on equation (5), we can get: Z(t) = Y (t)αG(t)β , as α+β = 1, so divide bothsides simultaneously by ent so we can get z(t) = (mh)αgβ .

164 XIANGCAI MENG AND AZHONG YE
s.t. c(t) = m(t)h(t)− g(t)
h = [B(1− e(t)−m(t))− d] · h(t)
z(t) = (m(t)h(t))αg(t)β
According to dynamic optimization theory, we define the Current-valueHamilton function17 as follows:
Hc = [ln(mh− g) + ε ln e + ω ln((mh)αgβ)] + λ[B(1−m− e)− d]h (7)
there are three control variables m, e, g and one state variable h in thisoptimal control problem, in equation (7), λ(t) is the co-state variable, andit indicates the shadow price of state variable h(t) at time t, based on themodified maximum value theory, we can get the first order conditions andtransversality conditions which maximizes (7) as follows:
∂Hc
∂m=
h
c+
ωα
m− λBh = 0 (8)
∂Hc
∂e=
ε
e− λBh = 0 (9)
∂Hc
∂g= −1
c+
ωβ
g= 0 (10)
λ = −∂Hc
∂h+ (ρ− n)λ
= −m
c− ωα
h− λ[B(1−m− e)− d] + (ρ− n)λ (11)
limt→+∞
λh(t) exp[−(ρ− n)t] = 0 (12)
Equations (7) ∼ (12) together depicts the dynamic system that we stud-ies, when social welfare maximizes, the economy is in its steady state,each variable {y, c, h, g, λ} is on their balanced growth path respectively, tostudy the characters of the steady state, solve this system and we can getproposition 1:
Proposition 1. When social welfare maximizes, the economy is in itssteady state and each variable is on their balanced growth path respectively,the following two properties hold:
17As for the contents of dynamic optimization and Present value Hamilton function,please refer to Alpha C. Chiang, Elements of Dynamic Optimization, McGraw-Hill Pub-lishing Co., 1992, Chapter 8; M. L. Kamien and N. L. Schwartz, Dynamic Optimization:The Calculus of Variations and Optimal Control in Economics and Management, Sec-ond Edition, North-Holland (Advanced Textbooks in Economics), Amsterdam and NewYork, 1991.

HUMAN CAPITAL EXTERNALITY 165
(1) household’s optimal allocation of time is
m =ρ− n
B(13)
e =ε(ρ− n)B(1 + ω)
(14)
ν =(1 + ω)(B − ρ + n)− ε(ρ− n)
B(1 + ω)(15)
(2) the steady state growth rate for each variable of the economy is
gh = gy = gc = gg =(1 + ω)(B − ρ + n)− ε(ρ− n)
1 + ω− d (16)
gY = gC = gG = gZ =(1 + ω)(B − ρ + n)− ε(ρ− n)
1 + ω− d + n (17)
The proof process is omitted here, please contact us for details if youare interested in it.
Proposition 1 reveals that, the representative family’s optimal allocationon time endowment is determined by subjective time preference ρ, pop-ulation growth rate n, human capital accumulation efficiency B and theimportance of society’s average knowledge level to the family ω. As weassume that the representative family’s time endowment is 1, hence it re-quires that 0 < m < 1, 0 < e < 1, 0 < ν < 1, however, based on equations(13) ∼ (15) as soon as ρ−n < B and ε < 1 + ω simultaneously hold18, theformer three conditions will be satisfied, that is to say, household’s subjec-tive time preference minus population growth rate must be smaller thanhuman capital accumulation efficiency, meanwhile, the important degreeof leisure to consumer must be less than that of knowledge plus 1, this isthe conditions for representative families to achieve optimal allocation ofresources. Moreover, the discount rate d of human capital is also very im-portant to the steady state growth rate of each variable in the economy, inthe steady state, when ρ−n < B and ε < 1+ω holds, output, consumptionand knowledge spillover could achieve sustainable economic growth.
4.2. Comparative Static AnalysisWe will make comparative static analysis in the following discussion, so
as to study how the variation of parameters which represent preference,technology and knowledge spillover affects household’s decision on how toallocate time and the economy’s long-term growth rate.
18According to m + e + ν = 1, as soon as 0 < m < 1, 0 < e < 1, then 0 < ν < 1naturally holds, so, based on equations (13) and (14) we can deduce that ρ−n < B andε < 1 + ω hold.

166 XIANGCAI MENG AND AZHONG YE
4.2.1. Effect of The Variation of Time Preference Parameter
According to equations (13) ∼ (17), we make partial derivative to thetime preference parameter, and we can get:
∂m
∂ρ=
1B
> 0,∂e
∂ρ=
ε
B(1 + ω)> 0 (18)
∂ν
∂ρ=
−(1 + ω)− ε
B(1 + ω)< 0,
∂gY
∂ρ= −1 + ω + ε
1 + ω< 0 (19)
According to in-equations (18) ∼ (19), we know that, if the consumer’ssubjective time preference ρ is larger, which means that the consumer ismore shortsightedness: the current consumption and leisure can bring moreutility to him than the future’s, in other words, the marginal utility of fu-ture consumption and leisure is decreasing, under this case, the representa-tive family will increase the current time spent on working and leisure to at-tain higher utility: On the one hand, the increase of leisure time e indicatesthe decrease of labor supply, time ν devoted to study will also decrease,meanwhile this will make the variation rate of human capital lower19 andreduce the accumulation rate of human capital, this is detrimental to thelong-run growth of output20, what’s more, it makes the long-term growthrate of consumption, education investment expenditure decrease. On theother hand, the increase of working hours will enhance the current out-put and consumption, so as to promote the education investment level G
and knowledge spillover level Z, which will be beneficial to short-run eco-nomic growth and the improvement of education level, thus, we can get thefollowing proposition 2:
Proposition 2. If the subjective time preference ρ of the consumer inthe economy is bigger, the household will pay more attention to the presentconsumption and leisure, although this may stimulate output growth andimprovement of education level in the short run, it will be detrimental forthe accumulation of human capital and sustainable economic growth, andcan simultaneously low the growth rate of education expenditure in the longrun.
19According to equation (4) we have: h(t) = B · ν(t) ·h(t)− d ·h(t) = [B(1− e−m)−d] · h(t), when ν(t) becomes smaller, h(t) will certainly decrease.
20Based on equation (5), we know: Y (t) = m(t) · h(t) · L(t) = m(t) · h(t) · exp(nt),as effective human capital h(t) is the only element that affect output, therefore, if theaccumulation rate of human capital decreases, in the long-run, the output Y (t) will alsodecrease, and this will be detrimental to economic growth.

HUMAN CAPITAL EXTERNALITY 167
4.2.2. Effect of The Variation of Utility Parameter
Make partial derivative to the utility parameter in equations (13) ∼ (17),we can get:
∂m
∂ε= 0,
∂e
∂ε=
ρ− n
B(1 + ω)> 0,
∂ν
∂ε= − ρ− n
B(1 + ω)< 0,
∂gY
∂ε= −ρ− n
1 + ω< 0 (20)
∂m
∂ω= 0,
∂e
∂ω=−ε(ρ− n)B(1 + ω)2
< 0,
∂ν
∂ω=
ε(ρ− n)B(1 + ω)2
> 0,∂gY
∂ω=
B − ρ + n
(1 + ω)2> 0 (21)
According to in-equations (20) ∼ (21), if the representative householdpays more attention to the utility brought by leisure, that is to say, the pa-rameter ε will become larger, this will degrade the marginal utility broughtby future leisure, and cause the family to increase the demand for thepresent leisure. Although the household will not adjust the time it devotedto working21, the increase of leisure will reduce labor supply and learningtime spent on accumulating human capital as well as education expendi-ture, which will engender negative impact on sustainable economic growthand human capital accumulation.
If the representative family thinks much of knowledge, knowledge spilloverlevel z(t) will bring more utility to the family, which means that the pa-rameter ω will become larger, and this will promote the marginal utility offuture leisure and the family must reduce current leisure22, meanwhile thefamily will increase the time spent on accumulating human capital, thiswill increase the marginal return of human capital. At the same time, thelarger the parameter ω is, the higher the education investment growth ratewill be and the same to the steady state growth rate, hence, this will gen-erate positive impact on education’s long term development and economy’ssustainable economic growth. Thus we get proposition 3 and 4:
21Based on equation (20), we can get: ∂m∂ε
= 0, which indicates that the variation of
ε will not affect working hours; meanwhile, as ∂e∂ε
= ρ−nB(1+ω)
> 0, so the representative
family will increase the time spent on leisure and decrease that spent on education.22According to equation (21), we have: ∂e
∂ω=
−ε(ρ−n)
B(1+ω)2< 0, if ω increases, then e will
decrease, hence the household will decrease time devoted to leisure, and this enhancefuture leisure’s utility and decrease that of the present leisure.

168 XIANGCAI MENG AND AZHONG YE
Proposition 3. If the representative household in the economy paysmore attention to leisure, which means a larger ε, then the family will setaside more time for current leisure and less time on accumulating humancapital, this will promote consumption and output growth in the short run,however, it will lower output growth rate and education expenditure growthrate in the long run, and cause negative effect on human capital accumula-tion and sustainable economic growth.
Proposition 4. If the importance of knowledge to the representativehousehold in the economy is larger, which means a bigger ω, the family willreduce leisure and increase time spent on accumulating human capital con-ditional on not reducing labor supply, this will enhance output growth ratein the long-run and education investment’s steady state growth rate, andwill be beneficial for the development of long run education and sustainableeconomic growth.
4.2.3. Effect of The Variation of Technology Parameter
Make partial derivative to the technology parameter in equations (13) ∼(17), and we get:
∂m
∂B= −ρ− n
B2< 0,
∂e
∂B= − ρ− n
B2(1 + ω)< 0 (22)
∂ν
∂B=
(ρ− n)(1 + ω + ε)B2(1 + ω)
> 0,∂gY
∂B= 1 > 0 (23)
The increase on technological parameter B of human capital accumu-lation efficiency indicates that if the marginal return to human capitalincreases, the representative family will decrease time spent on currentwork m and leisure e, and increase the learning time ν spent on accumu-lating human capital, this will make the labor supply in the economy riseand enhance the steady state growth rate of each variable in economy andgovernment’s education investment growth rate, therefore, the household’sdecision can promote sustainable economic growth and continual improve-ment of education level, then we have proposition 5:
Proposition 5. To enhance the technological parameter B of humancapital accumulation will make the representative family reduce time spenton working and leisure, and increase time spent on accumulating human

HUMAN CAPITAL EXTERNALITY 169
capital, which is positive to promote long term economic growth rate, knowl-edge spillover growth rate and government education investment growthrate, and ultimately cause the improvement of social welfare and educa-tion level.
In this section, we have studied the representative household’s time en-dowment allocation and each variable’s steady state growth rate throughsolving social planner’s problem, and we also have discussed the effect ofthe variation of every kind of parameters made on the representative house-hold’s time endowment allocation and each variable’s steady state growthrate via comparative static analysis, in the following section 5, we will fur-ther study the equilibrium under decentralized economy and government’spolicy choice problems on education.
5. EQUILIBRIUM UNDER DECENTRALIZED ECONOMYAND GOVERNMENT’S POLICY CHOICE PROBLEMS ON
EDUCATION
In this section, we will further study the equilibrium under decentral-ized economy and discuss government’s policy choice problem. At present,some scholars take education investment as public investment to study therelationship between education investment and economic growth, such asGlomm and Ravikumar (1992), Eckstein and Zilcha (1994), Glomm andRavikumar (2003), Zilcha (2003), Blankenau and Simpson (2004); mean-while, other researchers treat education as a private investment good toinvestigate the function mechanism between subsidy to education and eco-nomic growth, such as Zhang (1996, 2003), Bovenberg and Jacobs (2005),Blankenau (2005). Based on these existing research methods, we first treatgovernment education investment as a public good that was provided bythe government, so as to study the relationship between one lump-sun taxa-tion, government education investment and economic growth; next we takeeducation investment as a private investment good, in order to investigatethe effect that government education subsidy makes on economic growth.
5.1. Government’s Education Investment and Output Taxation
At first, we mainly analyze how government’s education expenditure af-fect long-term economic growth and knowledge spillover level, assumingthat the government levies one lump-sum taxation from output Y accord-ing to the tax rate τY so as to satisfy the need of education investment,under the condition that government accomplishes budget equilibrium con-

170 XIANGCAI MENG AND AZHONG YE
straint, we have:
R = G = τY · Y (24)
In equation (24), R is the lump-sum taxation, which equals government’seducation investment G, in this case, the representative family’s budgetconstraint is C = Y −G. In a decentralized economy, we assume that therepresentative family is just a very small part of the economy so that itcan’t affect the operation manner of the whole economy. As knowledgespillover level Z(t) is the function of output Y and education investmentG(t), so they treat the average knowledge spillover level z(t) in the economyas constant z(t), thus the representative household can enjoy the benefit ofeducation investment and can avoid extra investment. In the decentralizedeconomy, the decision agent is not the social planner but the representativehousehold, then the optimal problem for the representative family is:
maxm,e
∫ ∞
0
(ln c(t) + ε ln e(t) + ω ln z(t)) · exp(nt) · exp(−ρt)dt (25)
s.t. c = mh− τY y23
h = B · ν · h(t)− d · h(t) = [B(1− e−m)− d] · h(t)We define the Current-value Hamilton function as:
Hc = [ln(1− τY )mh + ε ln e + ω ln z(t)] + λ[B(1−m− e)− d]h (26)
there are two control variables m, e and one state variable h in this opti-mal control problem, in equation (26), λ(t) is the co-state variable, and itindicates the shadow price of state variable h(t) at time t, based on themodified maximum value theory, we can get the first order conditions whichmaximize (26) as follows:
∂Hc
∂m=
1(1− τY )u
− λBh = 0 (27)
∂Hc
∂e=
ε
e− λBh = 0 (28)
λ = −∂Hc
∂h+ (ρ− n)λ
= − 1(1− τY )h
− λ[B(1−m− e)− d] + (ρ− n)λ (29)
23As C(t) = m · h(t) · ent − τY Y , this indicates that total consumption minus onelump sum taxation, we divide the two sides by ent thus we can get per capita expressionc = mh − τY y.

HUMAN CAPITAL EXTERNALITY 171
equations (26) ∼ (29) together depicts the dynamic system that we studies,through solving the representative family’s optimal problem we can obtainthe conditions that household, government and each variable satisfies in thedecentralized economy when it is in its steady state, we can get proposition6:
Proposition 6. In the decentralized economy, the two following char-acters will hold in the steady state which we get through the representativehousehold’s optimal behavior:
(1) household’s optimal allocation of time is
m =ρ− n
B(30)
e =ε(1− τY )(ρ− n)
B(31)
(2) the steady state growth rate of each variable in the economy is:
gY = gZ = gC = gG = gh
= B − (ρ− n)− ε(1− τY )(ρ− n)− d + n (32)
gy = gz = gc = gg
= B − (ρ− n)− ε(1− τY )(ρ− n)− d (33)
The proof process is omitted here, please contact us for details if you areinterested in it.
Through comparing proposition 6 with proposition 1 we know that, inthe decentralized economy, the growth rate of each variable in the steadystate is all smaller than that of the social optimal level, from the perspectiveof economics, as there is strong externality in education investment and hu-man capital accumulation, the private return of human capital investmentis less than the social return of that, the household in the decentralizedeconomy doesn’t want to invest in education themselves and make otherpeople become “free riders”, hence, the magnitude of human capital invest-ment in the decentralized economy is less than that for the social optimallevel, which resulted that in steady state the growth rate generated by therepresentative family’s decision is smaller than the optimal growth rate;however, the government can induce sustainable economic growth for thedecentralized economy via adjusting output tax rate, as well as achieving

172 XIANGCAI MENG AND AZHONG YE
social optimal state, we can prove that24, the government’s optimal taxrate is:
τ∗Y =ω
1 + ω(34)
From proposition 6 we found that, the government can not only affectsteady state growth rate, but also can adjust the allocation of household’stime endowment via monitoring taxation rate, through simple comparativeanalysis we can find:
∂e
∂τY= −ε(ρ− n)
B< 0,
∂ν
∂τY=
ε(ρ− n)B
> 0,∂gY
∂τY= ε(ρ− n) > 0
So, we have the following proposition 7 and proposition 8:
Proposition 7. If ε 6= 0, the government imposes output tax whose rateis τY can reduce household’s demand to leisure e and increase learning timeν spent on accumulating human capital while not affecting the labor supplym, so as to promote the society’s knowledge level, which is beneficial to theeconomy’s sustainable economic growth; if ε = 0, the resource allocation inthe economy is not elastic anymore, then government’s taxation policy tostimulate growth will not function.
Proposition 8. In the decentralized economy, government can imposea lump-sum taxation whose optimal rate is τ∗Y = ω
1+ω , that is imposingpublic education investment policy, so as to enhance the household’s time ν
spent on accumulating human capital, this can promote education’s develop-ment and induce the decentralized economy to society’s optimal sustainablegrowth state.
Through the above analysis, we have studied the decentralized economy’sequilibrium problem and we also have made comparisons and modificationswith the society’s optimal level, which reveals the relationship existingbetween government’s one lump-sum taxation, education investment andeconomic growth. In the following analysis, we will study education in-vestment from another point of view, in order to investigate the effect that
24Here the optimal tax rate is not the rate which maximizes the government’s taxincome, it is rather the one which makes the growth rate of each variable in the de-centralized economy’s balanced growth path equal that for the social optimal balancedgrowth path, according to equations (17) and (32) we can have: τ∗Y = ω
1+ω.
HUMAN CAPITAL EXTERNALITY 173
government’s education subsidy makes on household behavior and economyequilibrium.
5.2. Household Education Investment and Government Educa-tion Taxation or Subsidy
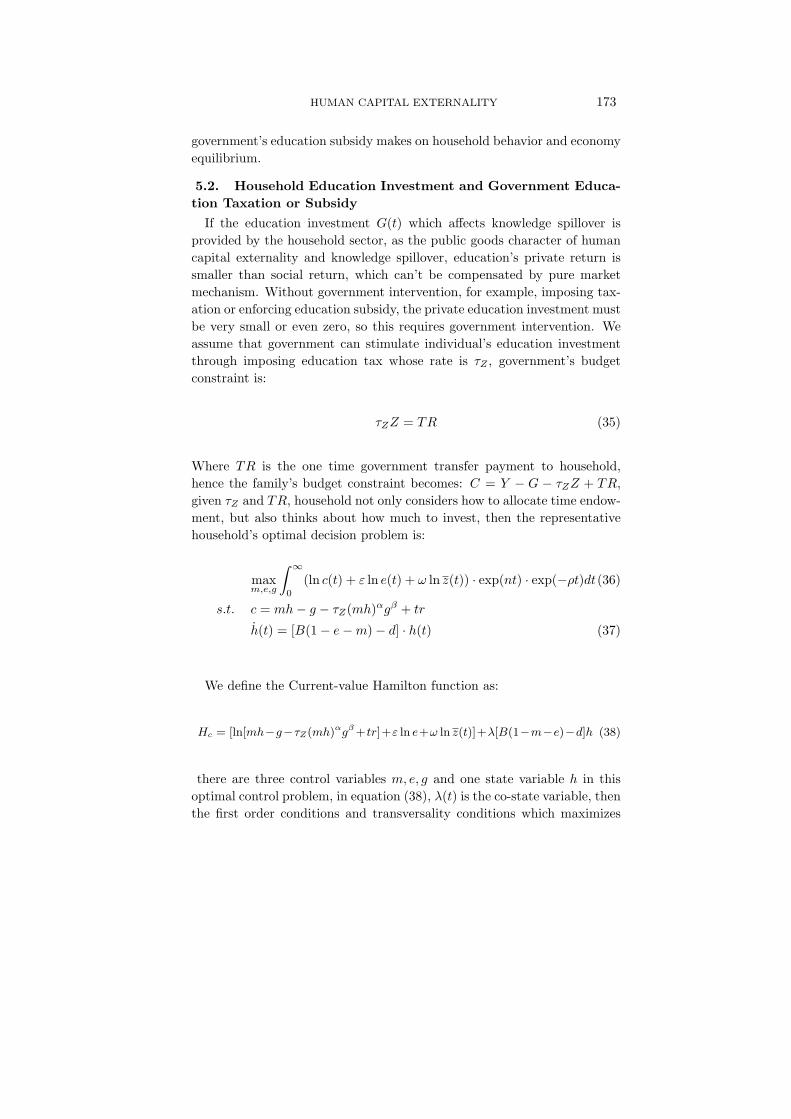
If the education investment G(t) which affects knowledge spillover isprovided by the household sector, as the public goods character of humancapital externality and knowledge spillover, education’s private return issmaller than social return, which can’t be compensated by pure marketmechanism. Without government intervention, for example, imposing tax-ation or enforcing education subsidy, the private education investment mustbe very small or even zero, so this requires government intervention. Weassume that government can stimulate individual’s education investmentthrough imposing education tax whose rate is τZ , government’s budgetconstraint is:
τZZ = TR (35)
Where TR is the one time government transfer payment to household,hence the family’s budget constraint becomes: C = Y − G − τZZ + TR,given τZ and TR, household not only considers how to allocate time endow-ment, but also thinks about how much to invest, then the representativehousehold’s optimal decision problem is:
maxm,e,g
∫ ∞
0
(ln c(t) + ε ln e(t) + ω ln z(t)) · exp(nt) · exp(−ρt)dt(36)
s.t. c = mh− g − τZ(mh)αgβ + tr
h(t) = [B(1− e−m)− d] · h(t) (37)
We define the Current-value Hamilton function as:
Hc = [ln[mh−g−τZ(mh)αgβ +tr]+ε ln e+ω ln z(t)]+λ[B(1−m−e)−d]h (38)
there are three control variables m, e, g and one state variable h in thisoptimal control problem, in equation (38), λ(t) is the co-state variable, thenthe first order conditions and transversality conditions which maximizes

174 XIANGCAI MENG AND AZHONG YE
(38) are as follows:
∂Hc
∂m=
h− τZαZ/m
c− λBh = 0 (39)
∂Hc
∂e=
ε
e− λBh = 0 (40)
∂Hc
∂g= −1 + τZβZ/g
c= 0 (41)
λ = −∂Hc
∂h+ (ρ− n)λ
= −m− τZαZ/h
c− λ[B(1−m− e)− d] + (ρ− n)λ (42)
limt→+∞
λh(t) exp[−(ρ− n)t] = 0 (43)
Through comparing the first order conditions (39) ∼ (43) for decentral-ized economies with that (8) ∼ (12) for social optimal solutions, we can findthat government can obtain optimal growth rate in a decentralized econ-omy equilibrium framework via imposing education tax or subsidy, whichresulted the optimal tax rate:
τ∗Z = − g
βZ= − gα
β(mh)α= −{β[c(1 + ω)− y]}α
ααβyα(44)
from the expression for optimal tax rate, we can see that, in order to keeppublic education investment continually growing and education sustainabledeveloping, government must give subsidies to the household according to(43) under the background of everlasting economic growth, which is consis-tent with our intuition, because of the existence of human capital external-ity, the private return of education investment is smaller that social return,so the economy requires government intervention to induce household’s in-vestment so as to achieve social optimal level, such we get the followingproposition 9:
Proposition 9. The government can enforce education policy, such aseducation subsidy, whose optimal subsidy rate is given by equation (44),to stimulate individual enhancing education investment, so as to make thehuman capital externality endogenous in the economy, and induce a decen-tralized economy to attain sustainable economic growth state.
Through analyzing equilibrium under decentralized economy, we havestudied the effect that government’s output tax makes on economic growth,

HUMAN CAPITAL EXTERNALITY 175
because of the existence of human capital externality and knowledge spillover,the dispersion decision equilibrium of education investment must be lowerthan that of the social optimal level, therefore, government can choose ap-propriate education policy to induce decentralized economy to achieve theoptimal state of sustainable economic growth.
6. EMPIRICAL ANALYSIS—RESEARCH BASED ONCHINA’S PROVINCE-LEVEL PANEL DATA
In the above theoretical analysis, we introduce human capital external-ity, knowledge spillover and labor-leisure decision into the framework con-structed by Uzawa (1965) and Lucas (1988), in order to study the shortrun effect and long term relationship that among representative family’slabor-leisure decision, knowledge spillover level, preference parameter andtechnological parameter variation, government education policy adjustmentand steady state economic growth rate. In this section, based on China’sprovince-level panel data, we first employ panel data model to make staticanalysis, in order to analyze the short run effect and static relationshipbetween them; then we use vector auto-regression model to make dynamicanalysis, so as to study the further long term and dynamic relationshipbetween them.
6.1. Data Source and Empirical Design
The data we employed in this paper is province-level panel data from29 provinces25 between 1989 and 2005, which is 17 years in total, andthe data comes from the database of National Bureau of Statistics (NBS)and that of China Economic Information Net (CEIN). At first, we use eachprovince’s resident consumption price index to adjust the regional gross do-mestic product (gdp), resident consumption level (cns), worker’s revenue(lin), total value of fixed asset investment (inv), government income (gin)into its corresponding real value. After that, based on the theory contentand availability of real data for each variable, we employ each province’slabor income lin as the proxy variable of household’s labor supply in theprocess of empirical studies, and we use resident’s consumption plane cns
25Because of data availability, we use 29 provinces which include: 13 eastern provinces,such as Beijing, Tianjin, Liaoning, Heilongjiang, Jilin, Hebei, Shandong, Shanghai,Jiangsu, Fujian, Zhejiang, Guangdong, Hainan; 6 middle provinces, for example, Anhui,Shanxi, Henan, Hubei, Hunan, Jiangxi; 10 western provinces, including Qinghai, Xin-jiang, Inner Mongolia, Guangxi, Sichuan, Xizang, Gansu, Yunnan, Guizhou, Shanxi, asChongqing was separated from Sichuan at 1997, so Chongqing’s data after 1998 are inte-grated with Sichuan’s, we are grateful to professor Zhao Xiliang for helpful suggestionshere.

176 XIANGCAI MENG AND AZHONG YE
to measure household’s leisure level26, we make use of average number ofuniversity graduate students as the proxy variable for society’s averageknowledge level; as tax is the main source of government’s finance income,we use each province’s finance income as the substitute variable for tax-ation. Finally, following the method dealing with health human capitalinvestment taken by Wang Dihai, Gong Liutang and Li Hongyi (2008), weemploy the number of universities in each province to measure human capi-tal level, thus we choose data for the 8 variables from 29 provinces between1989 and 2005, so the sample used in our paper includes 3944 data.
Based on the former theoretical study, the empirical part of our paperis divided into two sections: The first one deals with the static relation-ship existing between each variables, which is mainly accomplished throughpanel data model, and we also investigate the various performance of theserelations in different regions of China. The other section mainly focuses onthe dynamic relationships through constructing VAR model and makinguse of the impulse response function as well as the variance decompositiontechniques.
6.2. Short Term Effect and Static Relationship Analysis—ResearchBased on Panel Data Model
Here we focus on the static and short run effect between each variable andgdp, in order to make more elaborate studies on the various performances ofthe relationship in different areas, we make use of the traditional method todivide areas of China taken by Cai Fang and Du Yang (2000); Lin Yifu andLiu Mingxing (2003); Teng Jianzhou and Liang Qi (2006), and divide ourcountry into three regions consisting eastern, western and middle areas, weattempt to compare the coefficients of different areas so as to investigatethe economic principles behind it. We first study the summary statisticcharacter of the variables, and then make assumptions and regressions onthe specified model.
6.2.1. The Summary Statistic Characters of Our Variable
Employing software Stata 10.0, we get the basic statistic characters ofgdp, cns, lin, gin, hsn, atn, inv and pgr, the table 1 below reveals somebasic statistic characters of the variables and we will further give the Pear-
26We employ resident’s consumption expenditure to substitute household’s leisurelevel not only because of the unavailability of leisure data, but also because that it isclosely related with household’s leisure level, from economic intuition, gene rally speak-ing, the area whose resident’s consumption level is high always has very high leisurelevel.

HUMAN CAPITAL EXTERNALITY 177
son correlation coefficient between the 8 main variables in table 2. Basedon the outcome of table 2, gdp is dominant positively related with laborsupply lin and household leisure cns, this is consistent with our theoreti-cal analysis; gdp is also positively related with society’s average level atn
and human capital investment level hsn, which reveals that human capitalinvestment and knowledge level can promote economic growth. As for pop-ulation growth rate pgr, it is negatively related with gdp, which indicatesthat excessive population growth is not good for growth; however, gdp ispositively related with government taxation gin, this is controversial withour theory and intuition, we will further study this relation in the followinganalysis.
TABLE 1.
Statistical Characters of gdp, cns, lin, gin, hsn, atn, inv and pgr
variables mean Standard Min. Max. Number of
Error observations
gdp 830.0471 840.4445 38.00364 6140.420 493
cns 340.4758 303.1089 18.95809 2468.000 493
lin 402.7029 362.7755 18.14112 2424.772 493
hsn 40.6714 21.09978 4.000000 114.0000 493
atn 5.401546 5.668336 1.529680 34.16943 493
gin 396.1003 376.4117 13.77630 3298.865 493
inv 291.3858 328.2466 11.50186 2600.650 493
pgr 8.576146 4.638269 −1.90000 20.75000 493
Sources of table 1: (1) we calculate to get it via using Stata 10.0; (2) in theabove, the unit of gdp, cns, lin, gin, inv is a hundred billion yuan; the unit ofatn is in number; and the unit of pgr is in percent.
6.2.2. The Postulate and Regression Result of The Model
In the process of econometric analysis, we consider fixed effect model andstochastic effect model simultaneously. For fixed effect model, we reportthe F statistic to test whether fixed effect parameter is predominant or not;and for stochastic models, we mainly judge whether there exists stochasticeffect or not through Hausman Test. Via statistics test and econometricstest, our econometric outcome reveals that, almost all the Hausman Testsfor stochastic effect model consistently reject to accept stochastic effectmodel, even in the case of not rejecting, its regression results are almost thesame as that under the fixed model. Therefore, in the following analysis, wewill mainly report the outcome of fixed effect model; meanwhile, in orderto study the differences among various regions in China, we postulate and

178 XIANGCAI MENG AND AZHONG YE
regress the model according to the three regions of eastern, western andmiddle areas. We assume the regression equation of One-way fixed-effectmodel that only contains regional effect as follows:
gdpit = a0 + a1cnsit + a2linit + a3atnit + a4hsnit + a5ginit + a6invit
+a7pgrit +8+w∑j=8
ajDj + uit (45)
To meet the needs of empirical analysis, following the method taken byLin (1992), Yao and Shen (2006), we simultaneously study the Two-wayfixed-effect model which contains time effect and regional effect:
gdpit = b0 + b1cnsit + b2linit + b3atnit + b4hsnit + b5ginit + b6invit
+b7pgrit +8+w∑j=8
bjDj +8+w+17∑
j=8+w+1
bjTj + εit (46)
where i = 1, 2, 3, · · · , 29 indicates provinces, T = 1, 2, 3, · · · , 17 delegatestime, and uit, εit represents stochastic disturbance term, in equation (45)
and (46),8+w∑j=8
ajDj and8+w∑j=8
bjDj respectively represent the effect of re-
gional dummy variables; in equation (46),8+w+17∑
j=8+w+1
bjTj indicates the ef-
fect of time dummy variables, here w is the number of provinces includedin eastern, middle and western areas, when it indicates the eastern area,w = 13; while it comes to the middle, w = 6; as for the western areas,w = 10. Employing data from China’s 13 eastern provinces, 6 middleprovinces and 10 western provinces between 1989 and 2005, we regressequations (45) and (46), in the process of regressing, besides traditionalOLS, we also make use of maximum-likelihood estimator method in orderto make comparisons, the specific outcome for the three regions is in thefollowing table 3 and table 4.
The regression results of table 3 and table 4 reveal that: Firstly, from thevalue of R
2, LogLi. and Pr1 > F a, the fitting effect of equations (45) and
(46) to data is very good, and the fixed effect is statistically significant.Secondly, based on the results of z statistic and Pr1 > F b reported byStata, all the variables are significant at the 5% significant level. Thirdly,consider the sign of each variable, in the regression result of one-way andtwo-way fixed effect model, the signs of lin, atn, inv are all positive, which

HUMAN CAPITAL EXTERNALITY 179
TABLE 2.
The Pearson correlation coefficient for gdp, cns, lin, gin, hsn, atn, invand pgr (N = 493)
gdp cns lin gin hsn atn inv pgr
gdp 1
(0.000)
cns 0.9553 1
(0.000) (0.000)
lin 0.9776 0.9340 1
(0.000) (0.000) (0.000)
gin 0.9009 0.9038 0.8526 1
(0.000) (0.000) (0.000) (0.000)
hsn 0.7291 0.7271 0.7401 0.6963 1
(0.000) (0.000) (0.000) (0.000) (0.000)
atn 0.0402 −0.0223 −0.0375 0.1803 0.3282 1
(0.373) (0.621) (0.406) (0.000) (0.000) (0.000)
inv 0.9402 0.9082 0.9165 0.8428 0.7051 0.1170 1
(0.000) (0.000) (0.000) (0.000) (0.000) (0.009) (0.000)
pgr −0.4508 −0.4090 −0.4321 −0.4204 −0.5454 −0.5197 −0.4783 1
(0.000) (0.000) (0.000) (0.000) (0.000) (0.000) (0.000) (0.000)
Sources of table 2: (1) we calculate to get it through Stata 10.0; (2)the numbers in brackets is the pvalue of the dominant test to correlation coefficient.
indicate that the effect of labor supply, average knowledge level and physi-cal capital investment made on economic growth is positive, while negativesigns of gin and pgr indicate that the effect of government tax and popu-lation growth made on growth is negative, and this is consistent with ourtheoretical analysis. Fourthly, no matter the regression results of one-wayor two-way fixed effect, they all reveal that the coefficient of hsn in themiddle and western areas are negative, which is controversial to our the-ory, this indicates that in our sample, the human capital investment levelgenerated negative effect on economic growth. One possible explanation isthat because the migration and flow of educated individuals between re-gions, many educated from the middle and western regions migrate to theeast, thus causing detrimental effect to the economic growth of the sourceregion, therefore, the sign of hsn for these two regions is negative, this isone of the new phenomena that discovered in our study.
In the process of estimating, we choose both the GLS Fixed-effects es-timator and the Maximum-likelihood Random-effects estimator. From theregression results of one-way fixed effect models, the coefficients for theregression results of MLE estimate are almost the same to that for the FE

180 XIANGCAI MENG AND AZHONG YE
TABLE 3.
Regression Results I: the explained variable is the growth rate of gdp
Explanatory One-way fixed-effects Robustness
variables FE Estimator MLE Estimator Test
east middle west east middle west
cns 1.27697 1.66778 1.00819 1.27697 1.66778 1.00819 RT
(0.091) (0.154) (0.081) (0.087) (0.143) (0.077)
lin 0.63292 0.12723 0.21499 0.63292 0.12723 0.21499 RT
(0.071) (0.079) (0.076) (0.068) (0.074) (0.072)
atn 0.72040 6.28520 3.36752 0.72040 6.28520 3.36752 RT
(0.359) (0.743) (0.446) (0.204) (0.694) (0.421)
hsn 4.16449 −3.4271 −0.7103 4.16449 −3.4271 −0.7103 RT
(0.981) (1.022) (0.056) (0.935) (0.955) (0.053)
gin −0.0805 −0.2205 −0.2266 −0.0805 −0.2205 −0.2266 RT
(0.036) (0.081) (0.050) (0.034) (0.075) (0.047)
inv 0.59515 0.76605 0.74082 0.59515 0.76605 0.74082 RT
(0.037) (0.095) (0.058) (0.035) (0.089) (0.055)
pgr −4.9923 1.22082 −1.3903 −4.9923 1.22082 −1.3903 RT
(0.849) (0.172) (1.203) (0.763) (0.161) (1.141)
Regional yes yes yes yes yes yes RT
dummy
Time dummy
R2
0.9907 0.9862 0.9889
LogLi. 1210.64 512.281 781.797
Pr1 > F a 0.0000 0.0000 0.0001 0.0000 0.0000 0.0001
Pr1 > F b 0.0000 0.0000 0.0000 0.0000 0.0000 0.0001
estimate, but its standard errors are small than that of the RE estimate,so from the estimate accuracy, MLE estimate is superior to FE estimate;what’s more, the regression results of two-way effect model also indicatesthe superiority of MLE estimate. At the same time, from the regressionresults of one-way and two-way fixed effect models, the signs of atn andhsn both generated a slightly variation, this indicates that the unobserv-able time effect made effects to these two variables simultaneously in oursample period, actually, one possible reason is that as time elapsed, thatthe time trend for the number of students graduated and total universitiesis obvious resulted in this outcome, therefore, the estimate effect of one-way fixed effect is superior to that of the two-way fixed effect model, thestandard error of MLE estimate is smaller than that of FE estimate.

HUMAN CAPITAL EXTERNALITY 181
TABLE 4.
Regression Results II: the explained variable is the growth rate of gdp
Explanatory Two-way fixed-effects Robustness
variables FE Estimator MLE Estimator Test
east middle west east middle west
cns 1.24549 1.33669 0.88011 1.24549 1.33669 0.88011 RT
(0.098) (0.183) (0.085) (0.083) (0.178) (0.076)
lin 0.64265 0.29430 0.25465 0.64265 0.29430 0.25465 RT
(0.079) (0.108) (0.080) (0.072) (0.102) (0.071)
atn −2.1825 1.63537 0.86626 −2.1825 1.63537 0.86626 NO
(0.380) (0.123) (0.588) (0.298) (0.113) (0.528)
hsn 5.56596 −4.7336 −0.1671 5.56596 −4.7336 −0.1671 NO
(0.109) (0.143) (0.605) (0.098) (0.138) (0.543)
gin −0.0767 −0.5526 −0.3714 −0.0767 −0.5526 −0.3714 RT
(0.043) (0.141) (0.059) (0.036) (0.126) (0.053)
inv 0.57849 0.69996 0.72041 0.57849 0.69996 0.72041 RT
(0.041) (0.133) (0.060) (0.040) (0.095) (0.054)
pgr −6.1013 5.45099 −4.5972 −6.1013 5.45099 −4.5972 RT
(0.300) (0.356) (0.177) (0.283) (0.338) (0.159)
Regional yes yes yes yes yes yes RT
dummy
Time dummy yes yes yes yes yes yes RT
R2
0.9897 0.9928 0.9683
LogLi. 1086.39 476.825 765.856
Pr1 > F a 0.0000 0.0000 0.0000 0.0000 0.0000 0.0000
Pr1 > F b 0.0000 0.0000 0.0000 0.0000 0.0000 0.0000
Notes: (1) table 3 and table 4 are calculated through software Stata 10.0; (2) the original data is the paneldata from 29 Chinese provinces from 1989 to 2005; (3) the value in brackets are the standard error ofregression coefficients; (4) following Lin (1992), as these 29 regional dummy variable and 17 time dummyvariables all can pass the test, so we won’t give the related regression coefficient and standard error; (5)
R2
is the adjusted fitting accuracy, and LogLi. is the index to judge the accuracy of MLE estimation;(6) Pr1 > F a is the p value of the F statistic used to test the fixed effect model, and Pr1 > F b is the pvalue of the F statistic used to test the joint significance of explanatory variables; (7) RT indicates thatthe robustness test is satisfied.
As for regional differences, first of all, in fixed effect model, except thesigns of pgr is different among regions, the other factors’ functioning di-rection are the same among different regions, although the magnitude is alittle different, however, in the model of two-way fixed effect models, thesigns of pgr, atn and hsn all presents a little difference among regions, oneproper explanation is that while time passes, the high educated individu-als always flow among regions. Secondly, no matter one-way or two-way

182 XIANGCAI MENG AND AZHONG YE
fixed models, the short run effect of leisure decision cns made on economicgrowth is more higher in the middle area than western and eastern areas,perhaps this is resulted from the fact that there is very little leisure in themiddle area so the marginal utility is very high. Thirdly, the effect gener-ated by labor supply lin and human capital investment hsn for the easternarea is the highest, one possible reason is that there are more work oppor-tunity and the flow of educated workers in the east of China. Fourthly,the effect of physical capital investment for the middle and western areasare higher than that for the east, perhaps this can be attributed to thescarce of physical capital in those areas, just because of this, the functionsof taxation is more obvious in middle and west than in east, which is alsosupported empirically by our study.
6.2.3. The Robustness Test to The Regression Results
In the above we have analyzed the regression results, then we will wonderwhether the econometric results have robustness or not? Here, we will makerobustness test to this problem, the purpose of the robustness test is to seewhether the regression results are sensible to the new added explanatoryvariables. If the regression results turned to reverse when the new addedexplanatory variables emerges, then we can say that there is no robustnessin the previous regression results; or else, there will be robustness. Themethod by which we employ to test robustness is established by Levineand Renelt (1992), we conduct this through introducing this new variablegovernment expenditure gep to test the robustness of equations (45) and(46), for the test outcome please refer to the last column in table 3 andtable 4. As the signs of atn and hsn vary in the two-way effect model,hence the results reveal that the one-way fixed effect model is more robustthan the two-way fixed effect model.
Through the analysis of panel data model, we have already studied theshort run and static relationship existing among the variables, then we willconsider how their long term and dynamic relationship would be. In thenext section, we will further our study on this problem via employing VARmodel, impulse response function and variance decomposition principles.
6.3. Long Term and Dynamic Relationship Discussion—AnalysisBased on VAR Model
Based on the above theoretical analysis, we have known that the effectsgenerated by household’s labor supply decision lin, leisure decision cns,human capital investment level hsn in the short run and long run aredifferent. In the previous empirical analysis, we have already studied the

HUMAN CAPITAL EXTERNALITY 183
short run effects and static relations, hence, next, we will focus on theirdynamic relations and long run effects via employing VAR technology aswell as impulse response functions.
6.3.1. Unit Root Test
We made Augmented Dickey-Fuller Test to labor supply lin, leisure de-cision csn, human capital investment level hsn and output gdp, and foundthat they were all non-stationary time series, then we made ADF test totheir log values, please see table 5 for the results.
From table 5 we can find that, the absolute values of the t-statistic forADF test of ln(gdp), ln(lin), ln(cns), ln(hsn) are all smaller than that ofthe absolute values of the ADF statistic test critical values at 5% signif-icance level, which indicate that they are all non-stationary time series.However, the absolute values of the t-statistic for the one order differenceof M ln(cns), M ln(gin), M ln(hsn)’s ADF test are all larger than that ofthe absolute values of the ADF statistic test critical values at 5% signifi-cance level, M ln(gdp)’s is larger than that of the 10% significance level, sothey are one order integration series. As ln(gdp), ln(lin), ln(cns), ln(hsn)themselves are not stationary series, but they are stationary after one or-der difference. If we directly make regressions on them, there will be falseregression phenomena, therefore it is necessary to make co-integration testbetween them.
TABLE 5.
The Augmented Dickey-Fuller Test for Related Variables
Variable Variable name Test type t-statistic Critical Prob.
sign (e, T, d) value
ln(gdp) Log output (e, 0, 1) −2.572537 −2.627420 0.1219
ln(cns) Log leisure (e, 0, 1) −3.135327 −3.587527 0.0770
ln(lin) Log wage (e, 0, 1) −2.317449 −2.976263 0.0640
ln(hsn) Log human capital investment (e, 0, 1) −3.157108 −3.587527 0.0550
M ln(gdp) Difference of ln(gdp) (e, 0, 0) −2.872537 −2.627420∗ 0.0619∗
M ln(cns) Difference of ln(cns) (e, 0, 0) −3.735327 −3.587527 0.0370
M ln(lin) Difference of ln(lin) (e, 0, 0) −3.317449 −2.976263 0.0240
M ln(hsn) Difference of ln(hsn) (e, 0, 0) −4.157108 −3.587527 0.0150
Note: e and T respectively represent the test with constant term and trend term, d indicates the orderwe employed, ∗ means the critical value is calculated under 10% significance level, others are obtainedunder 5% significance level.

184 XIANGCAI MENG AND AZHONG YE
6.3.2. Co-Integration Test
We make use of the Trace Test of Characteristic Roots and MaximumEigenvalue Test simultaneously, and employ Johansen co-integration test tothe values of ln(gdp), ln(lin), ln(cns), ln(hsn) after one order difference, the“Deterministic trend assumption of test. Assume no deterministic trendin” in this paper is “intercept(no trend) in CE and test”, based on thechoice criteria of choosing lag intervals, we choose 1 order log, the regressionresults are reported in table 6 and table 7.
The two test methods of table 6 and table 7 both reveal that, no mat-ter the Trace Test of Characteristic Roots or Maximum Eigenvalue Test,their corresponding null hypothesis—None, which indicate that there is noco-integration relationship, its test statistic values are both larger than thecritical values under 5% significance level. This means that we can rejectthe hypothesis that there is no co-integration relationships under the con-fidence level of 95%, and there exists co-integration relationships betweenthe four variables ln(gdp), ln(lin), ln(cns), ln(hsn) after taking logarithm.The value for the test statistic of corresponding null hypothesis “At most1” which indicates there is at most one co-integration vector is smaller thanthe critical value under 5% significance level, which means that we can’treject the original hypothesis that there is at most one co-integration vec-tor. Therefore, there exists co-integration relationships between ln(gdp),ln(lin), ln(cns), ln(hsn) these four variables, what’s more, there is only oneco-integration vector, which indicates that there is long term equilibriumrelationship among these four variables ln(gdp), ln(lin), ln(cns), ln(hsn),that is to say, the relationship between our country’s output, labor supply,leisure, human capital investment does exist and it should be stable, so theregression that we makes on them is not false regression, hence the study onthe dynamic relations between output, labor supply, leisure, human capitalinvestment is meaningful.
TABLE 6.
Rank Test Results of Characteristic Roots
Hypothesized Trace 0.05
No. of CE(s) Eigenvalue Statistic Critical Value Prob.∗∗
None ∗ 0.861992 66.50718 47.85613 0.0004
At most 1 0.697264 26.80049 29.79707 0.1663
At most 2 0.511714 8.87708 15.49471 0.3749
At most 3 0.418194 1.124274 3.841466 0.2044
Note: ∗ indicates rejecting the null hypothesis under 5% significance level;∗∗ means the p value of Mackinnon-Haug-Michelis (1999).

HUMAN CAPITAL EXTERNALITY 185
TABLE 7.
Maximum Eigenvalue Test Results
Hypothesized Max-Eigen 0.05
No. of CE(s) Eigenvalue Statistic Critical Value Prob. ∗∗
None ∗ 0.861992 29.70669 27.58434 0.0263
At most 1 0.697264 17.92342 21.13162 0.1327
At most 2 0.511714 10.75280 14.26460 0.1670
At most 3 0.418194 1.124274 3.841466 0.5644
Note: ∗ indicates rejecting the null hypothesis under 5% significance level; ∗∗
means the p value of Mackinnon-Haug-Michelis (1999).
TABLE 8.
The Choosing Criteria of the Lag Period for the VAR Model
Lag LogL LR FPE AIC SC HQ
0 −409.2502 NA 4.54e+18 54.15627 55.31516 54.21562
1 −352.3406 42.68219∗ 5.56e+16 49.04257∗ 50.97405∗ 49.14148∗
2 −330.7012 41.33067 4.34e+16∗ 50.08373 53.67608 50.36021
Note: ∗ indicates the lag period is chosen under this rule.
6.3.3. The Construction of VAR Model
Based on the previous analysis, we choose output ln(gdp), labor supplyln(lin), leisure ln(cns), human capital investment ln(hsn) to construct afour dimension vector auto-regression model, the test results of the lagstructure for the model is reported in table 8:
Judging from the results of table 8, four of the five assessing indicesindicate that we should construct V AR(1), hence we choose the lag periodof our VAR model is 1, it has the following form:
yt = Γ0 + Γ1yt−1 + εt, t = 1, 2, . . . , T (47)
Where yt = (ln(gdp)t, ln(cns)t, ln(lin)t, ln(hsn)t)T is a 4 dimension endoge-nous variable vector, Γ is the parameter matrix to be estimated, ε is the 4dimension stochastic disturbance term, and model (47) is the basis of ourfollowing analysis.
Employing added up China’s province level panel data between 1989and 2005 to regress, the outcome reveals that27, the model’s total fittingaccuracy R2 is 0.999860, Adj. R-squared is 0.999650. By observing theresidual series of each equation we found that the residual is all white noise
27As the regression results of the vector auto-regression model will not be used in thefollowing analysis, we don’t report it in this paper, those who are interested in it maycontact us for details.

186 XIANGCAI MENG AND AZHONG YE
series, and the inverse roots of the characteristic polynomial are all in theunit round, as figure 1 demonstrates, so the model is stable, therefore themodel can be further used to analyze their dynamic relationships.
FIG. 1. The figure of inverse roots for the characteristic polynomial
6.3.4. Impulse Response Function Analysis
Impulse response function analysis is used to measure the effect madeby the impulse of one standard error from stochastic disturbance term onother endogenous variables’ current and future values, it is the effect of theimpulse that one endogenous variable made on other endogenous variables,generally we employ impulse response function to assess the contents ofVAR model.
It is required that the endogenous variable series must be stationarywhile imposing impulse response analysis28, however, our endogenous vari-ables in the VAR model ln(gdp), ln(cns), ln(lin), ln(hsn) are all one orderintegration. So we need to take one order difference to them, so as to makethem become stationary series M ln(gdp), M ln(cns), M ln(lin), M ln(hsn),and then we will make impulse response analysis. What’s more, as we knowthat the order of variable postulate will affect the analytical result, based
28If the endogenous variable series are not stationary, the figure of the impulse re-sponse function will appear to be the trend of dispersing, as for the theoretical analysis,refer to James D. Hamilton: Time Series Analysis, Beijing, China Social Science Press,1999.

HUMAN CAPITAL EXTERNALITY 187
on our research purpose, we postulate the order of our variable is: economicgrowth, leisure, labor supply and human capital investment. According tothe above estimated VAR model, we can get the following figures on im-pulse response functions, see figures 2 to 17, where, the horizontal axisrepresents the functioning period of the impulse generated by one unit ofCholesky standard innovation, and its unit is year, the vertical axis repre-sents the corresponding variable, the solid line delegates impulse responsefunction’s curve, and the dashed line represents the deviation band of thetwo times positive an negative standard error.
From figure 2 we can see that, the effect generated by the variation ofcurrent economic growth on itself is positive in the first three period, and itbecomes negative from the fourth period. One possible explanation is thatChina’s economic growth consumes a lot of resources, to achieve sustainableeconomic growth, we have to make effective use of the economic resources.From figure 3 and 4, we can see that present time leisure M ln(cns) andlabor supply M ln(lin) make similar variation trend to economic growth, inthe first two period, they constrain economic growth, and from the thirdperiod on, they promote economic growth, which indicates that household’slabor-leisure decisions in the micro-level may generate different effect toeconomic growth both in the long run and short run. The response valuesof economic growth to leisure and labor supply are respectively attainingthe maximum value of 47.54773 and 173.48000, after that, they graduallydecreases to 0, and this provides evidence that proposition 3 can be held.Figure 5 reveals that, when human capital was hit by one unit Choleskyinnovation in the positive direction, its effect to economic growth is alwayspositive, and reaches its peak value at 320.9155, then the response valueof economic growth to human capital investment gradually decreases to 0,which testifies the conclusions given by proposition 4.
FIG. 2. The impulse of economicgrowth to itself
FIG. 3. The impulse of leisure to eco-nomic growth

188 XIANGCAI MENG AND AZHONG YE
FIG. 4. The impulse of labor supplyto economic growth
FIG. 5. The impulse of human capitalto growth
FIG. 6. The impulse of economicgrowth to leisure
FIG. 7. The impulse of leisure to itself
FIG. 8. The impulse of labor supplyto leisure
FIG. 9. The impulse of human capitalto growth
Figure 6 reveals that, the impulse of economic growth to leisure in thefirst two period is positive, then it becomes negative continually, one possi-ble explanation is that our economic growth depends more on labor input.Figure 7 indicates that, the impulse trend of leisure to itself is ambiguousin the beginning period, however, after the second period, the impulse is al-ways positive, and the response value achieve its maximum value of 22.381.Figure 8 and Figure 9 demonstrate that the impulses of labor supply and

HUMAN CAPITAL EXTERNALITY 189
human capital to leisure are always positive, as time elapsed, the deviationband of standard error appears to be increasing, which indicates that theuncertainty is rising, this provides empirical experience for proposition 5.
Figure 10 indicates that, the impulse of economic growth to labor supplyin the first three periods is always changing, but overall, it appears tobe dominated by negative impulses, which proves the conclusion that oureconomic growth is promoted through high labor inputs once again. Figure11 tells us that, the effect that leisure made on labor supply is a littleweak, but it appears to be increasing in all, one possible reason is thatleisure raises the working activity and production efficiency of the laborforce. Figures 12 and 13 indicate that there is some kind of inertia in laborsupply, which is consistent with the actual case of our labor market, what’smore, human capital investment promotes labor supply, and this is mainlybecause it can enhance the production efficiency for each unit of labor.
FIG. 10. The impulse of economicgrowth to labor supply
FIG. 11. The impulse of leisure to la-bor supply
FIG. 12. The impulse of labor supplyto itself
FIG. 13. The impulse of human cap-ital to labor supply
Figure 14 reveals that, the impulse of economic growth to human capitalinvestment at its early period is negative, after the fifth period, it turns outto be positive, this is mainly because in the beginning of economic growth,

190 XIANGCAI MENG AND AZHONG YE
FIG. 14. The impulse of economicgrowth to human capital
FIG. 15. The impulse of leisure to hu-man capital
as the limited capital amount, economic growth consumes most of the cap-ital which may be used to human capital investment otherwise, however, asthe economic develops, the total capital increases in the economy, and thusprovides more money for human capital investment, this testifies the con-clusions of proposition 5. Figure 15 indicates that, the effect of leisure tohuman capital is uncertain in the short run, but it will make weak negativeeffect in the medium and long run, this is consistent with some conclusionsin proposition 3 and proposition 4.
FIG. 16. The impulse of labor supplyto human capital
FIG. 17. The impulse of human cap-ital to itself
Figure 16 and figure 17 show that the variation trend of the effect thatlabor supply and human capital made on human capital appears to be sim-ilar, i.e., that the short run effect is positive while the medium and long runeffects are negative. Which indicates that these two factors don’t generateperpetual impulses to human capital, and the conclusion is consistent withproposition 5. Meanwhile, we found that, the impulse of economic growthto human capital investment is smaller than that of human capital to eco-nomic growth, one proper explanation is that Chinese parents always payattention to the education of their children, no matter what the economic

HUMAN CAPITAL EXTERNALITY 191
and other conditions are, the relative money they spent on education willnever vary a lot, and this is also one of the new discoveries in our research.
6.3.5. Variance Decomposition Analysis
Similarly, based on the estimated VAR model we can get the followingvariance decomposition figures, see figures 18 to 33. Where, the horizon-tal axis represents the lag periods of functioning impulses, whose unit isyear, and the vertical axis indicates the contribution rate of all variable tothe studied variable, the solid line delegates the curve of the contributionfunction.
FIG. 18. The contribution of eco-nomic growth to itself
FIG. 19. The contribution of leisureto growth
FIG. 20. The contribution of laborsupply to growth
FIG. 21. The contribution of humancapital to growth
32
0
20
40
60
80
100
2 4 6 8 10 12 140
20
40
60
80
100
2 4 6 8 10 12 14
Figure 20. The contribution of labor supply to growth Figure21. The contribution of human capital to growth From figure 18 to figure 21, we can see that in the contribution rate of economic growth, the
contribution of economic growth itself is the largest, but its contribution is decreasing, in the 15th
period, it is 30.60565. The second and third contributors are human capital investment and labor
supply, in the 15th period, their contribution rates are respectively 51.66549 and 16.44745, this
fully demonstrates that in the long run, the effect of human capital and labor supply to economic
growth is increasing. What’s more, the contribution of leisure to economic growth is small, but
the trends for the contribution of the latter three are all increasing.
0
20
40
60
80
100
2 4 6 8 10 12 140
20
40
60
80
100
2 4 6 8 10 12 14
Figure 22. The contribution of economic growth to leisure Figure 23. The contribution of leisure to itself
0
20
40
60
80
100
2 4 6 8 10 12 140
20
40
60
80
100
2 4 6 8 10 12 14
Figure 24. The contribution of labor supply to leisure Figure 25. The contribution of human capital to leisure From figure 22 to figure 25, in the variation contribution rate of leisure, the contribution of
human capital is the largest, but it appears to be decreasing, in the 15th period, it is 53.50823. The
ones following that are economic growth and labor supply, in the 15th period their contribution
rate are respectively 25.85818 and 16.77376, of which, the contribution rate of economic growth
to leisure is increasing and that of labor supply is decreasing. Furthermore, the contribution of
From figure 18 to figure 21, we can see that in the contribution rate ofeconomic growth, the contribution of economic growth itself is the largest,but its contribution is decreasing, in the 15th period, it is 30.60565. Thesecond and third contributors are human capital investment and labor sup-ply, in the 15th period, their contribution rates are respectively 51.66549and 16.44745, this fully demonstrates that in the long run, the effect ofhuman capital and labor supply to economic growth is increasing. What’s

192 XIANGCAI MENG AND AZHONG YE
more, the contribution of leisure to economic growth is small, but the trendsfor the contribution of the latter three are all increasing.
FIG. 22. The contribution of eco-nomic growth to leisure
FIG. 23. The contribution of leisureto itself
32
0
20
40
60
80
100
2 4 6 8 10 12 140
20
40
60
80
100
2 4 6 8 10 12 14
Figure 20. The contribution of labor supply to growth Figure21. The contribution of human capital to growth From figure 18 to figure 21, we can see that in the contribution rate of economic growth, the
contribution of economic growth itself is the largest, but its contribution is decreasing, in the 15th
period, it is 30.60565. The second and third contributors are human capital investment and labor
supply, in the 15th period, their contribution rates are respectively 51.66549 and 16.44745, this
fully demonstrates that in the long run, the effect of human capital and labor supply to economic
growth is increasing. What’s more, the contribution of leisure to economic growth is small, but
the trends for the contribution of the latter three are all increasing.
0
20
40
60
80
100
2 4 6 8 10 12 140
20
40
60
80
100
2 4 6 8 10 12 14
Figure 22. The contribution of economic growth to leisure Figure 23. The contribution of leisure to itself
0
20
40
60
80
100
2 4 6 8 10 12 140
20
40
60
80
100
2 4 6 8 10 12 14
Figure 24. The contribution of labor supply to leisure Figure 25. The contribution of human capital to leisure From figure 22 to figure 25, in the variation contribution rate of leisure, the contribution of
human capital is the largest, but it appears to be decreasing, in the 15th period, it is 53.50823. The
ones following that are economic growth and labor supply, in the 15th period their contribution
rate are respectively 25.85818 and 16.77376, of which, the contribution rate of economic growth
to leisure is increasing and that of labor supply is decreasing. Furthermore, the contribution of
FIG. 24. The contribution of laborsupply to leisure
FIG. 25. The contribution of humancapital to leisure
32
0
20
40
60
80
100
2 4 6 8 10 12 140
20
40
60
80
100
2 4 6 8 10 12 14
Figure 20. The contribution of labor supply to growth Figure21. The contribution of human capital to growth From figure 18 to figure 21, we can see that in the contribution rate of economic growth, the
contribution of economic growth itself is the largest, but its contribution is decreasing, in the 15th
period, it is 30.60565. The second and third contributors are human capital investment and labor
supply, in the 15th period, their contribution rates are respectively 51.66549 and 16.44745, this
fully demonstrates that in the long run, the effect of human capital and labor supply to economic
growth is increasing. What’s more, the contribution of leisure to economic growth is small, but
the trends for the contribution of the latter three are all increasing.
0
20
40
60
80
100
2 4 6 8 10 12 140
20
40
60
80
100
2 4 6 8 10 12 14
Figure 22. The contribution of economic growth to leisure Figure 23. The contribution of leisure to itself
0
20
40
60
80
100
2 4 6 8 10 12 140
20
40
60
80
100
2 4 6 8 10 12 14
Figure 24. The contribution of labor supply to leisure Figure 25. The contribution of human capital to leisure From figure 22 to figure 25, in the variation contribution rate of leisure, the contribution of
human capital is the largest, but it appears to be decreasing, in the 15th period, it is 53.50823. The
ones following that are economic growth and labor supply, in the 15th period their contribution
rate are respectively 25.85818 and 16.77376, of which, the contribution rate of economic growth
to leisure is increasing and that of labor supply is decreasing. Furthermore, the contribution of
From figure 22 to figure 25, in the variation contribution rate of leisure,the contribution of human capital is the largest, but it appears to be de-creasing, in the 15th period, it is 53.50823. The ones following that areeconomic growth and labor supply, in the 15th period their contributionrate are respectively 25.85818 and 16.77376, of which, the contributionrate of economic growth to leisure is increasing and that of labor supplyis decreasing. Furthermore, the contribution of leisure to itself is mini-mum and decreasing, this reveals that leisure is an endogenous variablethat was determined by other economic variables, its inertia is relativelysmall. Which indicates that there is a little difference between leisure andconsumption habit, this is also a new conclusion that we found out in ourresearch different from the existing studies.
Figures 26 to 29 reveal that, in the contribution rate to the variationof labor supply, the contribution of leisure is the largest and it appearsthe trend of decreasing, in the 15th period it is 32.14079. The factors

HUMAN CAPITAL EXTERNALITY 193
FIG. 26. The contribution of growthto labor supply
FIG. 27. The contribution of leisureto labor supply
33
leisure to itself is minimum and decreasing, this reveals that leisure is an endogenous variable that
was determined by other economic variables, its inertia is relatively small. Which indicates that
there is a little difference between leisure and consumption habit, this is also a new conclusion that
we found out in our research different from the existing studies.
0
20
40
60
80
100
2 4 6 8 10 12 140
20
40
60
80
100
2 4 6 8 10 12 14
Figure26.The contribution of growth to labor supply Figure27.The contribution of leisure to labor supply
0
20
40
60
80
100
2 4 6 8 10 12 140
20
40
60
80
100
2 4 6 8 10 12 14
Figure 28. The contribution of labor supply to itself Figure 29. The contribution of human capital to labor supply Figures 26 to 29 reveal that, in the contribution rate to the variation of labor supply, the
contribution of leisure is the largest and it appears the trend of decreasing, in the 15th period it is
32.14079. The factors following that are economic growth and human capital investment, in the
15th period, their contribution rates are 21.75544 and 32.77845 respectively, what’s more, the
contributions of the two are all increasing. Finally, the contribution of labor to itself is the smallest
and decreasing, this indicates that there is a little inertia in china’s labor supply, which is
consistent with our theory analysis and impulse response analysis.
From figures 30 to 33 we can see that, in the contribution rate of the variation of human
capital investment, the contribution of economic growth and that of human capital investment are
relatively larger, in the 15th period their contribution rates are respectively 38.37621 and 40.64931.
What’s more, the contribution rate of labor supply to human capital is relatively high and
increasing, in the 15th period its contribution rate is 13.11611. Finally, the contribution rate of
leisure to human capital is the smallest and decreasing, in the 15th period it is 7.858368, which
indicates that China’s human capital investment is mainly affected by economic growth and the
existing human capital stock, the effect of leisure and labor supply contribute quite a little to our
country’s human capital investment, however, in the long run, labor supply may contribute a lot to
FIG. 28. The contribution of laborsupply to itself
FIG. 29. The contribution of humancapital to labor supply
33
leisure to itself is minimum and decreasing, this reveals that leisure is an endogenous variable that
was determined by other economic variables, its inertia is relatively small. Which indicates that
there is a little difference between leisure and consumption habit, this is also a new conclusion that
we found out in our research different from the existing studies.
0
20
40
60
80
100
2 4 6 8 10 12 140
20
40
60
80
100
2 4 6 8 10 12 14
Figure26.The contribution of growth to labor supply Figure27.The contribution of leisure to labor supply
0
20
40
60
80
100
2 4 6 8 10 12 140
20
40
60
80
100
2 4 6 8 10 12 14
Figure 28. The contribution of labor supply to itself Figure 29. The contribution of human capital to labor supply Figures 26 to 29 reveal that, in the contribution rate to the variation of labor supply, the
contribution of leisure is the largest and it appears the trend of decreasing, in the 15th period it is
32.14079. The factors following that are economic growth and human capital investment, in the
15th period, their contribution rates are 21.75544 and 32.77845 respectively, what’s more, the
contributions of the two are all increasing. Finally, the contribution of labor to itself is the smallest
and decreasing, this indicates that there is a little inertia in china’s labor supply, which is
consistent with our theory analysis and impulse response analysis.
From figures 30 to 33 we can see that, in the contribution rate of the variation of human
capital investment, the contribution of economic growth and that of human capital investment are
relatively larger, in the 15th period their contribution rates are respectively 38.37621 and 40.64931.
What’s more, the contribution rate of labor supply to human capital is relatively high and
increasing, in the 15th period its contribution rate is 13.11611. Finally, the contribution rate of
leisure to human capital is the smallest and decreasing, in the 15th period it is 7.858368, which
indicates that China’s human capital investment is mainly affected by economic growth and the
existing human capital stock, the effect of leisure and labor supply contribute quite a little to our
country’s human capital investment, however, in the long run, labor supply may contribute a lot to
following that are economic growth and human capital investment, in the15th period, their contribution rates are 21.75544 and 32.77845 respectively,what’s more, the contributions of the two are all increasing. Finally, thecontribution of labor to itself is the smallest and decreasing, this indicatesthat there is a little inertia in china’s labor supply, which is consistent withour theory analysis and impulse response analysis.
From figures 30 to 33 we can see that, in the contribution rate of the varia-tion of human capital investment, the contribution of economic growth andthat of human capital investment are relatively larger, in the 15th periodtheir contribution rates are respectively 38.37621 and 40.64931. What’smore, the contribution rate of labor supply to human capital is relativelyhigh and increasing, in the 15th period its contribution rate is 13.11611.Finally, the contribution rate of leisure to human capital is the smallestand decreasing, in the 15th period it is 7.858368, which indicates thatChina’s human capital investment is mainly affected by economic growthand the existing human capital stock, the effect of leisure and labor supplycontribute quite a little to our country’s human capital investment, how-

194 XIANGCAI MENG AND AZHONG YE
ever, in the long run, labor supply may contribute a lot to human capitalinvestment, this can be seen from the variance decomposition table.
FIG. 30. The contribution of growthto human capital
FIG. 31. The contribution of leisureto human capital
34
human capital investment, this can be seen from the variance decomposition table.
0
10
20
30
40
50
2 4 6 8 10 12 140
10
20
30
40
50
2 4 6 8 10 12 14
Figure 30. The contribution of growth to human capital Figure 31. The contribution of leisure to human capital
0
10
20
30
40
50
2 4 6 8 10 12 140
10
20
30
40
50
2 4 6 8 10 12 14
Figure 32. The contribution of labor supply to human capital Figure 33. The contribution of human capital to itself In summary, the outcome of the impulse response functions reveals that, the short run effects
and long term impulses of leisure, labor supply and human capital to economic growth are
different, and this testified the theoretical analysis conclusions of endogenous labor-leisure
decisions from the empirical level. The results of variance decomposition reveal that the main
contributors for the variation of different variables are different, and as time elapsed, the relative
significance of different economic variables are also changing, which provides theoretical and
empirical reflections on studying the relative importance of each concerned element.
7. CONCLUSIONS
In this paper, we have studied the inner relationship of endogenous labor supply, human
capital externality, knowledge spillover and sustainable economic growth as well as government’s
choice problem of education policy and their effect on the growth rate of balanced growth path via
simultaneously introducing human capital externality, knowledge spillover and endogenous labor-
leisure decision into the framework constructed by Uzawa (1965) and Lucas (1988).
The results of the theory analysis indicate that, firstly, the allocation behavior of household in
the micro-level will affect the country’s growth rate of macro-economy. Secondly, the magnitude
of human capital externality, knowledge spillover level will also affect the growth rate of a
country’s macro economy. Thirdly, through comparative static analysis we found that the variation
of different kinds of parameters will generate different effect on the economy’s growth rate in the
FIG. 32. The contribution of laborsupply to human capital
FIG. 33. The contribution of humancapital to itself
34
human capital investment, this can be seen from the variance decomposition table.
0
10
20
30
40
50
2 4 6 8 10 12 140
10
20
30
40
50
2 4 6 8 10 12 14
Figure 30. The contribution of growth to human capital Figure 31. The contribution of leisure to human capital
0
10
20
30
40
50
2 4 6 8 10 12 140
10
20
30
40
50
2 4 6 8 10 12 14
Figure 32. The contribution of labor supply to human capital Figure 33. The contribution of human capital to itself In summary, the outcome of the impulse response functions reveals that, the short run effects
and long term impulses of leisure, labor supply and human capital to economic growth are
different, and this testified the theoretical analysis conclusions of endogenous labor-leisure
decisions from the empirical level. The results of variance decomposition reveal that the main
contributors for the variation of different variables are different, and as time elapsed, the relative
significance of different economic variables are also changing, which provides theoretical and
empirical reflections on studying the relative importance of each concerned element.
7. CONCLUSIONS
In this paper, we have studied the inner relationship of endogenous labor supply, human
capital externality, knowledge spillover and sustainable economic growth as well as government’s
choice problem of education policy and their effect on the growth rate of balanced growth path via
simultaneously introducing human capital externality, knowledge spillover and endogenous labor-
leisure decision into the framework constructed by Uzawa (1965) and Lucas (1988).
The results of the theory analysis indicate that, firstly, the allocation behavior of household in
the micro-level will affect the country’s growth rate of macro-economy. Secondly, the magnitude
of human capital externality, knowledge spillover level will also affect the growth rate of a
country’s macro economy. Thirdly, through comparative static analysis we found that the variation
of different kinds of parameters will generate different effect on the economy’s growth rate in the
In summary, the outcome of the impulse response functions reveals that,the short run effects and long term impulses of leisure, labor supply andhuman capital to economic growth are different, and this testified the the-oretical analysis conclusions of endogenous labor-leisure decisions from theempirical level. The results of variance decomposition reveal that the maincontributors for the variation of different variables are different, and as timeelapsed, the relative significance of different economic variables are alsochanging, which provides theoretical and empirical reflections on studyingthe relative importance of each concerned element.
7. CONCLUSIONS
In this paper, we have studied the inner relationship of endogenous laborsupply, human capital externality, knowledge spillover and sustainable eco-nomic growth as well as government’s choice problem of education policy

HUMAN CAPITAL EXTERNALITY 195
and their effect on the growth rate of balanced growth path via simultane-ously introducing human capital externality, knowledge spillover and en-dogenous labor- leisure decision into the framework constructed by Uzawa(1965) and Lucas (1988).
The results of the theory analysis indicate that, firstly, the allocationbehavior of household in the micro-level will affect the country’s growthrate of macro-economy. Secondly, the magnitude of human capital ex-ternality, knowledge spillover level will also affect the growth rate of acountry’s macro economy. Thirdly, through comparative static analysiswe found that the variation of different kinds of parameters will generatedifferent effect on the economy’s growth rate in the long run and shortterm, the increase of preference parameters will enhance the growth rate ofthe economy, but it will low the long term growth rate; however, the varia-tion of knowledge spillover parameter and technological parameter will pro-mote economic growth in the long run and the development of education.Fourthly, as the existence of human capital externality, the equilibrium ofthe decentralized economy can’t achieve social optimal state, governmentcan impose a lump-sum output taxation, education taxation or subsidy toinduce the decentralized economy to achieve society’s optimal state.
We also make empirical studies on the relationships existing among ourcountry’s province level economic growth and its determinants throughemploying panel data from 29 provinces between 1989 and 2005. We makeuse of panel data model to study their static relationship and short termeffect while we employ VAR technology, impulse response function andvariance decomposition principle to investigate their dynamic relationshipand long term effect.
The research of employing panel data model reveals that, for our inter-provincial panel data: First of all, gdp growth is positively related withleisure decision cns, labor supply lin, average knowledge level atn, but it isnegatively related to population growth rate pgr, government taxation gin,and these results are all consistent with our theoretical analysis. Secondly,no matter the regression results of one-way or two-way fixed effect, they allreveal that the relationship between hsn and gdp growth rate is negativefor the middle and western areas, this is controversial to our theoreticalanalysis. One possible explanation is that in the range of our sample, asthe migration and flow of educated individuals between regions, the humancapital investment generates detrimental effect to the middle and westernregions. The corresponding policy implication is that government shouldgive some subsidy or policy support to develop education in these regions.Thirdly, the short run effect that leisure decision cns made on economic

196 XIANGCAI MENG AND AZHONG YE
growth is much higher in the middle area than western and eastern areas,which may be resulted from the fact that there is very little leisure inthe middle area so the marginal utility is very high. Fourthly, the effectgenerated by labor supply lin and human capital investment hsn for theeastern area is the highest, our explanation is that there are more workopportunities and the flow of educated workers in the east of China. Fifthly,the effects of physical capital investment for the middle and western areasare higher than that for the east, which can be attributed to the scarce ofphysical capital in those areas. Finally, the results of robustness test provethe effectiveness of our outcome as well as the robustness of our model.
The dynamic analytical results of VAR model reveal that, the short runrelationships and long term effects between labor supply lin, leisure decisioncns, human capital investment hsn and economic growth are different,what’s more, the effects that labor supply lin and human capital investmenthsn made on economic output gdp are positive, and its long term effects aregreater than its short run effect. Meanwhile, we found that the responseof human capital investment to output is relatively small, one possiblereason is that Chinese residents always pay more attention to education.Additionally, the contributions of human capital and labor supply to theother variables are most dominant. In our analysis, because of the problemof data availability, in dynamic analysis we don’t take taxation and otherfactors into consideration. Furthermore, the main data we employed in thispaper belongs to the macro level, the applicability of our theory to microdata still needs to be tested, we will further study these problems in ourfuture work.
REFERENCESAghion, P. and Howitt, P., 1998. Endogenous Growth Theory. MIT Press, Cambridge,MA.
Acemoglu, Daron J., 2007. Introduction to Modern Economic Growth. Manuscript.Department of Economics, MIT.
Acemoglu, Daron J. and Angrist. Joshua, 2000. How large are the social returns to ed-ucation? Evidence from compulsory schooling laws. NBER Macroeconomics Annual2000, 9-59.
Barro, R., 1990. Government spending in a simple model of endogenous growth.Journal of Political Economy 98, 103-125.
Cass. D., 1965. Optimum growth in an aggregative model of capital accumulation.Review of Economic Studies 32: July, 233-240.
Cameron, Stephen V. and Taber. Christopher, 2000. Borrowing constraints and thereturns to schooling. NBER Working Paper, No. w7761.
Duranton, G., 2001. Endogenous labor supply, growth, and overlapping generation.Journal of Economic Behavior and Organization 44, 295-314.

HUMAN CAPITAL EXTERNALITY 197
Eckstein, Zvi. and Zilcha. Itzhak, 1994. The effects of compulsory schooling on growth,income distribution and welfare. Journal of Public Economics 54: 3, 339-359.
Grossman, M., 1972. The demand for health: A theoretical and empirical investiga-tion. Occasional paper No.119, New York: Columbia University Press (for NBER).
Glomm, Gerhard. and B. Ravikumar, 2003. Public education and income inequality.European Journal of Political Economy 19 :2, 289-300.
Geraint, Johnes., 2006. Education and economic growth. For presentation as thetwelfth lecture in the Eric John Hanson Memorial Lecture Series at the Departmentof Economics, University of Alberta, Edmonton.
Johannes, Hers., 1998. Human capital and economic growth: A survey of the litera-ture. cpb report 2, 36-41.
Koopmans, T., 1965. On the Concept of Optimal Economic Growth. The EconometricApproach to Development Planning. Amesterdam: North Holland.
King, Robert, G. and Rebelo. Sergio, 1990. Public policy and economic growth: De-veloping neoclassical implications. Journal of Political Economy 98 :5, 126-150.
Kodde, David, A., Josef, M., and M. Ritzen, 1985. The demand for education undercapital market imperfections. European Economic Review 28:3, 347-362.
Krueger, Alan, B., and Lindahl. Mikael, 2001. Education for growth: Why and forwhom? Journal of Economic Literature 39:4, 1101-1136.
Lucas, Robert. E., 1988. On the mechanics of economic development. Journal ofMonetary Economics 22:1, 3-42.
Mankiw, Gregory, N., D. Romer, and David N. Weil, 1992. A contribution to theempirics of economic growth. Quarterly Journal of Economics 107:2, 407-437.
Moretti, Enrico., 2002. Estimating the social return to higher education: Evidencefrom longitudinal and repeated cross sectional data. NBER Working Paper No. 9108.
Massimo, Giannini., 2007. National vs. local funding for education: Effects on growthand inequality. SSRN Working Paper Abstract id=952499.
Ortigueira, Salvador., 1998. Fiscal policy in an endogenous growth model with humancapital accumulation. Journal of Monetary Economics 42:2, 323-355.
Rebelo, Sergio., 1991. Long-run policy analysis and long-run growth. Journal of Po-litical Economy 99:3, 500-521.
Rob, A., Wilson. and Geoff, Briscoe., 2004. The impact of human capital on economicgrowth: A review. Third report on vocational training research in Europe: Backgroundreport. Luxembourg: Office for Official Publications of the European Communities.Cedefop Reference series 54, 13-65.
Romer, Paul, M., 1986. Increasing returns and long-run growth. Journal of PoliticalEconomy 94:5, 1002-1037.
Romer, Paul, M., 1989a. Capital accumulation in the theory of long run growth. In:Modern Business Cycle Theory. Edited by Robert, J., Barro. Cambridge: HarvardUniversity Press.
Song, E, Young., 2002. Taxation, human capital, and growth. Journal of EconomicDynamics and Control 26: 2, 205-216.
Tamura, Robert., 1991. Income convergence in an endogenous growth model. Journalof Political Economy 99:3, 522-540.
Xuejun, Liu., Albert, Park., and Zhao. Yaohui, 2008. Explaining rising returns toeducation in urban China in the 1990s. Paper Accepted by The 2008 Annual Meetingof American Economic Association.

198 XIANGCAI MENG AND AZHONG YE
Zhang, Jie., 1996. Optimal public investments in education and endogenous growth.Scandinavian Journal of Economics 98:3, 387-404.
Zhang, Jie., 2003. Optimal debt, endogenous fertility, and human capital externalitiesin a model with altruistic bequests. Journal of Public Economics 87:7-8, 1825-1835.
Uzawa, H., 1965. Optimum technical change in an aggregative model of economicgrowth. International Economic Review 6, 18-31.
Robert, J, Barro. and Sala-i-Martin. Xavier, 2000. Economic Growth. Beijing: ChinaSocial Sciences Press.
Wang, Dihai., Gong, Liutang., and Li, Hongyi., 2008. Health human capital, healthinvestment, and economic growth: Evedence from China’s inter-provincial data. Man-agement World 3, 27-38.