human capital and income distribution in malaysia: a case study
TRANSCRIPT
Journal of Economic Cooperation and Development, 31, 2 (2010), 25-46
Human Capital and Income Distribution in Malaysia: A Case Study
Rahmah Ismail and Ishak Yussof
Malaysia has achieved a remarkably high economic growth as a result of strong government policy and political stability. The national vision to achieve the status of newly industrialized nation by year 2020 seemed to be realized. However, achieving high economic growth alone cannot guarantee a decent life of the society if there is large income gap between them. Based on the historical data, the trend of income inequality in Malaysia has been unstable since independence even though human capital development has been expanding over time. This paper aims to identify the role of human capital in explaining income distribution in Malaysia. The analysis is based on 4,003 household data collected through a survey conducted in 2007-2008 throughout the Peninsular Malaysia. The study constructs Gini coefficient by various segments like ethnics, regions and strata to look at patterns of income distribution. In addition, other measurements of income distribution such as income ratio and income percentage will also be used in the analysis. A regression model will be specified to estimate the role of human capital on income distribution. In the model, household income ratio will be used as dependent variable whilst household characteristics including human capital achievement, location and regions will act as independent variables.
I. Introduction
The role of human capital on economic growth and development is becoming more important. It is believed that more educated population will bring a significant positive impact on social, political and economic performances. Generally speaking, an increase in human capital achievement amongst the population will stimulate economic growth and reduce incidence of poverty. Furthermore, human capital will lead
26 Human Capital and Income Distribution in Malaysia: A Case Study
to a more civilised society through knowledge, information and good culture practices. Therefore, it is necessary for a country to continuously invest in human capital to enhance and maintain the quality of its human resource. In Malaysia budget allocation for human capital investment through education, training and health is considerably high. For example, between the 2000-2003 periods, percentage expenditure for education and training were more than 20% of the total government expenditure. Even though years after 2003 witnessed a drop in this percentage, it was never been lower than 12% (Economic Report, various years). One of the major aspects of economic development is to achieve a more equal income distribution amongst the various segments of the society. Yet, in Malaysia despite of achieving a considerably high economic growth, poverty and income distribution are still be the major concern. High economic growth does not guarantee equal income distribution because the later need government interference and cannot merely leave to the market forces. This is because people do not have equal chance in owning and exploring resources. Even though with good government policy, issue of income inequality will still persist if such policy is ineffective. For example, if the programmes that are designed for the poor do not reach the target groups. The objective of this paper is to discuss income distribution by various segments like ethnic and strata using several indicators like Gini coefficient, income ratio and income percentage. Apart from this, this paper also aims to analyse the role of human capital achievement on income distribution in Malaysia. The analysis is based on 4003 household’s data collected in 2007/2008 in Peninsular Malaysia. This article is organized as follows. In section 2, we discuss literature review and in section 3, we explore research background like human capital achievement, trend of income distribution and trend of poverty. While in section 4 we explain the methodology and model specification. Section 5 explains the results from the study and lastly section 6 summarizes the results and conclusion.

Journal of Economic Cooperation and Development 27
2. Literature Review Schultz (1960) and Becker (1964) argued that human capital variables have positive relationship with earnings through productivity enhancement. Since earnings constitute a major portion of income, the distribution of income will be more equal when educational opportunity is equally distributed. Becker (1964) limits human capital components into four to include education, training, health and migration. But these components have been changing overtime to suite with current environment. For example, variables like knowledge, skills and information are added to the components (Becker, 1993; Fedderke et al, 1999 & Djamaludin Ancok; 2007). It is long been recognized that human capital is one of the factors that can raise people’s income, hence, lessen income inequality. The power of human capital to raise individual’ earnings has been pointed out by the founder of Human Capital Theory, Schultz (1960) and Becker (1964). This argument subsequently supported by other researchers and most studies strongly show significant and positive relationship between human capital attainment and earnings or income (Denison, 1967); Barro, 1990; Mankiw et al., 1992; De Gregario, 1992; Otani & Villanueva, 1993; Hanson & Knowles, 1997; Murthy and Chien, 1997; Barro & Lee, 1996 & Pritchett, 1996). They also agree that when human capital attainment especially education is equally distributed amongst the society, then income distribution will be more equal (Hammermesh, 1984). Most previous studies show a positive relationship between income distribution and human capital. For example, Podder (2003) studies the role of human capital in determining earnings inequality in Australia between 1997 and 1998. Using Mincer quadratic earnings equation, he finds that inequality is associated with the presence of discrimination. Grimm (2004) uses micro simulation dynamic model to analyse impact of educational development in Cote d' Ivoire on household income. He finds a positive relationship between these two variables, whereby income distribution and poverty depend very much on returns to education and demand for labour. In another study, Arabsheibani,
28 Human Capital and Income Distribution in Malaysia: A Case Study
Carneiro and Hanley (2003) find that an increase in rate of returns to education will reduce income inequality. A study by Behr, Christofides and Neelakantan (2004) using data from the United States Census Biro from 1970 to 2000 shows that education reduces inequality of the 50 states. Ferreira and de Barros (2000) studies education and income distribution in Brazil using data from 1976 to 1996 and utilizing simulation method. The result shows that a decrease in returns to education and experience will increase poverty. In contrast, an increase in education level and equality in income distribution as well as dependency ratio will decrease poverty. There are also studies that try to identify the determinants of income distribution. For example, Rahmah and Poo Bee Tin (2002) using the Malaysian data of the 1970-2000 period study the determinants of income distribution. They find that foreign direct investment, unemployment rate and foreign labour have a positive significant relationship with Gini coefficient. This indicates that an increase in those variables will reduce income inequality. While GDP growth, manufacturing employment and transfer payment are negatively associated with income inequality. Lin (2007) analyses the education expansion, educational inequality and income inequality in Taiwan from 1976 to 2003. He finds that, Taiwan has experienced a decrease in education inequality and an increase in mean year of schooling. This subsequently contributes to lower income inequality in Taiwan. 3. Human Capital, Income Distribution and Poverty in Malaysia Education and training are two major components of human capital. In Malaysia, enrolment at tertiary level of education increases during 2000-2010 periods. At the certificate level, total enrolment increased from 105,570 in 2000 to 132,880 in 2005. The number is expected to increase further to 284,770 in 2010. Other education levels show a similar trend. When comparing enrolment in the public tertiary institution with the private institution, the data shows that enrolments in the public institutions is higher except at the certificate and diploma level (refer to Table I).

Journal of Economic Cooperation and Development 29
Table 1: Enrolment in Tertiary Education Institution by Education Level 2000 – 2010
Education Level
Number of Student
2000 2005 2010
Public Private Total Public Private Total Public Private Total
Certificate 23,816 81,754 105,570 37,931 94,949 132,880 141,290 143,480 284,770
Diploma 91,398 117,056 208,454 98,953 131,428 230,381 285,690 188,680 474,370
Bachelor Degree 170,794 59,932 230,726 212,326 110,591 322,917 293,650 134,550 428,370
Master 24,007 2,174 26,181 34,436 4,202 38,638 111,550 5,770 117,320
Ph.D 3,359 131 3,490 6,742 140 6,882 21,410 270 21,630
Total 313,374 261,047 574,421 390,388 341,310 731,698 853,590 472,750 1,326,340
Source: Malaysia, 2006
30 Human Capital and Income Distribution in Malaysia: A Case Study
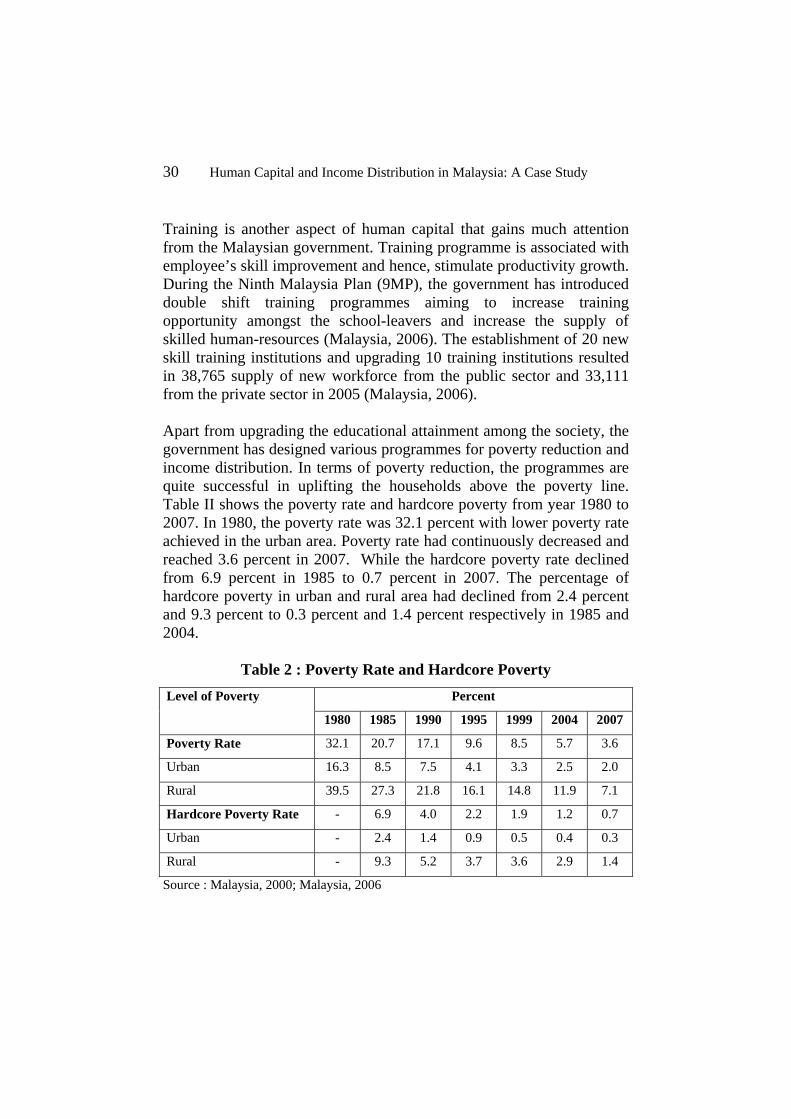
Training is another aspect of human capital that gains much attention from the Malaysian government. Training programme is associated with employee’s skill improvement and hence, stimulate productivity growth. During the Ninth Malaysia Plan (9MP), the government has introduced double shift training programmes aiming to increase training opportunity amongst the school-leavers and increase the supply of skilled human-resources (Malaysia, 2006). The establishment of 20 new skill training institutions and upgrading 10 training institutions resulted in 38,765 supply of new workforce from the public sector and 33,111 from the private sector in 2005 (Malaysia, 2006). Apart from upgrading the educational attainment among the society, the government has designed various programmes for poverty reduction and income distribution. In terms of poverty reduction, the programmes are quite successful in uplifting the households above the poverty line. Table II shows the poverty rate and hardcore poverty from year 1980 to 2007. In 1980, the poverty rate was 32.1 percent with lower poverty rate achieved in the urban area. Poverty rate had continuously decreased and reached 3.6 percent in 2007. While the hardcore poverty rate declined from 6.9 percent in 1985 to 0.7 percent in 2007. The percentage of hardcore poverty in urban and rural area had declined from 2.4 percent and 9.3 percent to 0.3 percent and 1.4 percent respectively in 1985 and 2004.
Table 2 : Poverty Rate and Hardcore Poverty
Level of Poverty Percent
1980 1985 1990 1995 1999 2004 2007
Poverty Rate 32.1 20.7 17.1 9.6 8.5 5.7 3.6
Urban 16.3 8.5 7.5 4.1 3.3 2.5 2.0
Rural 39.5 27.3 21.8 16.1 14.8 11.9 7.1
Hardcore Poverty Rate - 6.9 4.0 2.2 1.9 1.2 0.7
Urban - 2.4 1.4 0.9 0.5 0.4 0.3
Rural - 9.3 5.2 3.7 3.6 2.9 1.4
Source : Malaysia, 2000; Malaysia, 2006

Journal of Economic Cooperation and Development 31
Table III presents the poverty rate and hardcore poverty by ethnic group from 1999 to 2004. The hardcore poverty rate for Bumiputera in the urban area remains at 0.7 percent from 1999 to 2004. This rate is lower than in the rural area at 4.4 percent in 1999 and 3.3 percent in 2004. As a whole, the hardcore poverty for Bumiputera decreased from 2.9 percent in 1999 to 1.9 percent in 2004. The hardcore poverty for the Chinese has been reduced but remains the same for the Indian during the same period.
Table 3 : Hardcore Poverty and Poverty Rate by Ethnic Group
1999 and 2004
1999 (Percent) 2004 (Percent)
Bumiputera Cina Indian Bumiputera Cina Indian
Hardcore
Poverty 2.9 0.2 0.3 1.9 0.1 0.3
Urban 0.7 0.1 0.2 0.7 neg1 0.2
Rural 4.4 0.4 0.5 3.3 0.3 0.5
Overall
Poverty 12.4 1.2 3.5 8.3 0.6 2.9
Urban 5.1 0.8 2.4 4.1 0.4 2.4
Rural 17.5 2.7 5.8 13.4 2.3 5.4
Poverty
Gap 3.3 0.2 0.7 2.1 0.1 0.6
Note : 1 Less from 0.05 percent Source : Malaysia, 2006 One of the indicators for income distribution is share of income by certain group of households. During the Ninth Malaysian Plan, the household share of income for 40 percent lowest income group decreases from 14.0 percent in 1999 to 13.5 percent in 2004. While for the top 20 percent income group, it increases from 50.5 percent to 51.2 percent during the same period. The Gini coefficient also shows a more
32 Human Capital and Income Distribution in Malaysia: A Case Study
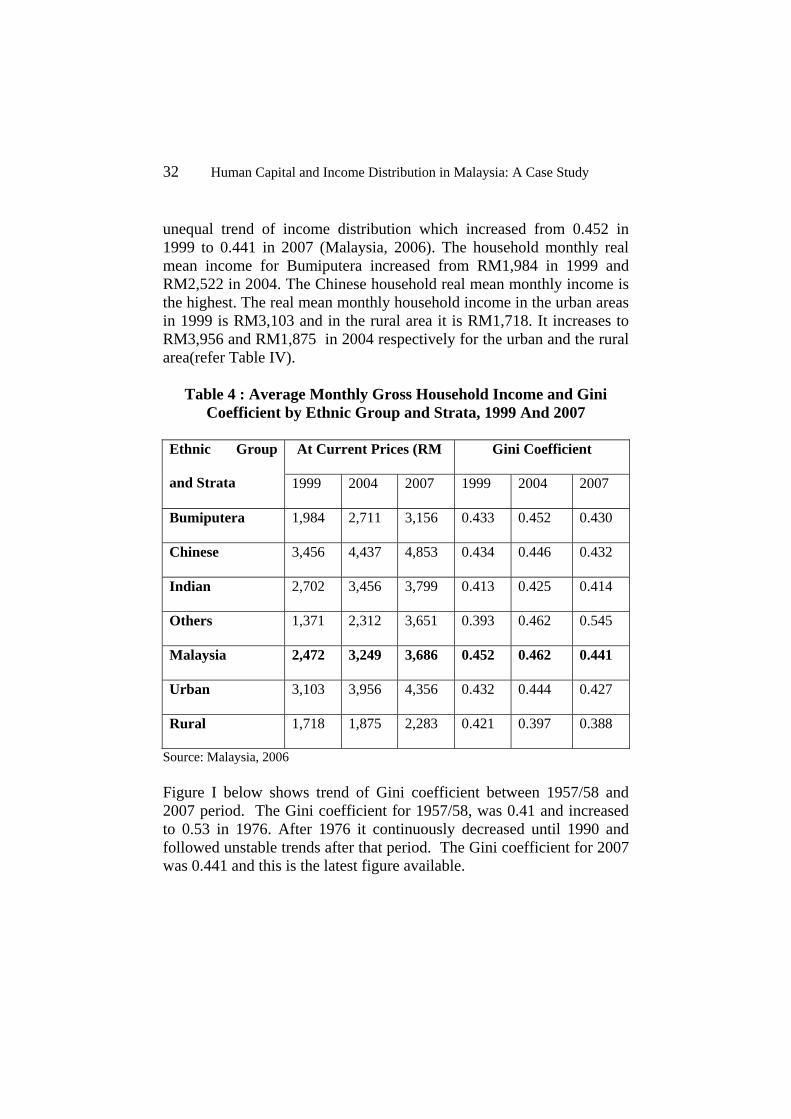
unequal trend of income distribution which increased from 0.452 in 1999 to 0.441 in 2007 (Malaysia, 2006). The household monthly real mean income for Bumiputera increased from RM1,984 in 1999 and RM2,522 in 2004. The Chinese household real mean monthly income is the highest. The real mean monthly household income in the urban areas in 1999 is RM3,103 and in the rural area it is RM1,718. It increases to RM3,956 and RM1,875 in 2004 respectively for the urban and the rural area(refer Table IV).
Table 4 : Average Monthly Gross Household Income and Gini Coefficient by Ethnic Group and Strata, 1999 And 2007
Ethnic Group
and Strata
At Current Prices (RM Gini Coefficient
1999 2004 2007 1999 2004 2007
Bumiputera 1,984 2,711 3,156 0.433 0.452 0.430
Chinese 3,456 4,437 4,853 0.434 0.446 0.432
Indian 2,702 3,456 3,799 0.413 0.425 0.414
Others 1,371 2,312 3,651 0.393 0.462 0.545
Malaysia 2,472 3,249 3,686 0.452 0.462 0.441
Urban 3,103 3,956 4,356 0.432 0.444 0.427
Rural 1,718 1,875 2,283 0.421 0.397 0.388
Source: Malaysia, 2006 Figure I below shows trend of Gini coefficient between 1957/58 and 2007 period. The Gini coefficient for 1957/58, was 0.41 and increased to 0.53 in 1976. After 1976 it continuously decreased until 1990 and followed unstable trends after that period. The Gini coefficient for 2007 was 0.441 and this is the latest figure available.

Journal of Economic Cooperation and Development 33
Figure 1: Gini Coefficient from 1957/58 to 2007
0.41
0.44
0.5
0.53
0.51
0.48
0.460.45
0.46
0.46
0.47
0.452
0.46070.462
0.441
0.4
0.45
0.5
0.55
1 2 3 4 5 6 7 8 9 10 11 12 13 14 15
Gini Coe
fficie
nt
Year
No. 1 2 3 4 5 6 7 8 9 10 11 12 13 14 15
Year 1957/ 58
1967/ 68
1970 1976 1979 1984 1987 1990 1993 1995 1997 1999 2002 2004 2007
Note: 1957/58 – 1987: Peninsular Malaysia Source: Sodgrass, 1980 Anand, 1983 Malaysia (1981, 1984, 1989, 1991, 1993, 1996, 1999, 2001, 2006, 2008)

34 Human Capital and Income Distribution in Malaysia: A Case Study
4. Methodology and Model Specification Data Collection Data was collected through a field survey conducted in 2007/2008 for the whole Peninsular Malaysia using a set of questionnaire. The group stratified sampling method is used to get the sample size by regions, states, location and ethnicity. The household population is obtained from Census of Population and Housing in Malaysia (Malaysia, 2001) and population composition is based on the Ninth Malaysia Plan (Malaysia, 2006). The original plan was to get 5,000 households but only 4,003 households were successfully interviewed. The role of human capital on household income ratio is analysed using a multiple regression model. The independent variables include human capital variables like education, training, working experience and other variables like health, demography, job category and job sector. The estimation model can be written as follow,
DCDMDUMAWP
MLWPMEXPMTTWPMYSWPIRi
8765
43210
5
DSDKM 98
Where, IR = percentage of household income MYSWP = Mean year of schooling for working household MTTWP = Mean period of training for working household MEXP = Mean working experience for working household MLWP = Mean score of healthy lifestyle for working household MAWP = Mean days absence from work for working household DU = location dummy, coded 1 if urban, 0 otherwise l DM = ethnic dummy, coded 1 if Malay, 0 otherwise DC = ethnic dummy, coded 1 if Chinese, 0 otherwise DKW = knowledge workers dummy, coded 1 if household headed works in the category of senior officer and manager; professional; technician and assistant professional, 0 otherwise DS = sector dummy, coded 1 if household headed is involved in service sector, 0 otherwise = error term

Journal of Economic Cooperation and Development 35
5. Profile of Respondents and Estimation Results Table V shows profile of the households in this study. A total of 2,749 households (68.7%) live in the urban area while 1,254 (31.3%) live in rural area. Most households are concentrated in the central and north regions. More than half of the households from all races live in the urban area.
Table 5 : Distribution of Household by Region, Location and Ethnicity
Urban Rural
Malay Chinese Indian Total Malay Chinese Indian Total Region
North 444
(67.3)
[23.6]
170
(25.8)
[25.4]
46
(7.0)
[23.0]
660
(100.0)
[24.0]
318
(77.4)
[33.8]
70
(17.0)
[28.9]
23
(7.0)
[23.0]
411
(100.0)
[32.8]
South 378
(70.8)
[20.1]
121
(18.1)
[19.2]
35
(6.6)
[17.5]
534
(100.0)
[19.4]
184
(74.8)
[19.6]
49
(19.9)
[20.2]
13
(5.3)
[18.1]
246
(100.0)
[19.6]
Central 892
(67.2)
[47.5]
330
(49.3)
[48.4]
105
(7.9)
[52.5]
1327
(100.0)
[48.3]
135
(72.6)
[14.4]
39
(21.0)
[16.1]
12
(6.5)
[16.7]
186
(100.0)
[14.8]
East 165
(72.4)
[8.8]
49
(7.3)
[7.5]
14
(6.1)
[7.0]
228
(100.0)
[8.3]
303
(73.7)
[32.2]
84
(20.4)
[34.7]
24
(5.8)
[33.3]
411
(100.0)
[32.8]
Total 1879
(68.4)
[100.0]
670
(24.4)
[100.0]
200
(7.3)
[100.0]
2749
(100.0)
[100.0]
940
(75.0)
[100.0]
242
(19.3)
[100.0]
72
(5.7)
[100.0]
1254
(100.0)
[100.0] Note: ( ) percent of the total amount, [ ] percent within ethnicity Source: Field survey, 2007/2008

36 Human Capital and Income Distribution in Malaysia: A Case Study
The study reveals that the majority of households regardless of ethnicity work in the services sector followed by the manufacturing sector. As predicted, an involvement of the Malay households in the agriculture sector is higher than the other races (refer Table VI).
Table 6 : Distribution of Working Household by Sector
Sector Urban Rural
Malay Chinese Indian Total Malay Chinese Indian Total
Service 2634
[78.5]
811
[77.5]
233
[73.7]
3678
[78.0]
986
[57.1]
274
[71.5]
70
[56.9]
1330
[59.5]
Manufac
turing
518
[15.4]
152
[14.5]
53
[16.8]
723
[15.3]
228
[13.2]
45
[11.7]
24
[19.5]
297
[13.3]
Agriculture 74
[2.2]
14
[1.3]
12
[3.8]
100
[2.1]
400
[23.1]
50
[13.1]
24
[19.5]
474
[21.2]
Mining 8
[0.2]
0
[0.0]
1
[0.3]
9
[0.2]
1
[0.1]
1
[0.3]
0
[0.0]
2
[0.1]
Construction 120
[3.6]
69
[6.6]
17
[5.4]
206
[4.4]
113
[6.5]
13
[3.4]
5
[4.1]
131
[5.9]
Total 3354
[100.0]
1046
[100.0]
316
[100.0]
4716
[100.0]
1728
[100.0]
383
[100.0]
123
[100.0]
2234
[100.0]
Source: Field survey, 2007/2008
Most of the working households work in a service related jobs and sales. Of the total households in the urban area, 28.8 percent are involved in the service related sector whereas within the ethnicity, the percentage of involvement are 42.1 percent of the Chinese, 33.1 percent of the Indians and 24.1 percent of the Malays. A similar structure is observed in the rural area whereby the services being the most important sector. It is shown that the percentage of the Malays in the rural that involved in the agriculture and fishery related works are higher than the Chinese and the

Journal of Economic Cooperation and Development 37
Indian. In contrast, the Chinese and Indian have greater involvement in the business sector compared to the Malays (refer Table VII).
Table 7 : Distribution of Working Household by Occupational Category
Occupational Category
Urban Rural Malay Chinese Indian Total Malay Chinese Indian Total
Senior Officer & Manager
260 [7.9]
86 [8.2]
11 [3.4]
357 [7.7]
65 [3.9]
13 [3.4]
0 [0.0]
78 [3.6]
Professional
683 [20.7]
195 [18.6]
57 [17.8]
935 [20.1]
186 [11.1]
28 [7.3]
10 [8.0]
224 [10.2]
Technician & Associate Professionals
297 [9.0]
87 [8.3]
22 [6.9]
406 [8.7]
126 [7.5]
17 [4.5]
6 [4.8]
149 [6.8]
Clerical Employees
474 [14.4]
72 [6.9]
28 [8.8]
574 [12.3]
134 [8.0]
23 [6.0]
9 [7.2]
166 [7.6]
Service & Selling Staff
795 [24.1]
441 [42.1]
106 [33.1]
1342 [28.8]
385 [22.9]
172 [45.0]
40 [32.0]
597 [27.3]
Agriculture & Fishery Worker
62 [1.9]
14 [1.3]
7 [2.2]
83 [1.8]
355 [21.1]
46 [12.0]
21 [16.8]
422 [19.3]
Craft & Trade Related Worker
33 [1.0]
8 [0.8]
1 [0.3]
42 [0.9]
17 [1.0]
12 [3.1]
2 [1.6]
31 [1.4]
Plant, Machine & Installation Operator
376 [11.4]
54 [5.2]
50 [15.6]
480 [10.3]
171 [10.2]
25 [6.5]
19 [15.2]
215 [9.8]
Elementary Occupational
312 [9.5]
91 [8.7]
38 [11.9]
441 [9.5]
243 [14.4]
46 [12.0]
18 [14.4]
307 [14.0]
Total 3292 [100.0]
1048 [100.0]
320 [100.0]
4660 [100.0]
1682 [100.0]
382 [100.0]
125 [100.0]
2189 [100.0]
Source: Field survey, 2007/2008
38 Human Capital and Income Distribution in Malaysia: A Case Study
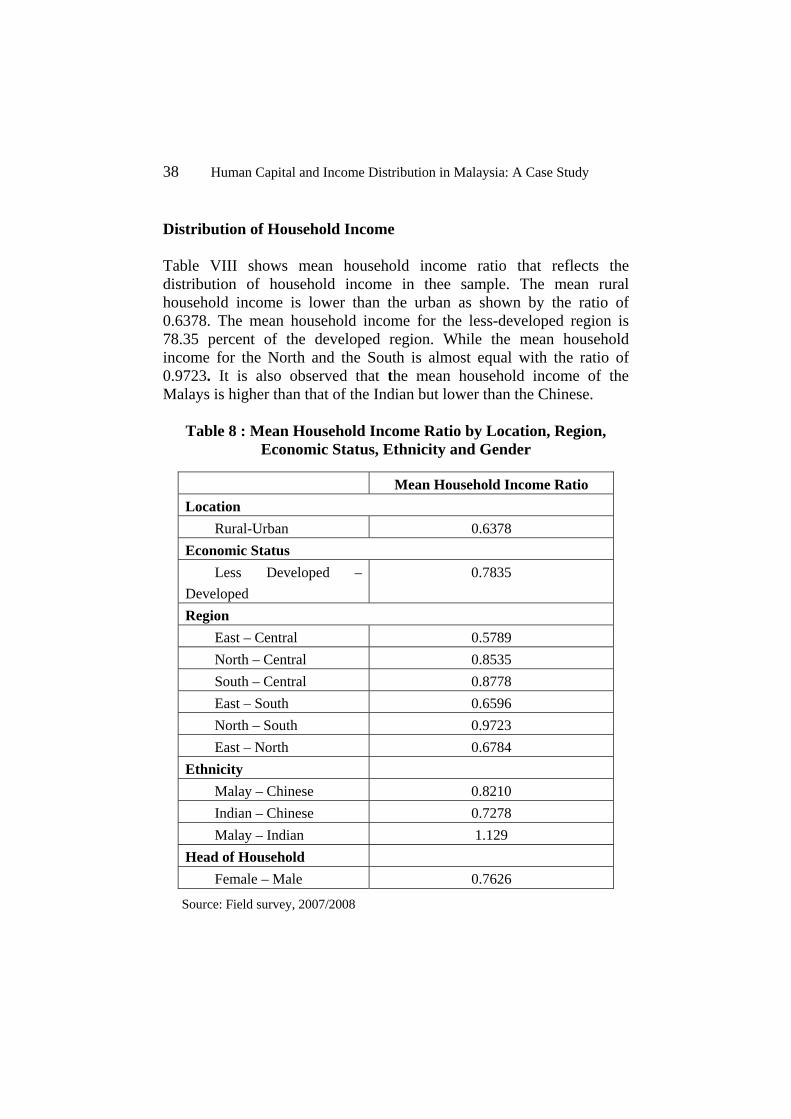
Distribution of Household Income Table VIII shows mean household income ratio that reflects the distribution of household income in thee sample. The mean rural household income is lower than the urban as shown by the ratio of 0.6378. The mean household income for the less-developed region is 78.35 percent of the developed region. While the mean household income for the North and the South is almost equal with the ratio of 0.9723. It is also observed that the mean household income of the Malays is higher than that of the Indian but lower than the Chinese.
Table 8 : Mean Household Income Ratio by Location, Region, Economic Status, Ethnicity and Gender
Mean Household Income Ratio
Location
Rural-Urban 0.6378
Economic Status
Less Developed –
Developed
0.7835
Region
East – Central 0.5789
North – Central 0.8535
South – Central 0.8778
East – South 0.6596
North – South 0.9723
East – North 0.6784
Ethnicity
Malay – Chinese 0.8210
Indian – Chinese 0.7278
Malay – Indian 1.129
Head of Household
Female – Male 0.7626
Source: Field survey, 2007/2008

Journal of Economic Cooperation and Development 39
Table IX shows the percentage of income owned by the group of households. It is shown that the 20 percent highest income group receive 44.1 percent of total income. While the percentage income received by the 40 percent middle and 40 percent lowest income groups are 38.9 percent and 17.0 percent respectively. This demonstrates inequality in income distribution.
Table 9: Percentage of Household Income by Group
Group of Household Percentage of Income (%)
20 percent highest 44.1
40 percent middle 38.9
40 percent lowest 17.0
Source: Field survey, 2007/2008
Table 10 shows Gini coefficient by gender, ethnicity, location and region. The overall Gini coefficient is 0.384. Income distribution is more unequal amongst the male headed households as compared to the females headed households as indicated by the Gini coefficient. Income distribution also seems to be more unequal amongst the Malays, the rural areas and the Central region. The most unequal income distribution is found to be in the East region with Gini index of 0.417. The rural area also records high Gini index of 0.402. This demonstrates that income distribution is more unequal for the lower income groups that may due to more unequal jobs distribution.

40 Human Capital and Income Distribution in Malaysia: A Case Study
Table 10 : Gini Coefficient by Gender, Ethnicity, Location and Region
Total Household Gini Coefficient
Gender
Man 3,775 0.3822
Woman 227 0.3263
Ethnicity
Malay 2,819 0.3862
Chinese 912 0.3648
Indian 272 0.3734
Location
Urban 2,749 0.3584
Rural 1,254 0.4021
Region
North 1,071 0.3685
South 780 0.3692
Central 1,513 0.3628
East 639 0.4167
Overall 4002 0.3838 Note : N = 4002 ( Missing Value =1) Formula for Gini Coefficient: 11 iiii QPQPG
Source : Field survey 2007/2008
Human Capital and Income Distribution Results from estimation of regression model show that all independent variables significantly determine household percentage income. The result shows that human capital variables like education, training, experience and healthy lifestyle are significant and positively related to households percentage income; hence reducing income inequality amongst the households. The result also demonstrates that the urban households have higher percentage income compared to the rural. The

Journal of Economic Cooperation and Development 41
percentage income of the Malays and Chinese are also significantly higher than the Indians. When two other variables are added to the model, the significant levels of the variables are still remained. Head of household who are involved in the service sector and are knowledge workers receive higher percentage income (refer Table XI).
Table 11: Estimation Result of Regression Model
Independent Variable 1 2 Constant -.033
(-11.787)*** -.024
(-8.013)***
(a) Human Capital Year of schooling of working Household (MYSWP)
.003(20.007)***
.002 (12.922)***
Training period of working Household (MTTWP)
.006(8.537)***
.005 (6.322)***
Working experience of working household (MExp)
.000(6.962)***
.000 (5.377)***
Lifestyle of working household (MLWP)
.002(4.522)***
.002 (4.165)***
(b) Demographic & Ethnicity Urban/Rural (DU) .006
(7.656)*** .005
(6.035)***
Malay (DM) .002(1.850)*
.002 (1.302)
Chinese (DC) .008(6.095)***
.008 (5.538)***
(c) Sector and Occupational Category
Services Workers (DS) .001 (1.983)**
Knowledge Workers (DKW) .009 (10.724)***
Adjusted R2 0.190 0.217 R2 0.192 0.219 Overall F 125.498*** 106.455*** N 3709 3424
Note: *** Significant at 1% significance level ** Significant at 5% significance level * Significant at 10% significance level

42 Human Capital and Income Distribution in Malaysia: A Case Study
6. Conclusion The Malaysian economy has steadily grown at remarkably high rate since independence except for few periods during economic turbulence. Nevertheless, income distribution has still become the main issue and agenda in Malaysian economic development. Studies in the past were rarely focussing on determinants of income distribution but rather looking merely at the trend of income inequality using the government official data. This study attempts to identify determinants of income inequality in particular the human capital variables using primary data. Apart from this, several indicators of income inequality are calculated like mean ratio, income percentage, Lorenz curve and Gini coefficient. The results from this study confirm the pattern of income distribution in Malaysia that was generated from the official data. What is more important is the study shows that all cooperated human capital variables significantly determine the percentage of household income which reflects income distribution. Other variables like demography and ethnicity also important when analysing income distribution. It is shown that the urban area and the Chinese gain higher income as compared respectively to the rural, the Malays and the Indians. Based on the results from this study, we suggest that enhancement in human capital attainment amongst the household members must be done continuously. One of the measures is life-long education. Another important aspect is to educate the household members with a healthy life style that will subsequently contribute to household income. One of the major findings from the study is that the urban dwellers and the Chinese benefit more from the Malaysian economic growth. This is very much associated with their involvement in more productive activities like the business and service related activities. Therefore, other segment of the society like the rural and non-Chinese households must get involved in higher value added activities. The services sector seems to generate higher household income as indicated by the regression result. This indicates the capability of this sector to generate higher value-added activities and this is in tandem with increasingly important of this sector in the Malaysian economy.

Journal of Economic Cooperation and Development 43
The ability of knowledge workers to gain higher income is undoubted. This is very much associated with their higher skill and productivity. Therefore, enhancing human capital attainment through education and training amongst the household members is very much needed if they want to be knowledge workers which subsequently will raise households income and lessen the income inequality.

44 Human Capital and Income Distribution in Malaysia: A Case Study
Reference Anand, S. (1983), Inequality and Poverty in Malaysia : Measurement and Deomposition, Oxford University Press, Oxford. Arabsheibani, G. R, Carneiro, and A. Henley. (2003), Human Capital and Earnings Inequality in Brazil, 1988 – 1998 : Quintile Regression Evidence, Worlds Bank Policy Research Working Paper, http://econ.worldbank.org. Barro, R.J. (1990),”Government Spending in a Single Model of Endogenous Growth”, Journal of Political Economy, 98, S103-S125. Barro, R and J.W. Lee. (1996), “International Measures of Schooling Years and Schooling Quality”, American Economic Review, May, 80:218-228. Becker, G. S. (1964), Human Capital. NBER, New York. Becker, G. S. (1993), Human Capital, A Theoretical and Empirical Analysis with Special Reference to Education. The University of Chigaco Press, Chicago. Behr, T, C. Christofides and P. Neelakantan. (2004), The Effects of State Public K-12 Education Expenditures on Income Distribution, NEA Resaerch Working Paper. Birchenall, J. A. (2001), “Income Distribution, Human Capital and Economic Growth in Colombia”, Journal of Development Economics, 66, 271-287.
De Gregorio, J. (1992), “Economic Growth in Latin America”, Journal of Development Economics, 39(1),59-84. Denison, E.F. (1967), Why Growth Rates Differ: Post War Experience in Nine Western Countries. Brookings Institution, Washington DC.

Journal of Economic Cooperation and Development 45
Djamaludin Ancok. (2007), Konsep Modal Manusia. http://ancok.staff.ugm.ac.id Fedderke, J, R. De Kadt and J. Luiz. (1999), “Growth and Social Capital: a Critical Reflection”, Theory and Society, 28, 709-45 Ferreira, Francisco H. G. and R.P, de Barros. (2000), Education and Income Distribution in Urban Brazil 1976 – 1996. Cepal Review Grimm, M. (2004), The Medium and Long – term Effects of a Expansion of Education on Poverty in Cote d’Ivoire : A Dynamic Microsimulation Study. Research Paper No. 2004/32, United Nations University. Hansen, P and S. Knowles. (1997), “Human Capital and Return to Scale”, Journal of Economic Studies, 25, 118-123. Huggett, M, G. Ventura and A. Yaron. (2004), “Human Capital and Earnings Distribution Dynamics”, Journal of Monetary Economics, 53(2), 265 – 290. Katz, L. and K.Murphy. (1992), “Changes in Relative Wages, 1963-1987: Supply and Demand Factors, Quarterly Journal of Economics”, 108, 33-60. Lin, Chun-Hung, A. (2007), “Education Expansion, Educational Inequality and Income Inequality : Evidence From Taiwan 1976-2003”, Social Indicators Research, 80, 601-615. Malaysia. (1981), Fourth Malaysia Plan, 1981-1985, National Publication; Kuala Lumpur. Malaysia. (1984), Mid term Review of Fourth Malaysia Plan, 1981-1985, National Publication; Kuala Lumpur. Malaysia. (1989), Kajian Separuh Penggal Rancangan Malaysia Kelima, 1986-1990, National Publication; Kuala Lumpur. Malaysia. (1991), Second Outline Perspective Plan, 1991-2000, National Publication; Kuala Lumpur.

46 Human Capital and Income Distribution in Malaysia: A Case Study
Malaysia. (1993), Mid Term Review of Sixth Malaysia Plan, 1991-1995, National Publication; Kuala Lumpur. Malaysia. (1996), Seventh Malaysia Plan, 1996-2000, National Publication, Kuala Lumpur. Malaysia. (1999), Mid Term Review of Seventh Malaysia Plan, 1996-2000, National Publication, Kuala Lumpur. Malaysia. (2000), Malaysia Quality of Life 1999, National Publication, Kuala Lumpur. Malaysia. (2001), Mid Term Review of Eight Malaysia Plan, 2001-2005,National Publication, Kuala Lumpur. Malaysia. (2005), Malaysia Quality of Life 2004, National Publication; Kuala Lumpur. Malaysia. (2006), Ninth Malaysia Plan, 2006-2010, National Publication; Kuala Lumpur. Mankiw, N.G., D. Romer.and D. N. Weil. (1992), “A Contribution to the Empirics Economic Growth”, Quarterly Journal of Economics, 107(2),407-437. Mincer, J. (1970), “The Distribution of Labor Income:A Survey with Special Reference to Human Capital Approach,” Journal of Economic Literature, 8, 1-26 Mincer, J. (1974), Schooling, Experience and Earnings, NBER Working Paper, New York. Murthy, N. R. Vasudeva and I.S. Chien. (1997), “The Empirical of Economic Growth for OECD Countries: Some New Findings”, Economic Letter, 55,425-429.

Journal of Economic Cooperation and Development 47
Otani, I. & D. Villanueva. (1990), “Long-term Growth in Developing Countries and Its Determinants: An Empirical Analysis”, World Development, 18(6), 769-783. Pritchett, L. (1996), Where has all the education gone? World Bank Working Paper. no.1581. Podder, N. (2003), Human Capital and Earnings Inequality : Some Considerations of Distributive Justice with Illustration from Australia. Paper presented at Inequality, Poverty and Human Well-being Conference, Finland 30-31 May 2003. Rahmah Ismail. (1996), Human Capital and Labour Earning. Kuala Lumpur, Dewan Bahasa Pustaka. Rahmah Ismail & Poo Bee Tin. (2002), “Determinants of Income Distribution in Malaysia ,1970-2000”, Pertanika Journal of Social Science & Humanities, Universiti Putra Malaysia Press, 10(2), 119-129. Sarkar, D. (2007), “The Role of Human Capital in Economic Growth Revisited”, Applied Economics Letters, 14, 419-423. Schultz, T.W. (1960), “Investment in Human Capital. American Economic Review”, 51 (1), 1-17 Snodgrass, D. R. (1980), Inequality and Economic Development in Malaysia, Oxford University Press, Kuala Lumpur