hue and saturation shifts from spatially induced blackness · hue and saturation shifts from...
TRANSCRIPT

1Iisdlt(ieoo
vpsaIiwBscec
pnrm
Bimler et al. Vol. 26, No. 1 /January 2009 /J. Opt. Soc. Am. A 163
Hue and saturation shifts from spatiallyinduced blackness
David L. Bimler,1,* Galina V. Paramei,2 and Chingis A. Izmailov3
1Department of Health and Human Development, Massey University, Private Bag 11-222,Palmerston North, New Zealand
2Department of Psychology, Liverpool Hope University, Hope Park, L16 9JD Liverpool, United Kingdom3Department of Psychophysiology, Moscow Lomonosov State University, Mokhovaya st. 11/5,
125009 Moscow, Russia*Corresponding author: [email protected]
Received June 24, 2008; revised September 15, 2008; accepted September 21, 2008;posted November 3, 2008 (Doc. ID 97849); published December 24, 2008
We studied changes in the color appearance of a chromatic stimulus as it underwent simultaneous contrastwith a more luminous surround. Three normal trichromats provided color-naming descriptions for a 10 cd/m2
monochromatic field while a broadband white annulus surround ranged in luminance from0.2 cd/m2 to 200 cd/m2. Descriptions of the chromatic field included Red, Green, Blue, Yellow, White, andBlack or their combinations. The naming frequencies for each color/surround were used to calculate measuresof similarity among the stimuli. Multidimensional scaling analysis of these subjective similarities resulted ina four-dimensional color space with two chromatic axes, red–green and blue–yellow, and two achromatic axes,revealing separate qualities of blackness/lightness and saturation. Contrast-induced darkening of the chro-matic field was found to be accompanied by shifts in both hue and saturation. Hue shifts were similar to theBezold–Brücke shift; shifts in saturation were also quantified. A stage model is proposed to account for therelationships among blackness induction and the inherent nonlinearities in chromatic and achromaticprocessing. © 2008 Optical Society of America
OCIS codes: 330.1690, 330.1720, 330.4060.
dlnaio
ftcwrtoctstmbltl
nsmsdt
. INTRODUCTIONf color vision behaved completely linearly, then decreas-ng the luminance of a colored light would alter only itsubjective intensity. In fact the light’s hue may also vary:epending on its location within the spectrum, a shift to aonger or shorter wavelength may be required to maintainhe same hue. This is the well-established Bezold–Brückehereafter BB) hue shift for colors seen in aperture mode,.e., in the absence of spatial context [1,2]. These nonlin-arities between input and output are of interest becausef the insights they provide into the internal mechanismsf color processing.
Aperture mode contrasts with surface mode, where aisual environment, such as a luminous surround, isresent, and the colored light appears as a reflected-lighttimulus. A sufficiently intense luminous surround cre-tes spatial contrast and induces blackness into the light.t is natural to wonder how far this subjective darkenings equivalent to objective changes in luminance andhether it results in comparable changes in hue. If theB shift is a high-level effect, arising from a stage in vi-ual processing subsequent to the operations of spatialontrast (and color constancy), one might expect it to bevoked as efficiently by induced blackness as by actualhanges in stimulus lightness.
To address this issue empirically, Coren and Keith [3]resented observers with two compound stimuli simulta-eously, each consisting of a chromatic center and an ach-omatic annular surround. One center was objectivelyore luminous than the other, but subjects could induce
1084-7529/09/010163-10/$15.00 © 2
arkness into it by increasing the luminance of its annu-us until the two centers were matched in apparent light-ess. When this match was achieved, the centers werelso seen as the same hue, implying that the contrast-nduced darkening canceled out the hue shift that wouldtherwise have affected the more luminous center.
The question can be phrased in another way, by speci-ying a color appearance—for instance, ‘‘unique green’’ orhe binary hue “orange” where yellowness and rednessombine in equal proportions—and asking whether theavelength required to produce it is constant across a
ange of annulus luminance. This latter form of the ques-ion was posed by Fuld and Otto [4], who plotted the locif unique and binary hues for various combinations ofentral and annulus luminance. The wavelength requiredo evoke a given color appearance did indeed depend onurround luminance, but those variations did not followhe particular pattern that characterizes the BB shift. Itust be noted, however, that those loci were interpolated
etween color-naming data collected at only 11 wave-engths across the spectrum, so the accuracy of interpola-ion is limited by the size of the gaps between wave-engths �50 nm�.
In addition to the hue shift, changes in absolute lumi-ance affect the saturation of a stimulus. The “Purdyhift” might be an appropriate label for this effect of lu-inance on saturation, first reported by Purdy [5], and
tudied more recently by Valberg et al. [6]. As luminanceecreases, shorter wavelengths, blue to blue-green (lesshan 520 nm), become more saturated, i.e., more distinct
009 Optical Society of America

ft“fcl
ucTsTbswonvitpscw
saiton
casotmsltbite
mqedoHaBAcoe
mcc
racwpsplc
2ATSRwa
BNvlcatwlcfilwlr1Ta1
CEmswdttG(BltcG
DAttsfC
164 J. Opt. Soc. Am. A/Vol. 26, No. 1 /January 2009 Bimler et al.
rom white. In contrast, longer wavelengths, especially inhe mid-yellow region, lose saturation and becomewashed-out” [7,8]. Green and red lights are least af-ected. This is consistent with Fuld’s argument that theontribution of S cones for desaturating a signal is non-inear [9].
Here we examine hue shifts from induced darkeningsing the color-naming method, where subjects provide aombination of color terms to describe each stimulus [10].wo lights have the same subjective hue if they elicit theame ratio of (for example) Red- and Yellow-responses.hus hue shifts are easily quantified by finding the com-ination of color terms applied to a given wavelength atome annulus luminance and determining the otheravelength that evokes the same combination at somether luminance (interpolating between wavelengths ifecessary). In an application of the same technique, witharying central luminance and no annulus [7], the resultsndicated a BB hue shift in line with those previously ob-ained from other methods. Specifically, for lights with aerceptible component of Green, this component becametronger as luminance decreased (i.e., the Blue or Yellowomponents decreased). For longer-wavelength lightsith a component of Red, this similarly became stronger.In addition to the above method, multidimensional
caling (MDS) is used to clarify possible changes in colorppearance by converting color-naming functions into anndividual color space by way of interstimulus similari-ies. The result is a description of each stimulus in termsf spatial coordinates rather than as a color-name combi-ation [8,11].The present study extended the original version of the
olor-naming technique [8,10] by allowing Black as wells White responses (as in [4]). When White and Black re-ponses function as mutually exclusive opposite extremesf a bipolar continuum of subjective darkness, they con-ain information about induced blackness. However, theyay also function as labels for the desaturation of the
timulus, together describing the amount of grayness di-uting its chromatic content. MDS serves to disentanglehese two aspects of achromatic appearance from the dataefore the question of hue shifts from induced blacknesss addressed. There is the added incentive that interac-ions between induced blackness and saturation can bexamined, once both aspects have been quantified.
To put it another way, a complete description of achro-atic appearance in conditions of spatial contrast re-
uires two dimensions [12,13]. Unfortunately, this is notnough to disambiguate the choice of dimensions. Lie [14]istinguished between the “brightness” and “whiteness”f achromatic color in surface mode. In a similar veineggelund [15] argued that Whiteness forms one axis ofchromatic appearance, while the opposition betweenlack and Luminous defines a second, orthogonal axis.gain, “Whiteness” and “Blackness” are separate pro-esses in the hyperspherical model of color discriminationf Izmailov and Sokolov [16]. Most recently, Vladusicht al. [17] worked with axes of Brightness and Darkness.
A MDS solution may provide clues for building a stageodel of how color information is encoded in the course of
ortical processing. In this light, the nonlinearities ofolor processing (e.g., hue shifts) provide a useful crite-
ion for choosing among these alternative frameworks ofxes. A framework is a promising candidate if the axesan be interpreted as neural channels in a stage model,hich in turn can accommodate the nonlinearities in aarsimonious way. The study by Shinomori et al. [18] hashown how the nonlinear properties of induced blacknessrovide information for such models. In particular, non-inearities place constraints on the stage of visual pro-essing where spatial-contrast computations occur.
. METHOD. Subjectshe experiment was carried out at Moscow Lomonosovtate University, Russia. Participants were threeussian-speaking women aged 21, 22, and 24 years. Theyere confirmed as normal trichromats using the Rautiannomaloscope [19].
. Stimuli=156 stimuli were presented foveally in Maxwellian
iew. Each consisted of a monochromatic center of fixeduminance (LC=10 cd/m2 or 38 Td) subtending 2° and aontrast-inducing annulus with 2° inner and 6° outer di-meter. Broadband white light from two KGM-24ungsten-filament sources (ca. 2850 K) were combinedith a photometric cube (see [16], Fig. 1). For the annu-
us, one beam was filtered with a neutral wedge; for theenter, the other beam passed through Zeiss interferencelters with 4 to 6 nm half-bandwidth. The central wave-
ength �C ranged across 25 values from 425 to 675 nm,ith a 26th center consisting of white neutral-filtered
ight. Six levels of annulus luminance LA were tested,anging across three orders of magnitude: 0.2, 2, 10, 20,00, and 200 cd/m2 (or 0.76, 7.6, 38, 76, 380, and 760 Td).hus values of the annulus/center luminance ratio, useds the parameter in the following analysis, were 0.02, 0.2,, 2, 10, 20.
. Procedureach combination of central wavelength and annulus lu-inance �26�6=156� was presented 20 times over 10
essions, in pseudorandom order. One second of exposureas followed by 15–20 s of darkness while the observerescribed the appearance of the center using a variant ofhe color-naming procedure [4,10,11]. Observers could usehe six Russian terms for Red (krasnyj), Yellow (žëltyj),reen (zelënyj), Blue (sinij), White (belyj), and Black
čërnyj): R, Y, G, B, W, and Bk. An additional term forlue in Russian is goluboj, but its denotata relate to
ighter and low-saturated blues [20]. One, two, or threeerms were permitted for a description in order of de-reasing salience (e.g., Green; or Yellow-Red; or Blue-reen-Black).
. Analysiscolor term scored 10 points if it was used in isolation;
wo terms received 6 and 4 points in order of salience;hree terms received 5, 3, and 2 points. Summed over pre-entations, points for each color term (ranging in valuerom 0 to 200) produced the color-naming function [7,10].omparing color-naming functions between all possible
p0c
qvomppod
msct(tp[
saigu
3AFgo
ic(mmtot
FLN
Bimler et al. Vol. 26, No. 1 /January 2009 /J. Opt. Soc. Am. A 165
airs of observers gave correlations of 0.86, 0.90, and.88. We decided that this showed sufficient similarity toombine the observers’ responses.
Next, the similarity between any pair of stimuli wasuantified as the covariance between the correspondingectors of color-name values before analysis of the matrixf similarities with Kruskal’s algorithm for nonmetricultidimensional scaling [11]. MDS represents stimuli as
oints in an n-dimensional space, arranged so that inter-oint distances reflect interitem similarities. A badness-f-fit function Stress1 quantifies the mismatch betweenistances and similarities.It is worth emphasizing that any chromatic and achro-atic axes emerging from the MDS analysis have the
ame units. A difference between two stimuli of some per-entage in White-naming makes the same contribution tohe dissimilarity between them as the same difference ofsay) Red-naming: that is, achromatic and chromaticerms are treated equivalently. In this respect the presentrocedure differs from the “4+1” hue-scaling procedure8]. There, subjects first estimate the saturation of each
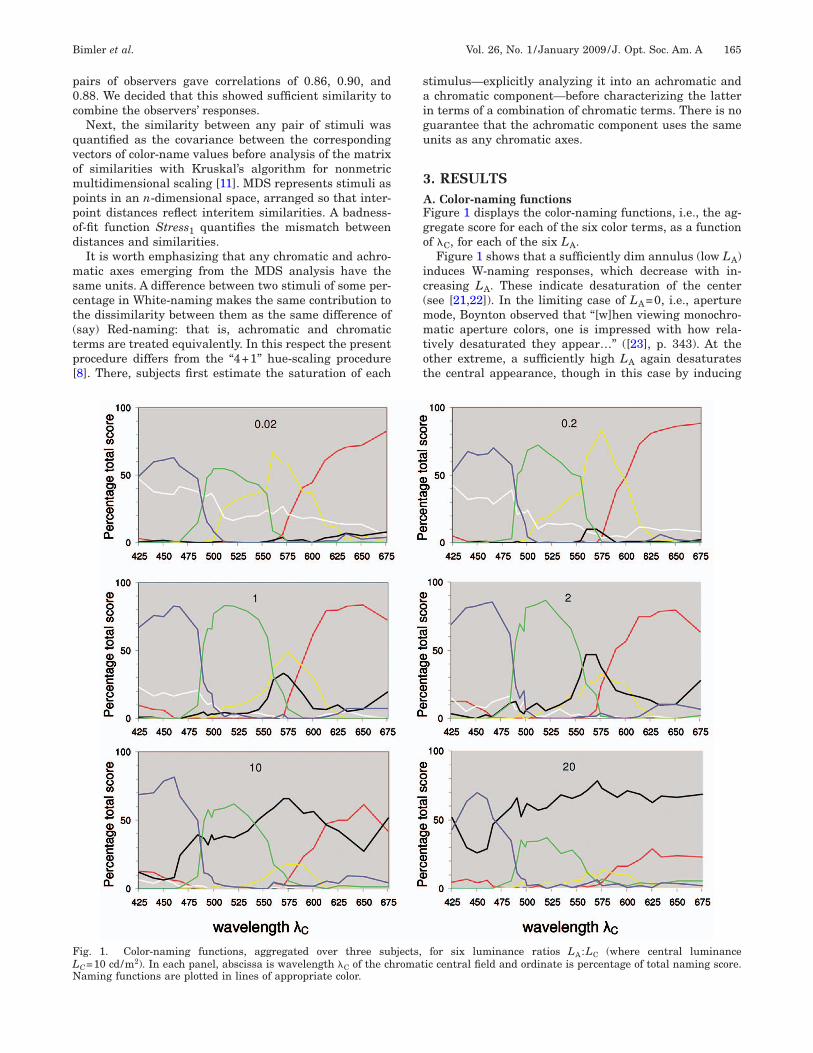
ig. 1. Color-naming functions, aggregated over three subC=10 cd/m2). In each panel, abscissa is wavelength �C of the chaming functions are plotted in lines of appropriate color.
timulus—explicitly analyzing it into an achromatic andchromatic component—before characterizing the latter
n terms of a combination of chromatic terms. There is nouarantee that the achromatic component uses the samenits as any chromatic axes.
. RESULTS. Color-naming functionsigure 1 displays the color-naming functions, i.e., the ag-regate score for each of the six color terms, as a functionf �C, for each of the six LA.
Figure 1 shows that a sufficiently dim annulus (low LA)nduces W-naming responses, which decrease with in-reasing LA. These indicate desaturation of the centersee [21,22]). In the limiting case of LA=0, i.e., apertureode, Boynton observed that “[w]hen viewing monochro-atic aperture colors, one is impressed with how rela-
ively desaturated they appear…” ([23], p. 343). At thether extreme, a sufficiently high LA again desaturateshe central appearance, though in this case by inducing
for six luminance ratios LA:LC (where central luminanceic central field and ordinate is percentage of total naming score.
jects,romat

BhTiYLllGr�
aoc=e
ahhs“q(f
BMws4sssnfanw
tyaF
nambdtca
nLLl[
x
wsntmiiatsmnTna
c“nachvMa
LWBitra
Fp=atde
166 J. Opt. Soc. Am. A/Vol. 26, No. 1 /January 2009 Bimler et al.
k-naming. Thus the proportion of chromatic responses isighest at some intermediate luminance ratio LA/LC.his ratio is not constant across the spectrum but rather
s a function of the central hue. For instance, the-naming function peaks around LA/LC=0.2 (Fig. 1); asA increases above this ratio, mid-wavelength yellow
ights (around 575 nm) are increasingly named Bk. Atonger and shorter wavelengths respectively, R- and-responses peak at higher levels of LA, while B-naming
esponses are not supplanted by Bk-naming until LA/LC2.To simplify the chromatic responses, it is convenient to
ssume that Green (G) and Red (R) are complementarypposites, allowing their color-naming functions to beombined into a single difference function GR��C,LA�G��C,LA�−R��C,LA�. Similarly, the Blue–Yellow differ-nce function is BY��C,LA�=B��C,LA�−Y��C,LA�.
Further, by assuming that these difference functionsre orthogonal, they can be reduced to a single angularue coordinate: H��C,LA�=arctan (GR/BY). The premiseere is that GR and BY are sine and cosine functions, re-pectively, of the Hue angle (H) [10]. H ranges from 0° forunique blue” to around 270° for “unique red,” while theuadrant 270° to 360° contains short-wavelength violetand also nonspectral purples). We will return to thisunction shortly.
. Color space representationsDS solutions with dimensionality ranging from 2 to 5ere fitted to the 156-by-156 covariance matrix. The re-
pective values of Stress1 were 19.2%, 8.8%, 6.0%, and.8%. We opted for the four-dimensional (4D) solutionince the fourth dimension was the last to provide a sub-tantial improvement in fit (see [24]). This solution con-ists of 156 points in 4D space, each located by coordi-ates �xi1 ,xi2 ,xi3 ,xi4�. Plausible interpretations could beound for its axes (labeled D1,D2,D3,D4) but not for thedditional axis of a five-dimensional solution. The coordi-ates of color points in this 4D color space are shown else-here, plotted against wavelength ([25], Fig. 1).D1 and D2 of this 4D color space reflect the two percep-
ual chromatic systems: xi1 (“green/red”) and xi2 (“blue/ellow”) are very similar to the difference functions GRnd BY, derived directly from the color-naming data inig. 1.Conversely, all the achromatic content of the color-
aming descriptions is channeled into D3 and D4, whichre plotted in Fig. 2. The six stimuli with a given �C arearked with the same (arbitrary) symbol and connected
y a line. In each case, the line follows a gradient from theimmest annulus (at the left) to most intense annulus (athe right). Note, in particular, that the six broadband-enter stimuli (uppermost line in Fig. 2) are dispersedlong D3 and are all at the positive extreme of D4.We interpret D3 as “strength of contrast-induced black-
ess.” Equivalently, by reversing its polarity and takingight and Black as opposites, it could be interpreted asightness, loosely comparable to Luminance (cf. Hegge-
und’s “Luminous / Black” variable, [15]). Bimler et al.25] examined some of the properties of this variable.
Figure 3 shows how this “Induced Blackness” qualityinteracts with Hue angle for the 150 combinations of
i3avelength and luminance contrast. Again, lines link thetimuli with the same �C but different annular lumi-ance, and clearly the lines are not vertical. That is, spa-ial contrast not only determines the location of the chro-atic center along the Blackness / Lightness continuum,
t also affects its hue. For instance, as annulus intensityncreases, a 560 nm center shifts from containing greennd yellow in equal parts to appearing much more greenhan yellow (Fig. 2). For comparison, Fig. 3(b) demon-trates the BB shift by plotting Hue angle and central lu-inance LC from an earlier study where stimulus lumi-
ance objectively varied and no contrast was present [7].he effects of decreasing LC (vertical axis) on the combi-ation of color terms used to describe some wavelengthsre qualitatively similar to those of induced blackness.As noted, the highest values of xi4 are for broadband-
enter stimuli. This prompts an interpretation of D4 asDesaturation,” with the most saturated centers at itsegative extreme. At the lowest LA levels, plotting xi4gainst �C produces a curve (not shown here) that repli-ates the direct ratings of desaturation obtained from aue-scaling study of aperture-mode stimuli [8]. The xi4alues also coincide with the Desaturation axis found in aDS analysis of similar data in which Black was not
mong the response options [7].Holding �C constant and starting at the lowest level of
A, the values of xi4 decrease with increasing LA (ashite-responses dwindle) and then increase again aslack-naming comes to dominate the responses, produc-
ng V profiles in Fig. 2. These �C curves are displaced ver-ically by a wavelength-dependent quality of “innate satu-ation.” Figure 4(a) plots xi4 against LA:LC and �C, fornother view of these V profiles and their varying vertical
ig. 2. D3/D4 projection of the MDS solution (achromaticlane). Horizontal axis D3=Induced Blackness; vertical axis D4Desaturation. Units along both axes are arbitrary. For each �C,line connects the six points—all marked with the same (arbi-
rary) symbol—representing the six stimuli with the same �C butifferent annular intensities. Eight lines are identified asxamples.

dcie(y
Yect
pqclw[
abtstiar
b(aadwlm
olfismc
Fn in (b)
Ftpmo
Bimler et al. Vol. 26, No. 1 /January 2009 /J. Opt. Soc. Am. A 167
isplacements. At the highest LA, some of the decline inhromatic quality can be ascribed to entropic scattering,n which light from the annulus is scattered within theye and obscures the relatively dim light from the center[4], Table 1). Note that the variation of xi4 is smallest forellow lights ��C�570–575 nm�. The proportion of
ig. 3. Hue angle (in degrees; horizontal axis) for each �C, showance of the chromatic center, LC �log cd/m2�. Vertical-axis scale
ig. 4. Desaturation (vertical axis) as a function of �C (horizon-al axis) and a second variable (third axis, out of the plane of theage). Second variable is (a) spatial contrast and (b) central lu-inance LC. The list of wavelengths used to provide (b) does not
verlap completely the wavelengths in the present research.
ellow-responses does decline with increasing LA; how-ver, according to the MDS outcome, this indicatesontrast-induced blackness rather than a loss of satura-ion per se.
It is worth emphasizing that the changes in saturationroduced by objectively varying a light’s intensity areuite different (Fig. 4(b); see also [7], Fig. 4(b)). Specifi-ally, as luminance LC decreases, short-wavelength blueights become more saturated, more distinct from White,hile mid-wavelength yellow lights become “washed out”
7].It might seem that the hue shift shown in Fig. 3(a) is
n artifact of this saturation shift and is explicable purelyy the decline in Yellow-responses at higher LA. However,his is not so, since a hue shift is evident even when LA ismall. Note also that the chromatic axes D1 and D2 are inheory corrected for the saturation effect, but a hue shifts still apparent when we plot Induced Blackness againstn alternative hue angle ���C,LA�, based on xi1 and xi2ather than on the difference functions GR and BY.
Figure 2 shows that the lines plotting the D3/D4 com-inations for the different �C all reach their minima of D4vertical axis) at about the same D3 value (horizontalxis). In other words, when spatial luminance contrast isdjusted to maximize the central saturation, it also in-uces about the same extent of blackness, independent ofavelength. These two qualities are linked. However, the
uminance ratio (spatial contrast) required to reach thisaximum-saturation (MaxS) criterion is not constant.For a given �C, the MDS solution contains six points,
ne for each LA. Plotting those six values of xi4 againstog�LA/LC� forms the appropriate line in Fig. 4(a); this istted by a quadratic curve (using least-squares regres-ion). The MaxS ratio for the wavelength is given by theinimum of this curve. We label this ratio MaxS��C�, be-
ause it is a function of � , plotted in Fig. 5. This ap-
e effects of (a) Induced Blackness xi3 (vertical axis) and (b) lumi-is reversed for parity with (a).
ing th
C

pffins
lbtxaiFdtmaa5
4IfeIo“tpgbnssBmwpSaol
Kt
tanWmi“c
tagritr[
rnNpmnnoIsst
o
Fsddit
FplsaIsu
168 J. Opt. Soc. Am. A/Vol. 26, No. 1 /January 2009 Bimler et al.
roach is easier than finding MaxS��C� by interpolationrom the raw data. The MaxS criterion is not the same asnding the LA/LC ratio that balances the W- and Bk-aming responses for a given �C (i.e., equal to “W-Bk re-ponsivity” [26]).
Returning now to the third axis, a similar approach al-ows us to interpolate among the six xi3 values producedy various levels of contrast for a given �C. Generallyhese were a good approximation to a sigmoid function:i3�tanh�a+b log�LA/LC��. For each �C we determined and b by regression. Choosing three values of xi3 and solv-ng for LA/LC resulted in the other three curves shown inig. 5. Each curve shows the contrast required to induce aesired degree of blackness into the center (for instance,o reach the point of total blackness where no color re-ains). All these curves show certain key features: a peak
t each end of the spectrum and a secondary peak atround 525 nm, separating two troughs at about 480 and50 nm.
. DISCUSSIONn the language of color description, “red” and “green”orm the polar extremes of one dimension of color experi-nce; they are not used together to describe the same hue.n the same way, “blue” and “yellow” constitute the polesf a second chromatic dimension. Hering [27] yokedwhite” and “black” as a third pair of polar opposites, butheir behavior differs in certain ways from the previousairs. First, black and white can coexist [17,28], so that aiven shade of gray might be described as containinglack and white in equal amounts. Second, “blackness” isot observed in isolation and cannot be examined in theimplified situation of aperture mode (total absence of vi-ual stimulation produces the experience of eigengrau).lackness exists only as part of an environment, andust be induced by contrast with a lighter color else-here in the visual field (spatial contrast) or immediatelyreceding the test stimulus (temporal contrast [29]).hades of gray and brown are not part of the gamut ofperture-mode color either, since they contain an elementf black [30,31] and are observed only in the company of aighter stimulation to provide context. Volbrecht and
ig. 5. Luminance ratio LA:LC predicted to reach maximum-aturation function MaxS��C�, plotted as black curve. Dark gray,ashed, and light gray curves indicate the ratio predicted to pro-uce xi3=0,2,4 (i.e., to induce three specific levels of blacknessnduction), as a function of �C. Abscissa shows wavelength �C ofhe chromatic central field.
liegl [32] reviewed the phenomenological debates andhe empirical literature around blackness perception.
Moreover, Evans and Swenholt observed that “the con-inuum of color perceptions of a color stimulus seengainst a variety of backgrounds is four dimensional”—ot three-dimensional, as one would expect if Black andhite were the mutually incompatible poles of a single di-ension ([33], p. 628). Evans and Swenholt argued that
n the presence of spatial contrast, the saturation andgray content” (the opposite of the color “fluorence”) of aentral stimulus can be manipulated independently.
Again, Logvinenko and Maloney [12] pointed out thathere are two independent variables to be deduced fromn achromatic object when it appears against a back-round: the absolute illuminance and the object’s relativeeflectance. These authors elicited judgments of similar-ty among stimuli of varying luminance and spatial con-rast. MDS analysis of these judgments showed that ach-omatic stimuli occupy a two-dimensional gamut (see also16,17]).
In the present study it was convenient to map the ach-omatic plane in terms of a bipolar axis of Induced Black-ess, and a second axis of Desaturation (similar to [16]).ote, however, that other pairs of achromatic axes areossible [13,14]. For instance, one could rotate the achro-atic plane through 45° to new axes: a unipolar Light-ess axis and a second, orthogonal, unipolar axis of Dark-ess (diagonal axes in Fig. 6). This would have no effectn how to interpret the chromatic aspects of the stimuli.zmailov and Sokolov [16] and Izmailov et al. [24] de-cribed a hyperspherical model, with Black and White aseparate achromatic axes, to account for color discrimina-ion.
It would be of interest to extend the present methodol-gy by varying the chromatic purity and luminance LC of
ig. 6. Schematic diagram of achromatic plane. Example of em-irical V-profile shows locations of 494 nm stimuli. Diagonalines indicate unipolar axes of Darkness and Lightness (morepecifically, Black Desaturation and White Desaturation). Theserise from two achromatic qualities created by spatial contrast:nduced Blackness (or with polarity reversed, Lightness) and De-aturation. Dashed vertical lines indicate some of the thresholdssed to measure induced blackness (see text for further details).

tttcccfis
d“wlctBfl�ba�
ldaibhnCwrcaaMnlbd5
slspeDfitnaa
oIcftvb
efls“catw5
pcfpmbwtwrilttqcti“
rcirBpbisdst[ltls
idctmtt=bnts
b
Bimler et al. Vol. 26, No. 1 /January 2009 /J. Opt. Soc. Am. A 169
he monochromatic test field. In the present research,hough, only two stimulus parameters were varied: theest-field wavelength and degree of contrast. Under theseonditions, the stimuli can be regarded as points on a lo-ally two-dimensional surface embedded within the 4Dontinuum of color perception. The color points are con-ned to the surface of the 4D MDS solution: they do notample its interior.
With monochromatic stimuli, the desaturation pro-uced by contrast is superimposed on variations in theinnate saturation” of the chromatic test fields [Fig. 4(a)];hen plotted in a color space (e.g., CIELAB), prismatic
ights do not form a circular spectrum around W at theenter. The mechanics of color processing produce a locushat is more of a distorted triangle, with corners in thelue, Green, and Red regions of the spectrum, farthest
rom W. Conversely, at the middle of one triangle sideinking Green to Red, monochromatic yellow light at570 nm is relatively close to the center, indicating it to
e lower in saturation and brightness. Near the middle ofnother side linking Blue to Green, blue-green light at480 nm is also relatively desaturated.As a corollary of their greater saturation, some wave-
engths have a higher hue-purity threshold: they can beiluted with a larger ratio of white light before they losell visible hue (otherwise termed “chrominance” or “color-ng power,” [23], p. 342). A larger amount of inducedlackness is also required to completely extinguish theirue. This might seem to blunt the argument that black-ess induction per se depends on test-field brightness:ould it be that blackness induction is the same for all �C,ith some wavelengths requiring a higher ratio LA/LC to
each a given criterion of blackness (see Fig. 5) simply be-ause of a higher “resistance to dilution”? However, thislternative explanation does not account for the variationcross wavelengths of the maximum-saturation ratioaxS��C�. The similarity between MaxS��C� and bright-
ess function B� affirms that brightness of the centralight is a crucial parameter in the induction of blacknessy spatial contrast: a fixed level of luminance contrast in-uces more blackness into less-bright wavelengths (e.g.,70 nm).For a given �C, the stimuli produced by varying the
ingle parameter LA are sampled from a one-dimensionalocus within the achromatic plane, so for the presenttimuli, Desaturation and Induced Blackness are interde-endent. More specifically, the lines linking stimuli forach �C in Fig. 2 show a V-shaped relationship betweenesaturation and Induced Blackness. The chromatic testeld is most saturated when its brightness is balanced byhe luminance of the surround, inducing neither black-ess nor whiteness. The variations of innate saturationlong the spectrum displace these V curves verticallylong the Desaturation axis.We are not aware of any direct measurements (ratings)
f central saturation across the range of spatial contrast.nstead, numerous studies have examined the spatialontrast required to reach particular thresholds, as aunction of �C. Evans and Swenholt ([34], Fig. 3) plottedhe luminance ratio where the last element of graynessanished from the stimulus appearance and “fluorence”egan. They coined the name “fluorence” for a phenom-
nal property of surface-mode color: the impression of auorescent surface created when a colored stimulus iseen against a white surround of similar luminance. Thisperceptible grayness,” or G0 criterion, is similar in con-ept to the function MaxS��C� (Fig. 5) but is measured inn entirely different procedure. Reassuringly, it displayshe same features: troughs at 480 and 570 nm, peaks to-ard each end of the spectrum, and a secondary peak at10 nm.A different criterion is the ratio required to induce com-
lete blackness and remove the last trace of hue from theenter. This ratio, as Evans and Swenholt [34] reported,ormed a curve in parallel with G0 that, however, was dis-laced vertically along the ratio axis by a log step. Shino-ori et al. ([18], Fig. 3) considered this same total-
lackness aspect of spatial contrast. They found thathen the central light was a mixture of two wavelengths,
he luminance ratio required to meet the criterion was nothat one would predict by simple interpolation from the
atio for each wavelength separately. That is, blacknessnduction is nonadditive—which distinguishes it from theuminance function V�, which is additive. Shinomori et al.ranslated their blackness-induction function from rela-ive to absolute terms—the photon flux in the annulus re-uired to induce the complete-blackness criterion—andoncluded that this “spectral efficiency of blackness func-ion” was similar to the brightness function B�, if notdentical. Like B�, blackness induction showed diagnosticnotches” at 480 and 570 nm.
The other extreme of spatial contrast is where the sur-ound is not lit at all, so that the visual field is dark ex-ept for a small uniform colored center. This is the limit-ng case of aperture mode. Aperture mode is oftenegarded as a particularly simple form of color perception.ut although the surround is black, it still exists, and theresent data show that a sufficiently dark surround orackground desaturates the center by inducing whitenessnto it (in line with Boynton’s comment about the lowaturation of aperture-mode light [23]). In Heggelund’s bi-imensional model a transition between aperture andurface-mode color occurs when increasing spatial induc-ion changes the sign of the “Luminous/Black” variable15]. Uchikawa et al. [35] examined the level of surrounduminance associated with this transition as a function ofest-field spectral composition. The threshold was muchower than “perceptible grayness” but followed a similarpectrum, determined by the brightness of the test field.
Thus the brightness of a central stimulus, rather thants luminance, determines the degree of blackness in-uced into it. In contrast, there is a broad experimentalonsensus that the spectral composition and brightness ofhe inducing annulus is irrelevant [36–38], leaving its lu-inance as the crucial parameter. In the present data,
his asymmetry is most evident in the observations wherehe surround has the same luminance as the center, LALC. The yellow stimuli, which are only marginallyrighter than the surround (due to their low chromi-ance), contain a component of Black (Fig. 1). In contrast,he blue stimuli are significantly brighter and attract aignificant number of White-responses.
We note in passing that the color temperature of theroadband annulus was lower than ideal �2850 K�, with a

spbc[tt
(diarhctwwa
5Etgicefria
nis
rnmcbsoJatodt
aswtlsFeabytIatacpi
tb
FsSBA=rcs
170 J. Opt. Soc. Am. A/Vol. 26, No. 1 /January 2009 Bimler et al.
light yellow tinge. However, the lesson from the previousaragraph is that this slight yellowness was not crucial tolackness induction. The surround hue does influencehromatic induction, but even here, Evans and Swenholt33] found only minimal differences in the effects of spa-ial contrast when they switched the color temperature ofhe broadband surround from 7000 K to 3000 K.
Gordon and Shapley [39] used the opposite geometryan achromatic center and a chromatic surround) and aifferent paradigm (induction of the complementary huento the center). Once again, spatial induction was medi-ted by brightness—in their paradigm, that of the sur-ound. Any brightness-defined boundary appeared to in-ibit chromatic induction, which was strongest whenenter and surround were equally bright. This is consis-ent with Heggelund’s prediction ([15], Fig. 12) that colorsill be less affected by the mechanisms of color constancyhen in aperture mode, appearing to be self-luminousnd dissociated from the visual environment.
. CONCLUSIONSvidence has already been presented that spatial con-
rast involves an interaction between brightness in aiven chromatic region of the visual field, and luminancen an adjacent inducing region. Any complete model ofolor processing must incorporate both of these param-ters. It is possible that this asymmetric interaction is aeature of the specific retinal geometry probed in the cur-ent study: a foveal chromatic test field and a parafovealnducing region (an annulus with 2° inner and 6° outer di-meters).Figure 7 represents an attempt to incorporate Bright-
ess within the stream of color processing and to indicatets relationships to other qualities, including its role inpatial contrast. The model begins at the left, indicating
ig. 7. Model of multistage processing of chromatic informatiopatial luminance contrast and responsible for color appearance e0 channel (produces Luminance / Saturation effect). 2. Calcularightness B=Luminance+�X for some parameter �. 4. AchromaC=B−L°. 5. Lightness: D3=Luminance+� AC. Induced Blacknabsolute value of AC. 7. Saturation: D4=X− �AC� (i.e. chrominaeverse polarity. 8. Chromatic contrast: S0° and �L−M�° signalsontrast signal inhibits or promotes the chromatic signals S0 andymmetric nonlinearity on the S channel (produces Luminance/
0etinal/early cortical processing that encodes the color sig-al in terms of the �L−M� and S0=S− �L+M� chromaticechanisms, or channels. The initial inputs to these
hannels and to the Luminance signal L are linear com-inations of cone outputs. These cone-opponent channelshould not be conflated with the classical opponent pairsf the Hering [27] perceptual model (see also Hurvich andameson [40]) defined from the sensations of unique Rednd Green, Blue and Yellow. These arise at later, rela-ively uncharted stages of cortical processing [41]. Thepponent-color terms are used to collect data, but thisoes not signify that they need to dominate the data in-erpretation.
The diagram also includes channels for the achromaticxes D3 and D4 of the MDS solution obtained in thistudy. Here we are interpreting the solution literallyhile assuming that each axis corresponds to some objec-
ive phenomenon (i.e., a quality represented at the neuralevel). For comparison, Shinomori et al. ([18], Fig. 11) pre-ented a similar model, corresponding to Boxes 1–5 of ourig. 7, since it was not intended to encompass saturationffects. That model also excluded Brightness, which theuthors concluded to differ from the “spectral efficiency oflackness function.” Unlike Shinomori et al., we are notet in a position to quantify parameters or test predic-ions, so the present diagram is tentative and speculative.t is presented mainly to provide a visual explanation andframework for our conclusions rather than as a defini-
ive circuit diagram for the architecture of corticalnatomy. It seems premature to associate the hypotheti-al channels with the physiologically distinct magno-,arvo-, or koniocellular systems, or to locate the process-ng boxes in particular layers of striate cortex [42].
We note in passing that Valberg and Seim [43] explainhe nonlinear features of color vision, brightness, andlackness induction in terms of the intrinsic nonlinearity
es indicate loci and operations contributing to the influence ofSee text for details. 1. Compressive, asymmetric nonlinearity onchrominance: X= �S0�+ �L−M� (produces failure of additivity). 3.
trast (AC) between central Brightness and surround Luminance:ame axis with reverse polarity. 6. Desaturating signal= �B−L° �duced by Desaturating signal). Desaturation is same axis with
surround induce complementary hue into center. 9. Achromatic� (necessary for induced blackness to affect hue). 10. Expansive,fect, or BB hue shift).
n. Boxffects.
tion oftic coness=snce, refrom�L−M
Hue ef

opnr
rnrsn(aestlB
sisnplasc
cfietttmcm
(csatSmmrdot
FprSTlfcost
su�ctitwbavadon
fTsmtto
tohoacrlstsslbplhlaltsia
ATfRaSe2P
Bimler et al. Vol. 26, No. 1 /January 2009 /J. Opt. Soc. Am. A 171
f opponent cells within the parvo pathway. In their ap-roach, qualities such as brightness emerge as epiphe-omena, and there is no need to postulate dedicated neu-al pathways or mechanisms.
Our model postulates a “chrominance,” or “innate satu-ation,” signal �X�, generated through a nonlinear combi-ation of the S0 and �L−M� channels (Box 2). It can beegarded as a first approximation as the distance in colorpace between the hue in question and White. Chromi-ance in turn combines additively with Luminance LC
Box 3) to produce the Brightness signal B. B is conceptu-lly linked to saturation: in the Helmholtz—Kohlrauschffect (e.g. [44]), a saturated hue is seen as brighter thanome equally luminant but less saturated hue. Thus W ishe limiting case of zero chroma, while monochromaticights are at the other extreme, with maximal chroma andrightness.In order for the brightness of the test field to mediate
patial contrast, the B signal must appear prior to lateralnteractions and the computations of contrast. Box 4hows a subtractive interaction between B and the LA sig-al from adjacent regions of the visual field, yielding a bi-olar achromatic contrast signal AC. AC in turn modu-ates the test field LC at Box 5, increasing or reducing itccording to the sign and extent of spatial contrast, re-ulting in the perceived lightness (or blackness) of theenter (Induced Blackness axis D3 in Figs. 2 and 6).
However, although LC and the degree of contrast bothontribute to the perceived lightness of a chromatic testeld, their effects must diverge in some way. If the param-ters were interchangeable, so that it was always possibleo shift central luminance by some �LC while adjustinghe spatial contrast so as to cancel out the effect of �LC onhe achromatic content of the test field, then that achro-atic content would be (locally) one dimensional. This is
ontrary to the evidence that achromatic quality is two di-ensional under conditions of contrast [12,17,33].The model incorporates this by rectifying the AC signal
Box 6) and subtracting its absolute value from thehrominance X (Box 7). The output of Box 7 is observedaturation, a sign-reversed version of the Desaturationxis D4 of Fig. 2. Thus we see a V-shaped relationship be-ween surround luminance and desaturation [Fig. 4(a)].ome intermediate level of induced blackness xi3 mini-izes the desaturation of the test field (Fig. 2). This opti-al level of xi3 is constant across �C, although the sur-
ound luminance required to induce it is the wavelength-ependent function MaxS��C�. At this criterion, thebserved saturation is the chrominance without attenua-ion by positive or negative spatial contrast.
Objective variations in LC affect saturation differently.igure 4(b) shows a monotonic shift, with its direction de-ending on the S0 signal produced by the test field: satu-ation increases with LC for short wavelengths (positive0) and decreases for longer wavelengths (negative S0).his “Purdy saturation shift” implies an asymmetric non-
inearity within the S0 opponent channel [9] (Box 1), be-ore the locus of spatial contrast. This still leaves the lo-us of nonlinearity undefined; it could occur at a numberf places along the opponent channel, from its origin inhort-wavelength cone responses up to its contribution tohe Saturation signal.
Consider now the familiar Bezold–Brücke hue shift as-ociated with LC. This can be explained if the S0 channelndergoes an expansive nonlinearity relative to theL−M� channel, so that increasing the intensity of a huehanges its chromatic description by increasing the rela-ive proportion of the S0 signal [7]. This second nonlinear-ty is symmetric: the magnitudes of a negative and a posi-ive S0 signal both increase with luminance, so thathere S0 is positive, blue-greens and purples becomeluer, while where S0 is negative, yellow-greens and or-nges become yellower [Fig. 3(b)]. Exceptions are the in-ariant hues, which retain a constant appearance acrossrange of luminance levels. These lie on one or other car-inal axes—they are characterized by a null signal on onef the chromatic channel, which remains null after anyonlinearity.Figure 3(a) shows that a very similar hue shift results
rom varying the blackness induced by spatial contrast.his implies a third role for the brightness-mediatedpatial-contrast signal AC: at some stage of processing, itust reach the �L−M� and S0 channels and amplify or at-
enuate their signals (Box 9 in Fig. 7). A second implica-ion for the architecture of visual processing is this mustccur before the locus of the S0 nonlinearity at Box 10.
Why the brightness of a chromatic test field should de-ermine spatial contrast (interacting with the luminancef the surround) is secondary to the question of why weave a percept of “brightness” at all. It is not immediatelybvious how “brightness” assists our responses to color, inddition to the information already contained in the per-ept of luminance. Uchikawa et al. [35] suggest that theight context for understanding these issues is the eco-ogical value of being able to distinguish self-luminoustimuli from stimuli that are reflective surfaces. The dis-inction depends on how much light a surface might plau-ibly reflect: if the light flux from some region of the vi-ual field exceeds this limit, then the region is self-uminous and should stand out subjectively from theackground (according to Heggelund [15], it will be decou-led from color-constancy interactions). Calculating theimit accurately is complex: it depends on the chroma andue of the region in question, on the inferred ambient il-
umination, and on constraints of physics. Uchikawa et al.rgue that stimulus Brightness is not perfect, but it al-ows a good approximation to calculating the limit. Essen-ially Brightness allows the visual system to segregateelf-luminous stimuli from their visual backgrounds—andn passing, to generate the percepts of “aperture-mode”nd “surface-mode” color.
CKNOWLEDGMENTShe authors are grateful to the participants of this study
or their time, understanding, and collaborative spirit.esults of the experiment described here were presentedt the 18th Symposium of the International Colour Visionociety (ICVS), Lyon, France; the 29th European Confer-nce on Visual Perception, St. Petersburg, Russia; and thend Iberian Conference on Perception, Madrid, Spain.arts of the results were published in Proceedings of the

1ws
R
1
1
1
1
1
1
1
1
1
1
2
2
2
2
2
2
2
2
2
2
3
3
3
3
3
3
3
3
3
3
4
4
4
4
4
172 J. Opt. Soc. Am. A/Vol. 26, No. 1 /January 2009 Bimler et al.
8th ICVS Symposium [25]. We are grateful to a reviewerhose constructive suggestions improved the original ver-
ion of this paper.
EFERENCES1. D. M. Purdy, “Spectral hue as a function of intensity,” Am.
J. Psychol. 43, 541–559 (1931).2. D. M. Purdy, “The Bezold–Brücke phenomenon and
contours of constant hue,” Am. J. Psychol. 49, 313–315(1937).
3. S. Coren and B. Keith, “Bezold–Brücke effect: Pigment orneural location?” J. Opt. Soc. Am. 60, 559–562 (1970).
4. K. Fuld and T. A. Otto, “Colors of monochromatic lightsthat vary in contrast-induced brightness,” J. Opt. Soc. Am.A 2, 76–83 (1985).
5. D. M. Purdy, “On the saturations and chromatic thresholdsof the spectral colours,” Br. J. Psychol. 21, 282–313 (1931).
6. A. Valberg, B. Lange-Malecki, and T. Seim, “Colour changesas a function of luminance,” Perception 20, 655–668 (1991).
7. D. L. Bimler and G. V. Paramei, “Bezold–Brücke effect innormal trichromats and protanopes,” J. Opt. Soc. Am. A 22,2120–2136 (2005).
8. J. Gordon and I. Abramov, “Scaling procedures forspecifying color appearance,” Color Res. Appl. 13, 146–152(1988).
9. K. Fuld, “The contribution of chromatic and achromaticvalence to spectral saturation,” Vision Res. 31, 237–246(1991).
0. R. M. Boynton and J. Gordon, “Bezold–Brücke hue shiftmeasured by color-naming technique,” J. Opt. Soc. Am. 55,78–86 (1965).
1. R. N. Shepard and J. D. Carroll, “Parametricrepresentation of nonlinear data structures,” inInternational Symposium on Multivariate Analysis, P. R.Krishnaiah, ed. (Academic, 1966), pp. 561–592.
2. A. D. Logvinenko and L. T. Maloney, “The proximitystructure of achromatic surface colours and theimpossibility of asymmetric lightness matching,” Percept.Psychophys. 68, 76–83 (2006).
3. Y. Nayatani, “On attributes of achromatic and chromaticobject-color perceptions,” Color Res. Appl. 25, 318–322(2000).
4. I. Lie, “Psychophysical invariants of achromatic colourvision: I. The multidimensionality of achromatic colourappearance,” Scand. J. Psychol. 10, 167–175 (1969).
5. P. Heggelund, “A bidimensional theory of achromatic colorvision,” Vision Res. 32, 2107–2119 (1992).
6. C. A. Izmailov and E. N. Sokolov, “Spherical model of colorand brightness discrimination,” Psychol. Sci. 2, 249–259(1991).
7. T. Vladusich, M. P. Lucassen, and F. W. Cornelissen,“Brightness and darkness as perceptual dimensions,”PLOS Comput. Biol. 3(10), e179 (2007). doi: 10.1371/journal.pcbi.0030179.
8. K. Shinomori, B. E. Schefrin, and J. S. Werner, “Spectralmechanisms of spatially induced blackness: data andquantitative model,” J. Opt. Soc. Am. A 14, 372–387 (1997).
9. G. N. Rautian, “New anomaloscope,” Biofizika 2, 734–742(1957) (in Russian).
0. G. V. Paramei, “Singing the Russian blues: An argumentfor culturally basic color terms,” Cross-Cult. Res. 39, 10–38(2005).
1. T. S. Troscianko, “Saturation as a function of test-field sizeand surround luminance,” Color Res. Appl. 7, 89–94 (1982).
2. I. T. Pitt and L. M. Winter, “Effect of surround on perceivedsaturation,” J. Opt. Soc. Am. 64, 1328–1331 (1974).
3. R. M. Boynton, “Color, hue and wavelength,” in Handbook
of Perception (Vol. 5, Vision), E. C. Carterette and M. P.Friedman, eds. (Academic, 1975), pp. 300–347.
4. C. A. Izmailov, E. N. Sokolov, and S. Chtioui, “Sphericalmodel of color discrimination under the conditions ofsimultaneous color contrast,” Vestnik Mosk. un-ta. Ser. 14.Psikhologiya No. 4, 21–36 (1999) (in Russian).
5. D. Bimler, G. V. Paramei, and C. A. Izmailov, “A whitershade of pale, a blacker shade of dark: Parameters ofspatially induced blackness,” Visual Neurosci. 23, 579–582(2006).
6. K. Fuld, T. A. Otto, and C. W. Slade, “Spectral responsivityof the white-black channel,” J. Opt. Soc. Am. A 3,1182–1188 (1986).
7. E. Hering, Outlines of a Theory of the Light Sense.Translated by L. M. Hurvich and D. Jameson (Harvard U.Press, 1920/1964).
8. P. C. Quinn, B. R. Wooten, and E. J. Ludman, “Achromaticcolor categories,” Percept. Psychophys. 37, 198–204 (1985).
9. V. J. Volbrecht and J. S. Werner, “Temporal induction ofblackness: 2. Spectral efficiency and tests of additivity,”Vision Res. 29, 1437–1455 (1989).
0. K. Fuld, J. S. Werner, and B. R. Wooten, “The possibleelemental nature of brown,” Vision Res. 23, 631–637(1983).
1. P. C. Quinn, J. L. Rosano, and B. R. Wooten, “Evidence thatbrown is not an elemental color,” Percept. Psychophys. 43,156–164 (1988).
2. V. J. Volbrecht and R. Kliegl, “The perception of blackness:An historical and contemporary review,” in Color Vision:Perspectives from Different Disciplines, W. G. K. Backhaus,R. Kliegl, and J. S. Werner, eds. (De Gruyter, 1998), pp.187–206.
3. R. M. Evans and B. K. Swenholt, “Chromatic strength ofcolors. III. Chromatic surrounds and discussion,” J. Opt.Soc. Am. 59, 628–634 (1969).
4. R. M. Evans and B. K. Swenholt, “Chromatic strength ofcolors: Dominant wavelength and purity,” J. Opt. Soc. Am.57, 1319–1324 (1967).
5. K. Uchikawa, K. Koida, T. Meguro, Y. Yamauchi, and I.Kuriki, “Brightness, not luminance, determines transitionfrom the surface-color to the aperture-color mode forcolored lights,” J. Opt. Soc. Am. A 18, 737–746 (2001).
6. K. Shinomori, Y. Nakano, and K. Uchikawa, “Influence ofthe illuminance and spectral composition of surround fieldson spatially induced blackness,” J. Opt. Soc. Am. A 11,2383–2388 (1994).
7. V. J. Volbrecht, J. S. Werner, and C. M. Cicerone,“Additivity of spatially induced blackness,” J. Opt. Soc. Am.A 7, 106–112 (1990).
8. J. S. Werner, C. M. Cicerone, R. Kliegl, and D. DellaRosa,“Spectral efficiency of blackness induction,” J. Opt. Soc.Am. A 1, 981–986 (1984).
9. J. Gordon and R. Shapley, “Brightness contrast inhibitscolor induction: Evidence for a new kind of color theory,”Spatial Vis. 19, 133–146 (2006).
0. L. M. Hurvich and D. Jameson, “An opponent-processtheory of color vision,” Psychol. Rev. 64, 384–404 (1957).
1. R. L. De Valois and K. K. De Valois, “A multi-stage colormodel,” Vision Res. 33, 1053–1065 (1993).
2. J. S. Werner, “Human colour vision: 2. Colour appearanceand cortical transformations,” in Neuronal Coding ofPerceptual Systems. Series on Biophysics andBiocybernetics, W. G. K. Backhaus, ed. (World Scientific,2001), Vol. 9, pp. 475–497.
3. A. Valberg and T. Seim, “Neural mechanisms of chromaticand achromatic vision,” Color Res. Appl. 33, 433–443(2008).
4. G. Wyszecki and W. S. Stiles, Color Science: Concepts andMethods, Quantitative Data and Formulae, 2nd ed. (Wiley,1982), p. 410 ff.