hudson’s bay company - global banking and markets · this presentation contains forward-looking...
TRANSCRIPT

Hudson’s Bay Company Scotiabank Back to School Conference
September 17, 2013

This Presentation contains forward-looking statements about HBC’s current and future plans, expectations and intentions, results, levels of activity, performance, goals or achievements or any other future events or developments. Forward-looking statements are typically identified by words such as “expect”, “anticipate”, “believe”, “foresee”, “could”, “estimate”, “goal”, “intend”, “plan”, “seek”, “strive”, “will”, “may” and “should” and similar expressions. Forward-looking statements reflect current estimates, beliefs and assumptions, which are based on HBC’s perception of historical trends, current conditions and expected future developments, as well as other factors management believes are appropriate in the circumstances. HBC’s estimates, beliefs and assumptions are inherently subject to significant business, economic, competitive and other uncertainties and contingencies regarding future events and as such, are subject to change. HBC can give no assurance that such estimates, beliefs and assumptions will prove to be correct.
Numerous risks and uncertainties could cause the combined company’s actual results to differ materially from the estimates, beliefs and assumptions expressed or implied in the forward-looking statements, including, but not limited to: failure to realize anticipated results, including revenue growth, anticipated cost savings or operating efficiencies from the combined company’s major initiatives, including those from restructuring; failure to realize benefits from investments in the combined company’s IT systems, including the combined company’s IT systems implementation, or unanticipated results from these initiatives; the inability of the combined company’s IT infrastructure to support the requirements of the combined company’s business; significant competition in the retail industry; changing consumer preferences; changing consumer spending; the prospect of unfavourable economic and political conditions; the seasonal nature of the combined company’s business; unseasonable weather conditions or natural disasters; the combined company’s ability to continue to improve same store sales; the combined company’s ability to retain a senior management team who possess specialized market knowledge, the combined company’s dependence on its ability to attract and retain quality employees and maintaining good relations with non-unionized and unionized employees; the inability of the combined company to manage inventory to minimize the impact of obsolete or excess inventory and to control shrink; the impact of potential environmental liabilities; failure to respond to changes in consumer tastes and buying patterns; reliance on the performance and retention of third-party service providers including those associated with the combined company’s supply chain; supply and quality control issues with vendors; other disruptions to the combined company’s distribution operations or supply chain; damage to the reputation of brands promoted by the combined company, or to the reputation of any supplier or manufacturer of these brands; product quality and product safety risks which could expose the combined company to product liability claims and negative publicity; increased commodity prices, including for cotton, that may affect the combined company’s profitability; the combined company’s ability to execute its plan to reduce operating expenses; the combined company’s ability to comply with the covenants in its credit facilities; breaches of privacy; fluctuations in the value of the C$ dollar in relation to the US$; the combined company’s significant level of indebtedness; risks associated with doing business abroad; risks associated with operating freehold and leasehold property; the combined company’s ability to maintain the brand value of its various retail banners; current store locations may become less desirable; inability to protect trademarks and other proprietary rights; risks related to size and scale; insurance related risks; risks related to the combined company’s ability to maintain financial and management processes and controls; volatile market price for the combined company’s Common Shares; the combined company’s ability to pay dividends is dependent on our ability to generate sufficient income; changes in the combined company’s income, commodity, other tax and regulatory liabilities including changes in tax laws, regulations or future assessments; any requirement of the combined company to make contributions to its registered funded defined benefit pension plans, post-employment benefits plan or the multi-employer pension plans in which it participates in excess of those currently contemplated; the risk that the combined company would experience a financial loss if its counterparties fail to meet their obligations in accordance with the terms and conditions of their contracts with the combined company; the inability of the combined company to collect on its credit card receivables; failure of the combined company to lease or obtain suitable store locations on economically favourable terms; and events or series of events may cause business interruptions.
Readers are cautioned that the foregoing list of factors is not exhaustive. Other risks and uncertainties not presently known to HBC or that HBC presently believes are not material could also cause actual results or events to differ materially from those expressed in its forward-looking statements. Additional information on these and other factors that could affect the operations or financial results of HBC are included in reports filed by HBC with applicable securities regulatory authorities and may be accessed through the SEDAR website (www.sedar.com).
Readers are cautioned not to place undue reliance on these forward-looking statements, which reflect HBC’s expectations only as of the date of this Presentation. HBC disclaim any obligation to update or revise any forward-looking statements, whether as a result of new information, future events or otherwise, except as required by law.
This Presentation makes reference to certain non-IFRS measures. These measures are not recognized measures under IFRS, do not have a standardized meaning prescribed by IFRS and are therefore unlikely to be comparable to similar measures presented by other companies. Rather, these measures are provided as additional information to complement those IFRS measures by providing further understanding of HBC’s results of operations from management’s perspective. Accordingly, they should not be considered in isolation nor as a substitute for analysis of our financial information reported under IFRS. We use non-IFRS measures to provide investors with supplemental measures of our operating performance and thus highlight trends in our core business that may not otherwise be apparent when relying solely on IFRS financial measures. We also believe that securities analysts, investors and other interested parties frequently use non-IFRS measures in the evaluation of issuers. Our management also uses non-IFRS measures in order to facilitate operating performance comparisons from period to period, prepare annual operating budgets and assess our ability to meet our future debt service, capital expenditure and working capital requirements.
Forward Looking Statements / Non-IFRS Measures
1

2
HBC Today

48 / 4
$1.5B
90 / 1
$2.3B
2.2%(3)5.4%
69
$0.3B
____________________(1) Store counts as of Q2 2013.(2) Includes Home Outfitters as part of the outlet store count.(3) Calculated in local currency. L&T Q4’12 impacted by Hurricane Sandy.
138 / 74(2)
$4.1B
$310MM
3
Full-Line / Outlet (1)Full-Line / Outlet (1)
2012 Retail Sales2012 Retail Sales
2012 Same Store Sales2012 Same Store Sales
2012 Normalized EBITDA
2012 Normalized EBITDA
Hudson’s Bay Company
4.0%

4
Historical Evolution
1670: Hudson’s Bay Company (HBC) is founded by Royal Charter of King Charles II
1991: All remaining Simpson's stores are folded into the Bay brand
1978: HBC acquires Zellers 1978: HBC acquires Simpsons
1998: Zellers acquires Kmart Canada
1993: HBC acquires Woodward's
1999: HBC launches new Home Outfitters store chain
2008: NRDC, owners of US retailer Lord & Taylor, purchases balance of HBC
2006: Lord & Taylor purchased by NRDC Equity Partners
1914: Lord & Taylor moves to current 5th Avenue flagship location
1826: Lord & Taylor is founded
HBC event
L&T event
1986: May Department Stores acquires Lord & Taylor
2006: HBC is taken private by Jerry Zucker; NRDC subsequently acquires a 20% stake in the business
2011: HBC sells 189 Zellers leases to Target Corp. for ~$1.8bn
2010: HBC sponsors Vancouver Olympics
2012: HBC acquires Lord & Taylor
1670 20001995 2006 20101826 1978 19901914 1986 20112008 2012 2013
2012: HBC completes IPO at $17.00 per share
2013: HBC agrees to acquire Saks Incorporated

Positioning Brand Portfolio
Lord & TaylorOverview Store Footprint (2)
� One of the first U.S. department store chains and one of the most recognized banners in the northeastern United States
� Operates 48 full-line department stores and 4 outlet stores on the East Coast and the Midwest
� Owns / ground leases 41 locations including flagship New York store on 5th Avenue
� FY 2012 retail sales of $1.5 billion and same store sales of 2.2%(1)
� Offers top-tier brands with superior shopping experience and customer-edited merchandise assortment Dominates Top-Tier Suburban Shopping Experience
4
21
3
4
2
11
1
44
12
1
48 Full-line Stores
4 Outlet Stores
� Introduction of more affordable brands
� New brands generating ~25% of sales
� Focus on high volume and leading brands
Low
er
Customer Experience
Hig
her
Val
ue P
ropo
sitio
n
Mainstream Unique
5
____________________(1) Calculated in local currency. Q4’12 impacted by Hurricane Sandy.(2) As of Q2 2013.
12

Hudson’s Bay
Positioning Brand Portfolio
� Canada’s largest national branded department store and one of the country’s most iconic, recognizable banners
� 90 full-line department stores across Canada and 69 home specialty stores (sold Zellers stores to Target in 2011)
� Owns / ground leases 13 retail properties, including flagship locations in Toronto, Vancouver and Montreal
� FY 2012 retail sales of $2.6 billion and same store sales of 5.4%
� Offers broad range of mid-tier brands and high-quality, fashionable merchandise at compelling values
� Added ~330 new brands since 2008
� Discontinued over 900 brands since 2009
� New brands generating ~20% of sales today (since 2008)
18
British Columbia
15
Alberta
2
Saskatchewan
3
Manitoba
34
Ontario
16
Quebec
New Foundland
New Brunswick
PrinceEdward Island
2
Nova ScotiaTotal Full-Line Stores = 90
Ontario + Quebec = 62% of Canadian Population
Low
er
Customer Experience
Hig
her
Val
ue P
ropo
sitio
n
Mainstream Unique
Valuable Locations in Attractive Markets
____________________(1) As of Q2 2013. Excludes 1 outlet store.
Overview Store Footprint (1)
6

7
Strategic Investments Creating Improvements
Intelligent, Disciplined Capital Allocations
� More than $250 million invested over the past three years
� Dedicated to investing in high IRR projects

Unique Platform Facilitates Strategic Partnerships
8
Strategic Partnerships Drive Strong Sales Growth
Five TopShop locations through 2012 and additional five planned for 2013
Partnering with Kleinfeld to redefine Canadian bridal shopping
The Room concept features designer clothing in an upscale environment

HBC Performance
9
____________(1) Excludes Vancouver Olympics sales.(2) Includes Belk, Bon-Ton, Dillard's, J.C. Penney, Kohl's, Macy’s, Neiman Marcus, Nordstrom, Saks, Sears Holdings and Sears Canada.
� Successful integration of Hudson’s Bay and Lord
& Taylor led by current management team
� Same-store sales growth has significantly
outperformed average of peers
� Achieved significant increases in sales
productivity with room for further upside
� Doubled EBITDA from $156 million in FY 2009 to
$310 million in FY 2012
� Reduced SG&A expense by 350 bps over the
past three years
Lord & Taylor Sales / Sq. Ft. (US$)
Hudson’s Bay Sales / Sq. Ft. (C$)
$175
$218 $240-$250 $250
'09 '12 3-5 Yr. Target
'12 N. A. Peer Group
C$122 C$140
C$170-C$180
$250
'09 '12 3-5 Yr. Target
'12 N. A. Peer Group
(2)
(2)
(1)

Current Quarter Performance
10
� Consolidated same store sales grew 3.5% y-o-y, or +3.0% on a constant currency basis, driven by:
� Hudson’s Bay up 6.2%
� Lord & Taylor down 1.2% on a US$ basis
� Gross profit margin of 38.8%, below Q2 2012 rate of 40.0%
� Normalized SG&A as % of sales of 36.8%, compared to 36.9% in Q2 2012
� Normalized EBITDA was down $900,000 to $58 million
____________(1) Reflects adjustments for stock-based compensation, impairment and non-cash expenses, restructuring charges and acquisition-related costs.
(1)
Q2 YTD
� Consolidated same store sales grew 3.8% y-o-y, or +3.1% on a constant currency basis, driven by:
� Hudson’s Bay up 6.9%
� Lord & Taylor down 1.3% on a US$ basis
� Gross profit margin of 39.5%, below YTD 2012 rate of 40.1%
� Normalized SG&A as % of sales of 39.0%, compared to 38.7% in YTD 2012
� Normalized EBITDA was up $4 million to $89 million
(1)
Q2 2012 Q2 2013E ∆
Sales $911.9 $947.7 4%
Gross Profit 364.6 368.1 1%
SG&A 345.5 359.6 4%
Normalized EBITDA 58.9 58.0 (2%)
Q2 2012 Q2 2013E Δ
Sales $1,760.1 $1,831.7 4%
Gross Profit 705.7 724.3 3%
SG&A 726.8 731.3 1%
Normalized EBITDA 85.0 89.0 5%

11
Saks Acquisition

Saks Business OverviewOverview
____________________Source: Company filings.(1) As of Q2 2013.
� Leading U.S. luxury retailer operating through 41 full-line Saks Fifth Avenue stores, 68 OFF 5th stores and Saks Direct eCommerce website
� $3.1 billion in revenue and $290 million in Normalized EBITDA in FY 2012
� Omni-Channel transformation underway
� SaksFirst loyalty program relaunched in early 2013
Store Footprint (1)
455454_1.wor (NY007C5C)
MACT
NJ
1
1
5
2
10
1
1
1
1
1
1
1
1
12
2
1
2
1
2
3
2
2
102
1
7
2
3
1
1
1
1
1
1
1
2
7
2
2
1
1
2
21
9
2
Saks Fifth Avenue
OFF 5th
Licensees operate 5 Full-Line stores in Bahrain, Kazakhstan, Mexico (2) and U.A.E.
41 stores average ~125K sq. ft.
� Luxury men and women’s apparel, accessories, cosmetics and gifts
� Supported by highly personalized customer service
� Rightsizing and remodeling store base
Saks Fifth Avenue
12
Saks Direct
saks.com
� Upcoming launch of OFF 5th website
� Continued enhancements driving transformation to omni-channel luxury retailer
� Experiencing rapid growth
OFF 5th
68 stores average ~30K sq. ft.
� Discount designer clothing and accessories
� Collections available at everyday savings of 40% to 70%
� Branded selection supplemented by private label
� Opened 12 stores since 2009

13
Leading North American Retailer
____________________(1) Store counts as of Q2 2013.(2) Includes Home Outfitters within combined outlet store count and retail sales(3) Calculated in local currency. L&T and Saks’ Q4’12 impacted by Hurricane Sandy.
Transaction creates a leading North American retail er that addresses a broad consumer spectrum across the luxury, mid-tier and o utlet retail sectors
48 / 4
$1.5B
90 / 1
$2.6B
2.2%(3)5.4%
179 / 142(2)
$7.2(2)
$600MM
Full-Line / Outlet (1)Full-Line / Outlet (1)
2012 Retail Sales2012 Retail Sales
2012 Same Store Sales2012 Same Store Sales
2012 Normalized EBITDA
2012 Normalized EBITDA
$310MM
41 / 68
$3.1B
3.2%(3)
$290MM
(Pro Forma)

Leading North American Retailer (cont’d)
Coast-to-Coast Footprint
OFF 5TH
Saks Full-Line
Hudson’s Bay
Lord & Taylor
14

$437
$629
SKS Nieman
15
Enhanced Growth Potential
Maximize eCommerce
Bring Saks to Canada
� Up to 7 full-line stores
� Up to 25 outlet stores
� Roll-out of Canadian eCommerce site
Continued Rollout of OFF 5th
Drive Store Productivity
____________________(1) Reflects total sales for FY 2012 divided by the gross leasable area.(2) Includes Belk, Bon-Ton, Dillard’s, JC Penney, Kohl’s, Macy’s, Neiman Marcus, Nordstrom, Saks, Sears Holdings and Sears Canada.
Maximize eCommerce
Store Productivity Opportunity (1)
3
2
4
1
C$140
$218 $250
Bay L&T Dept. Store Avg.
Opportunity in LuxuryOpportunity in LuxuryOpportunity in Mid-TierOpportunity in Mid-Tier
Sales / Sq. Ft. (2012) Sales / Sq. Ft. (2012)
Dept. Store Avg. (2)
2%
7%
10%
20%
HBC L&T SKS Nieman
Online Sales Penetration
Nearly $600mm in combined eCommercesales growing at 30% CAGR since 2010
+
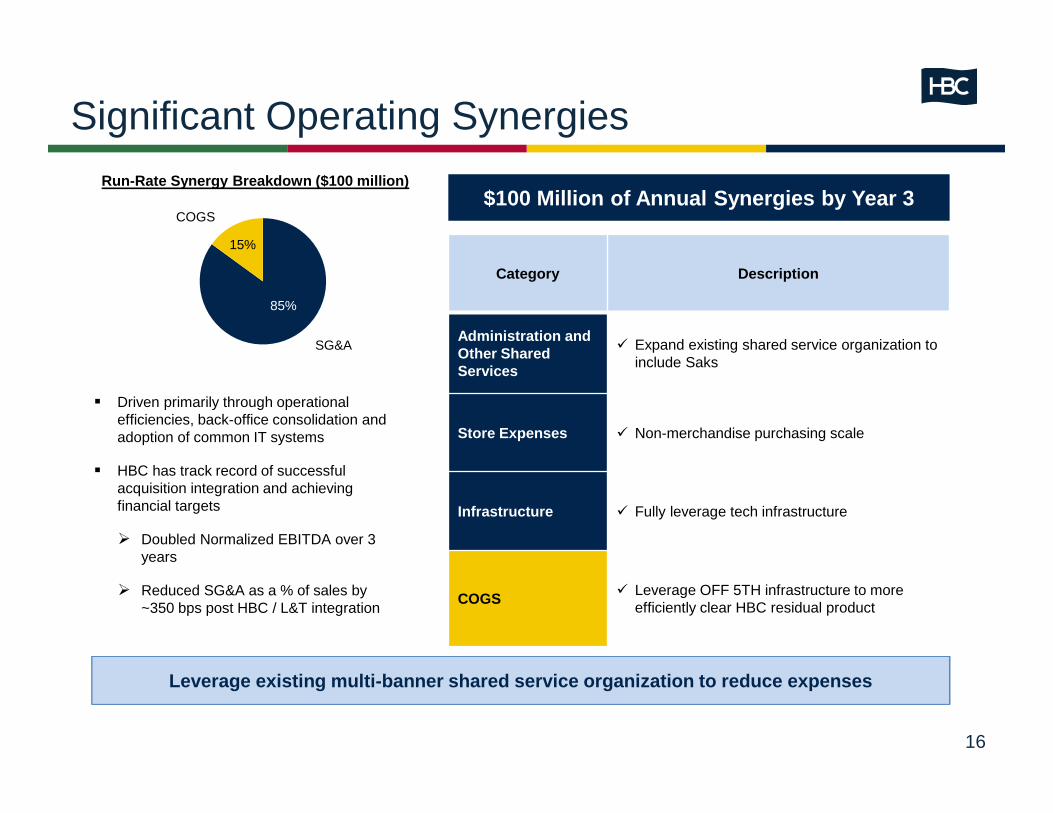
Significant Operating Synergies
$100 Million of Annual Synergies by Year 3
Category Description
Administration and Other Shared Services
� Expand existing shared service organization to include Saks
Store Expenses � Non-merchandise purchasing scale
Infrastructure � Fully leverage tech infrastructure
COGS� Leverage OFF 5TH infrastructure to more
efficiently clear HBC residual product
� Driven primarily through operational efficiencies, back-office consolidation and adoption of common IT systems
� HBC has track record of successful acquisition integration and achieving financial targets
� Doubled Normalized EBITDA over 3 years
� Reduced SG&A as a % of sales by ~350 bps post HBC / L&T integration
SG&A
COGS
85%
15%
Run-Rate Synergy Breakdown ($100 million)
16
Leverage existing multi-banner shared service organ ization to reduce expenses

Highly Valuable Real Estate Portfolio
� Saks adds 25 owned and ground leased stores, including a number of marquee assets, to HBC’s already robust portfolio
� Notable properties include:
� Saks Fifth Ave. flagship in NYC and Wilshire Boulevard in Beverly Hills
� L&T Fifth Ave. flagship in NYC, Manhasset and Eastchester
� Flagship HBC properties in Vancouver, Toronto and Montreal
� Combined total of more than 17 million square feet of owned and ground leased properties
Fee-OwnedGround Leased
Leased Total
Hudson’s Bay 3.7 1.3 11.1 16.1
Lord & Taylor 3.6 2.5 0.7 6.8
Saks Full-Line 1.6 1.8 1.7 5.0
Full-Line 8.9 5.6 13.5 27.9
Outlet - - 2.0 2.0
Home Outfitters - - 2.5 2.5
DCs, Office & Other 2.8 - 3.6 6.5
Total 11.7 5.6 21.6 38.9
Real Estate Portfolio (1) GLA (sq. ft. Millions)
____________(1) As of August 1, 2013.(2) Average years of control for Hudson’s Bay and Lord & Taylor portfolios are 65 and 59, respectively.
17
(2)

18