hudson river pcbs reassessment ri/fs responsiveness ... · hudson river pcbs reassessment ri/fs...
TRANSCRIPT

HUDSON RIVER PCBs REASSESSMENT RI/FSRESPONSIVENESS SUMMARY FOR
PHASE 2 - ECOLOGICAL RISK ASSESSMENT SCOPE OF WORK
•vi
APRIL 1999
I For
U.S. Environmental Protection AgencyRegion 2
andU.S. Army Corps of Engineers
Kansas City District
Book 1 of 1
TAMS Consultants, Inc.and
Menzie-Cura & Associates, Inc.
300955

«
UNITED STATES ENVIRONMENTAL PROTECTION AGENCYREGION 2
29° BROADWAYNEW YORK, NY 10007-1866
April 27, 1999
To All Interested Parties:
The U.S. Environmental Protection Agency (USEPA) is pleased to release the ResponsivenessSummary for the Phase 2 Ecological Risk Assessment Scope of Work (ERASOW) for theHudson River PCBs Reassessment Remedial Investigation/Feasibility Study (ReassessmentRI/FS).
This Responsiveness Summary contains USEPA's responses to the public comments received onthe September 1998 ERASOW. The ERASOW presented USEPA's general approach forconducting the Ecological Risk Assessments for the Upper Hudson River and for the LowerHudson River. The Upper Hudson River Ecological Risk Assessment will be completed inSummer 1999. The Lower Hudson River Ecological Risk Assessment will be completedfollowing USEPA's review of the revised Thomann-Farley model developed for the HudsonRiver Foundation.
If you have any questions regarding this Responsiveness Summary or the Reassessment RI/FS ingeneral, please contact Ann Rychlenski, the Community Relations Coordinator for the site, at(212)637-3672.
Sincerely yours,
/^Richard L. Caspe, Director(J Emergency and Remedial Response Division
300956Internet Address (URL) • http://www.epa.gov
R*cycl*d/R«cyclabl« .Printed with Vegetable Oil Based Inks on Recycled Paper (Minimum 25% Postconsumer)

HUDSON RIVER PCBs REASSESSMENT RI/FSRESPONSIVENESS SUMMARY FOR
PHASE 2 - ECOLOGICAL RISK ASSESSMENT SCOPE OF WORK
APRIL 1999
For
U.S. Environmental Protection AgencyRegion 2
andU.S. Army Corps of Engineers
Kansas City District
Book 1 of 1
JAMS Consultants, Inc.and
Menzie-Cura & Associates, Inc.
300957
HUDSON RIVER PCBs REASSESSMENT RI/FSRESPONSIVENESS SUMMARY FOR
PHASE 2 - ECOLOGICAL RISK ASSESSMENT SCOPE OF WORK
APRIL 1999
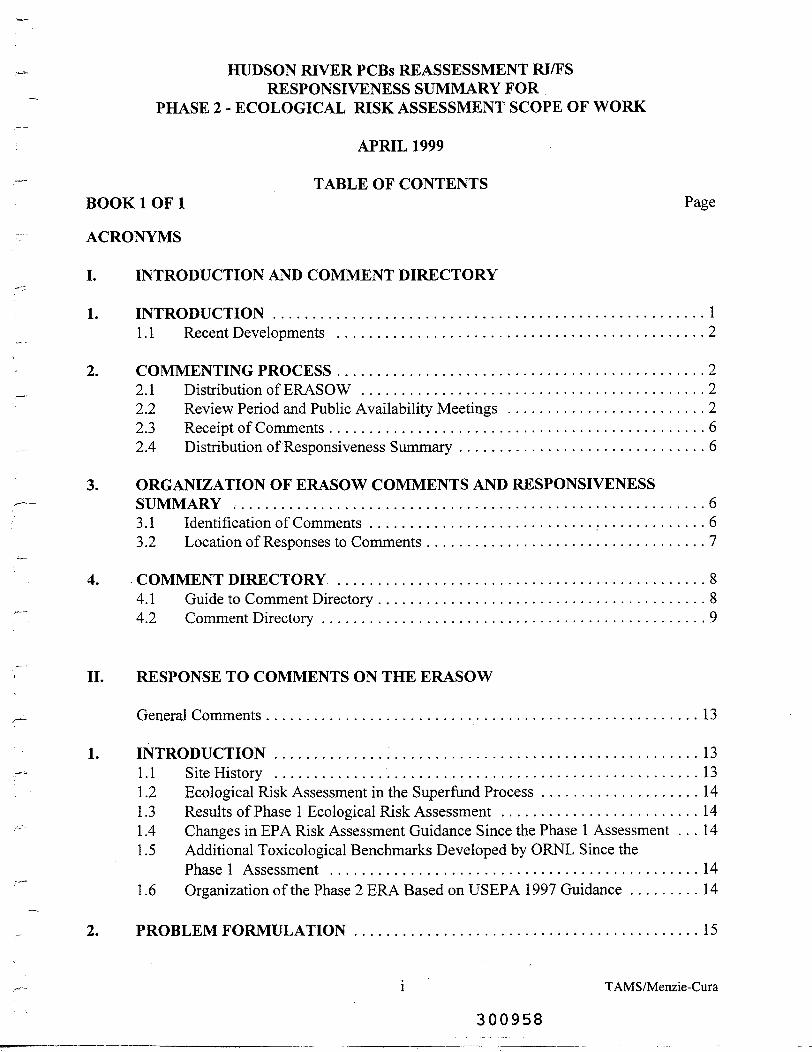
TABLE OF CONTENTSBOOK 1 OF 1 Page
ACRONYMS
I. INTRODUCTION AND COMMENT DIRECTORY
1. INTRODUCTION . . . . . . . . . . . . . . . . . . . . . . . . . . . . . . . . . . . . . . . . . . . . . . . . . . . . . 11.1 Recent Developments . . . . . . . . . . . . . . . . . . . . . . . . . . . . . . . . . . . . . . . . . . . . . . 2
2. COMMENTING PROCESS . . . . . . . . . . . . . . . . . . . . . . . . . . . . . . . . . . . . . . . . . . . . . . 22.1 Distribution of ERASOW . . . . . . . . . . . . . . . . . . . . . . . . . . . . . . . . . . . . . . . . . . . 22.2 Review Period and Public Availability Meetings . . . . . . . . . . . . . . . . . . . . . . . . . 22.3 Receipt of Comments . . . . . . . . . . . . . . . . . . . . . . . . . . . . . . . . . . . . . . . . . . . . . . . 62.4 Distribution of Responsiveness Summary . . . . . . . . . . . . . . . . . . . . . . . . . . . . . . . 6
3. ORGANIZATION OF ERASOW COMMENTS AND RESPONSIVENESSSUMMARY . . . . . . . . . . . . . . . . . . . . . . . . . . . . . . . . . . . . . . . . . . . . . . . . . . . . . . . . . . . 63.1 Identification of Comments . . . . . . . . . . . . . . . . . . . . . . . . . . . . . . . . . . . . . . . . . . 63.2 Location of Responses to Comments . . . . . . . . . . . . . . . . . . . . . . . . . . . . . . . . . . . 7
4. COMMENT DIRECTORY . . . . . . . . . . . . . . . . . . . . . . . . . . . . . . . . . . . . . . . . . . . . . . 84.1 Guide to Comment Directory . . . . . . . . . . . . . . . . . . . . . . . . . . . . . . . . . . . . . . . . . 84.2 Comment Directory . . . . . . . . . . . . . . . . . . . . . . . . . . . . . . . . . . . . . . . . . . . . . . . . 9
II. RESPONSE TO COMMENTS ON THE ERASOW
General Comments . . . . . . . . . . . . . . . . . . . . . . . . . . . . . . . . . . . . . . . . . . . . . . . . . . . . . . 13
1 . INTRODUCTION . . . . . . . . . . . . . . . . . . . . . . . . . . . . . . . . . . . . . . . . . . . . . . . . . . . . 131.1 Site History . . . . . . . . . . . . . . . . . . . . . . . . . . . . . . . . . . . . . . . . . . . . . . . . . . . . . 131.2 Ecological Risk Assessment in the Superfund Process . . . . . . . . . . . . . . . . . . . . 141.3 Results of Phase 1 Ecological Risk Assessment . . . . . . . . . . . . . . . . . . . . . . . . . 141.4 Changes in EPA Risk Assessment Guidance Since the Phase 1 Assessment ... 141.5 Additional Toxicological Benchmarks Developed by ORNL Since the
Phase 1 Assessment . . . . . . . . . . . . . . . . . . . . . . . . . . . . . . . . . . . . . . . . . . . . . . 141.6 Organization of the Phase 2 ERA Based on USEPA 1997 Guidance . . . . . . . . . 14
2. PROBLEM FORMULATION . . . . . . . . . . . . . . . . . . . . . . . . . . . . . . . . . . . . . . . . . . . 15
i TAMS/Menzie-Cura
300958

HUDSON RIVER PCBs REASSESSMENT Rl/FSRESPONSIVENESS SUMMARY FOR
PHASE 2 - ECOLOGICAL RISK ASSESSMENT SCOPE OF WORK
APRIL 1999
TABLE OF CONTENTSBOOK 1 OF 1 Page
2.1 Site Characterization . . . . . . . . . . . . . . . . . . . . . . . . . . . . . . . . . . . . . . . . . . . . . . 162.1.1 Upper Hudson River . . . . . . . . . . . . . . . . . . . . . . . . . . . . . . . . . . . . . . . . 162.1.2 Thompson Island Pool . . . . . . . . . . . . . . . . . . . . . . . . . . . . . . . . . . . . . . . 162.1.3 Lower Hudson River . . . . . . . . . . . . . . . . . . . . . . . . . . . . . . . . . . . . . . . . 16
2.2 Contaminants of Concern . . . . . . . . . . . . . . . . . . . . . . . . . . . . . . . . . . . . . . . . . . 172.3 Assessment Endpoints . . . . . . . . . . . . . . . . . . . . . . . . . . . . . . . . . . . . . . . . . . . . . 172.4 Site Conceptual Model . . . . . . . . . . . . . . . . . . . . . . . . . . . . . . . . . . . . . . . . . . . . . 182.5 Measurement Endpoints . . . . . . . . . . . . . . . . . . . . . . . . . . . . . . . . . . . . . . . . . . . . 182.6 Receptors of Concern . . . . . . . . . . . . . . . . . . . . . . . . . . . . . . . . . . . . . . . . . . . . . . 20
2.6.1 Macroinvertebrate Communities . . . . . . . . . . . . . . . . . . . . . . . . . . . . . . . 202.6.2 Fish Receptors . . . . . . . . . . . . . . . . . . . . . . . . . . . . . . . . . . . . . . . . . . . . . 202.6.3 Avian Receptors . . . . . . . . . . . . . . . . . . . . . . . . . . . . . . . . . . . . . . . . . . . . 202.6.4 Mammalian Receptors . . . . . . . . . . . . . . . . . . . . . . . . . . . . . . . . . . . . . . . 212.6.5 Threatened and Endangered Species . . . . . . . . . . . . . . . . . . . . . . . . . . . . 212.6.6 Significant Habitats . . . . . . . . . . . . . . . . . . . . . . . . . . . . . . . . . . . . . . . . . 21
2.7 Risk Questions . . . . . . . . . . . . . . . . . . . . . . . . . . . . . . . . . . . . . . . . . . . . . . . . . . . 21
3 . EXPOSURE ASSESSMENT . . . . . . . . . . . . . . . . . . . . . . . . . . . . . . . . . . . . . . . . . . . . 2 13.1 Exposure Pathways . . . . . . . . . . . . . . . . . . . . . . . . . . . . . . . . . . . . . . . . . . . . . . . 22
3.1.1 PCBs in Sediments . . . . . . . . . . . . . . . . . . . . . . . . . . . . . . . . . . . . . . . . . . 223.1.2 PCBs in Water . . . . . . . . . . . . . . . . . . . . . . . . . . . . . . . . . . . . . . . . . . . . . 223.1.3 Benthic Invertebrates . . . . . . . . . . . . . . . . . . . . . . . . . . . . . . . . . . . . . . . . 223.1.4 Fish Receptors . . . . . . . . . . . . . . . . . . . . . . . . . . . . . . . . . . . . . . . . . . . . . 223.1.5 Avian Receptors . . . . . . . . . . . . . . . . . . . . . . . . . . . . . . . . . . . . . . . . . . . . 223.1.6 Mammalian Receptors . . . . . . . . . . . . . . . . . . . . . . . . . . . . . . . . . . . . . . . 22
3.2 Quantification of PCB Fate and Transport . . . . . . . . . . . . . . . . . . . . . . . . . . . . . 223.3 Observed Exposure Concentration . . . . . . . . . . . . . . . . . . . . . . . . . . . . . . . . . . . . 23
3.3.1 Sediment Concentrations . . . . . . . . . . . . . . . . . . . . . . . . . . . . . . . . . . . . . 243.3.2 Water Column Concentrations . . . . . . . . . . . . . . . . . . . . . . . . . . . . . . . . . 243.3.3 Benthic Invertebrate Concentrations . . . . . . . . . . . . . . . . . . . . . . . . . . . . 243.3.4 Fish Concentrations . . . . . . . . . . . . . . . . . . . . . . . . . . . . . . . . . . . . . . . . . 253.3.5 Avian Concentrations . . . . . . . . . . . . . . . . . . . . . . . . . . . . . . . . . . . . . . . . 253.3.6 Mammalian Concentrations . . . . . . . . . . . . . . . . . . . . . . . . . . . . . . . . . . . 25
3.4 Modeled Exposure Concentrations . . . . . . . . . . . . . . . . . . . . . . . . . . . . . . . . . . . 253.4.1 Benthic Invertebrate Receptors . . . . . . . . . . . . . . . . . . . . . . . . . . . . . . . . 26
ii TAMS/Menzie-Cura
300959

HUDSON RIVER PCBs REASSESSMENT RI/FSRESPONSIVENESS SUMMARY FOR
PHASE 2 - ECOLOGICAL RISK ASSESSMENT SCOPE OF WORK
APRIL 1999
TABLE OF CONTENTSBOOK 1 OF 1 Page
3.4.2 Fish Receptors . . . . . . . . . . . . . . . . . . . . . . . . . . . . . . . . . . . . . . . . . . . . . 263.4.3 Avian Receptors . . . . . . . . . . . . . . . . . . . . . . . . . . . . . . . . . . . . . . . . . . . . 263.4.4 Mammalian Receptors . . . . . . . . . . . . . . . . . . . . . . . . . . . . . . . . . . . . . . . 26
4. EFFECTS ASSESSMENT . . . . . . . . . . . . . . . . . . . . . . . . . . . . . . . . . . . . . . . . . . . . . . 274.1 Estimating the Toxicity of PCBs . . . . . . . . . . . . . . . . . . . . . . . . . . . . . . . . . . . . . 27
4.1.1 Total PCBs and Aroclor Toxicities . . . . . . . . . . . . . . . . . . . . . . . . . . . . . 284.1.2 Congener-specific Toxicity and the Toxicity Equivalency Factors (TEF)
Approach . . . . . . . . . . . . . . . . . . . . . . . . . . . . . . . . . . . . . . . . . . . . . . . . . 284.2 Measures of Effect . . . . . . . . . . . . . . . . . . . . . . . . . . . . . . . . . . . . . . . . . . . . . . . . 28
4.2.1 Benthic Invertebrate Communities . . . . . . . . . . . . . . . . . . . . . . . . . . . . . 294.2.2 Fish Receptors . . . . . . . . . . . . . . . . . . . . . . . . . . . . . . . . . . . . . . . . . . . . . 294.2.3 Avian Receptors . . . . . . . . . . . . . . . . . . . . . . . . . . . . . . . . . . . . . . . . . . . . 294.2.4 Mammalian Receptors . . . . . . . . . . . . . . . . . . . . . . . . . . . . . . . . . . . . . . . 294.2.5 Threatened and Endangered Species . . . . . . . . . . . . . . . . . . . . . . . . . . . . 294.2.6 Significant Habitats . . . . . . . . . . . . . . . . . . . . . . . . . . . . . . . . . . . . . . . . . 30
5. RISK CHARACTERIZATION . . . . . . . . . . . . . . . . . . . . . . . . . . . . . . . . . . . . . . . . . . 305.1 Surface Water Concentrations . . . . . . . . . . . . . . . . . . . . . . . . . . . . . . . . . . . . . . . 305.2 Sediment Concentrations . . . . . . . . . . . . . . . . . . . . . . . . . . . . . . . . . . . . . . . . . . . 305.3 Benthic Invertebrates . . . . . . . . . . . . . . . . . . . . . . . . . . . . . . . . . . . . . . . . . . . . . . 305.4 Fish Receptors . . . . . . . . . . . . . . . . . . . . . . . . . . . . . . . . . . . . . . . . . . . . . . . . . . . 305.5 Avian Receptors . . . . . . . . . . . . . . . . . . . . . . . . . . . . . . . . . . . . . . . . . . . . . . . . . . 315.6 Mammalian Receptors . . . . . . . . . . . . . . . . . . . . . . . . . . . . . . . . . . . . . . . . . . . . . 315.7 Threatened and Endangered Species . . . . . . . . . . . . . . . . . . . . . . . . . . . . . . . . . . 315.8 Significant Habitats . . . . . . . . . . . . . . . . . . . . . . . . . . . . . . . . . . . . . . . . . . . . . . . 31
6 . UNCERTAINTY ANALYSIS . . . . . . . . . . . . . . . . . . . . . . . . . . . . . . . . . . . . . . . . . . . . 3 16.1 Approaches to Assessing Uncertainty . . . . . . . . . . . . . . . . . . . . . . . . . . . . . . . . . 32
REFERENCES . . . . . . . . . . . . . . . . . . . . . . . . . . . . . . . . . . . . . . . . . . . . . . . . . . . . . . . . . . . . . . 3 3
Table Number 1: Assessment and Measurement Endpoints . . . . . . . . . . . . . . . . . . . . . . . . . . . 33
Table Number 2: Trophic Levels. Exposure Pathways, and Food Sources . . . . . . . . . . . . . . . . . 34
iii TAMS/Menzie-Cura
300960

HUDSON RIVER PCBs REASSESSMENT RI/FSRESPONSIVENESS SUMMARY FOR
PHASE 2 - ECOLOGICAL RISK ASSESSMENT SCOPE OF WORK
APRIL 1999
TABLE OF CONTENTSBOOK 1 OF 1 Page
APPENDIX A MODELING APPROACHES . . . . . . . . . . . . . . . . . . . . . . . . . . . . . . . . . . . 34
ADDITIONAL REFERENCES . . . . . . . . . . . . . . . . . . . . . . . . . . . . . . . . . . . . . . . . . . . . . . . . 3 5
III. COMMENTS ON THE ECOLOGICAL RISK ASSESSMENTSCOPE OF WORK . . . . . . . . . . . . . . . . . . . . . . . . . . . . . . . . . . . . . . . . . . . . . . . . . . . . 35
Federal (EN)State (ED)Local (EA)Community Interaction Program (EP)Public Interest Groups and Individuals (ES)General Electric (EG)
IV TAMS/Menzie-Cura300961

ACRONYMS
AhARARAWQCBAFBSAFCBRCERCLACOEDEIRDNAPLDQOERAERLERMPDAFFBAFFSGEGMGSDHROCJLGLOAELNCPNPLNOAANOAELNYSDECNYSDOHNYSDOSORNLPBAFPCBPELPFBAF
Aryl HydrocarbonApplicable or Relevant and Appropriate RequirementAmbient Water Quality CriteriaBioaccumulation FactorBiota:Sediment Accumulation FactorsCritical Body ResidueComprehensive Environmental Response, Compensation, and Liability ActCorps of EngineersData Evaluation and Interpretation ReportDense Non-Aqueous Phase LiquidData Quality ObjectivesEcological Risk AssessmentEffects Range-LowEffects Range-MedianFood and Drug AdministrationForaging Fish Bioaccumulation FactorFeasibility StudyGeneral ElectricGeometric MeanGeometric Standard DeviationHudson River PCBs Oversight CommitteeJoint Liaison GroupLowest-Observed-Adverse-Effect-LevelNational Oil and Hazardous Substances Pollution Contingency PlanNational Priorities ListNational Oceanic and Atmospheric AdministrationNo-Observed-Adverse-Effect-LevelNew York State Department of Environmental ConservationNew York State Department of HealthNew York State Department of SanitationOak Ridge National LaboratoriesPelagic Invertebrate Bioaccumulation FactorPolychlorinated BiphenylProbable Effect LevelPiscivorous Fish Bioaccumulation Factor
TAMS/Menzie-Cura
300962

ACRONYMS
RIRI/FSRODRMRPIRRJ/FSSARASMDPSOWSTCTAGMTCDDTEFTIPTRYTSCAUSEPAUSFWSWHOWQC
Remedial InvestigationRemedial Investigation/Feasibility StudyRecord of DecisionRiver MileRensselaer Polytechnic InstituteReassessment Remedial Investigation/Feasibility StudySuperfund Amendments and Reauthorization Act of 1986Scientific/Management Decision PointScope of WorkScience and Technical CommitteeTechnical and Administrative Guidance Memorandum2,3,7,8-Tetrachlorodibenzo-p-dioxinToxicity Equivalency FactorThompson Island PoolToxicity Reference ValueToxic Substances Control ActUnited States Environmental Protection AgencyUS Fish and Wildlife ServiceWorld Health OrganizationWater Quality Criteria
TAMS/Menzie-Cura
300963

rs«-*5"D
300964

HUDSON RIVER PCBs REASSESSMENT RI/FSRESPONSIVENESS SUMMARY
PHASE 2 - ECOLOGICAL RISK ASSESSMENT SCOPE OF WORK
APRIL 1999
I. INTRODUCTION AND COMMENT DIRECTORY
1. Introduction
The U.S. Environmental Protection Agency (USEPA) has prepared this ResponsivenessSummary to address comments received during the public comment period on the Phase 2Ecological Risk Assessment Scope of Work (ERASOW) for the Hudson River PCBs ReassessmentRemedial Investigation/Feasibility Study (Reassessment RI/FS), dated September 1998.
For the Hudson River PCBs Reassessment RI/FS, USEPA has established a CommunityInteraction Program (CIP) to elicit on-going feedback through regular meetings and discussion andto facilitate review of and comment upon work plans and reports prepared during all phases of theReassessment RI/FS.
Because of the large number of CIP participants and associated costs of reproduction, theERASOW is incorporated by reference and is not reproduced herein. No revised ERASOW will bepublished. The comment responses and revisions noted herein are considered to amend theERASOW. For complete coverage, the ERASOW and this Responsiveness Summary must be usedtogether.
The first part of this three-part Responsiveness Summary is entitled, "Introduction andComment Directory." It describes the ERASOW review and commenting process, explains theorganization and format of comments and responses, and contains a comment directory.
The second part, entitled, "Responses to Comments on the Ecological Risk AssessmentScope of Work," contains USEPA's responses to all significant comments. Responses are groupedaccording to the section number of the ERASOW to which they refer. For example, responses tocomments on Section 2.2 of the ERASOW are found in Section 2.2 of the Responsiveness Summary.Additional information about how to locate responses to comments is contained in the CommentDirectory.
TAMS/Menzie-Cura
300965

The third part, entitled, "Comments on Ecological Risk Assessment Scope of Work,"contains copies of the comments submitted to USEPA. The comments are identified by commenterand comment number, as further explained in the Comment Directory.
1.1 Recent Developments
USEPA received the revised Thomann-Farley model, which was developed for the HudsonRiver Foundation, on April 27, 1999. USEPA will review the model to determine itsappropriateness for use in performing the Mid-Hudson ERA. In the ERASOW (p. 1), USEPA notedthat the Upper Hudson and Mid-Hudson ERAs may be developed at different times.
2. Commenting Process
This section documents and explains the commenting process and the organization ofcomments and responses in this document. Readers interested in finding responses to theircomments may skip this section and go directly to the tab labeled "Comment Directory."
2.1 Distribution of ERASOW
The ERASOW, issued in September 1998, was distributed to federal and state agencies andofficials, participants in the CIP and General Electric Company (GE), as shown in Table 1.Distribution was made to approximately 100 agencies, groups, and individuals. Copies of theERASOW were also made available for public review in 17 Information Repositories, as shown inTable 2 and on the USEPA Region 2 internet webpage, entitled "Hudson River PCBs Superfund SiteReassessment," at www.epa.gov/hudson.
2.2 Review Period and Public Availability Meetings
Review of and comment on the ERASOW occurred from September 23, 1998 to November2, 1998. On September 23, USEPA held a Joint Liaison Group meeting open to the public at theHoliday Inn at Latham, New York. Subsequently, on October 20, USEPA sponsored an availabilitysession at the Marriott Hotel in Albany, New York to answer questions from the public regardingthe ERASOW. These meetings were conducted in accordance with USEPA's Community Relationsin Superfund: Handbook, Interim Version (1988). Minutes of the Joint Liaison Group meeting areavailable for public review at the Information Repositories listed in Table 2.
300966
TAMS/Mcnzie-Cura

TABLE 1DISTRIBUTION OF REPORTS
HUDSON RIVER PCBs OVERSIGHT COMMITTEE MEMBERS
USEPA ERRD Deputy Division Director (Chair)USEPA Project ManagersUSEPA Community Relations Coordinator, Chair of the Steering CommitteeNYSDEC Division of Hazardous Waste Management representativeN YSDEC Division of Construction Management representativeNational Oceanic and Atmospheric Administration (NOAA) representativeAgency for Toxic Substances and Disease Registry (ATSDR) representativeUS Army Corps of Engineers representativeNew York State Thruway Authority (Department of Canals) representativeUSDOI (US Fish and Wildlife Service) representativeNew York State Department of Health representativeGE representativeLiaison Group ChairpeopleScientific and Technical Committee representative
SCIENTIFIC AND TECHNICAL COMMITTEE MEMBERS
The members of the Science and Technical Committee (STC) are scientists and technical researcherswho provide technical input by evaluating the scientific data collected on the Reassessment RI/FS,identifying additional sources of information and on-going research relevant to the Reassessment RI/FS,and commenting on USEPA documents. Members of the STC are familiar with the site, PCBs, modeling,toxicology, and other relevant disciplines.
- Dr. Daniel Abramowicz- Dr. Donald Aulenbach- Dr. James Bonner, Texas A&M University- Dr. Richard Bopp, Rensselaer Polytechnic Institute
Dr. Brian Bush, New York State Dept. of Health- Dr. Lenore Clesceri, Rensselaer Polytechnic Institute
Mr. Kenneth DarmerMr. John Davis, New York State Dept. of LawDr. Robert Dexter, EVS Consultants, Inc.
- Dr. Kevin Parley, Manhattan College
TAMS/Menzie-Cura
300967

TABLE 1DISTRIBUTION OF REPORTS(Cont)
Dr. Jay Field, National Oceanic and Atmospheric AdministrationDr. Ken Pearsall, U.S. Geological SurveyDr. John Herbich, Texas A&M UniversityDr. Behrus Jahan-Parwar, SUNY - AlbanyDr. Nancy Kirn, New York State Dept. of HealthDr. William Nicholson, Mt. Sinai Medical CenterDr. George Putman, SUNY - AlbanyDr. G-Yull Rhee, New York State Dept. of HealthDr. Francis Reilly, Jr., The Reilly GroupDr. John SandersMs. Anne Secord, U.S. Fish and Wildlife ServiceDr. Ronald Sloan, New York State Dept. of Environmental Conservation
STEERING COMMITTEE MEMBERS
USEPA Community Relations Coordinator (Chair)Governmental Liaison Group Chair and two Co-chairsCitizen Liaison Group Chair and two Co-chairsAgricultural Liaison Group Chair and two Co-chairsEnvironmental Liaison Group Chair and two Co-chairsUSEPA Project ManagersNYSDEC Technical representativeNYSDEC Community Affairs representative
FEDERAL AND STATE REPRESENTATIVES
Copies of the Reports were sent to relevant federal and state representatives who have been involved with thisproject. These include, in part, the following:
The Hon. Daniel P. Moynihan - The Hon. Michael McNultyThe Hon. Charles E. Schumer - The Hon. Sue KellyThe Hon. John E. Sweeny - The Hon. Benjamin OilmanThe Hon. Nita Lowey - The Hon. Richard BrodskyThe Hon. Maurice Hinchey - The Hon. Bobby D'AndreaThe Hon. Ronald B. Stafford
17 INFORMATION REPOSITORIES (see Table 2).
TAMS/Menzie-Cura
300968
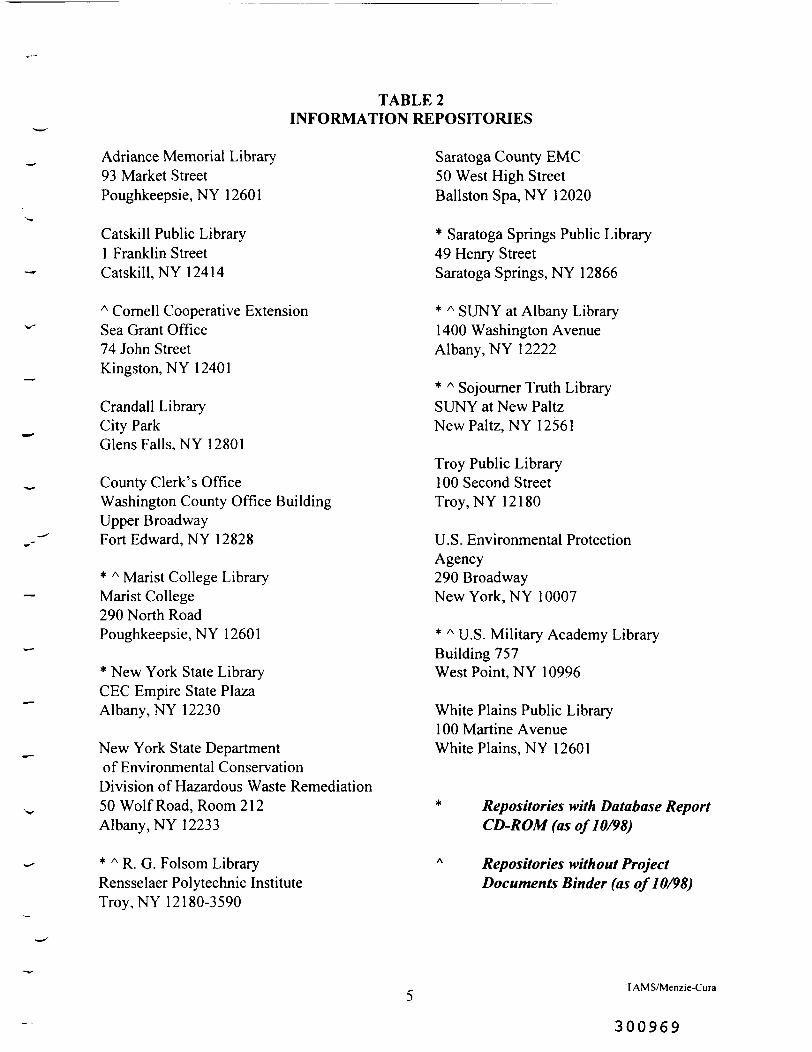
TABLE 2INFORMATION REPOSITORIES
Adriance Memorial Library93 Market StreetPoughkeepsie, NY 12601
Catskill Public Library1 Franklin StreetCatskill, NY 12414
A Cornell Cooperative ExtensionSea Grant Office74 John StreetKingston, NY 12401
Crandall LibraryCity ParkGlens Falls, NY 12801
County Clerk's OfficeWashington County Office BuildingUpper BroadwayFort Edward, NY 12828
* A Marist College LibraryMarist College290 North RoadPoughkeepsie, NY 12601
* New York State LibraryCEC Empire State PlazaAlbany, NY 12230
New York State Departmentof Environmental Conservation
Division of Hazardous Waste Remediation50 Wolf Road, Room 212Albany, NY 12233
* A R. G. Folsom LibraryRensselaer Polytechnic InstituteTroy, NY 12180-3 590
Saratoga County EMC50 West High StreetBallston Spa, NY 12020
* Saratoga Springs Public Library49 Henry StreetSaratoga Springs, NY 12866
* A SUNY at Albany Library1400 Washington AvenueAlbany, NY 12222
* A Sojourner Truth LibrarySUNY at New PaltzNewPaltz,NY 12561
Troy Public Library100 Second StreetTroy, NY 12180
U.S. Environmental ProtectionAgency290 BroadwayNew York, NY 10007
* A U.S. Military Academy LibraryBuilding 757West Point, NY 10996
White Plains Public Library100 Martine AvenueWhite Plains, NY 12601
Repositories with Database ReportCD-ROM (as of 10/98)
Repositories without ProjectDocuments Binder (as of 10/98)
TAMS/Menzie-Cura
300969

As stated in USEPA's letter transmitting the ERASOW, all citizens were urged toparticipate in the Reassessment process and to join one of the Liaison Groups formed as part ofthe CIP.
2.3 Receipt of Comments
Comments on the ERASOW were received in two ways: letters and oral statements madeat the September 23, 1998 Joint Liaison Group meeting. USEPA's responses to comments raisedat the Joint Liaison Group meeting are provided in the meeting minutes.
All significant comments received on the ERASOW are addressed in this ResponsivenessSummary. Comments were received from 6 commenters. Total comments numberedapproximately 80.
2.4 Distribution of Responsiveness Summary
This Responsiveness Summary will be distributed to the Liaison Group Chairs and Co-Chairs and interested public officials. This Responsiveness Summary will be placed in the 17Information Repositories and is part of the Administrative Record.
3. Organization of ERASOW Comments and Responsiveness Summary
3.1 Identification of Comments
Each submission commenting on the ERASOW was assigned the letter "E" forERASOW and one of the following letter codes:
N - Federal agencies and officials;D - State agencies and officials;A - Local agencies and officials;P - Community Interaction Program;S - Public Interest Groups and Individuals; andG - GE.
The letter codes were assigned for the convenience of readers and to assist in theorganization of this document. Priority or special treatment was neither intended norgiven in the responses to comments.
Once a letter code was assigned, each submission was then assigned a number, inthe order that it was received and processed, such as EN1, EN2 and so on. Each differentcomment within a submission was assigned a separate subnumber. Thus, if a federalagency submission contained three different comments, they would be designated asEN1-1, EN1-2, and EN1-3. Written comment letters are reprinted following the fourthtab of this document.
The alphanumeric code associated with each reprinted written submission ismarked at the top right corner of the first page of the comment letter. The subnumbers
TAMS/Menzie-Cura
300970

designating individual comments are marked in the margin. Comment submissions arereprinted in numerical order by letter code in the following order: EN, ED, EA, EP, ESand EG.
3.2 Location of Responses to Comments
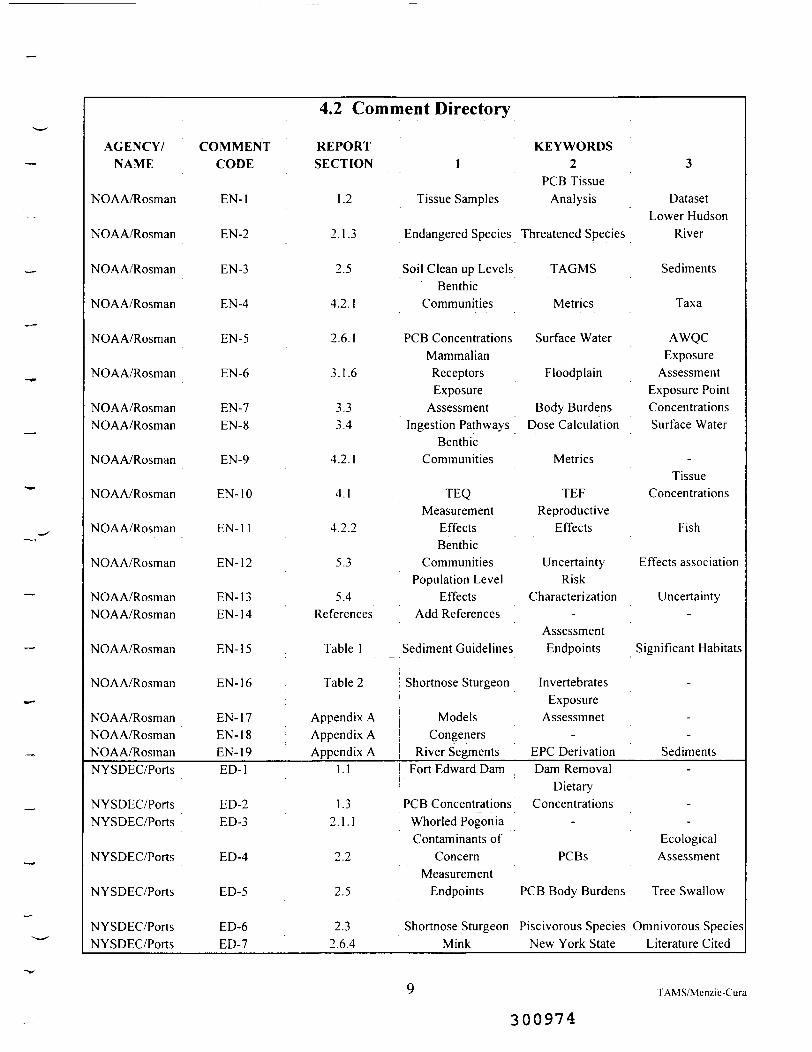
The Comment Directory, following this text, contains a complete listing of allcommenters and comments. This directory allows readers to find responses to commentsand provides several items of information.
- The first column lists the names of commenters. Comments are grouped first by:EN (Federal), ED (State), EA (Local), EP (Community Interaction Program), ES(Public Interest Group or Individual), or EG (GE).The second column identifies the alphanumeric comment code (e.g., EF1-1)assigned to each comment.The third column identifies the location of the response by the ERASOW Sectionnumber. For example, comments raised in Section 2.1 of the ERASOW can befound in the corresponding Section 2.1 of the Responses, following the third tabof this document.The fourth, fifth, and sixth columns list key words that describe the subject matterof each comment. Readers will find these key works helpful as a means toidentify subjects of interest and related comments.
Responses are grouped and consolidated by section number in order that all responses torelated comments appear together for the convenience of the reader interested inresponses to related or similar comments.
TAMS/Menzie-Cura
300971
4. COMMENT DIRECTORY
4.1 Guide to Comment Directory
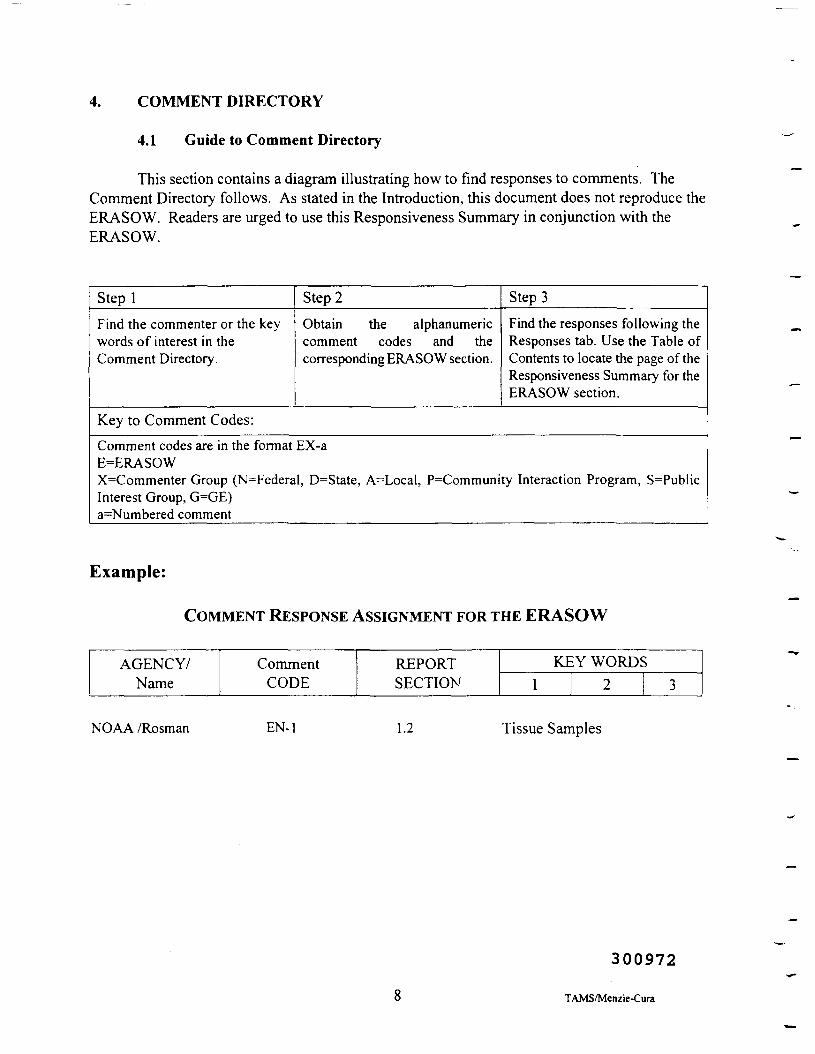
This section contains a diagram illustrating how to find responses to comments. TheComment Directory follows. As stated in the Introduction, this document does not reproduce theERASOW. Readers are urged to use this Responsiveness Summary in conjunction with theERASOW.
Step 1Find the commenter or the keywords of interest in theComment Directory.
Step 2
Obtain the alphanumericcomment codes and thecorresponding ERASOW section.
Step 3
Find the responses following theResponses tab. Use the Table ofContents to locate the page of theResponsiveness Summary for theERASOW section.
Key to Comment Codes:Comment codes are in the format EX-aE=ERASOWX=Commenter Group (N=Federal, D=State, A=Local, P=Community Interaction Program, S=PublicInterest Group, G=GE)a=Numbered comment
Example:
COMMENT RESPONSE ASSIGNMENT FOR THE ERASOW
AGENCY/Name
CommentCODE
REPORTSECTION
KEY WORDS1 2 3
NOAA /Rosman EN-1 1.2 Tissue Samples
300972
TAMS/Menzie-Cura

Comment Directory
mr-o\ooro
4.2 Comment Directory
AGENCY/NAME
NOAA/Rosman
NOAA/Rosman
NOAA/Rosman
NOAA/Rosman
NOAA/Rosman
NOAA/Rosman
NOAA/RosmanNOAA/Rosman
NOAA/Rosman
NOAA/Rosman
NOAA/Rosman'
NOAA/Rosman
NOAA/RosmanNOAA/Rosman
NOAA/Rosman
NOAA/Rosman
NOAA/RosmanNOAA/RosmanNOAA/RosmanNYSDEC/Ports
NYSDEC/PortsNYSDEC/Ports
NYSDEC/Ports
NYSDEC/Ports
NYSDEC/PortsNYSDEC/Ports
COMMENTCODE
EN-1
EN-2
EN-3
EN-4
EN-5
EN-6
EN-7EN-8
EN-9
EN- 10
EN- 11
EN- 12
EN- 13EN-14
EN-15
EN- 16
EN- 17EN-18 ;EN-19ED-1
ED-2ED-3
ED-4
ED-5
ED-6ED-7
REPORTSECTION
1.2
2.1.3
2.5
4.2.1
2.6.1
3.1.6
3.33.4
4.2.1
4.1
4.2.2
5.3
5.4References
Table 1
Table 2
Appendix AAppendix AAppendix A
1.1
1.32.1.1
2.2
2.5
2.32.6.4
1
Tissue Samples
Endangered Species
Soil Clean up LevelsBenthic
Communities
PCB ConcentrationsMammalianReceptorsExposure
AssessmentIngestion Pathways
BenthicCommunities
TEQMeasurement
EffectsBenthic
CommunitiesPopulation Level
EffectsAdd References
Sediment Guidelines
Shortnose Sturgeon1
| ModelsCongeners
j River SegmentsFort Edward Dam
PCB ConcentrationsWhorled PogoniaContaminants of
ConcernMeasurement
Endpoints
Shortnose SturgeonMink
KEYWORDS2
PCB TissueAnalysis
Threatened Species
TAGMS
Metrics
Surface Water
Floodplain
Body BurdensDose Calculation
Metrics
TEFReproductive
Effects
UncertaintyRisk
Characterization
AssessmentEndpoints
InvertebratesExposure
Assessmnet
EPC DerivationDam Removal
DietaryConcentrations
PCBs
PCB Body Burdens
Piscivorous SpeciesNew York State
3
DatasetLower Hudson
River
Sediments
Taxa
AWQCExposure
AssessmentExposure PointConcentrationsSurface Water
-Tissue
Concentrations
Fish
Effects association
Uncertainty
Significant Habitats
Sediments-
EcologicalAssessment
Tree Swallow
Omnivorous SpeciesLiterature Cited
TAMS/Mcnzie-Cura
300974

NYSDEC/PortsNYSDEC/PortsNYSDEC/Ports
SCEMCSCEMCSCEMC
SCEMCSCEMCSCEMC
SCEMCSCEMCSCEMCSCEMCSCEMCSCEMCSCEMCSCEMC
SCEMCSUNY/Putman
SUNY/Putman
SUNY/PutmanScenic Hudson
Scenic HudsonScenic HudsonScenic HudsonScenic HudsonScenic Hudson
Scenic Hudson
Scenic Hudson
Scenic HudsonGE
GE
GEGEGEGE
GE
ED-8ED-9
ED- 10EA-1EA-2EA-3
EA-4EA-5EA-6
EA-7EA-8EA-9
EA-10EA-11EA-1 2EA-1 3EA-1 4
EA-1 5EP-1
EP-2
EP-3ES-1
ES-2ES-3ES-4ES-5ES-6
ES-7
ES-8
ES-9EG-1
EG-2
EG-3EG-4EG-5EG-6
EG-7
3.3.53
6.11.51.6
2.1.3
2.52.6.53.2
3.23.3.33.44.14.15.35.46.1
Appendix A4.2.1
4.1.1
General Comments4.1
General Comments2.62.74.1
4.1.1
4.1
4.2
Table 11
6.1
2. 3 and 6.12.22
2.3
2.5
Bald EaglesLinear Approach
UncertaintyORNL
NRDA PlanPCB Sources
DiseaseBald Eagle
Striped Bass
Time varying modelGE data
Dose formulaLevel of Effort
CongenerQualitative
Effects assessmentExposure
Food Chain ModelExposure Levels
Chronic ExposureExposure
ConcentrationsPCB Toxicity
MinkAvian Receptors
ImpactsEndpoints
PCB ToxicityToxic Equivalency
FactorsMeasurement
EffectsAssessment
EndpointBaseline ERASite conceptual
model
EndpointsOther stressors
ObjectivesEndpoints
Measurementendpoints
NYSDEC ResearchReceptors
ClaritySynopsis
QuantitativeUpper Hudson
DeformatiesThreatenedSturgeon
.-
PCB intakeHudson River
BZ#77-
ExtrapolationUpper Bound
Bioenergetic ModelTRY
MeasurementEffects
Great LakesReceptor Species
Population DeclineKnowledge
RiskReproduction
NOAEL
BZ#126
Toxicological DataMeasurement
EndpointToxicity quotient
TRVs
TranslatingPCBs
EndpointsCriteria
Assessmentendpoints
-Peripheral habitats
-Relevant Points
ReceptorsLower Hudson
BenthicCommunitiesEndangered
Lower Hudson
--
FactorImpacts
---
Lower BoundSeasonal Time
ScalesUncertainty
Receptors
St. Lawrence River-
DiversityReferences
NRDADevelopment
Threshold
Congener
SourcesBenthic
CommunitiesUncertainty
Relevant endpoints
Population-level risk---
-
10 TAMS/Men/ie-Cura
300975

GE
GE
GE
GEGEGEGE
GEGEGE
GEGEGE
EG-8
EG-9
EG- 10
EG- 11EG-12EG- 13EG- 14
EG- 15EG-16EG- 17
EG- 18EG- 19EG-20
3.3
2.1
2.2
2.42.63.13.2
3.33.44.1
5.46
6.1
Site characterizationDefinition of the
"site"Contaminants of
ConcernSite Conceptual
ModelReceptors
Exposure PathwaysFate & Transport
Exposureconcentration
ModelsToxicity
Riskcharacterization
UncertaintyUncertainty
ReceptorsLower Hudson
RiverHerbicides,
Metals exposure Pesticides
Exposure pathways Aquatic vegetation--
Models
--
TEF TEQ
Models TRYSensitivity analysisSensitivity analysis
11 TAMS/Menzie-Cura
300976

THIS PAGE LEFT BLANK INTENTIONALLY
300977
12 TAMS/Menzie-Cura

Responses
00
ooro

II. RESPONSE TO COMMENTS ON THE ERASOW
General Comments
Response to EP-3
Consistent with USEPA's risk assessment guidance and the NCP (§300.430(d)(4)), theobjective of the ERA is to assess risk on a site-specific basis. The ERA will not compare the HudsonRiver PCBs site to other sites contaminated with PCBs.
Response to EG-1
Consistent with USEPA's risk guidance, the ERASOW begins with the contaminant ofconcern and works up to assess risk to individuals, populations, and communities (a ''bottom-up"approach), rather than starting with field population and community information and working downto identify the contaminant of concern ("top-down" approach), as proposed by the commenter. Thebottom-up approach is then combined with the independent results of a probabilistic analysis in aweight-of-evidence approach to determine whether concentrations of PCBs present in the HudsonRiver may cause adverse effects in individuals and populations of representative receptors. Aweight-of-evidence approach is preferred for the Hudson River PCBs site because examination ofseveral lines of evidence increases confidence in the results of the study of this complex Superfundsite.
Additional information regarding the contaminants of concern is provided in the responsesin Section II. 2.2, Contaminants of Concern. Additional information regarding risks to biologicalcommunities and populations is provided in the responses in Section II. 2.3, Assessment Endpoints.Additional information regarding uncertainty in the ERA is provided in the responses in Section II6.1, Approaches to Assessing Uncertainty.
Response to ES-2
Qualitative information on the "health" of the Upper Hudson River ecosystem, limited toany observations made during the ecological field sampling, will be presented in the problemformulation (Step 3) discussion in the ERA.
1. INTRODUCTION
1.1 Site History
Response to ED-1
The comment on the relative importance of the removal of the Fort Edward Dam isacknowledged and will be incorporated into future reports, where applicable.
13 TAMS/Menzie-Cura
300979

1.2 Ecological Risk Assessment in the Superfund Process
Response to EN-1
All relevant data received by USEPA during preparation of the ERA will be considered forincorporation into the ERA, as time permits. Data received after release of the ERA will bereviewed to determine whether they are directly applicable to the ERA, and if so, they will beconsidered in any additional analyses or responses to comments.
1.3 Results of Phase 1 Ecological Risk Assessment
Response to ED-2
The comment on editing for clarity is acknowledged and will be incorporated into futurereports, where applicable.
1.4 Changes in EPA Risk Assessment Guidance Since the Phase 1 Assessment
No significant comments were received on Section 1.4.
1.5 Additional Toxicological Benchmarks Developed by ORNL Since the Phase 1Assessment
Response to EA-1
USEPA will identify and explain the use of any Oak Ridge National Laboratories (ORNL)report used in the ERA. The ORNL reports summarize scientific literature and may be used as astarting point for a literature search on toxicological benchmarks.
1.6 Organization of the Phase 2 ERA Based on USEPA 1997 Guidance
Response to EA-2
The draft scope for the Hudson River Natural Resource Damage Assessment (NRDA) Planissued in 1998 correctly stated that much of the information to quantify injury to various receptorsis likely not available; however, it also states that the necessary information will be developed.Similarly, the information necessary to assess risk in the ERA will be developed by USEPA basedon available water, sediment, aquatic invertebrate, and fish data.
Limited mink and otter data from the New York State Toxic Substances Monitoring Program(1982) and Foley et al. (1988) will be provided in the ERA. The mink's exposure to PCBs will beestimated using a food chain model that calculates PCB uptake from its food source (includingforage fish), from direct contact with PCB-contaminated sediments, and from ingestion of PCB-
14 TAMS/Menzie-Cura
300980

contaminated surface water. Heavy metals data from the Upper Hudson River (Phase 2 1993Ecological Sampling Database) will be discussed in the benthic macroinvertebrate communityanalysis section.
Available data are sufficient to perform a quantitative and qualitative assessment ofecological risk posed by the Hudson River PCBs site.
2. PROBLEM FORMULATION
Response to EG-5
The commenter recommends focusing the ERA on three questions related to the adverseeffects of PCBs on biological community structure and population dynamics. The first question iswhether PCBs from the site currently are adversely affecting biological community structure or thepopulation dynamics of the key receptors. As explained in the response to EG-3. biologicalcommunity structure and population dynamics of vertebrate receptors are not emphasized in the"bottom-up" approach of the Superfund baseline risk assessment. Instead, consistent with USEPAguidance, assessment endpoints were selected to identify risk to receptors of concern that could beadversely affected by contaminants from the site (ERASOW, p. 13).
The second question asks when will PCBs from the site no longer adversely affect biologicalcommunity structure or population dynamics under a "no action" remedy. Again, the bottom-upapproach of the Superfund risk assessment emphasizes risk to individual receptors of concern, ratherthan on community structure or population dynamics. The ERA will model future fish body burdensto determine if predicted concentrations of PCBs will adversely affect biological receptors over a25-year time frame, beginning at the time of data collection (i.e., 1993 to 2018). Both mean and95% upper confidence limit (UCL) PCB concentrations will be calculated, absent any remediation.Because many receptors at various trophic levels are being evaluated, an estimate of when the PCBswould no longer adversely affect the biological community is not an appropriate assessmentendpoint.
The third question is to what degree will remediation reduce the time to reach the point atwhich PCBs are no longer adversely affecting biological community structure or populationdynamics. As stated above, the ERA focuses on key biological receptors rather than an entirebiological community or population. Moreover, evaluation of remedial alternatives that address riskis part of risk management, which is the step after completion of the baseline risk assessment(ERASOW, p. 9). Accordingly, this question is outside of the scope of the ERA.
15 TAMS/Menzie-Cura
300981

2.1 Site Characterization
Response to EG-9
USEPA has consistently defined the site to include the Lower Hudson River since at leastApril 1984, when the Agency issued its FS for the site and before the site was listed on the NationalPriorities List (codified at 40 CFR Part 300, App. B). In its September 25, 1984 Record ofDecision, USEPA defines the site by reference to three figures which, together, depict the site as theentire 200-mile stretch of the River from Hudson Falls to the Battery in New York City, plus theremnant deposits. In addition, during the Reassessment RI/FS, USEPA has consistently defined thesite as including the Upper and Lower River (e.g., the Scope of Work for Hudson RiverReassessment RI/FS (December 1990) and the Phase 1 Report for the Reassessment RI/FS (August1991)). The comment regarding USEPA's use of the results of the ERA (including the LowerHudson ERA) in evaluating remedial alternatives is a risk management issue, and therefore beyondthe scope of the ERA. USEPA decision-makers will consider risk management followingcompletion of the ERA.
2.1.1 Upper Hudson River
Response to ED-3
The small whorled pogonia (Isotria medeloides), a member of the orchid family, is listed asa federal threatened species. It is listed in New York State as a historic species, last seen in 1976.However, because it is generally found in dry soils in mid-aged woodlands, it will not be discussedin the ERA.
2.1.2 Thompson Island Pool
No significant comments were received on Section 2.1.2.
2.1.3 Lower Hudson River
Response to EN-2
As appropriate, endangered or threatened species in the Lower Hudson River will bediscussed in the ERA.
16 TAMS/Menzie-Cura
300982

Response to EA-3
The ERA for the Lower Hudson River is appropriate because, as noted in the ERASOW (p.12), the Lower Hudson River has several ecologically sensitive areas that give it ecologicalimportance. Sufficient information exists to perform the ERA for the Lower Hudson River.
2.2 Contaminants of Concern
Response to EG-4. EG-10. and ED-4
The ERA is part of USEPA's reassessment of its 1984 no-action decision with respect toPCB contaminated sediments in the Upper Hudson River (ERASOW, p. 12). As such, theERASOW focuses on PCBs in the Upper Hudson River sediments. Step 1, which includes screeningfor preliminary contaminants of concern (COCs), was performed in the Phase I Report Review CopyInterim Characterization and Evaluation Hudson River PCB Reassessment RI/FS (August 1991) andwill be summarized in the ERA (see ERASOW, p. 7). PCBs were identified as the primary COCs,given the quantity released, their persistence in the environment, their toxicity, and their knownbioaccumulative effects.
2.3 Assessment Endpoints
Response to EG-3 and EG-6
USEPA agrees that one of the assessment endpoints of the ERA is sustainability (i.e.,survival and reproduction) of local Hudson River populations (ERASOW, p. 14). The ERA willestimate the potential for risk under future conditions based on modeling results (Baseline ModelingReport, due May 1999). Potential risk will be based on the probability that future concentrations willresult in body burdens or doses that exceed the selected toxicity reference values (TRVs) for eachreceptor population.
Consistent with USEPA risk guidance (USEPA, 1997), the assessment endpoints identifiedin the ERASOW are primarily individual-level risks, such as survival or growth, rather than thesustainability of communities or populations. Direct measurement of population-level endpoints isproblematic because it is difficult to identify a discrete population and to determine the proportionof individuals in a population that constitutes a population-level change, which could lead to anunderestimation of ecological risk. While there is uncertainty associated with extrapolating froman individual-level risk to a community or population, such an approach is protective of theenvironment.
USEPA agrees that it must select appropriate TRVs as measures of effect and that theappropriate criteria are those provided in USEPA guidance. The TRVs that will be used are basedon peer-reviewed scientific studies. The uncertainty associated with them does not compromise the
17 TAMS/Menzie-Cura
300983

integrity of the ERA. It is unrealistic to expect the scientific literature to provide species- andhabitat-specific TRVs for all endpoints examined. Surrogate species are routinely used in ecologicalrisk assessments to calculate risks to the biological community. It should be noted that even TRVsderived for specific areas and species have uncertainty and variability associated with them.
Response to ED-6
The shortnose sturgeon and brown bullhead are omnivorous, as indicated in the text(ERASOW, p, 18-19). Table 1 of the ERASOW should have included a separate assessmentendpoint for omnivorous fish, as follows.
Assessment Endpoint
Survival, growth, andreproduction of localomnivorous fish populations
Specific Ecological Receptor"Endpoint Species"
brown bullheadshortnose sturgeon
MeasuresExposure
Food Chain ModelingPCB Cone, in PreyBody BurdensPCB in Water/Sed.
Effect
Exceed, of TRVExceed, of Pop.
EffectsExceeds WQC
2.4 Site Conceptual Model
Response to EG-11
Consistent with USEPA guidance (USEPA, 1997), the site conceptual model in theERASOW (p. 14) identified the sources, media, pathways, and routes of exposure that will beevaluated in the ERA. Environmental fate processes, such as burial and dechlorination, are notincluded in the conceptual model, but will be presented in the Baseline Modeling Report (due May1999), which will be used to estimate future concentrations of PCBs. The presence of othercontaminants and stressors will be considered during risk management, as appropriate (see responseto comments EG-4, EG-10, and ED-4). The diagram of the conceptual model (Figure 5 of theERASOW) could have shown aquatic vegetation as the food source of some lower trophic levelreceptors (e.g., herbivores). However, aquatic vegetation was not included because it generally doesnot bioaccumulate PCBs and therefore does not contribute a significant amount of PCBs to benthicinvertebrates.
2.5 Measurement Endpoints
Response to EG-7
Consistent with USEPA guidance (USEPA, 1997), the ERASOW identified individual-levelmeasurement endpoints, rather than population or community-level endpoints, for individual-levelassessment endpoints. As with the assessment endpoints, direct measurement of population-levelmeasurement endpoints is problematic because it is difficult to identify a discrete population and todetermine the proportion of individuals in a population that constitutes a population-level change,
18 TAMS/Menzie-Cura
300984

which could lead to an underestimation of ecological risk The measurement endpoints will be usedto determine the potential for community or population-level effects based on individual risk. Whilethere is uncertainty associated with extrapolating from an individual-level risk to a community orpopulation, such an approach is protective of the environment.
The measurement endpoints identified in the ERASOW include ambient water quality criteriaAWQC), sediment quality values, and TRVs. A comparison of site data to these values is beingconducted as part of the ERA to update the comparison done earlier in the Phase 1 Report (USEPA,1991). This is consistent with USEPA guidance, which states, "measurement endpoints can includemeasures of exposure as well as measures of effect" (USEPA, 1997).
The TRVs, as well as other measurement endpoints, will be selected based on the criteria setforth in the ERASOW (p. 15), which are strength of the association between the measurementendpoint and the assessment endpoint, data quality, and study design and execution. These threebroad criteria encompass the eight criteria identified by the commenter.
USEPA acknowledges the commenter's agreement with USEPA's use of a weight-of-evidence approach. The quality of each measurement endpoint will be evaluated according to theattributes identified by Menzie et al. (1996) and will be discussed in ERA. USEPA notes that Dr.Menzie will be directly involved for the Hudson River PCBs Reassessment ERA.
Response to ED-5
Measured PCB body burdens are available for benthic invertebrates, forage fish, piscivorousfish, and insectivorous birds, as listed in Table 1 of the ERASOW. PCB concentrations in receptorsthat have no measured body burdens will be modeled based on food chain exposure models andconcentrations of PCBs measured in the Hudson River, and/or biomagnification factors from thescientific literature (for example, for concentrations in eggs of piscivorous birds). USEPA willcontact agencies and organizations with information on fish and wildlife populations along theHudson to ensure that all receptor species feed in, at, or near the river. The potential receptor specieslisted in the ERASOW were selected to be representative of different behaviors and feedingstrategies.
Response to EN-3
USEPA agrees that the correct citation for the New York State Department of EnvironmentalConservation (NYSDEC) TAGM for screening contaminated sediments is NYSDEC (1998).
Response to EA-4
Disease and deformities observed during sampling would not necessarily be attributed toPCBs. Rather, the observations would be included in a weight-of-evidence approach, which would
19 TAMS/Menzie-Cura
300985
consider the location of observations, the number of observations, the measured PCB concentrationsin the area, and other measurements.
2.6 Receptors of Concern
Response to EG-12
USEPA selected the largemouth bass, but not the smallmouth bass, as a potential fishreceptor (ERASOW, p. 19). The smallmouth bass was erroneously included in Table 1. Asdiscussed in the response to ED-3, the whorled pogonia will not be included in the ERA because itshabitat is not found along the Hudson River. The northern harrier is a State species of specialconcern that is a potential receptor to be considered in the ERA because it feeds and nests in marshesor wetlands that could receive PCBs during flood events. The striped bass and shortnose sturgeonoccur predominantly in the Lower Hudson River; however, shortnose sturgeon have been sightedin the Upper Hudson River (Bain, personal communication). The striped bass was selected toevaluate the ecological risk posed by contaminated sediment, water and fish in the Lower Hudson(see also response to EA-6) and the shortnose sturgeon was selected because it is a federally-listedendangered species.
Response to ES-3
Please provide the references so they can be evaluated for use in the ERA.
2.6.1 Macroinvertebrate Communities
Response to EN-5
USEPA agrees with the comment. As stated in the ERASOW (p. 44), the PCBconcentrations in Hudson River surface water will be compared to freshwater or marine AWQC,depending on the salinity of the water. The Upper Hudson River is exclusively freshwater and onlythe last three Lower Hudson River locations sampled in the Phase 2 ecological sampling program(RM 58.7 and lower) are saline and can be compared to saltwater criteria.
2.6.2 Fish Receptors
2.6.3 Avian Receptors
;Vo significant comments were received on Sections 2.6.2 and 2.6.3.
20 TAMS/Menzie-Cura
300986

2.6.4 Mammalian Receptors
Response to ED-7
USEPA agrees with the comment. The citation for Foley et aj. (1988) will be evaluated foruse in the ERA. The Palmer and Fowler (1975) reference will be included in the references sectionof the ERA.
2.6.5 Threatened and Endangered Species
Response to EA-5
The bald eagle is a federally-listed threatened and a New York State-listed endangeredspecies, and therefore is appropriately mentioned in Section 2.6.5, Threatened and EndangeredSpecies.
2.6.6 Significant Habitats
No significant comments were received on Section 2.6.6..
2.7 Risk Questions
Response to ES-4
USEPA will use the term "adversely affecting"in the ERA rather than "impacting" todistinguish it from a natural resources damage assessment
3. EXPOSURE ASSESSMENT
Response to ED-9
Consistent with USEPA guidance (USEPA, 1997), the ecological risk posed by the site willbe assessed both quantitatively and qualitatively. For the quantitative portion of the ERA, USEPAfirst identified species that are most directly in contact with the PCBs in the Hudson River and weretherefore assumed to have the greatest potential for ecological risk. From this list of species, USEPAidentified receptors that occupy different positions within the food web and that have a variety ofbehavioral and feeding strategies, such as the mink, the brown bat, and the great blue heron. Theoverall risk to the ecosystem will be assessed by considering the quantitative risks to the variousindividual receptor species and by measuring the benthic community structure, combined with adiscussion of the risk along exposure pathways that were not quantitatively assessed. Exposure viapathways outside of the Hudson River, such as direct contact with PCBs in river bank and floodplainsediments, will be mentioned as additional pathways of exposure.
21 TAMS/Menzie-Cura
300987
3.1 Exposure Pathways
Response to EG-13
Consistent with USEPA guidance (USEPA, 1997), the diets of receptor species will bedetermined using the USEPA Wildlife Exposure Factors Handbook (USEPA, 1993) and, asappropriate, site-specific information from the scientific literature. USEPA has copies of thereferences cited by the commenter (Robinson, 1992; McCarty, 1995; Secord and McCarty, 1997;Exponent, 1998; and Secord, 1998).
3.1.1 PCBs in Sediments
3.1.2 PCBs in Water
3.1.3 Benthic Invertebrates
3.1.4 Fish Receptors
3.1.5 Avian Receptor
No significant comments were received on Sections 3.1.1 to 3.1.5.
3.1.6 Mammalian Receptors
Response to EN-6
USEPA selected the mink, rather than the shrew or meadow vole, as one of the mammalianreceptors of concern. Although shrews, voles, and mink may all be exposed to PCBs from directcontact with sediments on the river banks and floodplains, the mink was selected as a receptor ofconcern because of its documented sensitivity to PCBs and its reliance on fish as a food source(ERASOW, p. 20). USEPA selected the raccoon because it is a mammal with a different feedingstrategy (i.e., omnivore) than the mink, (With respect to avian receptors, the bald eagle was selectedas an avian receptor of concern, rather than other accipiters (hawks), because it is on both the federaland New York State lists of threatened and endangered species and there have been recent sightingsof it along the Hudson River (ERASOW, p. 21)). The receptors of concern are representative ofdifferent species that may be adversely affected by the site and is not intended to be all-inclusive.
3.2 Quantification of PCB Fate and Transport
Response to EG-14
USEPA will use fate and transport models to describe the distribution of PCBs in thesediments and water of the Hudson River. These modeled concentrations of PCBs in sediments and
22 TAMS/Menzie-Cura
300988

water will be used in the ERA as initial concentrations in several bioaccumulation models. One ofthe bioaccumulation models is a Gobas-type time-variable mechanistic model. The ERA will bepeer reviewed and USEPA will respond to the peer reviewers' comments in a responsivenesssummary.
Response to EA-6
The risks to striped bass and shortnose sturgeon will be assessed, though not explicitlymodeled, using sediment, water and fish data that are representative of their respective habitats,including spawning locations and winter holdover locations (ERASOW, p. 28). USEPA intends toassess the risk to the striped bass using the revised Thomann/Farley model.
Response to EA-7
Consistent with USEPA guidance (USEPA, 1997), the ERA will assess future risk (1993 to2018), assuming no remediation, by using modeled exposure concentrations. In modeling the futureconcentrations at various time intervals for mammalian and avian receptors, the initial concentrationmay be held constant for the first five or ten years, even if the model suggests a time-varyingdecrease in concentration (ERASOW, p. 29), or may be recalculated annually, as suggested by thecommenter. Holding the concentrations constant is a conservative approach that may lead to anoverestimation of risk, but it is protective of the environment given the expected variations inconcentrations throughout the site. A sensitivity analysis performed for the Monte Carlo method willprovide some indication of the degree to which the risk may be overestimated, and the uncertaintyassociated with using this approach would be discussed in the ERA.
3.3 Observed Exposure Concentration
Response to EN-7 and EG-15
USEPA will use appropriate statistics from the observed data to characterize exposures andbody burdens, including arithmetic averages and 95 percent upper confidence limits (UCLs) on theseaverages (ERASOW, p. 30). Because the observed concentrations are best described by lognormaldistributions (Baseline Modeling Report, due May 1999), the formula to estimate 95% UCL forlognormal distributions, also known as Land's method, will be used (Gilbert, 1987). These statisticsare appropriate for use in the ERA because the receptors of concern are expected to contact thesediments and water column over a large area rather than remain in one localized spot. Appropriatestatistics may include a mean exposure level with appropriate quantification of uncertainty, wherethe data are sufficient to be characterized as a distribution described by a mean and a standarddeviation (ERASOW, p. 30).
The field measurements of benthic invertebrate BSAFs will be compared to laboratory andother field measurements, such as sediment data, in assessing the risk to benthic invertebrates. Formodeled exposure concentrations of PCBs in benthic invertebrates, the concentrations will be
23 TAMS/Menzie-Cura
300989

estimated from a distribution of the site-specific BSAFs derived in the Baseline Modeling Report(due May 1999) (ERASOW, p. 34). The site-specific fish body burdens will be used to calibrate andvalidate the models (Baseline Modeling Report, due May 1999). Insectivorous birds and mammalsliving along the Hudson River are assumed to feed mainly on flying insects with partial aquatic lifehistories based upon Hudson River and New York State studies (e.g., Buchler, 1976; Robertson etal., 1992; Secord and McCarty, 1997). PCB concentrations in flying aquatic insect prey will bebased on the results of the field sampling program (i.e., macroinvertebrate and sediment data) witha factor to account for metamorphic partitioning between shed exuviae and the emerging flyinginsect.
Response to EG-8
The ERA will evaluate all relevant data sets that have been published or otherwise madeavailable to USEPA, where appropriate. Studies cited by the commenter will be reviewed, includingNYSDEC (1977), NMFS and USFWS (1985), ASMFC (1990), NYSDEC (1993), Kynard (1997),NMFS (1997), Secord and McCarty (1997), Exponent (1998), and USFWS (1998). Mr. Nye ofNYSDEC will be contacted.
While USEPA will evaluate the data in the studies cited by the commenter, it does not agreewith all of the commenter's interpretations of those data with respect to benthic and phytophilousmacroinvertebrates, fish, and birds at the site. For example, studies on fish abundance do notnecessarily reflect the response offish to PCBs as factors, because the fishing advisories may havea greater overall effect on abundance. In addition, the commenter stated that USEPA shouldeliminate the tree swallow as a receptor species due to the Secord and McCarty (1997) study,claiming that the study "show(s) that even high body burdens of PCBs have not affected thereproductive success of tree swallows." In fact, Secord and McCarty (1997) stated, "...tree swallowsbreeding along the Hudson River had lower reproductive success than tree swallows from anuncontaminated site" and "PCB concentrations and toxic equivalency quotients detected in treeswallows have significant implications for migratory birds that breed or migrate along the HudsonRiver." Therefore, it is appropriate that the tree swallow be retained as a receptor species.
3.3.1 Sediment Concentrations
3.3.2 Water Column Concentrations
No significant comments were received on Sections 3.3.1 and 3.3.2.
3.3.3 Benthic Invertebrate Concentrations
Response to EA-8
GE has collected data on PCB concentrations in various media in the Hudson River, andGE's data will be used to supplement USEPA's dataset, as appropriate (ERASOW, p. 30). GE's
24 TAMS/Menzie-Cura
300990

sediment data will be evaluated for appropriateness to supplement USEPA's high-resolution andlow-resolution sediment sampling programs (ERASOW, p. 30). Data were collected in the 1993Phase 2 field sampling program specifically for the ERA, and therefore these data will receivepriority in the ERA.
3.3.4 Fish Concentrations
No significant comments were received on Section 3.3.4.
3.3.5 Avian Concentrations
Response to ED-8
USEPA acknowledges the commenter's offer to provide additional data on bald eagles as itbecomes available and may incorporate the data into the ERA if time permits.
3.3.6 Mammalian Concentrations
No significant comments were received on Section 3.3.6.
3.4 Modeled Exposure Concentrations
Response to EG-16 and EA-9
In the ERA, USEPA will use modeled exposure concentrations in addition to observedexposure concentrations to assess ecological risk. USEPA will use all appropriate data to calibrateand validate both the probabilistic bioaccumulation food chain model and modified Gobas time-varying mechanistic models (FISHPATH and FISHRAND) for PCB concentrations in fish in theBaseline Modeling Report (due May 1999). Even with such validation, there will be uncertaintywhich, consistent with USEPA's risk guidance (USEPA, 1997), will be quantified to the extentpossible. There are insufficient avian and mammalian Hudson River PCB data to field-validatevertebrate exposure models, and field collection of some vertebrate species could adversely affectHudson River populations (e.g., bald eagle, river otter).
The ERASOW (p. 32-33) presents general forms of the equations to be used for directingestion of water and for dietary doses from ingestion of prey (i.e., food). For the dietary doseequation, USEPA does not agree that the ingestion rate term is per day. As stated in the ERASOW(p. 33), the dose may be expressed as either a critical body residue or as an average daily exposeddose. USEPA does agree that the concentration of PCBs in food items is on a wet weight basis.
The ERASOW does not detail how the ingested dose will be translated into body burdens.The specific equations to describe the conversions require additional terms, such as assimilation andmetabolic efficiencies, and depend on the physiology of the given species and, to some extent, on
25 TAMS/Menzie-Cura
300991

the structure of the PCB congener being ingested (ERASOW, p, 33). This level of detail is beyondthe scope of the ERASOW. However, where appropriate, USEPA will describe in the ERA themethod used to convert ingested dose to absorbed doses (i.e., body burdens) for each species andeach congener-based toxicity equivalency factors (TEFs). These methods may range from assumingthat 100% of ingested dose is available to the species, to using exposure models such as thebioaccumulation model for fish. A literature-based biomagnification factor (USEPA, 1994) willbe used to predict concentration of PCBs in eggs of pisciverous birds.
As stated in the ERASOW (p. 33), the input values for these equations will be obtained fromthe scientific literature. For the Hudson River ERA, the relevant literature includes site-specificstudies, USEPA's Wildlife Exposure Factors Handbook (USEPA, 1993), and other references. Thestudies cited (Salyer and Langler, 1949; Davis, 1980, Landum et al., 1993; and Kaufman, 1996) willbe evaluated for use in the ERA.
USEPA disagrees with the comment that it would be more appropriate to obtain exposurepoint concentrations for fish by multiplying an average BSAF by an average surface sediment PCBconcentration. Rather, USEPA will obtain exposure point concentrations for fish by compiling PCBconcentrations by location (ERASOW, p. 31). The Upper Hudson River will be divided into threereaches (RM 189, 168, and 154). The pooling of data from Upper Hudson River sampling locationsis done to account for forage fish obtaining benthic invertebrates from a large area rather than fromone isolated location. The locations in the Lower Hudson River are considered to be separatehabitats and therefore fish PCB concentrations are not combined.
Response to EN-8
Because limited data are available for nearshore water concentrations, whole water averageand 95% UCL concentrations will be used for all receptors. For species whose predominant habitatis the shoreline, the 95% UCL may provide a more appropriate concentration than the average, asconcentrations may be higher along the shoreline.
3.4.1 Benthic Invertebrate Receptors
3.4.2 Fish Receptors
3.4.3 Avian Receptors
3.4.4 Mammalian Receptors
No significant comments were received on Sections 3.4.1 to 3.4.4.
26 TAMS/Menzie-Cura
300992

4. EFFECTS ASSESSMENT
4.1 Estimating the Toxicity of PCBs
Response to ES-1 and ES-5
For each receptor species, a toxicity reference value (TRY) will be selected based on studiesthat examine the effects of PCBs on survival (lethality), growth, or reproduction (ERASOW, p. 37).Reproductive effects are broadly defined to include larval/fetal development. Studies that examinethe effects of PCBs on other sublethal endpoints will be presented, but not used to select TRVs.TRVs for fish will be expressed as critical body residues in adult fish and fry (e.g., mg/kg wholebody weight) and as lipid-normalized concentrations in eggs (e.g., mg/kg lipid in eggs). TRVs foravian and mammalian receptors will be expressed as daily doses (e.g., mg/kg whole body weight).TRVs for birds will also be expressed as concentrations in eggs (e.g., mg/kg wet wt egg). Noadditional toxicity studies are planned. A summary of published studies in the scientific literaturewill be provided in the ERA.
Response to E A-10
USEPA did not conduct site-specific toxicological studies at different locations along theentire length of Hudson River because it would have required numerous toxicological studiesconducted over a period of several years. This would have delayed the Superfund process and addedsignificantly to the cost of the ERA. Rather, USEPA focused its efforts on obtaining site-specificsediment, water, benthic invertebrate, and fish data, which will be used along with the toxicologicalstudies from the scientific literature to estimate PCB toxicity to Hudson River ecological receptors.Toxicological studies used to establish TRVs will be chronic studies, because exposure of ecologicalreceptors to PCBs is expected to be long-term. In addition, reproductive effects of PCBs aretypically studied in long-term exposure scenarios. The uncertainty associated with using TRVsderived from toxicological studies in scientific literature rather than site-specific toxicologicalstudies will be addressed in the ERA.
Response to EG-17. EN-10. ES-7. and EA-11
The ERASOW (p. 37-38) outlined two approaches for assessing PCB toxicity: the TotalPCBs and Aroclor mixture toxicities approach, and the most recent PCB congener-specific toxicitiesand Toxicity Equivalency Factors (TEFs) approach. USEPA agrees that use of the TEF approachhas significantly improved the understanding of the relative toxicities of different PCB congenersand of the aggregated toxicity of PCB mixtures. However, USEPA disagrees with the suggestionthat the TEF approach should be eliminated from the ERA because TEF studies may yieldconservative benchmarks that indicate lower adverse effect levels than those derived using the TotalPCBs and Aroclor mixture toxicities approach. Rather, consistent with the recommendationspublished following a USEPA-sponsored workshop (ERG, 1998). USEPA believes that both
27 TAMS/Menzie-Cura
300993

approaches are appropriate for use in the ERA. USEPA will use the TEF approach for all congenerscovered by World Health Organization (WHO) TEFs (i.e., BZ# 77, 81, 126,169,105, 114, 118,123,156, 157, 167, and 189; Van der Berg et al., 1998), if the site data are adequate to support its use(ERASOW, p. 39). In the ERA, USEPA will present an evaluation of the data sets for each of the12 congeners with a WHO TEF value.
4.1.1 Total PCBs and Aroclor Toxicities
Response to ES-6
To clarify the ERASOW (p. 38), one of the toxicity reference values (i.e., dose) for chroniceffects of PCBs will be based on the No-Observed-Adverse-Effect-Level (NOAEL), and will beadjusted to reflect differences from test species to receptor species, and from sub-chronic to chronicvalues.
Response to EP-2
The potential for adverse effects will be based on comparisons of measured and modeledexposure concentrations to both appropriate regulatory standards and TRVs obtained from thescientific literature, even if no adverse effects are observed in the receptors of concern. The 1993Phase 2 benthic invertebrate data compares communities from similar habitats along differentreaches (i.e., varying PCB concentrations) of the Thompson Island Pool in the Upper Hudson Riverto determine community-level differences. As noted in the ERASOW (p. 39), areas with low PCBconcentrations will be considered more representative of reference areas than areas with elevatedPCB concentrations. TRVs for benthic invertebrates have been deleted as a measurement endpoint.as discussed in the response to ES-9.
4.1.2 Congener-specific Toxicity and the Toxicity Equivalency Factors (TEF)Approach
No significant comments were received on Section 4.1.2.
4.2 Measures of Effect
Response to ES-8
The full citations for all sources of toxicological data used in the ERA will be provided inthe references section of the ERA.
28 TAMS/Menzie-Cura
300994

4.2.1 Benthic Invertebrate Communities
Response to EN-4 and EN-9
A quantitative index of EPT species (Ephemeroptera, Plecoptera, and Tricoptera, such asmayflies, stoneflies, and caddisflies) and an EPT to Chironomidae ratio are not appropriate for theHudson River, because large rivers generally do not have the shallow, fast-moving water and therocky bottom that is the preferred habitat of many EPT species. In addition, the EPT toChironomidae ratio may be skewed; the number of Chironomid species may be high for reasonsother than water quality. The diversity indices will be used as a measure of benthicmacroinvertebrate community structure to compare similar habitats along different reaches of theriver (ERASOW, p. 39). The USEPA (1989) reference cited by the commenter was revised in 1997(Revision to Rapid Bioassessment Protocols For Use in Streams and Rivers: Periphyton, Benthic,Macroinvertebrates, and Fish, USEPA 841-D-97-002).
Response to EP-1
The ERA will use predicted (1993 to 2018) sediment, water, and fish PCB concentrationscalculated for the Baseline Modeling Report (due May 1999), as well as measured concentrationsfrom the 1993 Phase 2 field sampling program. The predicted concentrations of PCBs in all mediamodeled are lower than the initial (i.e., 1993) levels, in accordance with data collected since the 1993Phase 2 field investigation.
4.2.2 Fish Receptors
Response to EN-11
As stated in the ERASOW (p. 40), the effects to fish will be calculated using measured (forcurrent) and modeled (for future) PCB body burdens, using a critical body residue approach.Toxicity Reference Values (TRVs), which represent the lowest PCB concentrations that have beenshown to cause adverse effects in test species, will be obtained from the scientific literature. Theapproach used to select TRVs will evaluate the sensitivity of the endpoint and quality of the study,as recommended by the commenter. When selecting total PCB body burden TRVs for fish,preference will be given to studies that measure actual tissue concentration. Studies examining theeffects of PCBs on fish eggs will be used to develop TRVs for fish eggs and will be provided on alipid-normalized basis.
4.2.3 Avian Receptors
4.2.4 Mammalian Receptors
4.2.5 Threatened and Endangered Species
29 TAMS/Menzie-Cura
300995

4.2.6 Significant Habitats
No significant comments were received on Sections 4.2.3 to 4.2.6.
5. RISK CHARACTERIZATION
5.1 Surface Water Concentrations
5.2 Sediment Concentrations
No significant comments were received on Sections 5.1 and 5.2.
5.3 Benthic Invertebrates
Response to EN-12 and EA-12
Benthic community data will be analyzed qualitatively using a weight-of-evidence approachdue to the difficulty in attributing specific results or differences between stations to PCBs alone(ERA SOW, p. 45). The presence of contaminants in sediments other than PCBs, natural variabilityin ecosystems, and human disturbances of habitats and their potential effects on benthic communitystructure will be discussed in the ERA.
5.4 Fish Receptors
Response to EG-18
USEPA agrees that the ERA should provide an estimate of population-level risks to fishposed by PCBs at the site (ERASOW, p. 46) and that Suter (1993) presented a number of approachesto characterize population-level risk (ERASOW, p. 45). However, USEPA disagrees with thecomments that the ERASOW misrepresents Suter's work and that the ERA will not address themagnitude of population-level risk for fish. The equations presented in the ERASOW (p. 46-47) area general form of the model that may be used to relate individual-level to population-level risks;however, the exact form would depend primarily on the availability of toxicological data and theform in which the exposure data are expressed (ERASOW, p. 47). Other approaches that may beused include logit or probit functions to describe dose-effect and a logistic model to express theprobability that a receptor of concern will exceed a particular effect level (ERASOW, p. 47). Theresults of the logit or probit approach would be combined with mortality and reproductive rates ina population growth model to estimate population-level effects. The approach ultimately selectedfor use in the ERA will address the magnitude of population-level risk, if it is found to exist.
30 TAMS/Menzie-Cura
300996

Response to EN-13
USEPA acknowledges the statement that the commenter disagrees with the concept ofevaluating population-level effects as a component of an ecological risk assessment for remedialdecision-making. However, the evaluation of population-level effects is consistent with USEPA'sEcological Risk Assessment Guidance for Superfund (USEPA, 1997). The term "population" andthe approximate percent of affected individuals ascribed to population-level changes at an expectedexposure concentration will be discussed in the ERA. Consistent with USEPA guidance (USEPA,1997), the ERA will be appropriately protective of the environment in estimating risk at thepopulation level.
Response to EA-13
As noted in the ERASOW (p. 46), the first step in characterizing population-level risk is to"[d]efine the effects assessment as an extrapolation of series or statistical extrapolations." To clarify,this means statistically combining the individual dose effect curves, which are extrapolations ofmeasured observations and modeled data, into a single dose effect curve that describes the expectedresponse for the entire population, which is a further extrapolation.
5.5 Avian Receptors
5.6 Mammalian Receptors
5.7 Threatened and Endangered Species
5.8 Significant Habitats
No significant comments were received on Sections 5.5 to 5.8.
6. UNCERTAINTY ANALYSIS
Response to EG-19
USEPA disagrees with the comment that the absence of site-specific ecological data createssuch uncertainty regarding population and community-level risk that the ERA will be of little usein the remedial analysis. First, the ERA will be based on site-specific water, sediment, and biota(i.e., benthic invertebrate and fish) data. Second, the assessment of effects to benthicmacroinvertebrate communities will be performed using the methods set forth in USEPA guidance(USEPA, 1997). Third, consistent with USEPA guidance (USEPA, 1997), uncertainty will bediscussed qualitatively, and quantitatively when possible, in the ERA. Once completed, the resultsof the ERA will be used in Step 8 - Risk Management, to evaluate remedial alternatives (ERASOW,p. 9).
31 TAMS/Menzie-Cura
300997
6.1 Approaches to Assessing Uncertainty
Response to EG-2 and EG-3
The commenter expresses concern regarding the uncertainty in modeling ingested doses andbody burdens and uncertainty in TRVs. A variety offish, avian, and mammalian receptors at varioustrophic levels will be evaluated in ERA. Information on ingestion rates in wild populations will beused when available. When these rates are not available, ingestion rates based on captivepopulations or allometric equations (e.g., Nagy, 1987) will be used. The dosage of PCBs will becalculated based on PCBs in sediment, water, invertebrates, and fish from both the measuredconcentrations from the 1993 Phase 2 dataset and predicted concentrations from the bioaccumulationmodeling (Baseline Modeling Report, due May 1999). The calculation of two exposure estimatesprovides a basis for comparison and a method of validating modeling results. The TRVs are basedon the results of scientific studies showing observable, repeatable effects, directly related to PCBs.TRVs will be selected for each receptor based on long-term studies on taxonomically similar species.TRVs are intended for individual-level effects. The extrapolation to population or community effectsis based on site-specific conditions.
Another part of the weight-of-evidence approach is comparing sediment and water columnstudies to accepted standards, criteria, or guidelines. Although these comparisons do not providea quantitative estimate of risk, the magnitude of the risk can be approximated by examining the ratioof observed and predicted PCB concentrations to guidelines. It should be noted that regulatorycriteria and guidelines are based on individual-level observations.
Conducting various river specific studies beyond what NYSDEC, the US Fish and WildlifeService, and others are already conducting would provide more elements to the weight-of-evidence,but will introduce such broad uncertainties of their own that they are unlikely to reduce generaluncertainty in the assessment. Population numbers, age-class and annual reproductive success varyso widely in nature that only large long-term studies can ever begin to address such uncertainty.
Further, the ERA will provide adequate information for decision makers when consideredin conjunction with other parts of the Reassessment RI/FS, such as the Human Health RiskAssessment, the Data Evaluation and Interpretation Report, and the results of the modeling. TheHudson River PCBs Superfund site, stretching for nearly 200 river miles, has been contaminated byPCBs for over 50 years. Consequently, the site is complex on both a spatial and temporal scale anddecision-makers will benefit from multiple lines of evidence regarding risk management.
Response to EA-14 and EG-20
To clarify, using a sensitivity analysis to assess uncertainty, one model parameter will bevaried by a fixed percentage while all other parameters are held constant (ERASOW, p. 53). Useof the upper bound on the ingestion rate of a prey item for the avian and mammalian models waspresented as an example. The sensitivity analysis will use the lower bound as well.
32 TAMS/Menzie-Cura
300998

Response to ED-10
The ERASOW (p. 53) described an approach to assessing uncertainty, which is lack ofknowledge, and variability, which is the natural heterogeneity present in the environment.Consistent with USEPA guidance (USEPA, 1996b), a Monte Carlo-type analysis can be used toassess variability and uncertainty simultaneously by selecting one value to represent variability (i.e.,the 75th percentile) and then systematically changing the value to consider the uncertainty around it(i.e., a triangular distribution).
REFERENCES
Response to EN-14
USEPA will ensure that the missing references are included in the ERA, as appropriate.
Table Number 1: Assessment and Measurement Endpoints
Response to EN-15
Exceedance of sediment guidelines will be included as effects endpoints to the benthiccommunity structure; survival, growth, and reproduction of benthic invertebrates; and protection ofsignificant habitats endpoints in the ERA. The shortnose sturgeon and brown bullhead will beidentified as omnivores in relevant tables of the ERA (ERASOW, p. 19).
Response to ES-9
The ecological community indices (diversity, evenness, dominance) are considered to beexposure measures because they provide an estimate of the overall health of the benthic invertebratecommunity. In contrast, comparison of benthic community indices at a different time or location(e.g., different PCB concentrations) is an effects measure. Estimated exceedance of toxicityreference values (TRVs) for benthic community structure is deleted from the ERASOW. The TRVsare not an appropriate measurement endpoint for benthic invertebrate community structure as asource of food for local fish and wildlife because TRVs are species-specific and do not apply to riskat the community level.
33 TAMS/Menzie-Cura
300999

Table Number 2; Trophic Levels. Exposure Pathways, and Food Sources
Response to EN-16
USEPA agrees that the shortnose sturgeon feeds primarily on invertebrates. The feedinghabits of the shortnose sturgeon will be revised in the tables and text of the ERA, consistent with theERASOW (p. 27).
APPENDIX A MODELING APPROACHES
Response to EN-17
USEPA agrees with the comment that the modeling approaches in Appendix A are general.The ERASOW provides an outline of the work to be performed in the ERA. The models that areused to assess risk will be fully described in the ERA.
Response to EN-18
The congeners that may be modeled include the congeners proposed for evaluation in theTEQ approach (see response to EG-17, EN-10, ES-7, and EA-11). Most of the TEF congenersanalyzed were not detected in the samples collected.
Response to EN-19
River segments will be determined based on the spatial scale of the fate and transport(HUDTOX) modeling. Sediment concentrations in these reaches will be based on the results of theHUDTOX modeling. For most fish species, the model segments are expected to encompass theexposure zones for fish that may be caught in a particular segment of the river.
Response to EA-15
Bioaccumulation will be predicted using several models (each of which incorporates adifferent methodology) (Baseline Modeling Report, due May 1999). Fish PCB body burdens willbe predicted over a 25-year time frame (1993-2018). The time-varying mechanistic model developedby GE will not be used, but USEPA will use a modified Gobas time-varying mechanistic model (seeresponse to EG-14).
34 TAMS/Menzie-Cura
301000

ADDITIONAL REFERENCES
Bain, M.B. March 1999. Cornell University. Personal communication by telephone.
Van den Berg, M, L. Bimbaum, A.T.C. Bosveld, B. Brunstrom, P. Cook, M. Feeley, J.P. Giesy, A.Hanberg, R. Hasegawa, S.W. Kennedy, T. Kubiak, J. C. Larsen, F.X. Rolaf van Leeuwen, A.K. JjienLiem, C. Nolt, R.E. Peterson, L. Poellinger, S. Safe, D. Schrenk, d. Tillitt, M. Tyslind, M. Younges,F. Waem, and T. Zacharewski. 1998. Toxic equivalency factors (TEFs) for PCBs, PCDDs, PCDFsfor humans and wildlife. Environmental Health Perspectives. Vol.106 (12):775-792.
III. COMMENTS ON ECOLOGICAL RISK ASSESSMENT SCOPE OF WORK
Copies of the comments received during the public comment period follow.
35 TAMS/Menzie-Cura
301001

THIS PAGE LEFT BLANK INTENTIONALLY
36 TAMS/Menzie-Cura
301002

CLrt3
301003

EN-1U.S. DEPARTMENT OF COMMERCENational Oceanic and Atmospheric AdministrationNational Ocean ServiceOffice of Ocean Resources Conservation and AssessmentHazardous Materials Response and Assessment DivisionCoastal Resources Coordination Branch290 Broadway. Rm 1831New York, New York 10007
November 4,1998
Doug TomchukU.S. EPAProgram Support Branch290 BroadwayNew York, NY 10007
Dear Doug:Thank you for the opportunity to review the September, 1998 Hudson River PCBs ReassessmentRIIFS, Phase 2 Ecological Risk Assessment Scope of Work. The following comments aresubmitted by the National Oceanic and Atmospheric Administration (NOAA).BackgroundThe primary objectives of the baseline ecological risk assessment (ERA) are to quantify risks toselected biological receptors and communities exposed to releases of PCBs in the Hudson River.Current risk evaluations will be derived primarily from the EPA 1993 Phase 2 ecological samplingprogram and NYSDEC/NOAA 1993 and 1995 PCB congener-specific fish data. It will alsoinclude other Phase 2 investigations. Future risk will be determined from the pending BaselineModeling Report. Other data may include 1970's-1980's RI/FS data, NYSDEC annual fish tissuedata since 1971, GE fish data, NYSDOH 1972 benthic invertebrate data and USFWS/NYSDECavian PCB data.The interim ERA of the Phase 1 report concluded that PCBs in surface water, sediment and fishexceed state and federal guidelines. Specifically, surface water PCB concentrations exceededambient water quality criteria for protection of aquatic life. Fish tissue in the Upper Hudsonexceed USFWS guidelines for trout Piscivorous wildlife are consuming fish with PCBspotentially at higher concentrations than recommended by NYSDEC or USFWS. Sediment PCBsalso exceed sediment guidelines.SummaryEPA issued new policies related to ecological risk assessment The Hudson River ERA willincorporate new guidelines and criteria, utilize point and probabilistic estimates of effects,qualitatively address endocrine effects, consider the applicability of toxic equivalency factors(TEFs) and prioritize ecological entities for protection.The Screening Level Problem Formulation and Ecological Effects Evaluation were completed aspart of the Phase 1 activities. Study Design, Data Quality Objectives and Field Verification of theSampling Design were performed as part of the 1993 Ecological Sampling Plan.This Scope of Work (SOW) covers three of the eight steps of an EPA ERA. Baseline RiskAssessment Problem Formulation will use new guidance and studies to select assessmentendpoints and to develop a conceptual model. Site Investigation and an Analysis of Exposure andEffects will be based on site investigation results and model output Risk Characterization willutilize a weight of evidence approach.
301004

NOAA comments on Hudson River Ecological Risk Assessment Scope of Work, September 1998 (11/4/98)
The SOW deals with three distinct sections of the Hudson Riven the Upper Hudson, theThompson Island Pool (TIP) and the Lower Hudson. It covers the 200 miles of the Hudson fromthe Battery to Hudson Falls, encompassing freshwater, brackish and estuarine habitats. PCBs willbe examined as congeners, total PCBs and aroclors.Macroinvertebrates were sampled for PCB-congener body burdens and for benthic communityecological metrics. Structure will be measured by evenness, dominance and diversity. PCBwater-column concentrations will be compared to ambient water quality criteria (AWQQ andsediments will be assessed using freshwater and estuarine screening level guidelines.Eight species of fish representing various trophic levels will be evaluated. Measured PCB tissuecontaminant levels will be utilized for all species except the federally endangered shortnosesturgeon for which body burdens will be modeled. Contaminant profiles will be developed foreach species.Avian receptors include the tree swallow, mallard, belted kingfisher, great blue heron, andfederally threatened bald eagle. Mammalian species include the little brown bat, mink, andraccoon.Significant habitats to NOAA, NYSDEC, and USFWS will be evaluatedAssessment endpoints include:• Benthic community structure as food source to fish and wildlife,• Survival, growth and reproduction of localized benthic macroinvertebrate community and local
forage and piscivorous fish populations,• Protection (i.e., survival and reproduction) of wildlife (piscivorous and insectivorous birds;
piscivorous, insectivorous and omnivorous mammals), and• Protection of significant habitats.
Measurement endpoints include• Benthic community indices relative to trophic transfer of PCBs,• Fish tissue residues to evaluate trophic transfer of PCBs,• Fish and wildlife tissue residues to determine exceedances of PCB effect-level thresholds,• Water PCB concentrations comparison to NYS AWQC for protection of piscivorous wildlife,
and• Sediment PCB concentrations comparison to applicable sediment benchmarks.
Risk estimates will be developed from measurement endpoints. Exposure concentrations will bemodeled for species for which data are unavailable.CommentsThe authors of die ERA SOW present a concise and clear description of the planned approach toassess exposure and risk to receptors from Hudson River PCB-contaminated media. The approachis well-thought out and is consistent with current ERA guidance. The ERA will rely entirely onexisting data and modeling in the exposure assessment and information in the published literatureto assess toxicity; while considerable information is available for the exposure assessment, the lackof field measurements of toxicity endpoints may result in a high degree of uncertainty in the riskcharacterization. Most of the comments that follow primarily identify points for clarification.Page 4 Section 1.2: NYSDEC and USFWS are in the process of collecting tissue samples for 'PCB tissue analysis (waterfowl, macroinvertebrates, mink, turtles, bald eagles). This pendingdataset should be considered during the ERA. We recognize that results are not currently available
301005

NOAA comments on Hudson River Ecological Risk Assessment Scope of Work, September 1998 (11/4/98)
but they should be considered upon availability to support the modeled concentrations and toenhance the available data incorporated into the risk assessmentPage 12 Para 2: State and federally endangered and threatened species should have been listed inthe Lower Hudson River Section 2.1.3 to be consistent with the description of the Upper HudsonRiver.Page 16 Last Bullet, Page 18 Para 1, Page 44 Para 2, Page 45 Para 3: The NYSDEC sedimentbenchmark is incorrectly attributed to the NYSDEC soil cleanup levels (TAGMs) developed for EN-3protection of human health. The cited document (NYSDEC 1993) correctly identifies the technicalguidance for screening contaminated sediments, but it should be noted that there is a March 1998edition.Page 16 First Bullet, Page 18 Para 1: Richness, abundance and biomass were assessed in thebenthic macroinvertebrate community study. Proposed ecological metrics include diversity,evenness and dominance. Metrics selected should aid in the assessment of whether the biologicalcommunity is impaired and to what degree. Community similarity indices are appropriate but EN-4reference sites are required for comparison and none were sampled. EFT index and the ratio ofEPT to Chironomidae are other metrics suggested by EPA (1989). Diversity indices should not beused because they can provide misleading information. For example, it is well known thatdiversity is low in unperturbed desert environments. Since diversity is based on total number oftaxa and abundance of each taxa, stations with low abundance of many taxa could have a higherdiversity index then stations with high abundance but fewer taxa. It is important to considerwhether species intolerant to the COC are absent or reduced and whether the contribution ofpollution tolerant species has increased.Page 18 Section 2.6.1 PCB concentrations in the water column should be compared to freshwater EN-5or marine AWQC depending on the salinity of the water.Page 28 Para 1 and Page 31 Para 4: Mammalian receptors in the Upper Hudson should includesmall mammals such as shrews and meadow voles, which utilize the river banks and floodplainsthat are potentially contaminated with PCBs and represent an important feeding area for upper EN-6trophic avian and mammalian carnivores. By not considering floodplains in the ERA, risk tomink, raccoons and accipiters will most likely be underestimated. Excluding floodplains from therisk assessment also ignores a potential source of PCBs that can recontaminate riverine habitatsduring flood and scour events. The ERA should address all significant exposure pathways.Page 30 Para 1: According to Section 3.3, appropriate statistics for characterizing exposures andbody burdens will include arithmetic averages and the upper 95% confidence interval (95% UCI). EN-7Other references throughout the SOW refer to the use of averages but not the 95% UCI. Will the95% UCI be employed for all receptors? In the case of benthic invertebrates (Section 3.4.1), PCBconcentrations will be estimated from a distribution of site-specific BSAFs. Can we assume thatthe variable estimator will be the arithmetic mean and 95% UCI?Page 32: Direct ingestion of water is considered an exposure pathway and the dose from water iscalculated from the average concentration. PCB concentrations may be higher along shorelines FN 8than in mid-channel transect sample concentrations, resulting in an higher exposure to receptors kN-opredominantly utilizing the shoreline habitat It is not clear whether averaged nearshore watercolumn concentrations or averages over a broader spatial area will be used.Page 39 Para 1: Benthic macroinvertebrate effects measures should include the ecological metrics EN-9specified above in the comment for page 18. See EPA (1989).Pages 37-39: The ERA mentions the use of a toxicity equivalence (TEQ) approach with calculatedTEFs compared to modeled congener-specific PCB tissue concentrations. Appendix A does notexplain whether this will be done for each of the models.
301006

NOAA comments on Hudson River Ecological Risk Assessment Scope of Work, September 1998 (11/4/98)
Page 40 Para 2: "Measurement effects will be based on test species most similar to the receptor..."Limited data are available for PCB residue-based effects in fish, so it may be advisable to use an _approach that evaluates the sensitivity of the endpoint and the quality of the study. Measured bodyburden concentrations will need to be adjusted for concentration in the target tissue. For example, EN-11evaluation of reproductive effects, where the initial exposure occurs via maternal transfer to theegg, may require estimation of PCB concentrations in the mature egg from measured whole-bodyor muscle tissue concentrations. Exposure concentrations for developing larvae should alsoinclude exposure to PCBs in water and food.Page 43 Para 1 and Page 45 Para 2: Benthic community structure data will be analyzedqualitatively because there are concerns that it will be difficult to attribute specific results or EN-12differences between stations to PCBs alone. In that most sediments contain mixtures ofcontaminants and that benthic community structure data are generally viewed quantitatively, werecommend the latter analysis following a weight of evidence approach. Consideration can begiven to the presence of other contaminants in the assessment of uncertainty.Pages 45-47 and Table 1: In general, NOAA does not agree with the concept of evaluating F N 13population-level effects as a component of an ecological risk assessment for remedial decision- "making. The vague termonology used to describe population-level risk characterization can lead tononconservative determinations. Neither "population" nor the percent of affected individualsascribed to population-level changes at an effective concencentration has been defined.References: Add Bain (1997), Gilbert (1979) and Novak (198x). These are referenced in the text EN-14but missing from the reference section. NYSDEC (1998) should be substituted for NYSDEC(1993).Table 1: See Page 18 comments above regarding the use of diversity indices. Add exceedance ofsediment guidelines in the "Effects" column for the following assessment endpoints: benthic FX icommunity structure; survival, growth and reproduction of benthic invertebrates; and protection of kIN-1 ^_significant habitats. Shortnose sturgeon and brown bullhead are incorrectly identified in Table 1 asforage fish and piscivorous fish, respectively. The text correctly describes them as omnivores.Tables 1 and 2: Shortnose sturgeon feed primarily on invertebrates (Bain 1997). Their feeding EN-16habits should be revised in these tables, consistent with Section 3.1.4 on page 27.Appendix A: Modeling Approaches. The descriptions of the models are very general. EN-17Page A-l: It is stated that "individual congeners" will be modeled and estimates will be provided ina form that can be used for ERA - which congeners will be modeled and how will data for those EN-18congeners be used in the ERA?PageA-2: How will river "segments" be determined? How will sediment concentrations for the EN-19segmentation used in the modeling be derived?
Thank you for your continual efforts in keeping NOAA apprised of the progress at this site. Pleasecontact me at (212) 637-3259 or Jay Field at 206-526-6404 should you have any questions orwould like further assistance.
Lisa RosmanNOAA Coastal Resource Coordinator
301007
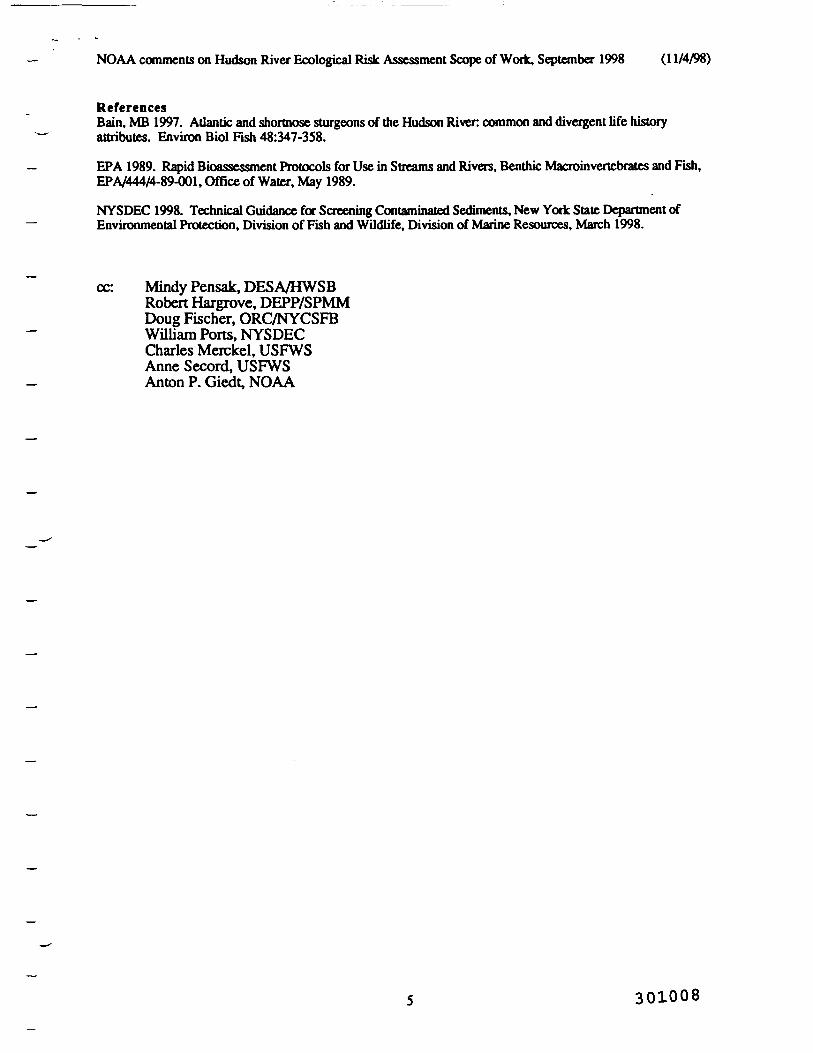
NOAA comments on Hudson River Ecological Risk Assessment Scope of Work, September 1998 (11/4/98)
ReferencesBain, MB 1997. Atlantic and shortnose sturgeons of the Hudson River common and divergent life historyattributes. Environ Biol Fish 48:347-358.
EPA 1989. Rapid Bioassessment Protocols for Use in Streams and Rivers, Benthic Macroinvertebrates and Fish,EPA/444/4-89-001, Office of Water, May 1989.
NYSDEC 1998. Technical Guidance for Screening Contaminated Sediments, New York Stale Department ofEnvironmental Protection, Division of Fish and Wildlife, Division of Marine Resources, March 1998.
cc: Mindy Pensak, DESA/HWSBRobert Hargrove, DEPP/SPMMDoug Fischer, ORC/NYCSFBWilliam Ports, NYSDECCharles Merckel, USFWSAnne Secord, USFWSAnton P. Giedt, NOAA
301008

C/2ff
301009

ED-1
New York State Department of Environmental ConservationDivision of Environmental RemediationBureau of Central Remedial Action, Room 22850 Wolf Road, Albany, New York 12233-7010Phone: (518) 457-1741 FAX: (518) 457-7925
November 9, 1998
Mr. Douglas TomchukUnited States Environmental Protection AgencyRegion II290 Broadway - 20th FloorNew York, NY 10007-1866
Re: Hudson River PCBs Site Reassessment RI/FSSite No.: 5-46-031
Dear Mr. Tomchuk:
The following comments are on the Hudson River PCBs Reassessment RI/FS, Phase 3 Feasibility StudyScope of Work and Phase 2 Ecological Risk Assessment Scope of Work, dated September 1998.
Feasibility Study Scope of Work
Section 1, Page 3. The text states, "computer models will be employed to assist in the selection ofremedial objectives as well as to assess the likely success of any remedial action in attaining these goals."Generally, the remedial action objectives are based on applicable or relevant and appropriaterequirements (ARARs) and/or risk assessment findings. Models are generally used to assist in predictingwhether specific remedial measures will enable the goals to be achieved. The scope of work shouldexplain how the computer models will be used to select remedial objectives.
Section 1.2, Page 5. The Scope of Work should clearly state that all of the exposure routes found to be ofconcern in the Human Health Risk Assessment (HHRA) are addressed in the Feasibility Study.
Section 2.2 Page 12 and 13 and Section 4. We suspect that the depositional areas just south of RemnantSite 3 and adjacent to Remnant Site 4 contain PCB contaminated sediments. Remedial alternativesshould include consideration of such areas above Rogers Island.
Section 2.2 Page 15 and 16. The DEC piscivorus wildlife criteria (0.1 ppm in whole fish) must beincluded in the Final Selection of Remedial Action Objectives, particularly where the reference to the'desired level in fish' occurs.
301010
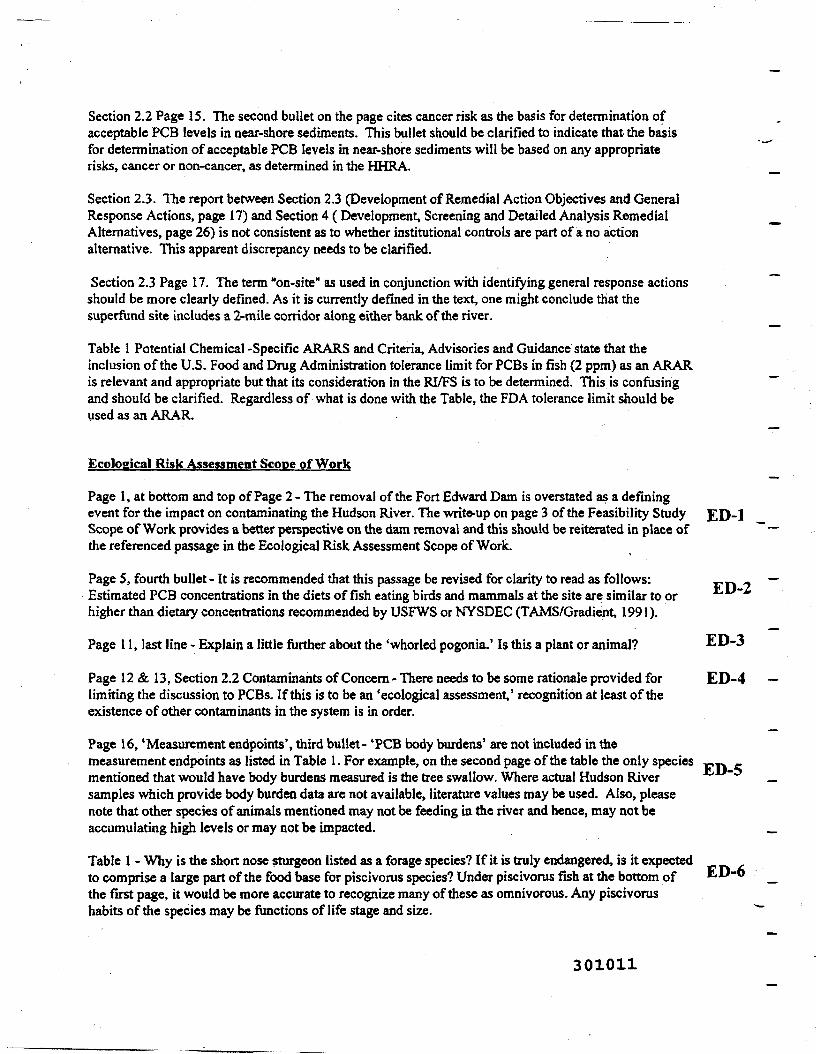
Section 2.2 Page 15. The second bullet on the page cites cancer risk as the basis for determination ofacceptable PCB levels in near-shore sediments. This bullet should be clarified to indicate that the basisfor determination of acceptable PCB levels in near-shore sediments will be based on any appropriaterisks, cancer or non-cancer, as determined in the HHRA.
Section 2.3. The report between Section 2.3 (Development of Remedial Action Objectives and GeneralResponse Actions, page 17) and Section 4 (Development, Screening and Detailed Analysis RemedialAlternatives, page 26) is not consistent as to whether institutional controls are part of a no actionalternative. This apparent discrepancy needs to be clarified.
Section 2.3 Page 17. The term "on-site" as used in conjunction with identifying general response actionsshould be more clearly defined. As it is currently defined in the text, one might conclude that thesuperfund site includes a 2-mile corridor along either bank of the river.
Table 1 Potential Chemical -Specific ARARS and Criteria, Advisories and Guidance state that theinclusion of the U.S. Food and Drug Administration tolerance limit for PCBs in fish (2 ppm) as an ARARis relevant and appropriate but that its consideration in the RI/FS is to be determined. This is confusingand should be clarified. Regardless of what is done with the Table, the PDA tolerance limit should beused as an ARAR.
Ecological Risk Assessment Scope of Work
Page 1, at bottom and top of Page 2 - The removal of the Fort Edward Dam is overstated as a definingevent for the impact on contaminating the Hudson River. The write-up on page 3 of the Feasibility Study ED-1Scope of Work provides a better perspective on the dam removal and this should be reiterated in place ofthe referenced passage in the Ecological Risk Assessment Scope of Work.
Page 5, fourth bullet - It is recommended that this passage be revised for clarity to read as follows:Estimated PCB concentrations in the diets of fish eating birds and mammals at the site are similar to orhigher than dietary concentrations recommended by USFWS or NYSDEC (TAMS/Gradient, 1991).
Page 11, last line - Explain a little further about the 'whorled pogonia.' Is this a plant or animal? ED-3
Page 12 & 13, Section 2.2 Contaminants of Concern - There needs to be some rationale provided for ED-4 —limiting the discussion to PCBs. If this is to be an 'ecological assessment,' recognition at least of theexistence of other contaminants in the system is in order.
Page 16, 'Measurement endooints', third bullet- 'PCB body burdens' are not included in themeasurement endpoints as listed in Table 1. For example, on the second page of the table the only species „-. _mentioned that would have body burdens measured is the tree swallow. Where actual Hudson River _samples which provide body burden data are not available, literature values may be used. Also, pleasenote that other species of animals mentioned may not be feeding in the river and hence, may not beaccumulating high levels or may not be impacted. _
Table 1 - Why is the short nose sturgeon listed as a forage species? If it is truly endangered, is it expectedto comprise a large part of the food base for piscivorus species? Under piscivorus fish at the bottom ofthe first page, it would be more accurate to recognize many of these as omnivorous. Any piscivorushabits of the species may be functions of life stage and size.
301011
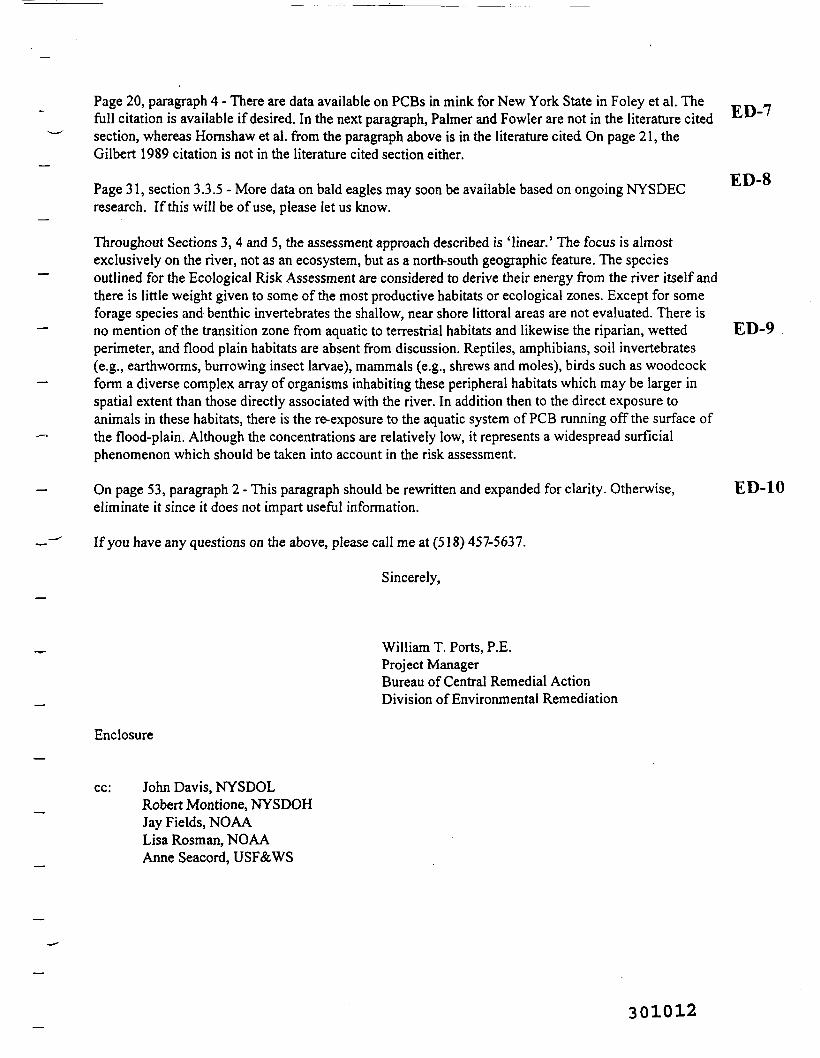
Page 20, paragraph 4 - There are data available on PCBs in mink for New York State in Foley et al. The _full citation is available if desired. In the next paragraph, Palmer and Fowler are not in the literature cited ^section, whereas Hornshaw et al. from the paragraph above is in the literature cited On page 21, theGilbert 1989 citation is not in the literature cited section either.
Page 31, section 3.3.5 - More data on bald eagles may soon be available based on ongoing NYSDECresearch. If this will be of use, please let us know.
Throughout Sections 3, 4 and 5, the assessment approach described is 'linear.' The focus is almostexclusively on the river, not as an ecosystem, but as a north-south geographic feature. The speciesoutlined for the Ecological Risk Assessment are considered to derive their energy from the river itself andthere is little weight given to some of the most productive habitats or ecological zones. Except for someforage species and benthic invertebrates the shallow, near shore littoral areas are not evaluated. There isno mention of the transition zone from aquatic to terrestrial habitats and likewise the riparian, wettedperimeter, and flood plain habitats are absent from discussion. Reptiles, amphibians, soil invertebrates(e.g., earthworms, burrowing insect larvae), mammals (e.g., shrews and moles), birds such as woodcockform a diverse complex array of organisms inhabiting these peripheral habitats which may be larger inspatial extent than those directly associated with the river. In addition then to the direct exposure toanimals in these habitats, there is the re-exposure to the aquatic system of PCB running off the surface ofthe flood-plain. Although the concentrations are relatively low, it represents a widespread surficialphenomenon which should be taken into account in the risk assessment.
On page 53, paragraph 2 - This paragraph should be rewritten and expanded for clarity. Otherwise,eliminate it since it does not impart useful information.
If you have any questions on the above, please call me at (518) 457-5637.
Sincerely,
ED-8
ED-9
ED-10
William T. Ports, P.E.Project ManagerBureau of Central Remedial ActionDivision of Environmental Remediation
Enclosure
John Davis, NYSDOLRobert Montione, NYSDOHJay Fields, NOAALisa Rosman, NOAAAnne Seacord, USF&WS
301012
be: E. CrottyR. TramontaneJ. LobbyR. SloanS. SanfordI. CarcichM. O'TooleW. DaigleW. DemickK. Farrar
301013

301014

EA-1
HUDSON RIVER PCBs REASSESSMENT RI/FSCOMMENTS ON PHASE 2 ECOLOGICAL RISK ASSESSMENT
SCOPE OF WORK, DATED SEPTEMBER, 1998Prepared by David D. Adams, Member-at-Large
Saratoga County Environmental Management Council
1. Section 1.5, P.6: It is recommended that a synopsis of the ORNL reports be FA-1included in the Ecological Risk Assessment giving the relevant points used in the RiskAssessment.
2. Section 1.6, P. 8 and Table 1: The draft scope for the Hudson River Natural ResourceDamages Assessment Plan, September 1988 states that information to quantify injury toaquatic insects, birds, reptiles and amphibians, and mammels is "likely not available". Inview of this statement, why does EPA believe sufficient information to realisticallyevaluate ecological risk in these areas is available? Wouldn't it make for a betterevaluation to focus the ecological risk assessment on those areas (water, sediment) andspecies (fish, invertibrates) for which data are available? The ecological risk assessmentseems in many areas to be qualitative enough without resorting to further speculativetreatment of species for which data specific to the Hudson River are lacking. It is notedthat the Peer Review Committee reviewing the Preliminary Model Cabitration Reportcommented on the desirability of getting data on mink and on concentration of heavymetals.
3. Section 2.1,3, P. 12: Is there enough information on the sources of PCB's in the Lower EA-3Hudson River to make a risk assessment of this area meaningful in terms of the effects ofremedial action in the Upper Hudson on species in the Lower Hudson? If not, it is notevident what benefit a risk assessment of the Lower Hudson River has to this study.
4. Section 2.5, P. 17: How can observations on "disease & deformities during sampling" EA-4be of use when toxic materials other than PCBs present in the Hudson River that couldcause any observed disease or deformity are not being evaluated? Again, this entire riskassessment is so fraught with qualitative aspects that it should not be further clouded byfurther unsubstantiated considerations. (For example, it is noted that in reply to a questionat the October 20th Availability Session regarding beuthic community indices, it wasstated that specific information relating these indices to PCB concentrations is notavailable and a qualitative approach would be used. Similar responses occurred severalother times in response to question at the Availability Session. (See also the discussion onP. 22 on measurement endpoints).
5. Section 2.6.5, P. 21: The bald eagle should be deleted from consideration as a LA-5threatened or endangered species. . - - • . - - . • . .., . , •
6. Section 3.2, P. 28: How can striped bass be properly evaluated using Upper Hudson EA-6River data when they are most heavily exposed to PCB sources in the Lower Hudson
301015
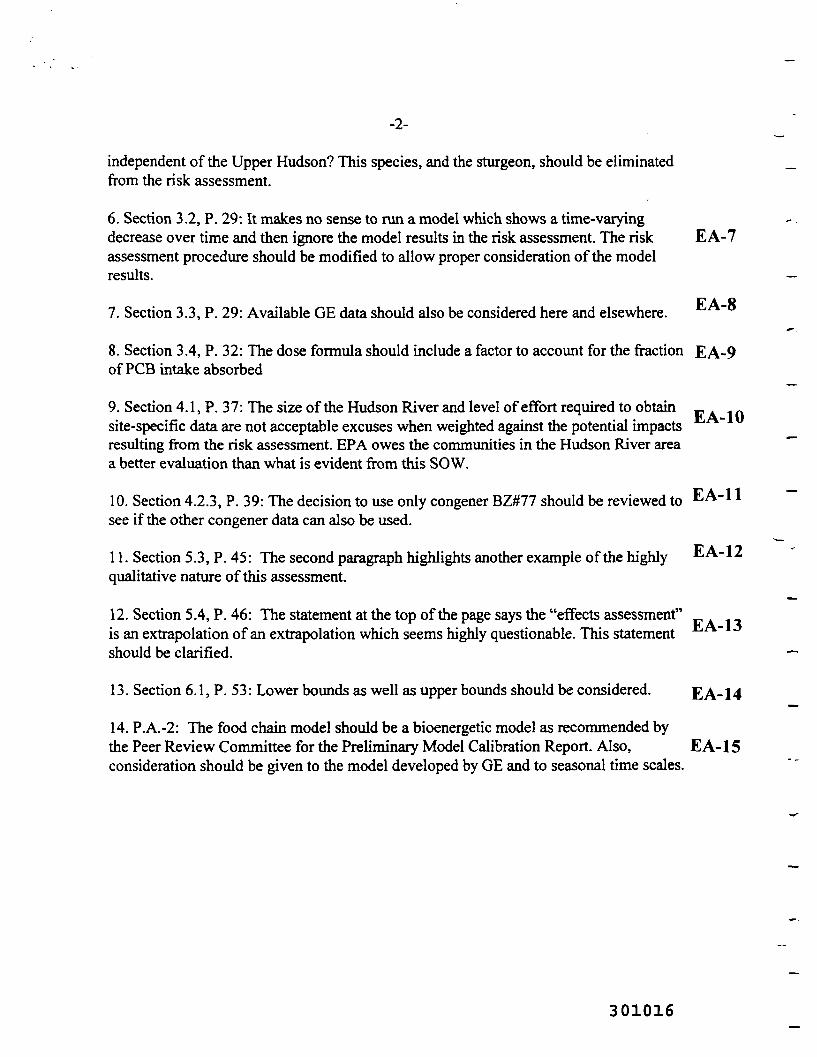
-2-
independent of the Upper Hudson? This species, and the sturgeon, should be eliminatedfrom the risk assessment.
6. Section 3.2, P. 29: It makes no sense to run a model which shows a time-varyingdecrease over time and then ignore the model results in the risk assessment. The risk EA-7assessment procedure should be modified to allow proper consideration of the modelresults.
EA-87. Section 3.3, P. 29: Available GE data should also be considered here and elsewhere.
8. Section 3.4, P. 32: The dose formula should include a factor to account for the fraction EA-9of PCB intake absorbed
9. Section 4.1, P. 37: The size of the Hudson River and level of effort required to obtainsite-specific data are not acceptable excuses when weighted against the potential impactsresulting from the risk assessment. EPA owes the communities in the Hudson River areaa better evaluation than what is evident from this SOW.
10. Section 4.2.3, P. 39: The decision to use only congener BZ#77 should be reviewed tosee if the other congener data can also be used.
11. Section 5.3, P. 45: The second paragraph highlights another example of the highlyqualitative nature of this assessment.
12. Section 5.4, P. 46: The statement at the top of the page says the "effects assessment"is an extrapolation of an extrapolation which seems highly questionable. This statementshould be clarified.
13. Section 6.1, P. 53: Lower bounds as well as upper bounds should be considered. EA-14
14. P.A.-2: The food chain model should be a bioenergetic model as recommended bythe Peer Review Committee for the Preliminary Model Calibration Report. Also, EA-15consideration should be given to the model developed by GE and to seasonal time scales.
301016

Community InteractionProgram
OCO

Department of Earth and Atmospheric Sciences x^vtv'Ar^v 518/442-4466 or 4556College of Arts and Sciences /gjfe |̂̂ \ fax- 518/442-5825 or 4468Earth Science 351 Ffcfi M |Ssn [email protected], New York 12222 \ V^T lOTT^ / http://www.atmos.albany.edu
EP-1
UNIVERSITY AT ALBANYSTATE U N I V E R S I T Y O F N E W Y O R K
October 29,1998
Mr. Douglas TomchukUSEP A - Region 2290 Broadway - 20th FloorNew York, NY 10007-1866ATTN: ERA SOW Comments, Phase 2 Ecological Risk Assessment
Dear Mr. Tomchuck:
I have reviewed the above referenced document and submit the following comments:
1. The use of 1993 field sampling data for estimating body burdens will overestimateexposure levels relative to toxicity reference values (p. 40). There will also be a biasin comparisons to water quality criteria, because PCB concentrations in both thewater column and fish have since declined, and were also lower prior to 1990. Therelation of existing concentrations to body burdens is dynamic, not static, and bodyburdens have a variable lag effect depending upon the receptor. To attempt to modelfuture body burden levels or response on the basis of one direct observation/organismor group at a fixed point in time will produce unacceptable uncertainty in the results.
2. What will determine a chronic exposure level, or whether (p. 38) a toxicologicaladverse reaction has occurred in organisms? Is this by comparison to a toxicitythreshold level from the literature or a regulatory standard (e.g. fish), even if noadverse effect is observed, i.e. an assumed toxicity effect in the absence of any direct EP-2observation? The relevance of threshold or reaction levels from the literature, or asdetermined in other settings with different receptors or test species must beestablished. It is not clear how a fixed time point (1993) benthic invertebratecommunity assessment (p. 39) will accomplish this, given the dynamic variationoccurring in the other two "effect measures" (p. 39).
3. Comparison data (exposure concentrations; observed ecosystem reactions; type ofPCB and system recovery status, etc.) for other PCB contaminated sites, such as theGreat Lakes and St. Lawrence River, should be included; and the risk characterizationof same provided for perspective. What are the similarities and difference to theHudson, and how might these affect the risk assessment?
In retrospect, this type of comparison should be applied to the SOW previously preparedfor the assessment of human exposure risk. An estimate of population exposure risk derived viaextrapolation from laboratory exposure studies at high PCB doses or other indirect means is
301018

profoundly uncertain when the actual health statistics for a human population of documentedexposure history, and observable body burden, can be obtained and/or directly measured, as atFt. Edward, Hudson Falls, and the Mohawk Indian tract on the St. Lawrence River. This is noless a matter of ecosystem effects evaluation, with the advantage of a much longer receptorhistory. Data of this type is critical to a resolution of the current debate about risk assessment inhuman.
Very truly yours,
-c)ss U,', £s^<./KaJK_-cljVGeorge W. Putman,Emeritus, Dept. of Earth and
and Atmospheric Sciences Faculty
301019

Public Interest Groups
oCNOHOro

SCENICHUDSON,Nc
ES-l
9 VASSAR STREET • POUGHKEEPSIE, NY 12601 • (914) 473-4440 • FAX (914) 473-2648
Scenic Hudson's Comments onUSEPA's Hudson River PCBs Reassessment RI/FS
Phase 2 Ecological Risk AssessmentScope of Work
As with the human health risk assessment, a full characterization of ecological effects associatedwith exposure to Hudson River PCBs is a critical part of EPA's Reassessment of the HudsonRiver. While we believe the overall approach to assessing ecological risks seems reasonable, asdoes the discussion of PCBs, we have the following concerns:
General Comments:
Toxicity of PCBs - It appears that PCB toxicity is not sufficiently documented. We do not havegreat confidence that the measurement of PCB toxicity in receptor species will be properlyconducted. We suggest that EPA review the approach used and the contractor's experience with pc iecological risk assessment to ensure a useful ecological risk assessment is completed; >
ff
The discussion of the toxicfty'of PCBs is-la'clang-iriTefe'rence-material: A considerable amountof literature exists: regafelmg^^^ . ........
Overall Ecological Health
From examining the range of PCB concentrations that exist in the Hudson River ecosystem and ES-2the effects of those concentrations on various receptor species it would seem reasonable toinclude a qualitative discussion of the health of the entire ecosystem and disappearance ofcertain species such as the mink. Certain factors such as the population decline of the mink, is anindicator as to the health and diversity of the ecosystem. Unqualified, but important, effects ofPCB contamination will fall by the wayside in a EPA number driven decision-making process.From our experience, studying environmental impacts and assessments, issues relegated toqualitative discussions are often dismissed and have little bearing on the outcome. However, aqualitative discussion as to the overall health of the Upper Hudson River ecosystem is better thanno discussion at all. . : '
Other concerns:Section 2.6, Receptors of Concern, pg.17 - Once again we are concerned that the riskassessment:(Section
1*.\J+ J.V«'V.^|Sll/A » VE ^_,UUVt/M II, jfS V_/11WW llgCUUl VT W CU.V WWllW^J. 1A»-.U 111 til U1V 11OA.
enf is based on the proper kribwledge'df receptor .species, particularly ofavian receptors £§-22.6.3', pg; '19). Several critical references are not sited'for this section;; - >r L -
more...
email: [email protected]
301021

Section 2.7, Risk Questions, pg. 22 - In the last sentence, the use of the word "impacting" is notappropriate for a risk assessment. The risk assessment should show whether there is a risk or ES-4 _
not, it does not have to show impact. The word impact would more appropriately be used in theNatural Resources Damage Assessment.
ES-5 'Section 4.1, Estimating the Toxicity of PCBs, pg. 37 - Toxicological endpoints that will beevaluated in the ERA should include Reproduction and 'Development'.
FS-6Section 4.1.1 Total PCBs and Aroclor Toxicities, pg. 38 - The last sentence in the firstparagraph incorrectly uses the word "threshold". A threshold is where effects start. Thissentence is confusing as, "No-Observed-Adverse-Effect-Level (NOAEL) toxicity values" will beused as "thresholds" for estimating adverse ecological impacts. Please clarify.
Section 4.1.2 Congener-specific Toxicity and the Toxic Equivalency Factors (TEF) ES-7Approach -pg. 39 - In discussion of congener specific toxicity assessment it is indicated that "ofthe most toxic (coplanars) congeners, the Phase 2 database includes usable data for BZ#77 only.If the data are adequate..." First, it is not clear as to how this data will be used. Secondly, wequestion whether or not an assessment can be based on BZ#77 data only. BZ#126 is usually themost important congener used in ecological risk assessment. The most meaningful data set —should be used to properly assess ecological risks
Section 4.2, Measures of Effect, pg. 39 - Sources of toxicological data, which "will include ES-8refereed scientific literature, the USEPA AQUIRE database, and government publications", aretoo vague. Please identify sources of toxicological data more specifically.
Table 1 Assessment and Measurement Endpoints, (page 1 of 3). Regarding the first ES-9Assessment Endpoint identified, Benthic community structure as food source for local fish and __wildlife, Ecological community indices (diversity, evenness, dominance) placed underMeasures/Exposure is a measure of effect, not exposure, and should be moved to the Effectcolumn. Under the Effect column - Estimated Exceedance of Toxicity Reference Value (TRVs) is _species-specific and is not generally used for a community and should be deleted.
11/10/98
301022

oftoftssft"«r+2.
301023

EG-1
GE CorporateEnvironmental Programs
Me/Wn a Schwetger General Bectric CompanyManager. Hudson River Project 1 Computer Drive SouthNew York State EHS Affairs Albany. New York 12205
Telephone (518) 458-6648Fax:(518)458-1014
November 2, 1998
Mr. Douglas TomchukUSEPA-Region 2290 Broadway - 20th FloorNew York, N.Y. 10007-1866
RE: ERA SOW Comments
Dear Mr. Tomchuk:
The process of preparing an ecological risk assessment to assess, withreasonable certainty, the ecological effects of PCBs in the Upper Hudson River istruly a daunting one. Extreme care must be given to several issues, includingadequately assessing communities or populations of benthic invertebrates, fish,birds and mammals in the river and adjacent land, and differentiating betweeneffects of PCBs on these populations and effects of other contaminants, such asmercury and lead, and other human disturbances.
Unfortunately, we are concerned that the process EPA has developed for thisassessment will not prove at all useful to its intended goal. The course whichEPA sets out in the Scope of Work is little more than a screening level analysis.Apart from a limited study of benthic invertebrates, the Agency has not, and isnot planning to, collect data on the biota of the Hudson and its shoreline. Noinformation gathered during this process, other than the concentration of PCBs inthe water column, sediments or limited selection of biota, will be specific to theUpper Hudson River. Such an analysis, while potentially useful for developingfuture investigation and analysis, cannot illuminate whether PCBs are affectingthe sustainability of biological communities or populations present at thisparticular site.
This failure to attain site-specific information on the wildlife populations of theUpper Hudson River will result in significant uncertainty in the risk assessment -we urge that the uncertainty be quantified and stated candidly so that the public
301024

may understand the likelihood of obtaining any particular ecological change as aresult of a recommended clean-up plan.
We look forward to the Agency's response to the enclosed detailed commentsregarding the Ecological Risk Assessment Scope of Work. If the Agency wouldlike to discuss these comments in greater detail, please do not hesitate to contactme.
Sincerely,
Melvin B. Schweiger
cc: Richard CaspeWilliam McCabeMelvin HauptmanJohn CahillDouglas FischerAlbert DiBernardoCharles Menzie
301025

COMMENTS OF GENERAL ELECTRIC COMPANY ONHUDSON RIVER PCBS REASSESSMENT RI/FS
PHASE 2 ECOLOGICAL RISK ASSESSMENT SCOPE OF WORK
November 2, 1998
301026

TABLE OF CONTENTS
I. Introduction and Executive Summary . . . . . . . . . . . . . . . . . . . . . . . . . . . . . . . . . . . . . . . 1
II. The Proposed Ecological Risk Assessment Will Not Provide Sufficient Information forRemedial Decision-making . . . . . . . . . . . . . . . . . . . . . . . . . . . . . . . . . . . . . . . . . . . . . . . 5
III. The SOW Lacks a Clear Statement of the Objectives and Description of Assessment andMeasurement Endpoints . . . . . . . . . . . . . . . . . . . . . . . . . . . . . . . . . . . . . . . . . . . . . . . . 10A. The ERA Needs a Clear Statement of Objectives . . . . . . . . . . . . . . . . . . . . . . . 10B. The Assessment Endpoints Should Focus on the Sustainability of Biological
Communities or Populations . . . . . . . . . . . . . . . . . . . . . . . . . . . . . . . . . . . . . . 11C. The Measurement Endpoints Should Provide Information Relevant to the
Assessment Endpoints and Should Go Beyond the Approaches Described in thesow . . . . . . . . . . . . . . . . . . . . . . . . . . . . . . . . . . . . . . . . . . . . . . . . . . . . . . . . 111. The Measurement Endpoints Described in the SOW Have Significant
Limitations . . . . . . . . . . . . . . . . . . . . . . . . . . . . . . . . . . . . . . . . . . . . . . 132. EPA Must Use Objective Criteria To Select TRVs . . . . . . . . . . . . . . . . 153. The ERA Must Consider Additional Lines of Evidence . . . . . . . . . . . . . 16
IV. Problem Formulation (Section 2) . . . . . . . . . . . . . . . . . . . . . . . . . . . . . . . . . . . . . . . . . 18A. Site Characterization (Section 2.1) . . . . . . . . . . . . . . . . . . . . . . . . . . . . . . . . 18
1. The SOW Does Not Acknowledge Significant and Relevant Data Sets . 18a. Benthic Macroinvertebrates/Phytophilous Macroinvertebrates . . 18b. Fish . . . . . . . . . . . . . . . . . . . . . . . . . . . . . . . . . . . . . . . . . . . . . . 19c. Birds . . . . . . . . . . . . . . . . . . . . . . . . . . . . . . . . . . . . . . . . . . . . . 20
2. The Site Does Not Extend Below the Federal Dam at Troy . . . . . . . . . . 22B. Contaminants of Concern (Section 2.2) . . . . . . . . . . . . . . . . . . . . . . . . . . . . . . 23C. Site Conceptual Model (Section 2.4) . . . . . . . . . . . . . . . . . . . . . . . . . . . . . . . . 24D. Receptors (Section 2.6) . . . . . . . . . . . . . . . . . . . . . . . . . . . . . . . . . . . . . . . . . . 25
V. Exposure Assessment (Section 3 ) . . . . . . . . . . . . . . . . . . . . . . . . . . . . . . . . . . . . . . . . . 26A. Exposure Pathways (Section 3.1) . . . . . . . . . . . . . . . . . . . . . . . . . . . . . . . . . . . 26
1. Fish . . . . . . . . . . . . . . . . . . . . . . . . . . . . . . . . . . . . . . . . . . . . . . . . . . . . 262. Birds . . . . . . . . . . . . . . . . . . . . . . . . . . . . . . . . . . . . . . . . . . . . . . . . . . . 263. Mammals . . . . . . . . . . . . . . . . . . . . . . . . . . . . . . . . . . . . . . . . . . . . . . . 27
B. Quantification of PCB Fate and Transport (Section 3.2) . . . . . . . . . . . . . . . . . . 281. The ERA Should Rely Exclusively on Time-Variable, Mechanistic Models
Such as GE's . . . . . . . . . . . . . . . . . . . . . . . . . . . . . . . . . . . . . . . . . . . . . 282. EPA Should Not Hold Initial Concentrations Steady Over an Extended
Period . . . . . . . . . . . . . . . . . . . . . . . . . . . . . . . . . . . . . . . . . . . . . . . . . . 30C. Observed Exposure Concentrations (Section 3.3) . . . . . . . . . . . . . . . . . . . . . . . . 30
1. Benthic Invertebrates . . . . . . . . . . . . . . . . . . .'.". . . . . . . . . . . . . . . . . . 312. Fish. . . . . . . . . . . . . . . . . . . . . . . . . . . . . . . . . . . . . . . . . . . . . . . . . . . . 313. Birds . . . . . . . . . . . . . . . . . . . . . . . . . . . . . . . . . . . . . . . . . . . . . . . . . . . 31
30102*7

D. Modeled Exposure Concentrations (Section 3.4) . . . . . . . . . . . . . . . . . . . . . . . 32
VI. Effects Assessment (Section 4 ) . . . . . . . . . . . . . . . . . . . . . . . . . . . . . . . . . . . . . . . . . . . 35
VII. Risk Characterization (Section 5) . . . . . . . . . . . . . . . . . . . . . . . . . . . . . . . . . . . . . . . . . 35
VIII. Uncertainty (Section 6) . . . . . . . . . . . . . . . . . . . . . . . . . . . . . . . . . . . . . . . . . . . . . . . . 38
DC. Conclusion . . . . . . . . . . . . . . . . . . . . . . . . . . . . . . . . . . . . . . . . . . . . . . . . . . . . . . . . . . 39
301028

I. Introduction and Executive Summary
The General Electric Company ("GE") is pleased to submit these comments on the
"Hudson River PCBs Reassessment RI/FS Phase 2 Ecological Risk Assessment Scope of Work"
("SOW").
The purpose of conducting an ecological risk assessment ("ERA") under
Superfund is to aid in making a decision on the appropriate remedial course of action. To be
useful in remedial decision-making, an ERA needs to be focused on the conditions at the
Superfund site in question and to have substantial certainty associated with its predictions. These
benchmarks must be met if the risk manager is to be able to use the risk assessment to project
with reasonable specificity the ecological changes that will be accomplished by various remedial
actions.
In the case of the Hudson River PCBs Superfund site ("Site"), the chemical of
concern to EPA entered the river beginning approximately 50 years ago. Direct discharges from
the manufacturing processes ceased approximately 20 years ago. For some period since, there
have been seeps of PCBs entering the river. These have now been reduced to quite low levels.
Given the persistence of PCBs, often in dechlorinated form, these simple facts provide the
opportunity for an analysis of the ecological effects of PCBs on a large scale: Over 50 years and
40 miles of river, what impacts, if any, have PCBs had on the populations of benthic invertebrates,
fish, birds, and mammals in the River and the adjacent land?
Unfortunately, EPA has failed to take advantage of this opportunity. Apart from a
limited study of benthic invertebrates, the Agency elected not to collect data on the biota of the•.
Hudson and its shoreline in order to examine effects, if any, of PCBs on wild populations.
1
301029
Consequently, it will now be very difficult, if at all possible, for EPA to conduct an ERA that will
be useful in selecting a remedial action.
The course that EPA sets out in the SOW is largely a screening-level analysis.
Possible concentrations of PCBs in various receptor species will be deduced by "modeling" the
dose or body burden that the animals receive, and those values will be compared to PCB levels
reported in the literature as associated with some effect in individuals of the receptor species.
With the exception of benthic invertebrate community analysis, EPA has not proposed any
analysis of effects on populations or communities. The only site-specific information to be used is
the concentration of PCBs in the water column, the river sediments and a limited selection of
biota. This type of analysis can tell one whether there is a basis for further investigation and
analysis; it cannot be used to determine whether unacceptable impacts are occurring or are likely
to occur. In other words, while the proposed analysis may be useful for generating risk
hypotheses, it does not adequately test the hypotheses. Real data on ecological health are needed
for that.
The fundamental limitation of the proposed analyses is their inherent uncertainty.
First, there is little or no measurement cf the actual exposure of biota at the Site. Second, there is
no method to extrapolate from predicted effects in individuals to determine whether the
sustainability of the population is affected. Third, there is no critical analysis of the literature to
determine whether and how particular studies should be employed at the Site.
It is unfortunate that these obstacles were not overcome by data collection and
analysis at the Site over the more than 15 years that EPA has been assessing the Upper Hudson
River. These unfortunate circumstances lead to two important results~in the present ERA:
301030
• Substantial effort must be made to limit and narrow the uncertainty in the riskassessment, including the obvious task of testing the postulated risk; and
• The degree of uncertainty at the end of the assessment will probably be large;consequently, the final uncertainty of the results must be quantified where possibleand otherwise stated candidly so that the risk manager and the public understandthe likelihood of obtaining any particular ecological change as a result of aparticular remedial action.
At a Superfund site the size of the Hudson Site, EPA will presumably be
examining to what extent, if any, a remedial course of action can or will affect the sustainability of
the wild populations which are examined. At least five actions will be necessary to narrow and
limit the uncertainty of the risk assessment:
First, the exposure of animals to PCBs from the Hudson must be rigorouslyanalyzed, using site-specific information where possible, and theuncertainty of estimated exposure must be quantified.
• Second, the literature studies relied on in the assessment must be criticallyexamined. What is the uncertainty in extrapolating from one species toanother? What is known of the dose/response relationship? Was the studyconducted correctly? Where use of a study introduces uncertainty to theanalysis, it must be quantified.
*
• Third, the relationship of effects on individuals to effects on the dynamics of thepopulation must be explicated, taking into account the density-dependent responseof the population. Once again, uncertainty must be recognized explicitly.
• Fourth, the existing data on the biota of the Hudson and its shorelines mustbe examined to assure that any projections of the risk assessment areconsistent with the facts. A similar comparison must be made to the peer-reviewed literature.
• Fifth, in order to determine whether the reduction of PCBs in the watercolumn or sediments will have an effect on the exposed biota, effects ofother organic chemicals and metals must be examined. Obviously,chemicals other than PCBs as well as other stressors, affect the biota of theHudson. If those effects are not understood, it is not possible to tellwhether remediation of PCBs will have the desired beneficial effects.
301031

These five steps need to be applied to the assessment of the effects of PCBs not
only at the present levels found in the water column and the sediments but also at those future
levels which will occur under "no action" or other remedial courses. The element of time is
important; a central issue for the Agency is to determine how much a particular remedial action
will accelerate the time at which a particular population-level effect will cease.
At the conclusion of this exercise, the Agency must set out the uncertainty
associated with its estimates of how the sustainability of populations of the Hudson will be
changed by specific remedial actions, so that the risk manager and the public can determine the
level of confidence to place in the predictions of the ERA in deciding on a remedial course of
action.
301032

IL The Proposed Ecological Risk Assessment Will Not Provide Sufficient Informationfor Remedial Decision-making
To be useful to a decision-maker, the baseline ERA at a Superfund site must
provide reliable information that is not subject to unreasonable uncertainty. EPA (1998a) states
that risks must be "characterized in terms of magnitude, severity, and spatial and temporal
distribution of effects." The SOWs proposal for the ERA at this Site fails this basic test. The
approach set out in the SOW is to use a very limited set of site-specific data in conjunction with
models to estimate both the ingested dose of PCBs by receptors in the Hudson River and the PCB
body burdens of these biota. These exposure estimates will then be compared to literature-
derived "toxicity reference values" ("TRVs") to develop a "toxicity quotient" ("TQ").
Alternatively PCB concentrations in water and sediment will be compared directly to generic
ambient water criteria or sediment values. Under this method, either concentrations in
environmental media that exceed regulatory criteria or values or a computed TQ which is greater
than one will be deemed to identify unacceptable risk to individual organisms. The substantial*
uncertainty that this method incorporates, combined with its inability to provide quantitative
information about risks to biological communities or populations, makes it inadequate for a
baseline ERA for a site the size and complexity of the Hudson River PCBs Superfund site.
Consequently, the information generated by the planned ERA will be of little assistance to the
Agency's decision about appropriate remedies for the site. With no reasonably certain estimate of
the true risks that PCBs in the Hudson River pose to biological communities or populations, the
Agency will not be able to discern whether risk reduction measures are necessary and, if so, to
301033

what extent any remedial alternative would reduce those risks to acceptable levels faster than
would occur under the no-action scenario.
EPA could have planned to conduct a better and more useful ERA for the Site.
The Agency, other federal and state government agencies, and numerous independent scientists
have been studying the presence and effects of PCBs in the Hudson River for more than two
decades. In 1990, EPA announced that it would reassess its 1984 Record of Decision for the
Site. The initial step in this reassessment was to collect and summarize existing information about
the Site and determine what additional data were needed to complete the reassessment. The 1991
Phase 1 Report for the Site contained this initial summary, including the results of a screening-
level ERA for the Site, which concluded that a "comprehensive ecological risk assessment,
including population, community and ecosystem interactions in response to PCB exposure, is not
possible with available data" (EPA 1991). Despite this acknowledgment, the only new
information EPA proposed to collect to support the baseline ERA was some limited data on
macroinvertebrate communities in the upper Hudson (EPA 1992). EPA chose not to collect
additional data about the health and abundance offish, birds, mammals or other species of
interest, and the SOW makes clear that the Agency does not intend to consider the substantial real
world data that can provide additional insight into these issues.
Instead, the Agency is proposing to perform a perfunctory ERA that is more
appropriate for a 5-acre landfill than for a 40-mile reach of river. This is wholly inadequate for
several reasons.
Several of the methods set out in the SOW are not intended for use in a baseline
risk assessment. Comparison of PCB concentrations in water and sediments to regulatory or
6
301034

guidance criteria, such as ambient water criteria or generic sediment guidelines, is a screening
technique intended to provide a quick indication of the potential ecological risk (EPA 1997). The
screening informs the risk assessor whether additional investigation is warranted but does not
provide a conclusion that ecological risk actually exists. Indeed, this was the method primarily
employed in the Phase 1 Report, and repeating it now will not provide additional knowledge of
actual ecological risk. The SOW, nevertheless, proposes to rely on such screening-level analyses.
Even where the Agency intends to go beyond this screening-level examination, the
information and analyses to be generated will be of little use in remedial decision-making because
they will be subject to substantial uncertainty. This uncertainty results from several aspects of the
Agency's approach. First, having collected little data on PCB concentrations in biota, the SOW
proposes to rely primarily on modeling both ingested doses and body burdens. There are little or
no data against which to validate and calibrate the results of such models, leaving the risk
assessment with an unknown level of uncertainty. The SOW, moreover, indicates that the Agency
does not intend to consider the majority of the available data on the health and abundance of
biota, including selected receptors, which provide a critical line of evidence and to which the
model results must be compared.EG-2Second, the SOW proposes to compare the uncertain results of modeling to
uncertain TRVs derived from the lab or other ecological settings which may bear little
resemblance to the Hudson. In many instances, TRVs may not exist for the endpoints or species
being examined, or the TRVs may be insufficient for conclusive risk analyses. This leads to
further uncertainty when these results must be extrapolated to relevant endpoints or species of
concern.
7301035

EG-3Third, the assessment endpoints set out in the SOW identify only individual-level
risks, such as survival or reproduction. As a result, the uncertainty of the models and TRVs is
compounded by the uncertainty of translating the analysis of individual-level risks to community
or population-level risks. What makes this problem worse, is that the full extent of this
uncertainty cannot be quantified. One can have little confidence in an analysis that is subject to
unquantifiable and unknown uncertainty. 'EG-4
An additional shortcoming of the proposed ERA is that it will to consider the risks
associated with other stressors, such as contaminants other than PCBs and human disturbances to
the ecosystem. An analysis that focuses solely on PCBs will not place those risks in the context of
the overall stresses on the ecosystem. Without an assessment of the relative risks associated with
PCBs, EPA will not be able to determine whether remedial actions focused on PCBs will actually
be beneficial to the ecosystem. In other words, the ERA will provide no information to allow the
decision-maker to assess whether the reduction of PCBs in the Hudson River will produce any
tangible benefits to the ecosystem.
Accordingly, the proposed ERA will be of little assistance to the remedial decision-
makers. The substantial uncertainty associated with the proposed approach, the failure to assess
population or community risks from PCBs, and the inability to place such risks in the context of
other stressors limit the utility of the information to be derived from the ERA. In fact, the ERA
will primarily be useful in demonstrating that-there is no risk to certain receptors from the present
concentrations and mass of PCBs. As a result, EPA has two choices if it decides to proceed with
an ERA of the type set out in the SOW. The Agency can examine the screening-level results, and
where the potential for risk is indicated, can set out to collect site-specific effects data.
8
301036
Alternatively, without sufficient data to test the risk hypotheses, the Agency must candidly
recognize the substantial uncertainty and very limited usefulness of the ERA in its remedial
decision-making.
301037

ITI. The SOW Lacks a Clear Statement of the Objectives and Description of Assessmentand Measurement Endpoints
A. The ERA Needs a Clear Statement of Objectives EG-5
Perhaps the most important element of the risk assessment is defining its
objectives — a related set of questions which it is intended to answer. The structure, scope and
details of the ERA depend on and flow from clearly defined objectives. Without such goals, one
is unable to determine what endpoints should be assessed and what measurements should be
made. In other words, one needs first to develop a set of hypotheses in the context of what is
known about the Site before determining the analyses and data required to test those hypotheses.
As the SOW explains, the overall objective of the ecological risk assessment is to
aid in the reassessment of the 1984 Record of Decision (SOW at 12). This, in turn, depends on
an understanding of whether PCBs in the upper Hudson constrain "the ability of populations
and/or communities to sustain themselves at or near" the Site (EPA 1998a). The SOW, however,
does not present any questions whose answers will provide information relevant to this issue. We•
recommend focusing the ERA to answer the following questions:
• Are PCBs currently adversely affecting biological community structure or thepopulation dynamics of tne key receptors?
• If so, when will PCBs no longer adversely affect biological community structure orpopulation dynamics under No Action?
If so, to what degree will remediation reduce the time to reach the point at whichPCBs are no longer adversely affecting biological community structure orpopulation dynamics in comparison to No Action?
These questions provide a basis for deriving assessment endpoints that can be used to determine
whether biological communities or populations are at risk and, if so, whether PCBs are causing
10
301038

those risks. These objectives, moreover, permit the selection of measurement endpoints with
relevance to those assessment endpoints.
B. The Assessment Endpoints Should Focus on the Sustainabilitv of Biological EG-6Communities or Populations
An assessment endpoint is a valued characteristic of an ecological receptor that
may be affected by exposure to a stressor (Suter 1990). Assessment endpoints are explicit
expressions of the actual environmental value to be protected (EPA 1997; 1998b). That is,
assessment endpoints are the specific ecological values or characteristics of the selected receptors,
the risks to which are quantified by the risk assessment. They usually consist of an entity
(population, community, or habitat) and a property (population number, rate of growth,
community structure). They are designed to provide answers to the defined objectives for the
ERA.
Suter (1990) has suggested criteria for evaluating potential assessment endpoints:
unambiguous operational definition; accessibility to prediction and measurement; susceptibility;
biological relevance; and societal relevance. As EPA (1998a) states, the "goal of the Superfund
program is to maintain and ensure self-sustaining populations/communities." Therefore, in the
context of the Hudson River, the appropriate assessment endpoint is the sustainability of
communities or populations native to the Upper Hudson River. EG-7C. The Measurement Endpoints Should Provide Information Relevant to the
Assessment Endpoints and Should Go Beyond the Approaches Described in theSOW
Measurement endpoints are measurable responses to a stressor that are related to
the assessment endpoints (Suter 1990; 1993). Relationships between the measurement endpoints
11
301039

and assessment endpoints enable the risk assessor to use the results of field observations,
bioassays, and literature reviews to decide whether a risk of harm has resulted or is likely to result
from the stressors. While using a measurement endpoint to approximate or estimate the effects
on an assessment endpoint introduces uncertainty into the assessment, that uncertainty will be
minimized by selecting measurement endpoints that are closely related to the selected assessment
endpoints and by developing multiple lines of evidence.
There are several different types of measurement endpoints, including
benchmarks, literature-based TRVs, direct measures obtained through field surveys or toxicity
tests, and biomarkers. To match a measurement approach with a given receptor and assessment
endpoint, one must consider several aspects of the measurement endpoints, including: technical
feasibility; strength of association with the assessment endpoint; specificity of the measured effect
to the chemical, receptor and site of interest; and representativeness of the various measurement
approaches.
Unfortunately, the measurement endpoints proposed in the SOW are focused on
individual-level effects, such as survival, growth, and reproduction, and no method is suggested to
translate these results to community or population-level responses. Indeed, the SOW
acknowledges that, although the methods it intends to use characterize risk at the individual level,
"if risks are present at the individual level, they may or may not be important at the population
level." For example, the SOW identifies survival, growth and reproduction as assessment
endpoints for fish and invertebrates. While these may appear to relate to macroinvertebrate
communities and fish populations, they only reflect effects on individuals. Abundance,
persistence, diversity, and trophic structure are population or community level endpoints. The
12301040

SOW does not include any method for linking changes in survival, growth or reproduction in
individuals to changes in population or community status. The ERA must establish measurement
endpoints aimed at ensuring the maintenance of sustainable populations and communities.
1. The Measurement Endpoints Described in the SOW Have SignificantLimitations
The measurement endpoints proposed in the SOW are primarily screening-level
endpoints in which PCB concentrations in water or sediments are compared to ambient water
quality criteria ("AWQC"), sediment quality values ("SQVs"), or TRVs. These approaches can
not constitute the primary measures of ecological risk in the baseline ERA for this Site.
Reliance on screening-level benchmark values, such as AWQCs and SQVs, in a
baseline ERA is both inconsistent with EPA guidance (EPA 1997) and redundant with the analysis
conducted in Phase 1. As the SOW notes, comparisons to AWQCs or SQVs merely indicate that
there is a "potential for risk" to aquatic organisms, including invertebrates, fish, and terrestrial
receptors, wetland community structure, and habitat value. The results do not provide a
quantitative estimate of risk to communities and populations. If the benchmarks are exceeded, it
simply indicates that further study is required. Moreover, EPA has already compared sediment
and water chemistry to defined benchmarks, including AWQC and generic sediment quality
guidelines, such as Long and Morgan (1991), in the Phase 1 investigation (EPA 1991). According
to EPA (1997), "requiring cleanup based solely on [a screening-level risk assessment] would not
be technically defensible."
The TQ technique set out in the SOW suffers from a number of similar problems.
Most important, because the proposed TQ approach typically focuses gh an individual organism,
13301041
it is appropriate only as a first step in the ERA. If this procedure predicts adverse effects on the
individual organism, further analysis is needed to assess effects at a higher level of organization.
Such additional work may involve obtaining more site-specific exposure information, probabilistic
TQ analyses, population-level modeling, or the collection of field data to attempt to verify the
predictions.
There are several additional weaknesses with TRVs and the TQ method:
Exceedance of a TRY (i. e., TQ> 1) does not indicate the magnitude of thepotential impact or its biological significance.
There are few published TRVs which correlate body burdens in the relevantspecies with the lexicological endpoints to be evaluated (survival, growth, andreproduction). Further, in the few cases where body burdens and toxic effects arereported both in a single study, the correlation between the two measurements iseither not reported or is weak.
• PCB body burdens can be reported in a variety of ways, such as on a whole bodybasis, on a lipid-normalized basis, or on an organ-specific basis. When bodyburdens are reported in the scientific literature, they usually are reported as tissuemeasurements for target organs (e.g., gonads, brain, liver), rather than for theentire body. Because bioaccumulation factors are rarely reported for those sametarget organs (bioaccumulation factors most often allow estimation of entire bodyburden), the ecological risk assessor is often left comparing "apples to oranges"when attempting to derive a TQ from a study which reports body burden ratherthan dose.
TRVs are generally based upon No Observed Adverse Effects Levels("NOAELs"). Appropriate use of TRVs based upon NOAELs depends on theability of the particular study to demonstrate a dose-response relationship. This, inturn, depends on the dose intervals, which is a factor of the a prioricharacterization of toxicity by the investigator. The variance of the observedeffects may inhibit the ability to distinguish a significant effect from a non-significant effect.
14301042

2. EPA Must Use Objective Criteria To Select TRVs
Because of their limitations, TRVs must be selected with care using objective
criteria. The SOW does not contain any such criteria, proposing instead to select "appropriate"
TRVs. While reliance on professional judgment is inevitable, there are more objective
considerations that should guide the selection of TRVs:
• Relevance of the endpoint and species measured. The use of studies with thesame measurement endpoints as those described in the SOW (i.e., survival, growthand reproduction) and the same species minimizes the need to extrapolate resultsand will decrease the conservatism and the uncertainty of estimated risk.
• Similarity of test species to receptor species, in terms of sensitivity. The SOWstates that TRVs will generally be derived from the most sensitive individual(based on species and age class). This adds unnecessary conservatism to the ERA.For example, much of the information on toxicity of PCBs to fish has beengenerated using, and reflects the unique sensitivity of, salmonid species. Becausethe proposed receptors are not salmonids, such studies can not be used to deriveTRVs for this Site.
Degree of chlorination of PCB mixture tested. The PCB mixture tested in theTRV study must be comparable to that found of the Hudson River or in the preythat are consumed by the receptor being evaluated.
Study duration. Chronic studies provide more relevant information for riskassessment than acute studies. The appropriate duration of the TRV study shouldbe determined by the toxicity test endpoint and the toxicokinetics of PCBs. Forexample, if the test endpoint is reproductive effects, the duration of the toxicitystudy should be the entire reproductive cycle of the tested species.
• Exposure pathway. Chronic studies with dietary exposures are the mostappropriate mimics of exposure for a receptor species in the field. Acute laboratorystudies with unnatural exposure scenarios, such as injection, cannot be used whenexposure is modeled on the basis of ingested doses.
• Use of measured vs. estimated responses. Only TRVs related to actual, measuredresponses by the test organism should be used.
• Nature of dose-response relationship. Unbounded NOAELs should not be used asTRVs. An unbounded NOAEL (a NOAEL for a species for which the lowest
15301043

observed adverse effect level has not been determined), provides little informationon the toxicity of the tested material.
• Overall study quality. Demonstration of a relationship between a tested chemicaland a toxicity endpoint depends on statistical significance and power. Thereshould be an absence of confounding factors, such as inadequate nutrition in sometest groups, and the control population must exhibit normal survival and health.
Only high quality, controlled studies that are consistent with other such studies can be used to
provide measurement endpoints.
3. The ERA Must Consider Additional Lines of Evidence
Given the limitations of the TQ approach, the SOW correctly proposes to consider
different lines of evidence (page 15). Several lines of evidence not listed in the SOW that should
be considered include:
• Benthic invertebrate community biomass, abundance, and diversity compared witha range of these parameters measured in comparable aquatic habitats in the region.
• Fish species abundance, diversity and richness compared with a range of theseparameters measured in comparable aquatic habitats in the region.
• Data on the abundance and reproduction of Hudson River birds, including treeswallows collected by the USFWS and nesting bald eagles on the Hudson River.
• Data on the abundance and reproduction of Hudson River mammals.
Each line of evidence is characterized by its own individual strengths and weaknesses; the purpose
of using more than one is to reduce uncertainty associated with the overall assessment.
In order to reconcile the different lines of evidence, the Agency must develop at
the outset an objective method for identifying and weighing their relative strengths. This method
should define specific attributes that will be used to judge the quality of each measurement
endpoint. Examples of such attributes (from Menzie et a/., 1996) includes strength of association
16301044

between the measurement endpoint and assessment endpoint; site-specificity; stressor-specificity;
quality of data and overall study; availability of an objective measure for assessing environmental
harm; sensitivity of the measurement endpoint for detecting changes; spatial representativeness;
temporal representativeness; quantitativeness; correlation of stressor to response; and use of a
standard method.
In short, a more sophisticated ERA than the approach set out in the SOW is
required for this Site. Such an assessment should not rely primarily upon comparisons with
benchmarks or TQs but should include site-specific informational and dose/response or
concentration/response relationships. Risk assessments based solely on chemistry, body burdens,
or model-derived doses are prone to excessive conservatism because the only readily identifiable
benchmarks are conservative ones. Consequently, modeled risk estimates must be verified by
field data.
17
301045
IV. Problem Formulation (Section 2\
We discussed our concerns with the assessment and measurement endpoints in the
previous section. We identify below some additional problems with the SOWs problem
formulation discussion.EG-8A. Site Characterization (Section 2.11
1. The SOW Does Not Acknowledge Significant and Relevant Data Sets
An important element of problem formulation is a detailed review and integration
of all available and relevant information concerning the Site. This is particularly important for the
type of ERA proposed in the SOW. Where the primary analytical method is the use of exposure
and bioaccumulation models and highly simplified risk models, compiling the available data,
whether limited or substantial, provides an important means for constraining model results. At
this Site, although the Agency has not collected much data for use in the ERA, there is a
substantial body of data collected by others, including GE, concerning the general ecological
conditions in the Hudson River. The Site Characterization section of the SOW fails to present
such a discussion. The Agency should use these data to validate its desktop analyses. We identify
and discuss some of the data sources below.
a. Benthic Macroinvertebrates/Phytophilous Macroinvertebrates
EPA's 1993 study of benthic macroinvertebrates (reported as part of its 1995
Database Report) shows that indices of macroinvertebrate community structure are not correlated
with PCB concentrations in sediments. NYSDEC's most recent report on macroinvertebrate
similarly concludes that there have been no community-level impacts in the Upper Hudson due to
PCBs: "High levels of PCBs have been found in the macroinvertebrate tissues downstream of Fort
18
301046
Edward since analysis began in 1976. . . . No impact at the community level has been observed
at any site that can be attributed to high PCB levels" (NYSDEC 1993).
More recent macroinvertebrate community data are available for the Thompson
Island Pool ("TIP") and Stillwater regions of the Hudson River. GE sponsored surveys of benthic
and phytophilous macroinvertebrates in these areas in September 1997. The mean total
invertebrate abundances ranged from approximately 8,000 invertebrates/m2 to 35,000
invertebrates/m2, with a maximum of 87,000 invertebrates/m2 at a vegetated station in the
southern end of the TIP (Exponent 1998). Total taxa richness of benthic macroinvertebrates
ranged from 33 to 58 invertebrate taxa depending on whether the habitat was vegetated or not
and which area was sampled. These results suggest that PCBs have not impaired benthic and
phytophilous macroinvertebrate communities in the TIP where concentrations of PCBs in
sediment are likely to be highest in the River,
b. Fish
There is a vast database offish abundance in the Lower Hudson River that
suggests that PCBs have not adversely affected relevant populations. While these data are not
directly applicable to the upper Hudson because of differences in species and the relatively lower
levels of PCBs in the lower river, they do support a conclusion that PCB levels comparable to
past and present levels in the lower Hudson are unlikely to affect fish abundance in the upper
river.1 Available information includes:
1 Although we explain in the next section that the ERA should not address risks from upper riverPCBs to lower river biota, these data provide useful and relevant information for the upper riverbiota.
19
301047

Data showing that PCBs have not impacted the abundance of shortnose sturgeon(Kynard 1997). Indeed, the most recent data demonstrate that the Hudson Rivershortnose sturgeon population is booming (NMFS 1997).
• Numerous studies have showed that the decline in the coastal striped basspopulation was not the result of Hudson River PCBs, but rather overfishing andwater quality conditions in the Chesapeake Bay (NMFS and USFWS 1985;ASMFC 1990) ("given the very healthy status of the Hudson River stock, which iswell documented to have relatively high tissue concentrations of PCBs, it wouldappear that such levels . .. may not pose a threat to striped bass from a populationbiology perspective"). Far from declining, the spawning stock of striped bass inthe Hudson River has shown remarkable growth.
NYSDEC and the utilities collect data each year on fish abundance in the lowerriver which reflect generally healthy fish populations unaffected by PCBs.
c. Birds
The ERA does not need to conduct an additional analysis of tree swallows. The
data presented in Secord and McCarty (1997) show that even high body burdens of PCBs have
not affected the reproductive success of tree swallows. Despite some significant deficiencies in
the study design (e.g., lack of suitable reference area), the data from this study support the
following conclusions:
Swallows which are maximally exposed to PCBs in the Hudson River have normalnumbers of young, and these young grow normally.
Evaluation of reproductive parameters relative to tissue residue data shows thattree swallows did not respond to PCBs in a dose-dependent manner. Hatchabilityand reproductive success were highest, and nest abandonment lowest, at sites withthe highest PCB concentrations in eggs and hatchlings.
• Reproductive success, nest abandonment, hatch rates, nest quality and plumagedevelopment observed in the experimental tree swallow populations nestingadjacent to the Hudson River were within the range of reference or unexposedpopulations.
20301048
This information shows that PCBs in the Hudson do not affect reproduction in, and thus do not
pose population-level risks to, tree swallows.
EPA should not extrapolate Secord's and McCarty's tree swallow data to bird
species which have different diets or experience different exposures to PCBs. These species may
also be affected by other stressors which have a more demonstrable impact on population
dynamics (e.g., lost habitat, human disturbances, other chemicals).
Other relevant information concerning birds that should be considered in the ERA
includes:
• Successful breeding by bald eagles in Hudson River habitats appears to beincreasing. There were two nesting pairs on the Hudson River in 1996. One pairdid not lay eggs; the other pair laid eggs which did not hatch. The cold, wetweather of that year is suspected to have caused the failure of these eagles toproduce young (NYSDEC 1997). In 1997, two nests were also present. Onejuvenile fledged from a nest in Greene County; the other nest was unsuccessful, asit was in 1996. In 1998, three pairs of bald eagles attempted to breed. All threepairs laid eggs. One attempt resulted in three fledged young, another pairproduced one fledgling and one unhatched egg, and the third nest had oneunhatched egg (Nye 1998).
•
• Data showing that bald eagles use the Hudson River during winter migration andare breeding successfully in Hudson River habitats. The mid-winter bald eaglesurvey shows an increase from 29 bald eagles using the Hudson River in the winterof 1979 - 1980 to 103 eagles in the winter of 1995 - 1996.
Data showing the increasing use of Hudson River habitats by peregrine falcons.Peregrine falcons have established nests on bridges over the Lower Hudson River.While these nests are producing live young, falcons have been injured or killed inaccidents with automobiles and from falling off nest sites before they are capableof full flight (Nye 1998).
Data showing that mallards are "demonstrably secure" throughout the New YorkBight watershed and are "widespread, abundant and secure in the state of NewYork" USFWS (1998). The NYSDEC (1997) reports that, on the basis ofbreeding surveys, the mallard population using the Hudson River estuary is "stableto increasing." Mid-winter counts of waterfowl show generally increasing
21
301049

numbers of mallards and other species with a peak in the 1995 survey of more than16,000 birds. (NYSDEC 1997).
2. The Site Does Not Extend Below the Federal Dam at Troy EG-9
Another error in the site characterization is its definition of the Site as the 200-
miles of river from Hudson Falls to the Battery in New York Harbor. As GE has previously
informed the Agency,2 the administrative record supporting the addition of the Site to the
National Priorities List ("NPL") limits the Site to the 40 miles above the Federal Dam at Troy.
EPA's post-rulemaking statements to the contrary cannot change this limitation. See U.S. v.
Asarco. Inc.. No. CV96-0122-N-EIL (D. Idaho Sep. 30, 1998) (post-rulemaking statements
cannot change scope and size of site from the description provided in the NPL record). GE's
disagreement with EPA on the scope of the Site is particularly important in the context of the
ERA, which is purporting to assess risks from PCBs to biota and habitats in the Lower River.
EPA's Feasibility Study Scope of Work makes it clear that EPA is limiting its analysis to potential
remedial actions in the upper river. Assessing ecological risks in the lower river, however,*
suggests that the Agency may in fact be attempting to justify a remedial action on the basis of
benefits to the lower river.
As we have previously explained, the limitation of the Site to the upper river
means that the Agency cannot seek to justify any remedial action in the upper river on the basis of
benefits to the lower river. If the Agency attempts to do so, it would be obligated to investigate
and evaluate remedial alternatives, such as source control, in the lower river; consider the
additional sources of PCBs (and other contaminants and stressors) to fish and other biota in the
2 SfiS Nov. 6, 1997, letter from Angus Macbeth to Richard Caspe; May 5, 1998, letter fromAngus Macbeth to Douglas Fischer.
22301050

lower Hudson; and identify the much wider group of parties who rightfully should be classified as
PRPs. The presence of other dischargers of PCBs in the lower river is well known to EPA; the
Agency has conducted recent studies of PCB discharges into New York Harbor, including
sampling outfalls. The Agency made the importance of other contaminants plain in its 1984 ROD,
concluding "that detectable levels of dioxin, dibenzofurans, mercury and chlordane (from known
and unknown sources) have also been identified in Hudson River fish, and that even if PCBs
decrease to an acceptable level, the fishing bans would continue on the basis of these other types
of contaminants."
EPA cannot have it both ways. The Agency cannot describe the Site as
encompassing the 150 miles from Troy to the Battery and then address only one contaminant and
one or two PRPs outside that 150 miles as the sole subjects for remedial consideration. The
scope of EPA's Superrund activity at the Site is circumscribed by the characterization and
definition of the site which EPA promulgated in its NPL rulemaking years ago.
B. Contaminants of Concern CSection 2.2) . EG-10
The SOW proposes to limit the ERA's consideration to PCBs. There are other
chemical and physical stressors in and along the Hudson River, which also must be considered.
For example, sediment concentrations of cadmium, copper, lead, mercury and zinc measured in
the 1993 EPA survey in the Upper Hudson exceed NYSDEC sediment quality values. Fish
sampling in the upper Hudson reveals that fish there have DDE and DDT concentrations that
have been shown to impair bald eagle reproduction elsewhere (Anthony et al. 1993). Similarly, it
is likely that habitat loss and alteration, modification to landscape for agriculture and
23301051

urbanization, and recreational hunting and trapping have impacted wildlife populations and
communities in the Hudson River watershed.
The presence of other contaminants and stressors is important. EPA (1998b)
provides that ERAs should assess "an array of stressors that may be influencing the assessment
endpoints and describing the diversity of potential effects." In the limited instances where EPA
intends to consider site-specific data, such as benthic macroinvertebrates in the upper Hudson,
other contaminants and stressors may confound observations and/or have additive or antagonistic
interactions with PCBs. Even where the SOW proposes to rely primarily on exposure modeling
for its assessment, other stressors are relevant. Although exposure modeling avoids issues
associated with confounding stressors, it still is necessary and appropriate to place the estimated
risks associated with PCBs against the backdrop of other stressors. Unless other stressors are
considered, the remedial decision-maker will be unable to determine whether a remedial action
directed at PCBs will have any beneficial effect. The ERA should interpret any stresses to
ecological receptors that may be due to PCBs in the context of-all anthropogenic stresses to the
Hudson River. In essence, EPA must determine what the conditions in the Hudson would be but
for. PCBs.
C. Site Conceptual Model (Section 2A) EG-11
The site conceptual model has several problems. First, it identifies exposure
pathways, but neglects environmental fate processes such as burial and dechlorination that act to
reduce exposure over time. Second, it fails to include other stresses on the Hudson River
ecosystem, including other chemicals, conventional water-quality degradation and other human
impacts. Third, the conceptual model diagram (Figure 5) ignores aquatic vegetation, which is an
24301052

important component of the aquatic food web and which supports invertebrates that are important
for forage fish. This is important because the potential impacts of remediation activities on
aquatic vegetation and therefore on the ecosystem as a whole must be considered.
D. Receptors (Section 26) EG-12
EPA should take into account the following points on the receptors identified in
the SOW:
• The feeding habits and habitat use of smallmouth bass, which are listed as areceptor in Table 1, are similar to those of largemouth bass. Analysis ofsmallmouth bass as a receptor is therefore redundant and unnecessary.
• Some of the threatened and endangered species listed do not use the habitats of theHudson River. For example, the whorled pogonia is an orchid which grows inhighly acidic, peat-like soils characteristic of bogs, not riparian wetlands; northernharrier is not closely linked to aquatic habitats but forages for mammals overmeadows and older wetlands. Therefore, these species should not be considered inthe ERA.
• Striped bass and shortnose sturgeon do not occur in the Upper Hudson River andare therefore not appropriate as receptors for this ERA.
25301053

V. Exposure Assessment (Section 3) EG-13
A. Exposure Pathways (Section 3.1)
The SOW contains several errors and inconsistencies in its description of exposure
pathways. In many instances, the SOW does not consider all the available site-specific and
species-specific information that can reduce uncertainty and improve exposure estimates.
1. Eish
The SOW is inconsistent and incorrect in its characterization offish diets. Site-
specific, empirical information on fish diets is available (e.g., Exponent 1998) and should be used
as the basis for determining the relative proportions of different prey in the diets offish.
2. Birds
As noted above, there is no need to conduct further assessments of tree swallows
because Secord and McCarty (1997) shows that PCBs in the Hudson are not affecting tree
swallow reproduction. In any event, the SOW incorrectly states that worms are consumed by tree
swallows. Most studies of tree swallow diets report that insects make up the majority of the tree
swallow diet (e.g., McCarty 1995) and that tree swallows also rely on plant materials, particularly
during winter (Robinson 1992). Secord and McCarty (1997) also contains information on the
concentrations of PCBs in tree swallows for 1994, and the authors have similar data for 1995 and
1998. EPA should use this site-specific data.
Empirical, site specific information on the diets of bald eagles is also available.
Peter Nye of NYSDEC has found remains of grebes, eels, pickerel, bullhead, herring and carp in
eagle nests. Information on the PCB concentrations in some of these prey, including bullhead and
eels, are available (Secor 1998). Moreover, NYSDEC has collected samples of the blood of
26
301054

juvenile eagles, eagle eggs, and the remains of prey in nests from the eagles breeding on the
Hudson River. Samples are being stored for analysis of organochlorines. EPA should work with
NYSDEC to determine actual PCB concentrations in the samples of bird tissue and their prey.
3. Mammals
The SOW characterizes the diet of raccoons and mink incorrectly. Both species
consume a variety of foods. The diet of mink includes mammals, birds, and amphibians, and the
raccoon diet includes terrestrial insects and plant material. EPA should use the references cited in
the EPA Wildlife Exposure Factors Handbook (EPA 1993) to estimate the relative importance of
each prey type in the diets of mammalian receptors and develop exposure models accordingly.
EPA must also consider the specific use of Hudson River habitats by these receptors and weight
exposures accordingly. For example, mink or raccoons may favor small streams and wetlands for
foraging over the main stem Hudson River.
27301055
EG-14B. Quantification of PCB Fate and Transport (Section 3.2)
1. The ERA Should Rely Exclusively on Time-Variable, Mechanistic ModelsSuch as GE's
The SOW describes EPA's plan to use the fate, transport and bioaccumulation
models and geochemical analyses presented in the DEIR/PMCR in the ERA. These models are
critical components of the reassessment, especially with regard to risk prediction under alternative
remedial scenarios. GE has previously submitted comments on these documents, identifying a
number of serious problems (GE 1996, 1997). The peer review group convened to review the
PMCR echoed many of GE's concerns. EPA must address the recommendations of GE and the
peer review group before using the models in the ERA.
GE has developed an Upper Hudson River sediment transport model that is
mechanistic and uses data-based formulations to describe resuspension and deposition processes
realistically. This model has been rigorously calibrated and validated and should be considered for
use in the fate and transport modeling.
Appendix A to the SOW describes how the Agency intends to use the different
bioaccumulation models for the Site: the Bivariate Statistical Model ("BSM," used to compute
average PCB levels), the Probabilistic Food Chain Model ("PFCM," used to compute average
levels and variability), the Gobas Model, and the time-variable, mechanistic bioaccumulation
model developed by QEA for GE. As GE has explained previously (and as the peer review panel
confirmed), EPA should not rely on the two steady-state statistical models in the reassessment
because they do not provide an appropriate basis for predicting average PCB levels in the Upper
Hudson River.
28
301056

While it generally is good scientific practice to check for consistency among
different approaches to a given problem, this is true only insofar as the approaches are developed
properly and (at least to some degree) independently and add useful information. As described in
GE's original comments concerning the PMCR, there are serious limitations to the BSM and
PFCM approaches that limit their utility:
• The Hudson River has exhibited extreme variation in exposure levels as well aslipid content offish. PCB levels in the food web do not respond immediately tochanges in these parameters, so PCB levels measured in fish at any point in timemay be in the process of responding to changes in exposure levels. That is, thesteady state assumption in the BSM and PFCM is violated.
The BSM has no predictive power within the Thompson Island Pool, based on theobservation that there is no relationship between observed and computedlargemouth bass Aroclor 1254 levels (Figure 9-12 of the PMCR). The pattern ofobserved vs. BSM predicted values differs among reaches. Without further studyinto the mechanisms underlying bioaccumulation, it is not clear why thebioaccumulation model should differ in its predictions among reaches. Finally, theBSM overpredicts at low concentrations (Figure 9-12). PCB levels are nowdeclining in the Hudson River. Thus, it is anticipated that model predictions willoverestimate the PCB levels in biota in the future.
• The PFCM confuses uncertainty with variability. For example, the computeddistribution of biota-sediment bioaccumulation factors ("BSAFs") should provide arepresentation of the distribution of invertebrate PCB levels as seen by the fish.The BSAF distribution used in the PFCM was determined directly from the data,even though the variance in the data is due in large part not to the true variabilityin the sediment/invertebrate relationship, but to uncertainty. This uncertainty is aresult of the sediment and invertebrate samples not being collected at exactly thesame location, because the species composition of the samples may not be thesame as the species composition of the diet of the forage fish, and because ofanalytic uncertainty. Because of this confusion, the resulting distribution of BSAFvalues has no physical meaning.
• The PFCM requires the answer to solve the problem. The predator/forage fishbioaccumulation factor ("PFBAF") was determined using the observed distributionof predator PCB levels. However, the whole purpose of the model is to computethe distribution of predator PCB levels. Similarly, the parameters that determinethe spread, or variance, of the computed PCB levels are constants that are
29301057
validated by comparison with the distribution of the data. The computed spreadand shape of each distribution will not change in the future, even as averagesediment and water column PCB levels decline. The model provides no additionalinformation beyond what the data already provide.
In contrast, a mechanistic model avoids these problems and incorporates all of the
information that is in the steady state models (that is, measured PCB levels, dietary information),
as well as ancillary information (bioenergetics, toxicokinetics, and time-variable processes) in
computing average PCB levels. Therefore, EPA should use a time-variable mechanistic model to
compute average levels, such as the one developed by QEA for GE. The distributions of PCB
levels should be estimated directly from the data.
2. EPA Should Not Hold Initial Concentrations Steady Over an ExtendedPeriod
The SOW states that the exposure model parameters will be assumed to remain
constant for extended periods of time (e.g., 5-10 years). No justification for this approach is
provided, and given the observed declines in PCB concentrations in sediment, water and biota,
this assumption runs counter to the available evidence. Initial .concentrations should not be
assumed to hold steady over five-to ten-year increments. Time-variable fate, transport and
bioaccumulation models, like GE's, should be used to generate this information.
C. Observed Exposure Concentrations (Section 3.3^ EG-15
The SOW proposes to characterize exposures and body burdens based on 95
percent upper confidence limits on averages, an approach that will result in a conservative
estimate of actual Site conditions. Although this approach might be appropriate for a screening-
level assessment, the ERA is a baseline risk assessment. The ERA should use mean exposure
levels with appropriate quantification of uncertainty.
30
301058

The traditional measure of uncertainty (mean +/- too^i x standard error) is not the
most appropriate for all data sets. The best measure depends on the shape of the distribution of
the data (e.g., normal, lognormal). The ERA should consider other techniques including Land's
method for lognormal populations and nonparametric bootstrap methods.
1. Benthic Invertebrates
EPA has collected data on benthic invertebrate communities and PCB body
burdens at a number of stations in the Upper Hudson River. According to the SOW, the ERA
will use these data to calculate site-specific biota-sediment accumulation factors for use in food-
chain modeling. BSAF values should be used along with sediment PCB data to estimate
invertebrate PCB levels. Because of the potentially large uncertainties associated with field
measurements of benthic invertebrate BSAFs, the ERA should compare the site-specific values
with other field and lab measurements for consistency.
2. FJah
It is not clear whether or to what extent the ERA will use the significant data on
PCB concentrations in fish collected by NYSDEC, GE, and others. To the extent they are
available and valid, the ERA should use all the site-specific data on fish body burdens to calibrate
and validate the models.
3. Birds
The approach to be used to assess exposures to insectivorous birds is not clearly
described. According to the SOW, data collected by the USFWS will be used to evaluate tree
swallow body burdens "for those locations at which data are available." What approach will the
ERA use for other locations? If the ERA uses BSAFs, what specific diet assumptions will the
31
301059
Agency employ? Employing unvalidated assumptions will create substantial uncertainty in the
ERA.
D. Modeled Exposure Concentrations (Section 3.4^ EG-16
Given the failure to collect data to support its ERA, the Agency is left to rely
primarily on modeling approaches to determine PCB concentrations in biota. Without sufficient
data for validation and calibration, modeling compounds uncertainty and often leads to
unnecessary conservatism. This is particularly true for the modeling proposed to support the
ERA. If models are used, the Agency must use the available data to develop and then calibrate
and validate them.
First, in the case of the Hudson River, outside of the substantial database on PCB
concentrations in fish, there are few data against which to calibrate and validate the proposed
models. Where data could readily be developed, as for PCB concentrations in the eggs of eagles,
EPA has chosen to ignore the relevant information. Without validation, the level of certainty in
the results is unknown.
Second, the SOW provides a general model to describe ingested dose,3 but does
not explain how the ERA will translate such doses to body burdens. For example, the SOW
refers to assimilation and metabolic efficiency terms, stating that dose (meaning exposure) will be
expressed as a body residue or as an ingested dose rate, depending on the TRY. The SOW does
not provide a model for determining bird and mammal bioaccumulation, examples of assimilation
3 The ERA presents two ingestion exposure algorithms for birds and mammals: one for water andone for food. The units for the ingestion rate term (IRj in the equation on p. 33) should be kg wetweight/day. The units for concentration of PCBs in food items (Q should specify thatconcentration is expressed on a wet weight basis.
32301060

and metabolic efficiency terms, or data to support such terms. Similarly, the ERA states that
biomagnification factors ("BMFs") may be used to predict concentrations of PCBs in eggs of
piscivorous birds. With the exception of bald eagles, there are limited data to support the
development of BMFs for piscivorous birds. This is particularly inappropriate because, for most
of the bird and mammal receptors, the toxicity database provides TRVs in terms of ingested dose,
not body burden. Compounding uncertainty by extrapolation of a modeled ingestion rate to a
body burden, only to compare body burdens to the limited TRVs available for this endpoint,
cannot be justified, and will lessen the value of the risk assessment for decision-makers.
Turning to the specific inputs to the models, it is important to understand and
assess the relative proportions of different prey items in the diet in order to determine the proper
dose. For example, Salyer and Langler (1949) and Davis (1980) report that more than 75 percent
of the kingfisher's diet is comprised of cyprinid species, with crayfish comprising another thirteen
percent of the diet. Additional foods, such as lizards, frogs, small snakes, salamanders, insects,
small mammals, young birds and berries, have been reported in. the literature. Landum et al.
(1993) and Kaufman (1996). The ingestion models must also incorporate the correct size of
consumed prey species. Inclusion of larger prey, which may have higher PCB body burdens,
would overestimate exposure through the diet. This type of information and site-specific PCBs in
prey are needed to construct a food-web model that is truly representative for the Hudson River.
Similarly, the SOW states that PCB concentrations in benthic invertebrates will be
averaged using all samples to obtain exposure point concentrations ("EPCs") for fish. It is more
appropriate to estimate average BSAFs and then multiply this result by average surface sediment
PCB concentrations because surface sediment PCB levels vary considerably over long and short
33

spatial scales. Therefore, PCB levels measured in a few locations are not necessarily
representative of pool-wide surface sediment concentrations.
34
301062

VI. Effects Assessment (Section 4) EG-17
The SOW proposes two different approaches for estimating the toxicity of PCBs:
(1) using total PCBs and Aroclor toxicities and (2) using congener-specific toxicities and toxic
equivalency factors ("TEF"). There are many factors which favor the use of total PCBs or
Aroclor-based concentrations at this Site. First, most of the data for the Hudson River are
presented in total or Aroclor-based concentrations. The available capillary column data do not
quantify many of the congeners relevant to a TEF analysis. Using Aroclor or total PCB-based
effects data are preferable to estimating congener compositions of aged Aroclor mixtures (with
attendant problems of selective depletion and enrichment) and comparing the resulting toxic
equivalent ("TEQ") values to TEQ-based effects data.
Second, there are significant problems in using the TEF approach. While the TEF
approach has provided significantly improved understanding of the relative toxicities of different
PCB congeners and of the aggregate toxicity of PCB mixtures, its value for ecological risk
assessment is limited because the endpoints of TEF studies ace often cellular or biochemical
indicators. Benchmarks derived from these studies are even more conservative than screening
benchmarks derived from studies in which the endpoint is survival, growth, or reproduction.
As a result, GE recommends limiting the analysis to total or Aroclor-based
concentrations.
35
301063

VH. Risk Characterization (Section 51
As we have noted previously, use of the TQ approach as the only line of evidence
for certain receptors as described in the SOW is insufficient for a baseline ERA at a site the size
and scope of the Hudson River PCBs Superfund Site. One significant limitation of the TQ
method is that it only provides information about individual level effects. To be useful, these
results must be translated to effects at the community or population level.
The SOW presents a model which it claims achieves such a translation. Although
the model purports to be based on Suter's (1993) approach for characterizing population-level
risks, it, in fact, misrepresents Suter's work. As discussed in Chapter 8 of Suter (1993),
population-level risk assessments require, at a minimum, integration of lexicological information
with information on the survival rates and reproductive rates of the exposed population. The
model described in the SOW merely characterizes the distribution of exposures within a
population. No attempt is made to characterize actual changes in rates of survival, growth, or
reproduction. As long as the exposure distribution is being compared to a TRV, population-level
risk is not being addressed.
Moreover, the model will provide only the value of a normal cumulative
distribution function (the probability for a given value from a normal cumulative distribution) for
the standardized mean of the linear combination of two random variables. This is not the same as
estimating the probability that any given individual from one distribution is greater than any one
individual from the other distribution, as stated in the text. The model estimates the probability
that the average body burden is greater than the average TRV. This formula does not estimate
36
301064

the probability that the tissue chemical concentration of any given individual fish from a
population will exceed a TRY.
Chapter 8 of Suter (1993) discusses a range of methods for extrapolating
individual-level effects to population-level effects. The simplest approach is to (1) estimate dose
or exposure-response relationships for survival (by life stage) and reproduction, (2) calculate the
effects of exposure on the rates of survival and reproduction of the exposed species, and then (3)
translate changes in survival and reproduction into changes in the intrinsic rate of increase (r) of
the exposed population. This approach, however, is more suitable for comparative risk
assessments than for site-specific assessments because it does not consider the influence of
density-dependent processes that would be expected to partially offset PCB-related reductions in
survival or reproduction. Age-structured population models that incorporate density-dependence
are described in Chapter 8 of Suter (1998) and in Bamthouse et al. (1990). The time available to
EPA since the Preliminary Assessment would have been sufficient to collect site-specific data for
Hudson River fish populations for input into these types of models. Models developed using data
collected from comparable populations in other ecosystems could still be used, although the
uncertainty would be higher. Regardless, the results would be more meaningful than the TQ
approach proposed by EPA because they would address the actual magnitude of ecological
responses to PCB exposures, not just the absence or potential presence of a response.
37301065

VIE. Uncertainty (Section 6^ EG-19
The SOWs description of uncertainty includes (1) general categories of
uncertainty as described in EPA guidance and (2) methods for Monte Carlo analysis of exposure
models. It Ms to mention the greatest single source of uncertainty in the assessment, which is
the virtual absence of site-specific ecological data. The principal consequence of this absence is
that the assessment might be able to suggest risk to individuals, but it will be unable to shed light
on the magnitude of actual risks to communities or populations related to past, present or future
PCB exposures. In fact, the results of the proposed ERA will be so uncertain that they will be of
little use in the remedial analysis.EG-20
While it is true that sensitivity analysis is one approach to assessing uncertainty,
the example provided in the first paragraph of page 53 is not a true sensitivity analysis. Rather,
running the avian and mammalian models using the upper bound on the ingestion rate of a prey
item represents a Maximum Exposed Individual (MEI) evaluation. To conduct a sensitivity
analysis, the model would have to be repeatedly executed, each time varying one parameter by the
same degree (e.g., +/- 10%) while holding all other parameters constant. Once all parameters
have been varied, the effects on the model output can be compared in order to draw conclusions
regarding the relative sensitivity of the model to the different parameters and the relative
uncertainty associated with each parameter.
38301066
EX. Conclusion
The ERA proposed in the SOW has a number of significant deficiencies. The basic
approach is to conduct screening-type or TQ analyses that are subject to substantial uncertainty.
The result will be a highly uncertain estimate of risks to individuals; no information will be
provided to address the critical assessment endpoint of sustainabllity of biological communities or
populations. In these circumstances, EPA can not place substantial reliance on the ERA in its
remedial decision-making.
39301067
REFERENCES
Anthony, et al. 1993. Environmental contaminants in Bald Eagles in the Columbia River Estuary.J. Wildlife Management 57:10-19.
Atlantic States Marine Fisheries Commission. 1990. Source Document for the Supplement to theStriped Bass FMP, Amendment #4. Appear. 1956.
Barnthouse, L.W., G.W. Suter n, and A.E. Rosen. 1990. Risks of toxic contaminants toexploited fish populations: influence of life history, data uncertainty, and exploitation intensity.Environmental Toxicology and Chemistry 9:297-312.
Davis, WJ. 1980. The belted kingisher, Megaceryle alcyon: Its ecology and territoriality. M.S.Thesis, University of Cincinnati, Cincinnati, Ohio.
Environmental Protection Agency. 1991. Phase 1 Report - Review Copy InterimCharacterization and Evaluation, Hudson River PCBs Reassessment RI/FS. Volume 1. EPA No.013-2N84. U.S. Environmental Protection Agency, Washington, DC.
Environmental Protection Agency. 1992. Final Phase 2 Work Plan and Sampling Plan, HudsonRiver PCBs Reassessment RI/FS. EPANo. 013-2N84. U.S. Environmental Protection Agency,Washington, DC.
Environmental Protection Agency. 1993. Wildlife Exposure Factors Handbook. Volume I of n.EPA/600/R-93/187a. U.S. Environmental Protection Agency, Office of Research andDevelopment, Washington, DC.
Environmental Protection Agency. 1997. Ecological Risk Assessment Guidance for Superfund:Process for Designing and Conducting Ecological Risk Assessments. EPA 540-R-97-OCS.
Environmental Protection Agency. 1998a. Ecological Risk Management Principles forSuperfund Sites. Draft. OSWER Directive 9285-7-28P.
Environmental Protection Agency. 1998b. Guidelines for Ecological Risk Assessment.EPA/630/R-95/002F.
Exponent. 1998. Macroinvertebrate community and fish stomach content analysis for samplingconducted in 1997. Data report. Exponent, Bellevue, WA.
General Electric Company, 1996. Comments of General Electric Company on Phase 2 Report -Review Copy, Further Site Characterization and Analysis, Volume 2C. Data Evaluation andInterpretation Report. Hudson River PCBs Reassessment RI/FS. Octojjer 1996.
40

General Electric Company, 1997. Comments of General Electric Company on Phase 2 Report -Review Copy, Further Site Characterization and Analysis, Volume 2C. Data Evaluation andInterpretation Report. Hudson River PCBs Reassessment RI/FS. February 1997.
Kaufman,K. 1996. Lives of North American Birds. New York: Houghton Mifflin Company.
Kynard, B. 1997. Life history, latitudinal patterns, and status of the shortnose sturgeon,Acipenser brevirostrum. Envir. Biol. Fishes 48:319-334.
Landrum,, C.L., T.L. Ashwood and O.K. Cox. 1993. Belted Kingfishers as Ecological Monitorsof Contamination: A Review. Oak Ridge National Laboratory, Oak Ridge, TN. ORNL/M-2533.March.
Long, E.R., and L.G. Morgan. 1991. The potential for biological effects of sediment-sorbedcontaminants tested in the National Status and Trends Program. NOAA Tech. Memo. NOSOMA 52. U.S. National Oceanic and Atmospheric Administration, Seattle, WA. 175 pp.
McCarty, J.P. 1995. Effects of short-term changes in environmental conditions on the foragingecology and reproductive success of tree swallows, Tachycinecta bicolor. Dissertation. CornellUniversity. 305 pp.
Menzie, C., M.H. Henning, J. Cura, K. Finkelsten, J. Gentile, J. Maugham, D. Mitchell, S. Petron,B. Potocki, S. Svirsky, P. Tyler. 1996. Special report of the Massachusetts weight-of-evidenceworkgroup: A weight-of-evidence approach for evaluating ecological risk. Human Ecol. RiskAssess. 2(2):277-304.
National Marine Fisheries Service and U.S. Fish and Wildlife Service. 1985. Emergency StripedBass Research Study, Report for 1984.
National Marine Fisheries Service and U.S. Fish and Wildlife Service. 1994. Emergency StripedBass Research Study, Report for 1993.
National Marine Fisheries Services. 1997. Recovery plan for the shortnose sturgeon (Acipenserbrevirostrum). Public review draft. National Marine Fisheries Service, Shortnose SturgeonRecovery Team.
Nye, P. 1998. Personal communication (telephone conversation with J. Sampson, Exponent,Bellevue, WA, on June 23, 1998 regarding the status of Hudson River bald eagles and peregrinefalcons). New York State Department of Environmental Conservation, Delmar, NY.
New York State Department of Environmental Conservation. 1993a. 20 year tends in waterquality of rivers and streams in New York state based on macroinvertebrate data, 1972-1992.New York State Department of Environmental Conservation, Albany, NY.
301069

New York State Department of Environmental Conservation. 1997. HREMP Annual Report andState of the Hudson Report for Period 4/1/97-3/31/98. Albany, NY. 69pp.
Robertson, R.J., BJ. Stutchbury, and R. Cohen. 1992. Tree swallow. The Birds of NorthAmerica. 11: 1-27.
Salyer, J.C. and K.F. Langler. 1949. The eastern belted kingfisher, Megacerylealcoyon alcyon(Linnaeus), in relation to fish management. Irons. Am. Fish. Soc. 76:97-117.
Secor, D. 1997. Personal communication (telephone conversation with J. Sampson, Exponent,Bellevue, WA 1998 regarding PCB concentrations in eels). Chesapeake Biological Laboratory,U. of Maryland for Environmental Science, Solomons, MD.
Secord, A.L., and McCarty, J.P. 1997. Polychlorinated biphenyl contamination of tree swallowsin the Upper Hudson River Valley, New York: Effects on breeding biology and implications forother bird species. U.S. Fish and Wildlife Service, New York Field Office, Corland, NY.
Suter, G.W. 1990. Endpoints for Regional Ecological Risk Assessments. EnvironmentalManagement. 14(l):9-23.
Suter, G.W., II. 1993. Ecological Risk Assessment. Lewis Publishers, Chelsea, MI.
U.S. Fish and Wildlife Service. 1997. Significant Habitats and Habitat Complexes of the NewYork Bight Watershed. Southern New England - New York Bight Coastal Ecosystems Program.Charlestown, Rhode Island. 1200 pp. (on CD)
42301070