hudson bergen light rail customer impact and retention
TRANSCRIPT
FHWA-NJ-2009-004 Hudson Bergen Light Rail Customer Impact and Retention Study
FINAL REPORT
March 2009
Submitted by
Dr. Rongfang (Rachel) Liu, AICP, PE New Jersey Institute of Technology
NJDOT Research Project Manager Vincent F. Nichnadowicz
In cooperation with
New Jersey Department of Transportation
Division of Research and Technology and
U.S. Department of Transportation Federal Highway Administration

DISCLAIMER STATEMENT
“The contents of this report reflect the views of the authors who are responsible for the facts and the accuracy of the data presented herein. The contents do not necessarily reflect the official views or policies of the New Jersey Department of
Transportation or the Federal Highway Administration. This report does not constitute a standard, specification, or regulation. “
TECHNICAL REPORT STANDARD TITLE PAGE 1. Report No. 2.Government Accession No. 3. Recipient’s Catalog No.
FHWA-NJ-2009-004
4. Title and Subtitle 5. Report Date 31 March 2009 6. Performing Organization Code
Hudson Bergen Light Rail Customer Impact and Retention Study
7. Author(s) 8. Performing Organization Report No.
Liu, Rongfang (Rachel), Ph. D., AICP, PE
9. Performing Organization Name and Address 10. Work Unit No.
11. Contract or Grant No.
New Jersey Institute of Technology University Heights Newark, New Jersey 07102
12. Sponsoring Agency Name and Address
13. Type of Report and Period Covered
14. Sponsoring Agency Code
New Jersey Department of Transportation Federal Highway Administration P. O. Box 600 U.S. Department of Transportation Trenton, NJ 08625 Washington D.C.
15. Supplementary Notes
16. Abstract
In order to understand the customer impact and ridership retention of the Hudson Bergen Light Rail (HBLR) extension, NJ TRANSIT and the New Jersey Department of Transportation (NJDOT) gathered a research team to conduct a study composed of a platform survey, travel behavior change analyses, and ridership impact estimates. To measure the public benefit of investment in transit, the research team explored the comprehensive impact of the HBLR extension and highlighted the specific impact on travel behavior, such as mode shift, ridership retention, and utilization of intermodal transportation systems. This report documents the main elements of the research and findings.
17. Key Words 18. Distribution Statement
Light rail transit, travel behavior changes, platform surveys, ridership impact
19. Security Classif (of this report) 20. Security Classif. (of this page) 21. No of Pages 22. Price
Unclassified Unclassified
56
Form DOT F 1700.7 (8-69)

ii
ACKNOWLEDGEMENT We hereby express our gratitude to the Project Manager, Vincent Nichnadowicz, New Jersey Department of Transportation, Pippa Woods, Senior Director of Capital Planning and Janice Pepper, Varoti Chakravarti, and Yona Baer, Director and staff, respectively, of Research Department, New Jersey Transit, The authors gratefully acknowledge the support and cooperation provided by other New Jersey staff and Hudson Bergen Light Rail operators as well as the team members include Jiannan Chen, Yi Deng, Tony Huang, Shanshan Shen, Richard Zeng and many other graduate students from New Jersey Institute of Technology (NJIT), who were the main crew for the platform survey.

iii
TABLE OF CONTENTS Page
INTRODUCTION.................................................................................................. 1 RESEARCH OBJECTIVES.................................................................................. 2 PLATFORM SURVEY.......................................................................................... 3
Design Survey Instrument.............................................................................. 3 Administer the Platform Survey .................................................................... 4 Process Survey Results ................................................................................. 6
DATA ANALYSIS ................................................................................................ 7 Demographic Profiles..................................................................................... 8 Social and Economic Status ........................................................................ 12 Travel Characteristics .................................................................................. 16 Customer Satisfaction.................................................................................. 28
TRAVEL BEHAVIOR CHANGES ...................................................................... 31 Mode Shift...................................................................................................... 31 Location Changes......................................................................................... 34 Captive Riders............................................................................................... 36
RIDERSHIP IMPACT ......................................................................................... 38 SUMMARY......................................................................................................... 42 REFERENCE ..................................................................................................... 43 APPENDIX 1. SURVEY INSTRUMENT ............................................................. 44
iv
LIST OF FIGURES Page
Figure 1. The northern segment of the Hudson Bergen Light Rail ......... 1 Figure 2. Ridership estimates for each station......................................... 5 Figure 3. Response rates for each station ................................................ 6 Figure 4. Corridor areas.............................................................................. 7 Figure 5. Age distributions ......................................................................... 8 Figure 6. Household sizes .......................................................................... 9 Figure 7. Family structures....................................................................... 10 Figure 8. Racial and ethnic distribution .................................................. 11 Figure 9. Occupation distributions .......................................................... 12 Figure 10. Income distribution ................................................................. 13 Figure 11. Auto ownership ....................................................................... 14 Figure 12. Home ownership...................................................................... 15 Figure 13. Weekly trip frequencies .......................................................... 16 Figure 14. Trip purposes........................................................................... 17 Figure 15. Access modes ......................................................................... 18 Figure 16. Parking options ....................................................................... 19 Figure 17. Distance from stations............................................................ 19 Figure 18. Boarding stations .................................................................... 20 Figure 19. Destination types..................................................................... 21 Figure 20. Destination split between New York and New Jersey .......... 22 Figure 21. Egress modes .......................................................................... 23 Figure 22. Deboarding stations................................................................ 24 Figure 23. Ticket types, purchase options .............................................. 26 Figure 24. Travel options .......................................................................... 27 Figure 25. Return trips .............................................................................. 28 Figure 26. Satisfaction survey.................................................................. 29 Figure 27. Satisfaction ratings by stations ............................................. 30 Figure 28. How did you find out about the service?............................... 31 Figure 29. When did you start to ride? .................................................... 32 Figure 30. Mode prior to the HBLR .......................................................... 33 Figure 31. How long living at current address........................................ 34 Figure 32. Reason to switch from previous mode.................................. 35 Figure 33. Importance of the HBLR in housing location........................ 36 Figure 34. Share of captive riders............................................................ 37 Figure 35. Profiles of captive riders......................................................... 37 Figure 36. Age comparison between 2005 and 2008 HBLRT riders...... 38 Figure 37. Income comparison between 2005 and 2008 HBLRT riders 39 Figure 38. Weekly trip frequency comparison ........................................ 40 Figure 39. Access mode changes............................................................ 40 Figure 40. Distance from the stations...................................................... 41

v
LIST OF TABLES Page
Table 1. Origin and destination matrix .................................................... 25 Table 2. Time line for Hudson Bergen Light Rail extensions ................ 32
1
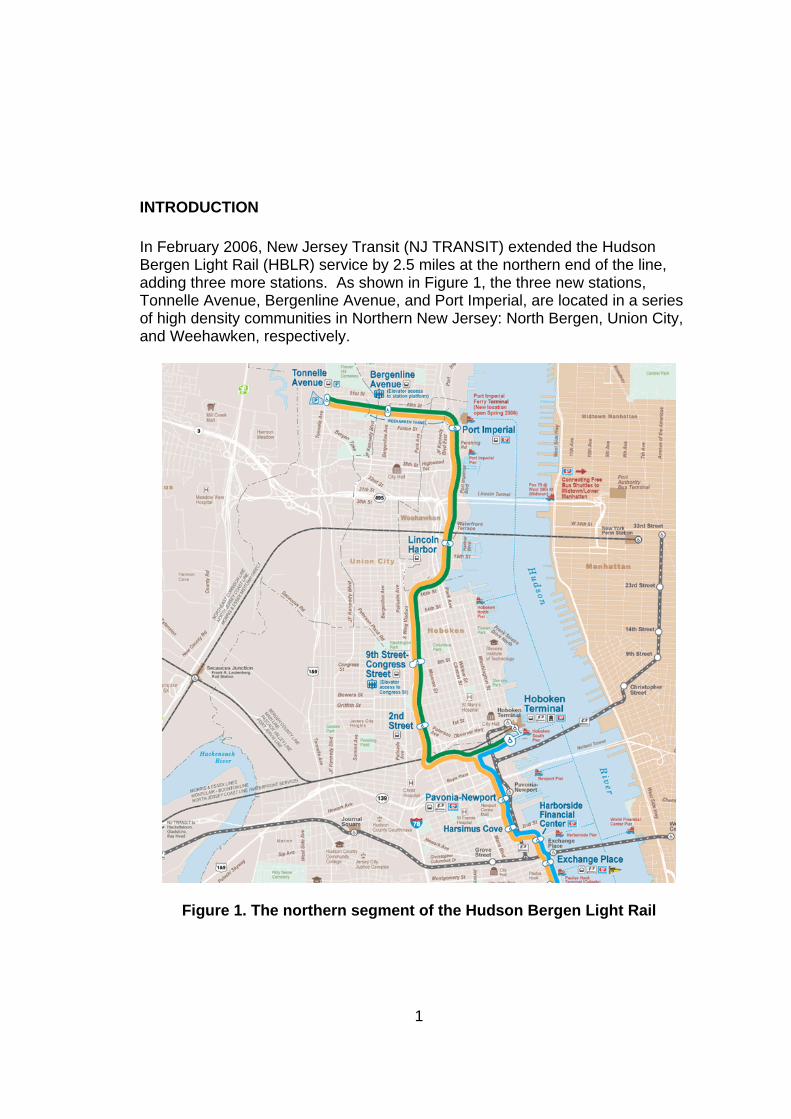
INTRODUCTION In February 2006, New Jersey Transit (NJ TRANSIT) extended the Hudson Bergen Light Rail (HBLR) service by 2.5 miles at the northern end of the line, adding three more stations. As shown in Figure 1, the three new stations, Tonnelle Avenue, Bergenline Avenue, and Port Imperial, are located in a series of high density communities in Northern New Jersey: North Bergen, Union City, and Weehawken, respectively.
Figure 1. The northern segment of the Hudson Bergen Light Rail

2
In order to understand the customer impact and ridership retention of the HBLR extension, NJ TRANSIT and the New Jersey Department of Transportation (NJDOT) gathered a research team to conduct a study composed of a platform survey, travel behavior change analysis, and ridership impact estimates. To measure the public benefit of investment in transit, the research team explored the comprehensive impact of the HBLR extension and highlighted the specific impact on travel behavior, such as mode shift, ridership retention, and utilization of intermodal transportation systems. This report documents the main elements of the research and findings.
RESEARCH OBJECTIVES The purpose of this research is to measure the public benefit of the investment in transit including both bus and LRT. The research team is charged to explore the comprehensive impact of Hudson Bergen LRT extension and highlight the specific impact on travel behavior, such as mode shift, ridership retention, and utilization of intermodal transportation systems. To derive the ultimate product of this project, the research team strove to accomplish the following objectives:
• Conduct and analyze a new platform survey along the northern segment of Hudson Bergen LRT.
• Identify and understand travel pattern shifts, including auto diversions,
induced ridership and time saving benefits, due to the extension of the Hudson Bergen LRT services.
• Estimate the impact on retaining existing riders and integrated bus and
light rail services. • Measure the success of the Hudson Bergen Light Rail in meeting its major
objectives. • Provide data to support Hudson Bergen Light Rail business planning
activities and marketing programs. • Identify residential location impacts of the extension in terms of
households moving to station areas.

3
PLATFORM SURVEY
The first step of the study was the administration of a platform survey along the northern segment of the HBLR. This section documents the platform survey process, system methodologies implemented in the HBLR ridership impact survey, and lessons learned or further suggestions for future transit ridership surveys.
The research team administered a platform survey at seven stations along the 5.5 mile segment between Tonnelle Avenue in Jersey City and the Hoboken Terminal in Hoboken. The survey effort consisted of platform distribution of survey instruments to customers boarding in the southbound direction at the six stations north of Hoboken Terminal, with a collection station located at Hoboken Terminal.
Design Survey Instrument The research team worked with NJDOT and NJ TRANSIT staff to design the survey instrument, which was initially based on questionnaires used in previous surveys conducted along the Hudson Bergen LRT in 2005. NJ TRANSIT chose not to provide multi-lingual survey forms due to previous research that revealed the multilingual forms typically have very low response, and are therefore not cost effective. The experience of the 2005 HBLR study showed that Spanish speaking customers would either chose to complete an English survey or would refuse to complete any survey (Resource System Group, 2007). As shown in Appendix 1, the questionnaire contained 39 questions divided into three parts: travel patterns, customer satisfaction, socio-economic information and demographic information. The first part includes mostly travel questions such as “Where did you board the Hudson-Bergen Light Rail today?” and “How did you get to the Hudson-Bergen Light Rail station?” In the service satisfaction section, customers were asked to rate 20 service attributes on a scale from zero (0 = unacceptable) to ten (10 = excellent). In the final part of the survey, riders provided demographic information such as age, gender, occupation, and income. After a few rounds of review and discussion, the research team produced a preliminary draft of the survey instrument. Once all corrections were made, the research team has completed the following procedures for the platform survey:
• Obtained information on NJ TRANSIT’s business reply permit. • Had the survey instrument printed. • Assigned a unique ID for each questionnaire and envelope. • Bundled the survey forms.

4
After examining the overall ridership and potential sampling approaches, the research team decided to use a “census” approach for the survey administration; that is, the survey team tried to capture all the riders traveling southbound from the selected stations during the survey period from 4:45 AM until 4:00 PM on the day of the survey. The survey day selected was a Thursday. The survey crew made attempts to hand out questionnaires to every passenger who approached a southbound train. The census approach increased the possibility of a large number of responses, eliminated sampling error, and provided a ridership count on the day of the survey. As shown in Figure 2, boarding volume varied between stations and during different times of the day. Therefore, it was critical to arrange the survey crew so there is enough staff to handle the volumes during the peak hours, while also giving survey agents time to rest and recover during the off-peak period.
Administer the Platform Survey The typical approach for an on-board survey is to have surveyors hand out and collect self-administered questionnaires (hand-back) or to encourage the respondents to mail them back (mail-back). Typical response rates for a mail-back survey are around 20% (Meyer and Miller, 2001; Richardson et al., 1995); the response rate for the hand back approach may be slightly higher. Given the center platform layout with tracks on either side at four out of the six stations, it was convenient to have surveyors distribute questionnaires on the platform in each station. The surveyors were mostly NJIT graduate students, who were trained thoroughly on the survey processes prior to being sent to the field. The surveyors distributed questionnaires on the platforms and counted the number of refusals for the purpose of quality control. An experienced field manager supervised the survey distribution at each station. The survey was administered on 1 May 2008, with survey agents in place by 4:30 in the morning, fifteen minutes prior to the departure of the first train heading south from the Tonnelle Avenue station. Based on the experience from site visits, two to four surveyors were dispatched to each station depending on the number of platform entrances and the volume of each station. Two other surveyors served as group leaders and backup personnel in case a large surge in volume occurred. A recording form was given to each surveyor. The surveyors handed out the questionnaires following the sequence numbers printed on the envelopes and then wrote down the first and last sequence number during each down period. If someone refused to take the survey, after the surveyor explained and showed them the survey instrument, the questionnaire was dropped into each surveyor’s backpack and never used again.

5
Figure 2. Ridership estimates for each station
Source: NJ Transit Counts, 2007.

6
During peak hours, eight NJ TRANSIT research and forecasting staff members directed the NJT students and helped disseminate surveys to customers. At the last stop of the line, one surveyor was in charge of receiving the completed questionnaires. All student surveyors were required to periodically report back to the field manager. During the full-scale survey administration, the survey team maintained an up-to-date list of the progress of the survey. The team maintained contact with and was responsive to the requests made by the NJ TRANSIT project staff during the survey administration period. NJ TRANSIT staff also maintained contact with the team and was informed of any unexpected circumstances that may have had any consequences on the survey administration, such as train delays or service disruption. Fortunately, there was no service interruption or any event that would have substantially affected the survey results during the day of the survey.
Process Survey Results The research team received a record layout from NJT and data was keyed in using SPSS software. The team conducted consistency and logic checks on all data items in the database. As shown in Figure 3, the overall response rate was about 19 percent, which is within the range of transit platform surveys.
0
200
400
600
800
1000
1200
1400
1600
1800
2000
Tonnelle Avenue Bergenline Ave Port Imperial Lincoln Harbor 9th Street 2nd Street
Distributed Rejected Response
Figure 3. Response rates for each station
Source: 2008 HBLR platform survey
7
DATA ANALYSIS The objectives of this task wewe to examine the survey data and identify shifts in travel patterns, ridership, and customer satisfaction levels among Hudson Bergen Light Rail customers. After the initial clean-up of the survey data, the team examined current distribution among various modes including main access and egress modes, O-D matrices and boarding volume by stations, directions, and time of day, as well as changes in residence, employment, or travel mode revealed in the survey.
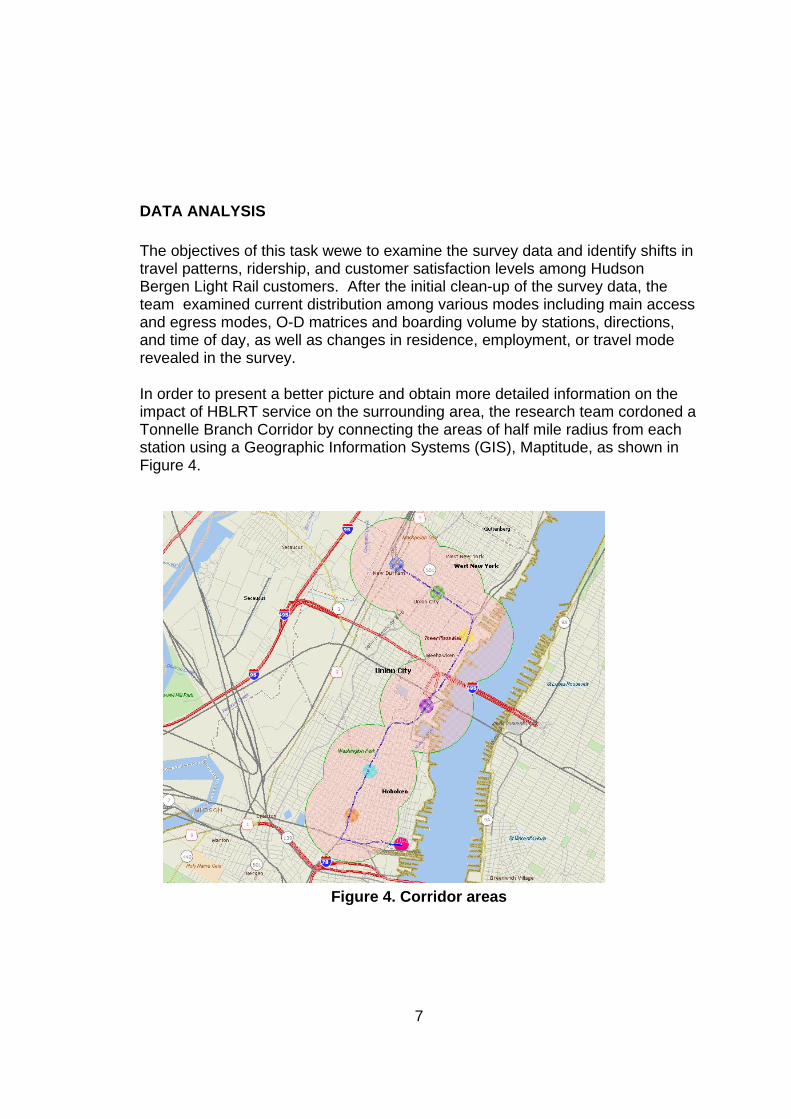
In order to present a better picture and obtain more detailed information on the impact of HBLRT service on the surrounding area, the research team cordoned a Tonnelle Branch Corridor by connecting the areas of half mile radius from each station using a Geographic Information Systems (GIS), Maptitude, as shown in Figure 4.
Figure 4. Corridor areas

8
Demographic Profiles The research team conducted a thorough comparison between the HBLR riders and general residents, using the current HBLR survey and the census data for the area surrounding the surveyed HBLR stations as presented in Figure 4. The gender split, was almost identical for HBLRT riders and general residents along the corridor, with an equal split between men and women. The age distribution appears different between the riders and general residents along the corridor. As depicted in Figure 5, the age distribution for HBLR riders largely follows a normal pattern, that is, the mode is located in an area with the largest number of residents falling in the 25-34 year old category. On the other hand, the age distribution for all residents along the HBLR corridor shows a much higher percentage for both under 18 and over 65 groups. It is understandable that very old and very young may not utilize public transit as much as people in the labor force. It is important to note that among all the middle categories, from age 19 to 64, the percentages of all categories for HBLRT riders are higher than that of the general residents, which indicated that HBLRT riders are largely made of people who are in the range of working ages regardless their employment status, which will be explored in the later section of this report.
Figure 5. Age distributions
Source: 2008 HBLR Platform Survey & 2000 Census

9
The distributions of household sizes were quite similar when comparing the LRT riders to the overall population in the area. As shown in Figure 6A, almost one quarter of the HBLR riders are from a single person households and one third are from two-person households. The accumulated portion of one- and two- person households make up a majority of the ridership, which resembles a younger population and small household sizes.
A. Household sizes for
LRT riders
B. Household size for general residents
Figure 6. Household sizes
Source: 2008 HBLR Platform Survey & 2000 Census The validity of the household sizes is further verified by the number of children in each household. As exhibited in Figure 7A, almost two thirds of HBLR rider households do not have children, which is identical with the census data applied to all area residents as shown in Figure 7B. As for the HBLR riders who have children, almost sixty percent of them have only one child, thirty percent of the families have two children, and about ten percent are families with three or more children as shown in Figure 7A.

10
A. Number of child status for HBLR riders
B. Number of child status for residents
Figure 7. Family structures
Source: 2008 HBLR Platform Survey & 2000 Census
11
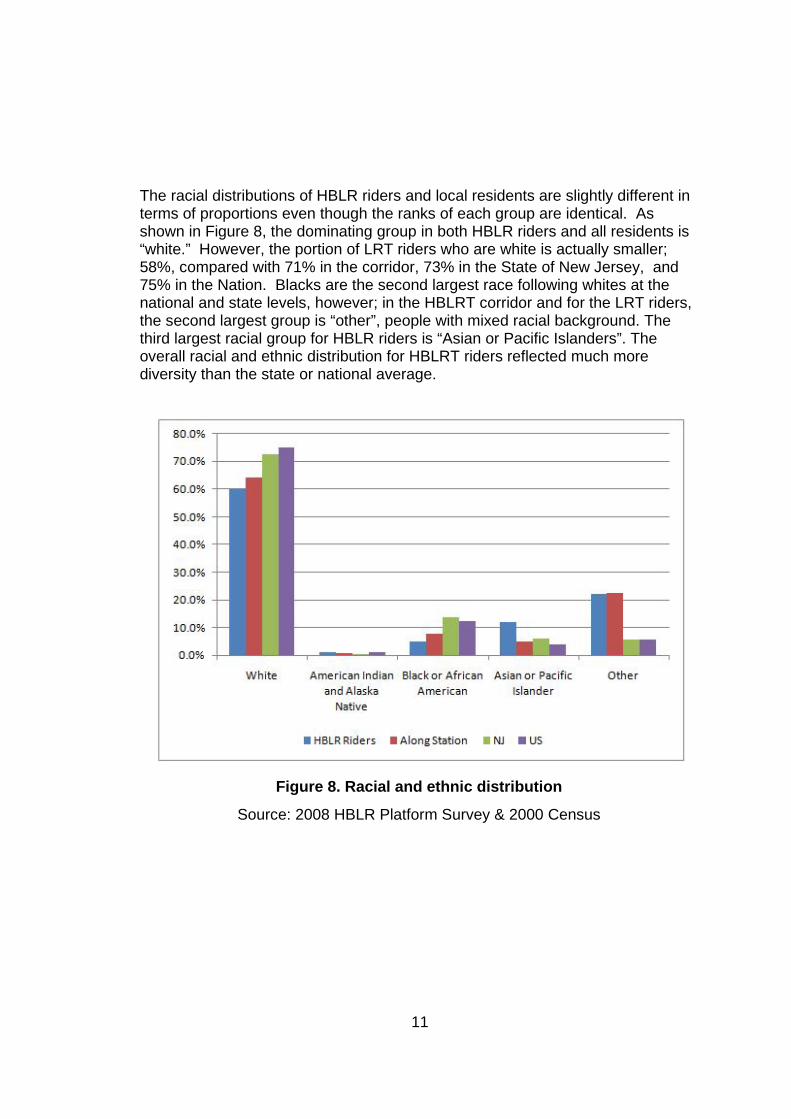
The racial distributions of HBLR riders and local residents are slightly different in terms of proportions even though the ranks of each group are identical. As shown in Figure 8, the dominating group in both HBLR riders and all residents is “white.” However, the portion of LRT riders who are white is actually smaller; 58%, compared with 71% in the corridor, 73% in the State of New Jersey, and 75% in the Nation. Blacks are the second largest race following whites at the national and state levels, however; in the HBLRT corridor and for the LRT riders, the second largest group is “other”, people with mixed racial background. The third largest racial group for HBLR riders is “Asian or Pacific Islanders”. The overall racial and ethnic distribution for HBLRT riders reflected much more diversity than the state or national average.
Figure 8. Racial and ethnic distribution
Source: 2008 HBLR Platform Survey & 2000 Census
12
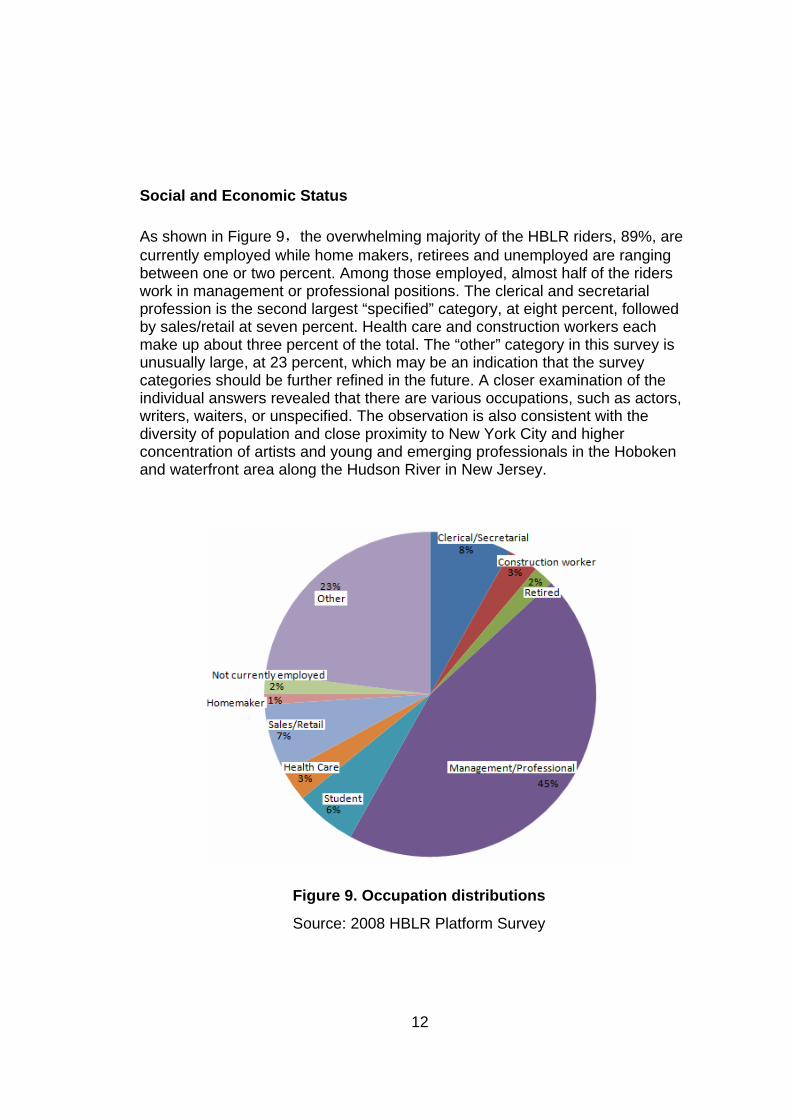
Social and Economic Status As shown in Figure 9,the overwhelming majority of the HBLR riders, 89%, are currently employed while home makers, retirees and unemployed are ranging between one or two percent. Among those employed, almost half of the riders work in management or professional positions. The clerical and secretarial profession is the second largest “specified” category, at eight percent, followed by sales/retail at seven percent. Health care and construction workers each make up about three percent of the total. The “other” category in this survey is unusually large, at 23 percent, which may be an indication that the survey categories should be further refined in the future. A closer examination of the individual answers revealed that there are various occupations, such as actors, writers, waiters, or unspecified. The observation is also consistent with the diversity of population and close proximity to New York City and higher concentration of artists and young and emerging professionals in the Hoboken and waterfront area along the Hudson River in New Jersey.
Figure 9. Occupation distributions
Source: 2008 HBLR Platform Survey

13
The annual income of the riders is shown in Figure 10, which appears to follow a flat normal curve. The mode falls in the $50,000-$75,000 per year range and is consistent with the professional occupation categories reflected in the occupation questions. The lower income group, less than $25,000 per year, made up about 10 percent of the total ridership, which is lower than that of the overall residents in the areas, twenty percent. The differences between the LRT riders and general residents among the higher income groups are even bigger, with those earning over $150,000 annually commanding a 13 percent share of HBLR ridership. Only six percent of the general residents have an income above $150,000.
Figure 10. Income distribution
Source: 2008 HBLR Platform Survey & 2000 Census

14
As exhibited in Figure 11A, 33 percent of HBLR riders do not have a car, which is slightly lower than the general residents in the area, 37%. While the percentage of families with one car are almost identical between HBLR riders and general area residents, 42 versus 44 percent respectively, a slightly larger portion of the HBLR riders, 19 percent, have two or more vehicles compared with area residents, 15 percent. With captive riders being classified as those without a car, about one third of the HBLR riders may be classified as captive riders, because the driving option is not available to them. However, given the decreasing price of auto ownership, not owning a car today may be a choice, rather than an issue of affordability.
A. Auto-ownership of riders
B. Auto-ownership of residents
Figure 11. Auto ownership

15
The home ownership of HBLR riders is significantly higher than that of general residents in the area. As documented in Figure 12, only one quarter of the residents in the area own their home while more than one third of HBLR riders are home owners.
A. Home ownership for LRT riders
B. Home Ownership for general residents
Figure 12. Home ownership

16
Travel Characteristics Consistent with the answers to the questions regarding rider’s occupations, trip purpose and trip frequency reflected a typical commuting trip by most HBLR riders. As shown in Figure 13, almost 80 percent of HBLR riders use the light rail service five or more days a week. Another 14 percent of riders get on the light rail three to four days per week, followed by those who take the light rail train one to two days per week (3%). Only about 4 percent of the riders use the LRT less than one to three days per month and less than 1 percent of riders were using the LRT service the first time.
5%
15%
76%
1% 1% 3%0%
10%
20%
30%
40%
50%
60%
70%
80%
First time Less than 1 day amonth
1-3 days a month 1-2 days a week 3-4 days a week 5 or more days aweek
Figure 13. Weekly trip frequencies
Source: 2008 HBLR Platform Survey

17
The trip purpose breakdown of HBLR riders are shown in Figure 14. The number of people who took the train to work tops other trip purposes by a large margin; 84 percent in all. Five percent of the riders were heading to school, while another four percent were going shopping. Only three percent of the riders indicated that they had personal business to attend, along with another three percent who chose “other” as their trip purpose. A quick scan of other purposes revealed that they may include “job search”, “jury duty”, or “dropping someone off”.
Figure 14. Trip purposes
Source: 2008 HBLR Platform Survey.

18
Figure 15 reflects the overall access mode choice by HBLR riders before boarding the LRT train. The largest share of access mode is walking, more than 60%. The second largest share of access mode is bus, 22%. Only about one tenth of the HBLRT riders drove to the station. They either parked or were dropped off by others. The car-pool portion is even smaller, barely 0.1 percent of ridership. Other access modes include ferry, taxi or non-motorized modes such as mopeds or bikes.
Figure 15. Access modes
Source: 2008 HBLR Platform Survey.

19
Of those who drove to the light rail stations, nearly a quarter of the HBLRT riders park at the NJ TRANSIT parking lot. Another 13% of commuters who drove to the HBLR station used other types of parking lots, such as a ferry lot, a municipal lot, company lots, and private lots. The other 14% parked on the street. Parking characteristics are shown in Figure 16.
Figure 16. Parking options
Source: 2008 HBLR Platform Survey. The large share of walking access to the HBLR is closely related to the short distance that people live from the transit stations. As shown in Figure 17, more than 60 percent of riders live within a half mile of the boarding stations, which is the ideal distance for walking. Only 14 percent of the HBLR riders live more than three miles away from their corresponding transit stations.
Figure 17. Distance from stations
Source: 2008 HBLR Platform Survey.

20
Boarding station distributions are shown in Figure 18. The largest number of riders is concentrated at the Bergenline Avenue station, 34%. The second largest boarding volume is located at the 9th street/Congress Station. The smallest boarding volume is around Lincoln Harbor, around five percent.
Figure 18. Boarding stations
Source: 2008 HBLR Platform Survey.

21
As shown in Figure 19, the majority of all riders, 79%, were heading to their work places. Another seven percent of riders were taking the light rail home while the rest of the 13% headed to schools, clinics or recreation places. The Origin-Destination (O-D) pair patterns are largely dictated by the survey period, from 4 AM to 4 PM, which captures the morning peak period but not the afternoon peak. A balanced O-D pair pattern is most likely if the entire day worth of data were collected in both directions.
Figure 19. Destination types
Source: 2008 HBLR Platform Survey.

22
About one quarter of all riders are headed to New York City and about three quarters remained in New Jersey, as shown in Figure 20. Most of the riders who remain in New Jersey, about 70 percent, walked to their final destinations. Other egress means include NJ Transit train, bus or PATH. Driving a parked car or being picked up made up a very small portion of the egress mode in New Jersey, as shown in Figure 21A. About 85% of those whose destination is NYC take the PATH after they get off the HBLR. Besides the PATH, 7% of the riders choose ferry as their primary option, and 5% choose an NJT bus.
Figure 20. Destination split between New York and New Jersey
Source: 2008 HBLR Platform Survey. As shown in Figure 21B, the overwhelming majority of riders walk from their HBLR station to the final destination. This seems natural as driving is no longer an option once the rider leaves his car at the transit station. On the other hand, the travelers who went to New York usually need to transfer to PATH (Port Authority Trans Hudson) to reach New York. It is possible that the final egress mode to a destination in New York is similar to that in New Jersey; that is, walking is the prevailing mode. However, quantitative data is not available since the survey asked the riders only their mode to New York, not their final egress mode.

23
A. Egress mode in NJ B. Egress to NYC
Figure 21. Egress modes
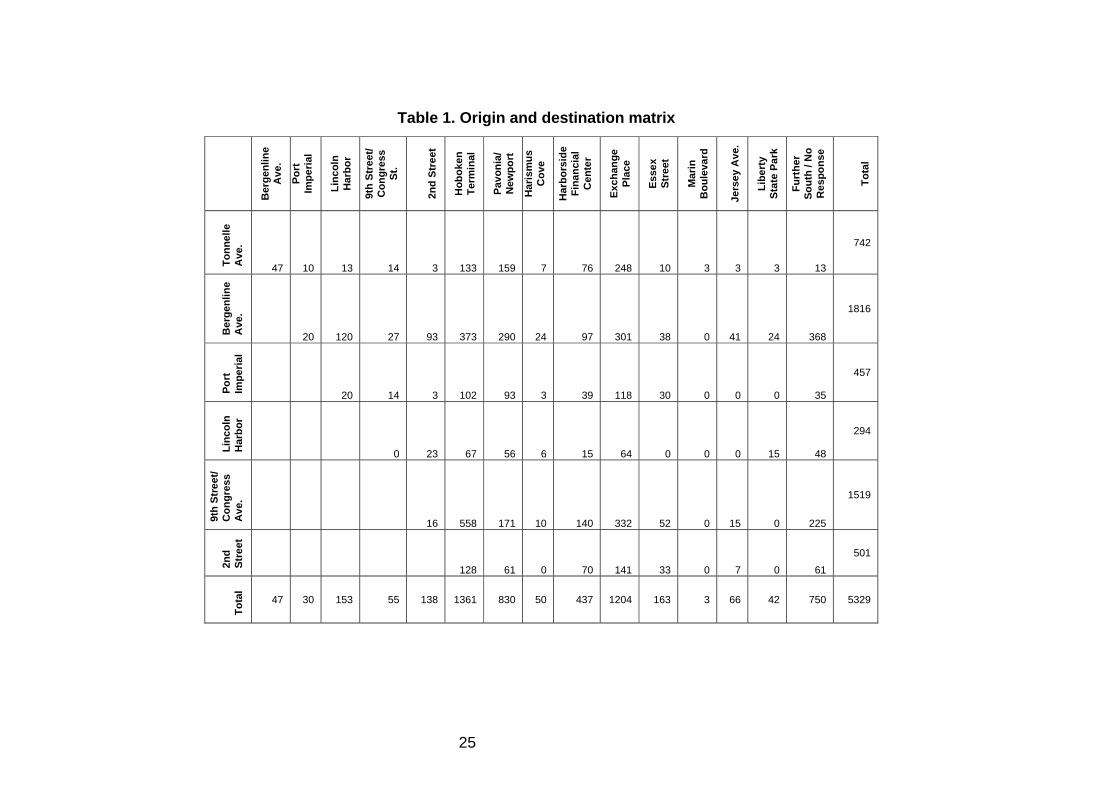
Source: 2008 HBLR Platform Survey. Figure 22 shows the deboarding stations with passenger volumes. More than half of the riders got off at Hoboken Terminal, Exchange Plaza and Pavonia/Newport, where connections to other public transit, such as PATH, NJ Transit Trains, and ferries to New York City, exist. It helps to explain why these three stations attract the highest off volumes among all HBLR stations. Besides the working trips to New York city via PATH, these stations are also high concentration centers of employment, commercial and recreational activities. For example, the Pavonia-Newport Station is adjacent to one of the major shopping malls in the Hudson County or Hudson Waterfront area, the Newport Mall. Another useful tool to examine the travel patterns of transit riders is to organize origin-destination pairs into an O-D matrix as shown in Table 1. It is true that quite a few O-D pairs have zero volume, which means there is no passenger boarding and deboarding between the station pairs. It is also interesting to observe that while the largest attraction for transit riders is at Exchange Place, as confirmed in Figure 22, the most frequent origin stations are consistent with the overall distributions. More close examination of the O-D flow would be beneficial to research providing intermodal connections, or other feeder transit services to cater to individual needs such as particular employment centers, commercial centers or particular communities. However, similar analysis is beyond the scope of this project and may be performed in further research.

24
0.0%
5.0%
10.0%
15.0%
20.0%
25.0%
30.0%
Berge
nline
Aven
ue
Port
Impe
rial
Linco
ln Ha
rbor
9th S
treet
/Con
gress
Stree
t2n
d Stre
et
Hobo
ken T
erm
inal
Pavo
nia‐N
ewpo
rt
Harsi
mus C
ove
Harb
orsid
e Fina
ncial
Cent
er
Exch
ange
Plac
eEs
sex S
treet
Mar
in Bo
uleva
rd
Jerse
y Ave
nue
Liber
ty St
ate Pa
rk
Danf
orth
Aven
ue45
th St
reet
34th
Stre
et
22nd
Stre
et
Garfi
eld A
venu
e
Mar
tin Lu
ther
King
Driv
e
Wes
tside
Aven
ue
Figure 22. Deboarding stations
Source: 2008 HBLR Platform Survey.
25
Table 1. Origin and destination matrix
B
erge
nlin
e A
ve.
Port
Im
peria
l
Linc
oln
Har
bor
9th
Stre
et/
Con
gres
s St
.
2nd
Stre
et
Hob
oken
Te
rmin
al
Pavo
nia/
N
ewpo
rt
Har
ism
us
Cov
e
Har
bors
ide
Fina
ncia
l C
ente
r
Exch
ange
Pl
ace
Esse
x St
reet
Mar
in
Bou
leva
rd
Jers
ey A
ve.
Libe
rty
Stat
e Pa
rk
Furt
her
Sout
h / N
o R
espo
nse
Tota
l
Tonn
elle
A
ve.
47 10 13 14 3 133 159 7 76 248 10 3 3 3 13
742 B
erge
nlin
e A
ve.
20 120 27 93 373 290 24 97 301 38 0 41 24 368
1816
Port
Im
peria
l
20 14 3 102 93 3 39 118 30 0 0 0 35
457
Linc
oln
Har
bor
0 23 67 56 6 15 64 0 0 0 15 48
294
9th
Stre
et/
Con
gres
s A
ve.
16 558 171 10 140 332 52 0 15 0 225
1519
2nd
Stre
et
128 61 0 70 141 33 0 7 0 61 501
Tota
l
47 30 153 55 138 1361 830 50 437 1204 163 3 66 42 750 5329

26
For a big portion of riders making work trips daily, a monthly pass is the most economical and convenient ticket type. As demonstrated in Figure 23, about 55% of the riders use monthly passes. About six percent of them bundle the monthly pass and parking together, and another one percent bundle with ferry tickets. About 11% of the riders purchased 10-trip passes. Eighteen percent of riders have either one-way or round-trip tickets.
Figure 23. Ticket types, purchase options
Source: 2008 HBLR Platform Survey.
27
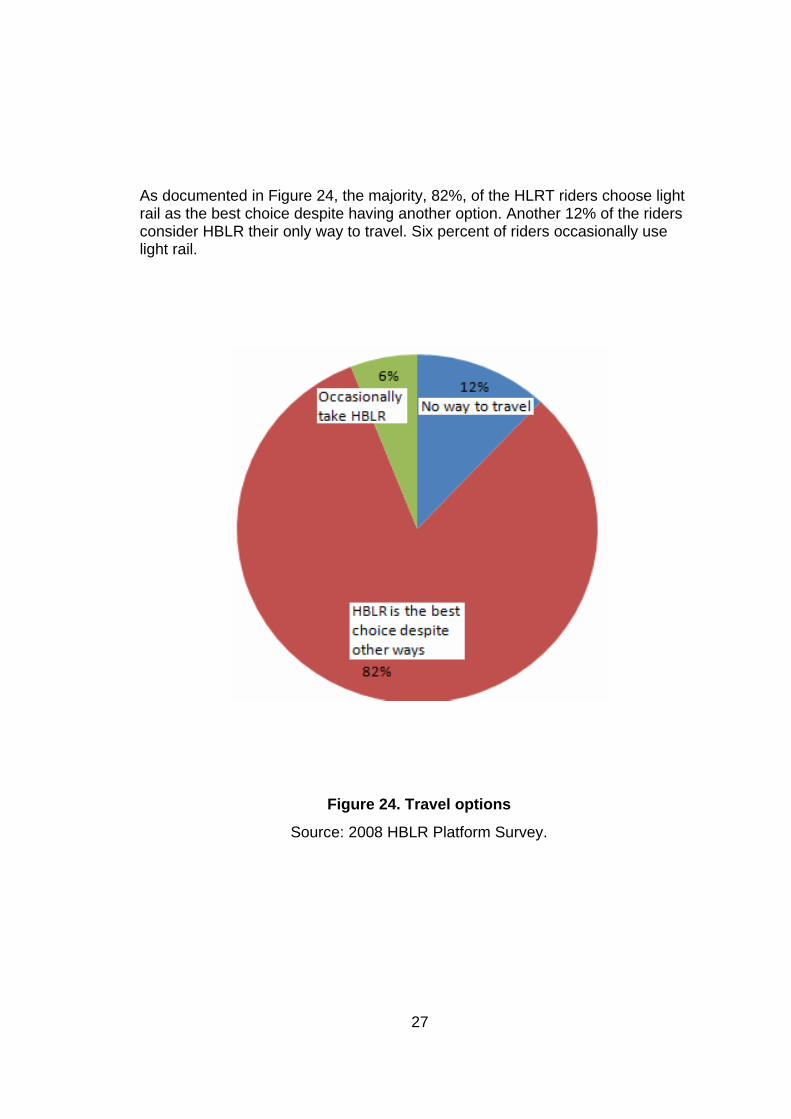
As documented in Figure 24, the majority, 82%, of the HLRT riders choose light rail as the best choice despite having another option. Another 12% of the riders consider HBLR their only way to travel. Six percent of riders occasionally use light rail.
Figure 24. Travel options
Source: 2008 HBLR Platform Survey.

28
Over ninety percent of riders take the same mode in the opposite direction for their return trip, as shown in Figure 25. About seven percent of the ridership takes a bus back and four percent choose other options like PATH, train or cars.
Figure 25. Return trips
Source: 2008 HBLR Platform Survey.
Customer Satisfaction The average overall satisfaction is 7.6 with 0 being the lowest and 10 being the highest, as shown in Figure 26. The satisfaction rating responses indicated that riders are satisfied most with the connections to NJ Transit Rail, ferry and PATH. The biggest dissatisfactions are with Customer Communication and the Fare Inspection process, with both being marked an average 6.0 out of 10. Among all the customer satisfaction survey questions, a few of them are directly linked to the individual stations. As shown in Figure 27A, parking availability rating is fairly high at the Tonnelle Avenue station since there is a NJ Transit parking lot with more than 200 parking spaces. The rating for the Port Imperial station is the lowest since there is no public parking lot and even on-street parking is limited. The safety and personal security rating for people who board at the Lincoln Harbor station is very low, which may call for further investigation.

29
Figure 26. Satisfaction survey
Source: 2005 and 2008 HBLR Platform Survey.

30
Figure 27. Satisfaction ratings by stations

31
TRAVEL BEHAVIOR CHANGES As stated earlier, the objectives of this task are to identify shifts in travel patterns, ridership, and customer satisfaction levels among Hudson Bergen Light Rail customers by analyzing results of the survey. After presenting the survey responses for the travel behavior changes, the research team explored the location changes associated with travel mode shift and general profiles of captive riders.
Mode Shift Figure 28 shows how people found out about the light rail service. About 42% of riders claimed to notice the construction before the station was opened while one third of the riders acquired the information via various media, such as NJ Transit website, newspapers, posters or mail.
Figure 28. How did you find out about the service?
Source: 2008 HBLR Platform Survey.

32
Figure 29 shows the distribution of people’s travel history with HBLR, with most people having started to use light rail from six months up to four years ago. Only three percent of the riders are new-starters while five percent began more than five years ago. It is worth noting that about one third of the riders started their LRT usage about one to two years ago, which coincides with the extension of the Tonnelle Branch as exhibited in Table 2.
3%
13%18%
34%
27%
5%
0%5%
10%15%20%
25%30%
35%40%
First timeriding
Less than 6months
6 months to1 year
1 - 2 years 2 - 4 years 5 - 8 years
Figure 29. When did you start to ride?
Source: 2008 HBLR Platform Survey.
Table 2. Time line for Hudson Bergen Light Rail extensions
Time Stage Alignment Apr-00 First Section
Open From 34 St. to Exchange Place with a branch to Westside
Nov-00 Extended North Pavonia/Newport Sep-02 Extended North Hoboken Nov-03 Extend South 22nd St. Sep-04 Extended North Lincoln Harbor Oct-05 Extended North Port Imperial, weekend only Feb-06 Extended North Tonnelle Ave, full seven day
service Apr-08 Platform survey Tonnelle Ave, full seven day
service Source: NJ Transit, 2006.

33
In Figure 30, the travel modes used prior to switching to HBLR are listed. More than one third of the riders were taking buses while thirteen percent drove to their destination either alone or car-pooled with someone. About ten percent of the riders took PATH before and another four percent NJ TRANSIT trains. Smaller portions of the riders two percent used taxi, and half a percent being dropped off. In addition, about seven percent of riders started this trip because of the availability of the HBLR. It is also worth noting that nearly seventeen percent of the riders moved to the area after the HBLR opened and another eight percent of the people started to make this trip since the opening of the HBLR. In summary, almost one quarter of HBLR riders would not have made the trip, nor would they have lived in their current location had the HBLR extension not been constructed.
Figure 30. Mode prior to the HBLR
Source: 2008 HBLR Platform Survey.

34
Location Changes As shown in Figure 31, more than 40 percent of riders moved into the area less than two years ago, which coincides with the opening of the new stations on the Tonnelle Branch. On the other hand, almost one third of the riders lived in the area more than five years. Another one quarter of the riders moved into the area between two to five years ago. This corresponds to the inauguration and operation of HBLR services since 2000. Another important observation is that a good portion of HBLR riders, 13 percent, indicated that they used the HBLR due to new employment locations.
0%
5%
10%
15%
20%
25%
30%
Less than 6months
6 months toless than a
year
Between 1 and2 years
Between 2 and5 years
Between 5 and10 years
More than 10years
Figure 31. How long living at current address
Source: 2008 HBLR Platform Survey.
35
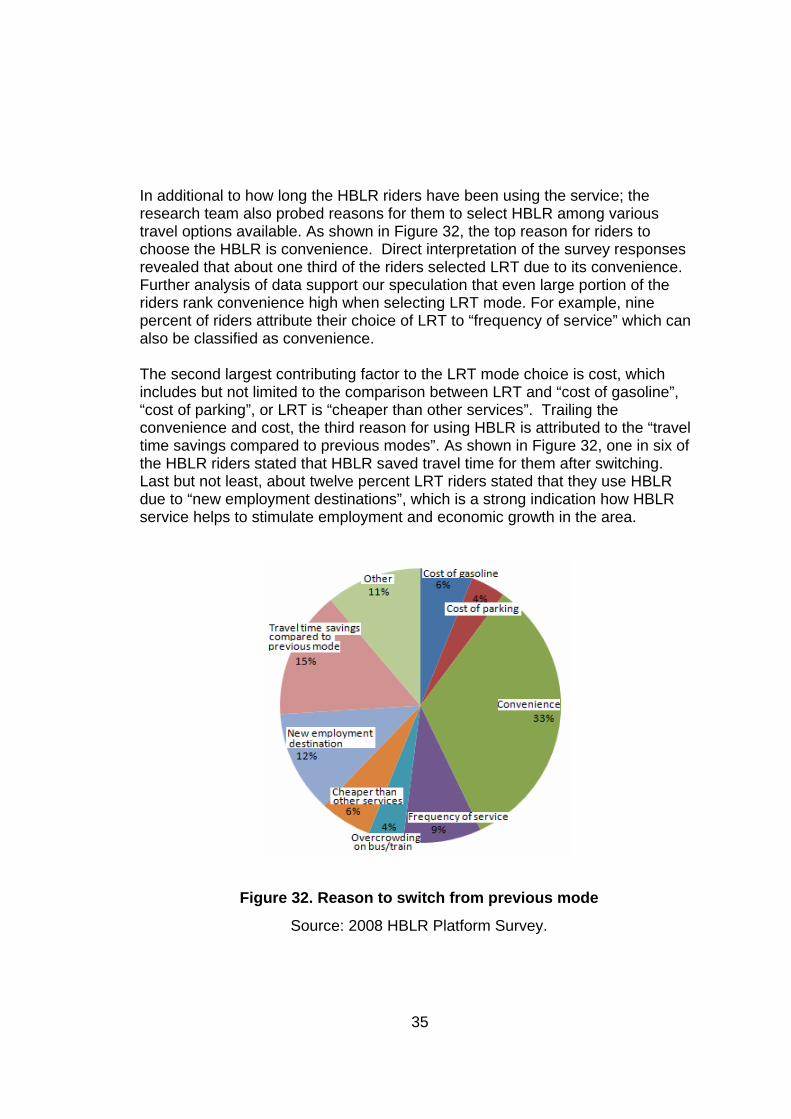
In additional to how long the HBLR riders have been using the service; the research team also probed reasons for them to select HBLR among various travel options available. As shown in Figure 32, the top reason for riders to choose the HBLR is convenience. Direct interpretation of the survey responses revealed that about one third of the riders selected LRT due to its convenience. Further analysis of data support our speculation that even large portion of the riders rank convenience high when selecting LRT mode. For example, nine percent of riders attribute their choice of LRT to “frequency of service” which can also be classified as convenience. The second largest contributing factor to the LRT mode choice is cost, which includes but not limited to the comparison between LRT and “cost of gasoline”, “cost of parking”, or LRT is “cheaper than other services”. Trailing the convenience and cost, the third reason for using HBLR is attributed to the “travel time savings compared to previous modes”. As shown in Figure 32, one in six of the HBLR riders stated that HBLR saved travel time for them after switching. Last but not least, about twelve percent LRT riders stated that they use HBLR due to “new employment destinations”, which is a strong indication how HBLR service helps to stimulate employment and economic growth in the area.
Figure 32. Reason to switch from previous mode
Source: 2008 HBLR Platform Survey.

36
To illustrate how the HBLR service affects people’s moving decisions and their daily living, Figure 33 shows that about twenty percent of the riders consider the light rail “very important” and almost half of the riders consider the HBLR service “somewhat important.” It is thus reasonable to say that about 70 percent of those surveyed indicated that the HBLR service was an important factor in their moving decision-making process.
Figure 33. Importance of the HBLR in housing location
Source: 2008 HBLR Platform Survey.
Captive Riders As seen in Figure 34, despite the fact that a majority of HBLR riders choose this mode as their best way to travel, there is still a small percentage, ten percent, riders, who used HBLR since they do not have any other choices. A further analysis indicated that more than half of the captive riders, about fifty-one percent, live in a household that does not own a vehicle. In reality, the auto availability may be even lower. For example, if a household does own a car but there are two working adults or licensed drivers, it is likely that one person does not have an automobile available to him or her when the other person needs to use the car. As for the income, the distribution for captive riders is skewed toward the lower end of the distribution curve, as shown in Figure 35.

37
Figure 34. Share of captive riders
Source: 2008 HBLR Platform Survey.
18%
25%
14%
9%
3%
12%
7% 8%
4%
0%
5%
10%
15%
20%
25%
30%
<15K
15Kto24,999
25Kto34,999
35Kto49,999
50Kto74,999
75Kto99,999
100Kto149,999
150Kto199,999
200K+
Figure 35. Profiles of captive riders
Source: 2008 HBLR Platform Survey.
38
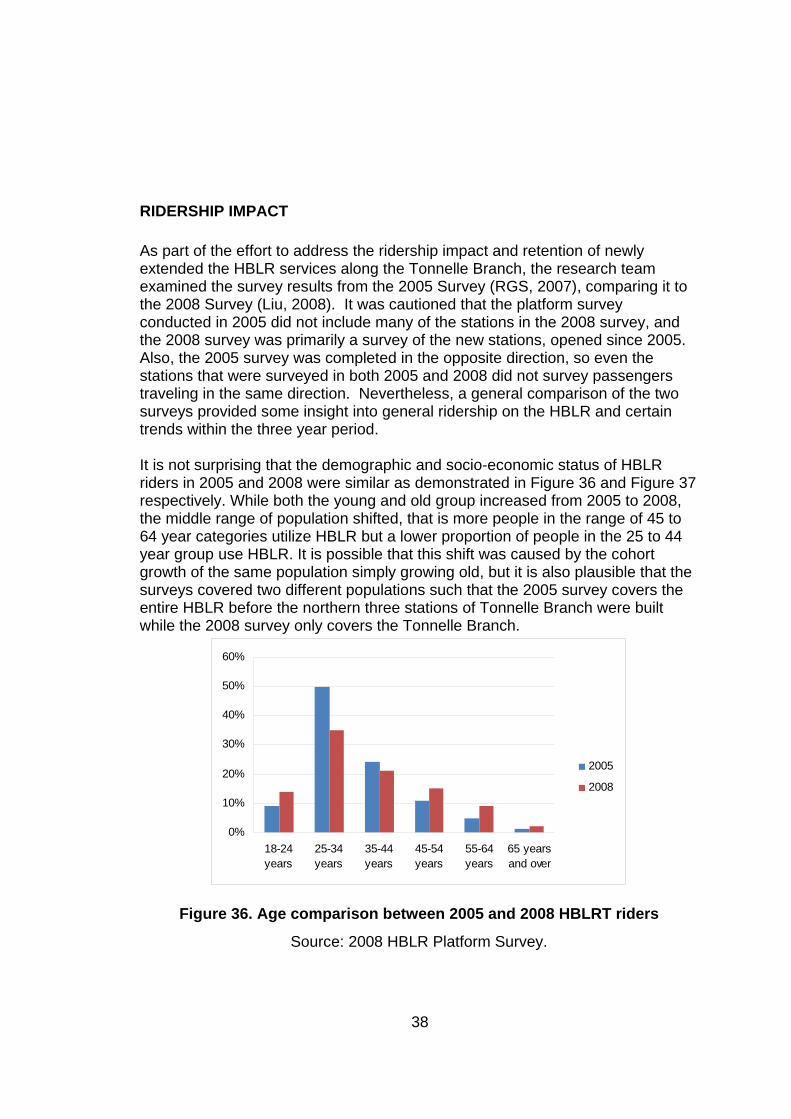
RIDERSHIP IMPACT As part of the effort to address the ridership impact and retention of newly extended the HBLR services along the Tonnelle Branch, the research team examined the survey results from the 2005 Survey (RGS, 2007), comparing it to the 2008 Survey (Liu, 2008). It was cautioned that the platform survey conducted in 2005 did not include many of the stations in the 2008 survey, and the 2008 survey was primarily a survey of the new stations, opened since 2005. Also, the 2005 survey was completed in the opposite direction, so even the stations that were surveyed in both 2005 and 2008 did not survey passengers traveling in the same direction. Nevertheless, a general comparison of the two surveys provided some insight into general ridership on the HBLR and certain trends within the three year period. It is not surprising that the demographic and socio-economic status of HBLR riders in 2005 and 2008 were similar as demonstrated in Figure 36 and Figure 37 respectively. While both the young and old group increased from 2005 to 2008, the middle range of population shifted, that is more people in the range of 45 to 64 year categories utilize HBLR but a lower proportion of people in the 25 to 44 year group use HBLR. It is possible that this shift was caused by the cohort growth of the same population simply growing old, but it is also plausible that the surveys covered two different populations such that the 2005 survey covers the entire HBLR before the northern three stations of Tonnelle Branch were built while the 2008 survey only covers the Tonnelle Branch.
0%
10%
20%
30%
40%
50%
60%
18-24years
25-34years
35-44years
45-54years
55-64years
65 yearsand over
2005
2008
Figure 36. Age comparison between 2005 and 2008 HBLRT riders
Source: 2008 HBLR Platform Survey.
39
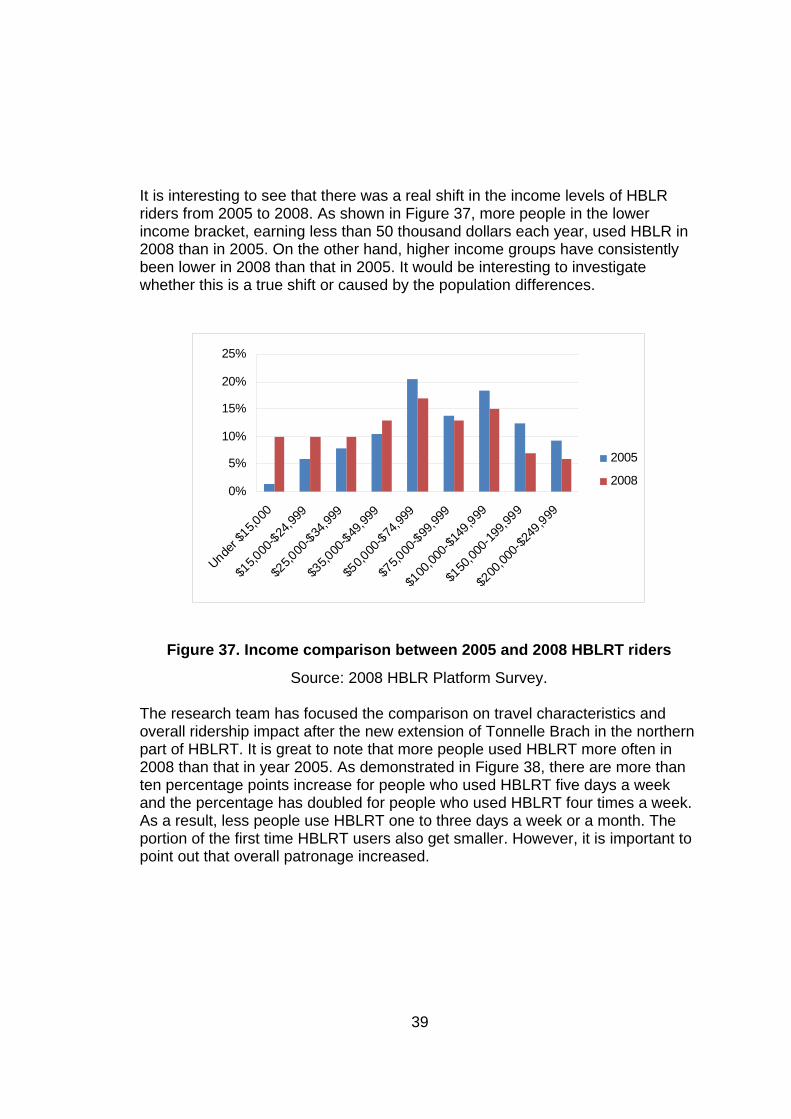
It is interesting to see that there was a real shift in the income levels of HBLR riders from 2005 to 2008. As shown in Figure 37, more people in the lower income bracket, earning less than 50 thousand dollars each year, used HBLR in 2008 than in 2005. On the other hand, higher income groups have consistently been lower in 2008 than that in 2005. It would be interesting to investigate whether this is a true shift or caused by the population differences.
0%
5%
10%
15%
20%
25%
Under $
15,000
$15,0
00-$24
,999
$25,0
00-$34
,999
$35,0
00-$49
,999
$50,0
00-$74
,999
$75,0
00-$99
,999
$100
,000-$
149,999
$150
,000-1
99,99
9
$200
,000-$
249,999
2005
2008
Figure 37. Income comparison between 2005 and 2008 HBLRT riders
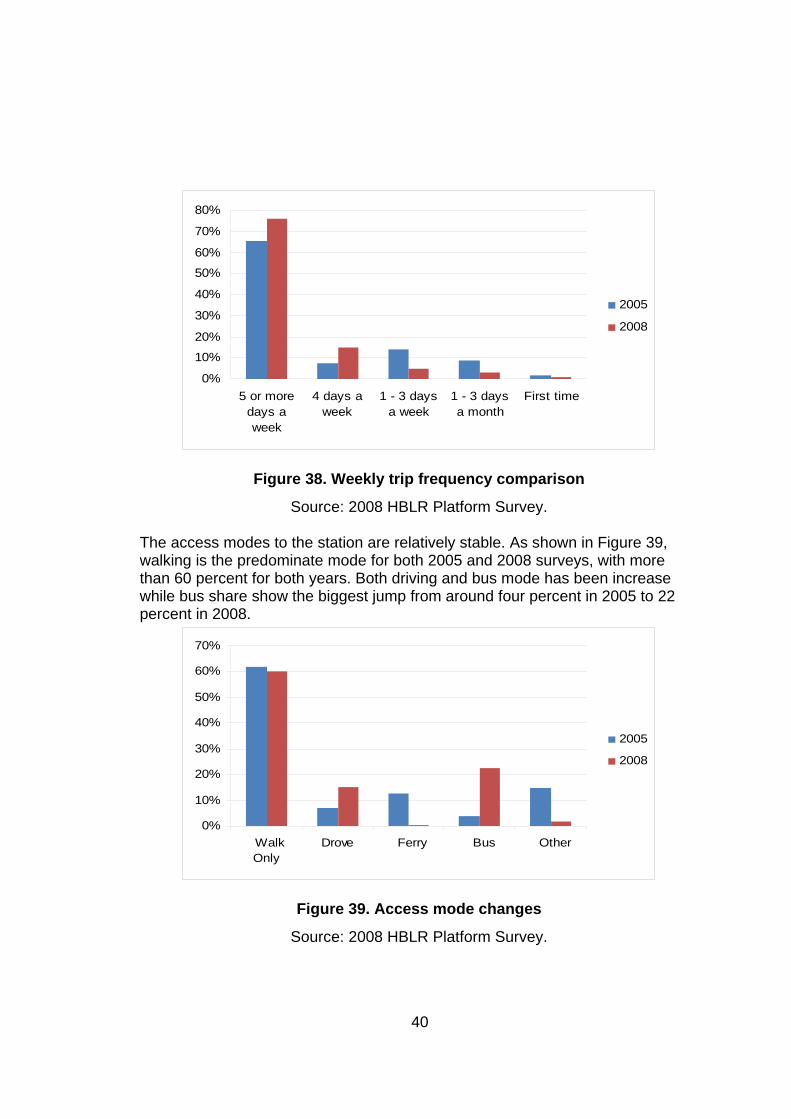
Source: 2008 HBLR Platform Survey. The research team has focused the comparison on travel characteristics and overall ridership impact after the new extension of Tonnelle Brach in the northern part of HBLRT. It is great to note that more people used HBLRT more often in 2008 than that in year 2005. As demonstrated in Figure 38, there are more than ten percentage points increase for people who used HBLRT five days a week and the percentage has doubled for people who used HBLRT four times a week. As a result, less people use HBLRT one to three days a week or a month. The portion of the first time HBLRT users also get smaller. However, it is important to point out that overall patronage increased.
40
0%
10%
20%
30%
40%
50%
60%
70%
80%
5 or moredays aweek
4 days aweek
1 - 3 daysa week
1 - 3 daysa month
First time
2005
2008
Figure 38. Weekly trip frequency comparison
Source: 2008 HBLR Platform Survey. The access modes to the station are relatively stable. As shown in Figure 39, walking is the predominate mode for both 2005 and 2008 surveys, with more than 60 percent for both years. Both driving and bus mode has been increase while bus share show the biggest jump from around four percent in 2005 to 22 percent in 2008.
0%
10%
20%
30%
40%
50%
60%
70%
WalkOnly
Drove Ferry Bus Other
2005
2008
Figure 39. Access mode changes
Source: 2008 HBLR Platform Survey.

41
Although we are interested in parking comparison between the two surveys, there was not enough data collected in 2005 to allow for a reasonable comparison. For example, only two passengers boarding on the Tonnelle Branch responded to the question for parking, one parked in a private lot and another in the NJ Transit lot. Therefore, the research team decided not to compare parking so as to avoid any misleading conclusions. As the system was expanded and the ridership increased dramatically, it was natural to see that the overall parking spaces, parked vehicles, and the number of riders using parking options all increased. Another interesting comparison is the distance riders live from their boarding stations. As shown in Figure 40, a large portion of HBLR riders moved either closer or further away from the station. For example, a larger portion of the HBLR riders, 52 percent in 2008, live within a quarter mile of the station while only 43 percent of riders live in that close proximity in 2005. The proportion of riders who lived with half and one mile radius from the station actually decreased from 2005 to 2008 but a larger portion of people came from a longer distance, three miles or more, which may be an indication that more people drive to HBLR stations as more parking spaces become available.
0%
10%
20%
30%
40%
50%
60%
Less than1/4 mile
1/4 – 1/2mile
1/2 – 1mile
1 – 3 miles Over 3miles
2005
2008
Figure 40. Distance from the stations

42
SUMMARY In our effort to assist NJ TRANSIT and NJDOT explore the customer impact and ridership retention of the newly extended HBLRT in the northern end, the research team conducted a platform survey; analyzed the survey data; and compared the basic ridership profile with that of general residents along the corridor. The project team also presented the travel patterns, including trip purpose, frequencies, mode shift and reasons behind these shifts. After comparing the data gathered in both 2005 and 2008 surveys, the research team highlighted the subtle changes in terms of demographic and socio-economic status of HBLR riders. The analysis results also demonstrated the ridership retention power of the newly extended segments. Besides the unmistakable trend of ridership growth, certain observations obtained in this survey deserve further investigation, such as the increased portion of people who live less than a quarter mile from the station or the income level shifts of riders from 2005 to 2008. It is important to explore whether such differences were caused by different populations, such as the populations traveling northbound versus the population traveling southbound, or the system–wide population versus the Tonnelle Branch population, or if there are true changes in the characteristics of the population between 2005 and 2008. Being the largest statewide transit agency, NJ TRANSIT has always paid close attention to the ridership impacts and the retention rate of their transit system. The tradition will no doubt continue in the future
43
REFERENCE Richardson, A.; E. Ampt, and A. Meyburg, Survey Method for Transport Planning. Eucalyptus Press, Melbourne, Australia, 1995 Meyer, M.; and E. Miller, Urban Transportation Planning, Second Edition. McGraw-Hill., New York, 2001 Resource Systems Group Inc, “2006 Trans-Hudson Crossings Origin-Destination Survey”, June 2007 Liu, R. “Travel Behavior Changes Associated with Newly Extended LRT Services”, Technical Memorandum I, Hudson Bergen Light Rail Ridership Impact and Retention Study. Submitted to New Jersey Department of Transportation/Federal Highway Administration, submitted by New Jersey Institute of Technology, 56 p. December 2008. U.S. Census Bureau. “Census 2000 Summary File 1 (SF1) 100-Percent Data”. Retrieved 15th March 2009 from U.S. Census http://factfinder.census.gov. New Jersey Transit. “New Light Rail Stations open in Union City and North Bergen“, 2006

44
APPENDIX 1. SURVEY INSTRUMENT If you would like to enter our drawing for one of two monthly passes, please include your name, address, phone number and e-mail:
____________________________________________________________________ Name
______________________________________________________________
______ Number & Street
______________________________________________________________
______ Town/Municipality/Boro State & ZIP Code ______________________________
_____________________________ Day Phone Evening Phone
____________________________________________________________________ Email address
Customer Survey
NJ TRANSIT is conducting this survey to better understand your travel needs. Please complete this survey and return it to a survey agent or drop it in a collection box located at a Hudson-Bergen Light Rail station. You can also mail it to us in the postage paid envelope provided. All responses will be kept confidential.
To show our appreciation for your help, we will enter your name in a drawing to win one of two monthly passes or equivalent transit fares.
Please be assured that all information you provide is strictly for internal NJ TRANSIT use
and will not be sold to any outside agency.
Research One Penn Plaza East Newark, NJ 07105
45
FOR YOUR HUDSON-BERGEN LIGHT RAIL TRIP TODAY...
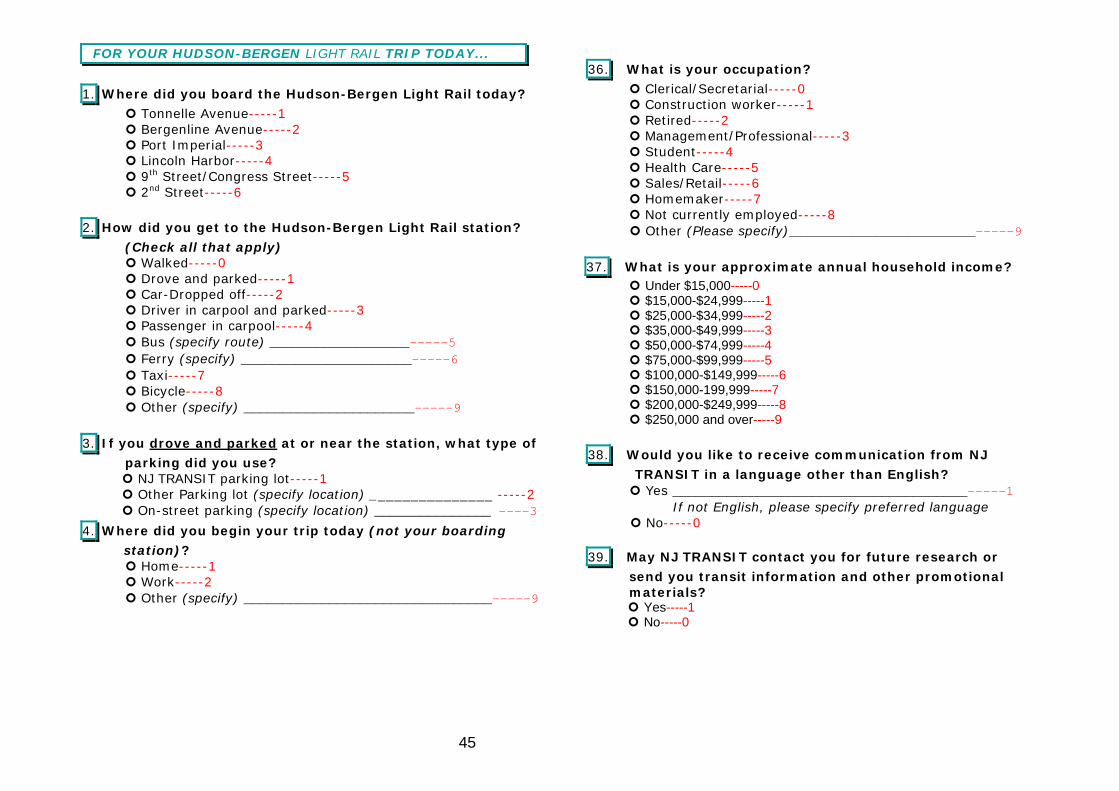
1. Where did you board the Hudson-Bergen Light Rail today? Tonnelle Avenue-----1 Bergenline Avenue-----2 Port Imperial-----3 Lincoln Harbor-----4 9th Street/Congress Street-----5 2nd Street-----6
2. How did you get to the Hudson-Bergen Light Rail station?
(Check all that apply) Walked-----0 Drove and parked-----1 Car-Dropped off-----2 Driver in carpool and parked-----3 Passenger in carpool-----4 Bus (specify route) __________________-----5 Ferry (specify) ______________________-----6 Taxi-----7 Bicycle-----8 Other (specify) ______________________-----9
3. If you drove and parked at or near the station, what type of parking did you use?
NJ TRANSIT parking lot-----1 Other Parking lot (specify location) _______________ -----2 On-street parking (specify location) _______________ ----3
4. Where did you begin your trip today (not your boarding station)?
Home-----1 Work-----2 Other (specify) ________________________________-----9
36. What is your occupation? Clerical/Secretarial-----0 Construction worker-----1 Retired-----2 Management/Professional-----3 Student-----4 Health Care-----5 Sales/Retail-----6 Homemaker-----7 Not currently employed-----8
Other (Please specify)______________________________-----9
37. What is your approximate annual household income? Under $15,000-----0 $15,000-$24,999-----1 $25,000-$34,999-----2 $35,000-$49,999-----3 $50,000-$74,999-----4 $75,000-$99,999-----5 $100,000-$149,999-----6 $150,000-199,999-----7 $200,000-$249,999-----8 $250,000 and over-----9
38. Would you like to receive communication from NJ
TRANSIT in a language other than English? Yes ______________________________________-----1
If not English, please specify preferred language No-----0
39. May NJ TRANSIT contact you for future research or
send you transit information and other promotional materials?
Yes-----1 No-----0

46
30. Do you own or rent your current home?
Own-----0 Rent-----1
31. How long have you lived at your current address?
Less than 6 months-----1 6 months to less than a year-----2 Between 1 and 2 years-----3 Between 2 and 5 years-----4 Between 5 and 10 years-----5 More than 10 years-----6
32. If you moved within the last five years, how important
was the availability of the Hudson-Bergen Light Rail service in your decision to move?
Very Important-----1 Somewhat Important-----2 Somewhat Unimportant-----3 Not Important at all-----0
33. Does your business/employer subsidize any part of your commuting expenses? (Please select in all circles that apply) Transit expenses How much are you reimbursed-----1
per month$_______________ Parking-----2 No commuting expenses are reimbursed-----0
34. Are you of Hispanic/Latino origin? No-----0 Yes_________________________________________-----1
Please specify (e.g. Puerto Rican,Cuban)
35. What is your race? (Please select all that apply) White-----1 American Indian, Eskimo, or Aleut-----2 Black or African American-----3 Asian or Pacific Islander-----4 Other (specify)________________________________________-----9
5. What is that address of the place you began your trip
today?
_____________________________________________________________
Number & Street/Intersection/Landmark ____________________________________________________________ Town/Municipality/Boro State & ZIP Code
6. How far is this address from the Hudson-Bergen Light
Rail station? Less than 1/4 mile-----1 1/4 – 1/2 mile-----2 1/2 – 1 mile-----3 1 – 3 miles-----4 Over 3 miles-----5
7. Where are you going (your final destination)?
Home-----1 Work-----2 Other (specify) ____________________________-----9
8. What is the address of the place you are going to?
______________________________________________________ Number & Street/Intersection/Landmark ______________________________________________________
Town/Municipality/Boro State & ZIP Code 9. Where will you (finally) get off this Hudson-Bergen
Light Rail train? Bergenline Avenue-----1 Marin Boulevard-----12 Port Imperial-----2 Jersey Avenue-----13 Lincoln Harbor-----3 Liberty State Park-----14 9th Street/Congress Street-4 Richard Street-----15 2nd Street-----5 Danforth Avenue-----16 Hoboken Terminal-----6 45th Street-----17 Pavonia-Newport-----7 34th Street-----18
Harsimus Cove-----8 22nd Street-----19 Harborside Financial Center-9 Garfield Avenue-----20 Exchange Place-----10 Martin Luther King Drive-21 Essex Street-----11 Westside Avenue-----22

47
PLEASE ANSWER ONLY IF YOUR FINAL DESTINATION IS IN NEW JERSEY . . .
10. How will you reach your final destination in New Jersey? (Check all that apply)
Walk-----1 Drive parked car/car pool-----2 Car-Picked up-----3 Bus (specify route) _________________-----4 NJ TRANSIT train (specify deboarding station)_______-----5 PATH (specify deboarding station) ________________-----6 Taxi-----7 Bicycle-----8 Other (specify) _______________________________ -----9
PLEASE ANSWER IF YOUR FINAL DESTINATION IS IN NEW YORK CITY . . .
11. How will you reach New York City? (Check all that
apply)
Take the PATH (PATH boarding station?)______________---1 (PATH exiting station?)______________
Take the Ferry (Which Ferry?)_______________________---2 (Ferry exiting location?)________________
Take an NJ TRANSIT bus (Which route?)______________---3
Take another bus (Which route?)____________________---4
Take NYC Subway (Which line?)_____________________---5
Other (Please specify)____________________________---9
TELL US ABOUT YOURSELF. . .
25. Are you ... ?
Male-----0 Female-----1
26. What is your age?
Under 18 years-----1 18 – 24 years-----2 25 – 34 years-----3 35 – 44 years-----4 45-54 years-----5 55-64 years-----6 65 years and over-----7
27. How many people are there in your household? One-----1 Two-----2 Three-----3 Four-----4 Five or more-----5
28. How many automobiles does your household own? None-----0 One-----1 Two-----2 Three or more-----3
29. How many children under 18 are there in your household? One-----1 Two-----2 Three-----3 Four-----4 Five or more-----5

48
24. On a scale of 0 to 10, please rate Hudson-Bergen Light
Rail on the following attributes of service, where 0=Unacceptable, 5=Acceptable and 10=Excellent (n/a=Not applicable)
ALL CUSTOMERS . . .
12. How did you find out about this service?
(Please check only one) Saw construction/the trains running-----0 Word of mouth-----1 Employer-----2 Posters/Ads-----3 Transit day/Customer forum-----4 Direct mail----5 NJ TRANSIT Website-----6 Billboard-----7 Brochure-----8 Newspaper (Please specify)_____________________-----9 Other (Please specify)_________________________-----10
13. When did you start riding the Hudson-Bergen Light Rail? First time riding-----1 Less than 6 months-----2 6 months to 1 year-----3 1 - 2 years-----4 2 - 4 years-----5 5 - 8 years-----6
14. How did you make this trip before you started using the
Hudson-Bergen Light Rail? (Please check all that apply)
Drove alone to final destination-----0 Carpooled-----1
Taxi-----2 Car-Dropped off (specify location)________________-----3 Bus (Which route?)____________________________-----4 NJ TRANSIT Train (Which exiting station?)_________-----5 PATH (Which exiting station?)___________________-----6 Started making this trip because of Hudson-Bergen Light Rail-7 Started making this trip after the Hudson-Bergen Light Rail
opened because I moved to area-----8 Other (Please specify)__________________________-----9
Parking Availability n/a 0 1 2 3 4 5 6 7 8 9 10 Seating Availability n/a 0 1 2 3 4 5 6 7 8 9 10
Standing Room Availability
n/a 0 1 2 3 4 5 6 7 8 9 10
Frequency n/a 0 1 2 3 4 5 6 7 8 9 10 Connections to
Intermediate HBLR Stations
n/a 0 1 2 3 4 5 6 7 8 9 10
Connections to NJ TRANSIT Rail at
Hoboken n/a 0 1 2 3 4 5 6 7 8 9 10
Connections to the Ferry at Hoboken n/a 0 1 2 3 4 5 6 7 8 9 10
Connections to PATH n/a 0 1 2 3 4 5 6 7 8 9 10 On-time Performance n/a 0 1 2 3 4 5 6 7 8 9 10 Mechanical Reliability n/a 0 1 2 3 4 5 6 7 8 9 10 Safety and Personal
Security n/a 0 1 2 3 4 5 6 7 8 9 10
Availability of Transit Information n/a 0 1 2 3 4 5 6 7 8 9 10
Customer Communication n/a 0 1 2 3 4 5 6 7 8 9 10
Travel Time n/a 0 1 2 3 4 5 6 7 8 9 10 Fares n/a 0 1 2 3 4 5 6 7 8 9 10
Ease of Using Ticket Vending Machines n/a 0 1 2 3 4 5 6 7 8 9 10
Ease of Using Validation Machines n/a 0 1 2 3 4 5 6 7 8 9 10
Fare Inspector Process n/a 0 1 2 3 4 5 6 7 8 9 10 Fare Inspector performance n/a 0 1 2 3 4 5 6 7 8 9 10
Overall Satisfaction with HBLR
n/a 0 1 2 3 4 5 6 7 8 9 10
Code n 0 1 2 3 4 5 6 7 8 9 10
Unacceptable Acceptable Excellent

49
15. If you switched from another mode of travel to the Hudson-Bergen Light Rail, why did you switch?
(Please check primary reason only) Cost of gasoline-----1 Cost of parking-----2 Convenience-----3 Frequency of service-----4 Overcrowding on bus/train-----5 Cheaper than other services-----6 New employment destination-----7 Travel time savings compared to previous mode-----8 Other (specify)_________________________________-----9
16. What type of Hudson-Bergen Light Rail ticket are you using for this trip? Monthly-----0 Monthly/Parking permit--1 Please fill in how many ONE-WAY Monthly with Ferry-----2 trips you make per month:_____ NJ TRANSIT Rail Monthly--3
One-way-----4 Round-trip (2 One-way)-----5 Round-trip (2 One-way)/ daily parking-----6 10-Trip-----7 Discounted Senior Citizens/Customers with a disability/ Children-----8
Other (specify)__________________________________-----9
17. Where did you purchase the Hudson-Bergen Light Rail ticket you are using for this trip today?
Ticket Vending Machine-----1 Mail-----2 Quik-Tik on NJTRANSIT.com-----3 NJ TRANSIT Rail Ticket Agent (specify location)_______-----4 Other (specify)__________________________________-----9
18. How often do you ride the Hudson-Bergen Light Rail? First time-----1 Less than 1 day a month-----2 1-3 days a month-----3 1-2 days a week-----4 3-4 days a week-----5 5 or more days a week-----6
19. What is the main purpose of this trip you are making
today? Work -----1
Company business-----2 Shopping-----3 School-----4 Personal business-----5 Recreation-----6 Other (specify)________-----9
20. Which of the following statements best applies to you?
I have no other way to travel, so I use the Hudson-Bergen Light Rail-----1
I use the Hudson-Bergen Light Rail because it is the best choice for me, even though there are other ways I could travel-----2
I usually use another type of transportation, but I occasionally take the Hudson-Bergen Light Rail-----3
FOR YOUR TYPICAL RETURN TRIP . . .
21. How do you typically travel for your return trip?
Travel the same way in opposite direction-----1 Take a bus (Which route?)______________________-----2 Other (specify)_______________________________-----9
TELL US ABOUT OUR SERVICE . . .
22. Based on your travel experience on the Hudson-Bergen Light Rail, how likely are you to recommend the service to a friend or relative?
Very Likely-----1 Somewhat Likely-----2 Do not Know-----3 Somewhat Unlikely-----4 Very Unlikely-----5
23. What is the ONE thing that NJ TRANSIT can do to improve Hudson-Bergen Light Rail?
__________________________________________________