hudbay minerals inc. · hudbay minerals inc. condensed consolidated balance sheet (unaudited and in...
TRANSCRIPT
Unaudited Condensed Consolidated Interim Financial Statements(In Canadian dollars)
HUDBAY MINERALS INC.
For the three and nine months ended September 30, 2011

HUDBAY MINERALS INC.Condensed Consolidated Balance Sheet(Unaudited and in thousands of Canadian dollars)
Sep. 30, Dec. 31, Jan. 1,Note 2011 2010 2010
AssetsCurrent assets
Cash and cash equivalents $ 871,089 $ 901,693 $ 886,814Trade and other receivables 33,719 78,168 40,185Inventories 6 95,909 115,642 125,940Prepaid expenses and other current assets 10,822 9,994 7,990Other financial assets 7 3,723 3,795 955Taxes receivable 11,597 99 15,313Assets held for sale 9 19,012 - -
1,045,871 1,109,391 1,077,197Inventories 6 5,461 6,052 5,188Prepaid expenses 1,389 1,884 -Other financial assets 7 102,988 117,686 86,676Intangible computer software assets 11,193 7,083 1,967Property, plant and equipment 4, 8 1,148,369 817,558 796,669Goodwill 4 70,340 - -Deferred tax assets 10b 17,155 32,406 44,609
$ 2,402,766 $ 2,092,060 $ 2,012,306
LiabilitiesCurrent liabilities
Trade and other payables $ 159,652 $ 133,597 111,802Taxes payable 3,175 33,088 -Derivative liabilities 2,253 2,767 2,907Other liabilities 17,251 56,453 42,660Liabilities associated with assets held for sale 9 2,718 - -
185,049 225,905 157,369Pension obligations - 822 63Other employee benefits 99,363 93,066 87,744Provisions 133,523 112,514 81,021Derivative liabilities 178 1,632 7,068Deferred tax liabilities 10b 188,571 24,302 29,457
606,684 458,241 362,722
EquityShare capital 11b 1,020,126 642,161 656,427Reserves 69,961 50,772 33,280Retained earnings 702,204 931,464 958,518Equity attributable to owners of the Company 1,792,291 1,624,397 1,648,225Non-controlling interests 15 3,791 9,422 1,359
1,796,082 1,633,819 1,649,584
$ 2,402,766 $ 2,092,060 $ 2,012,306
Capital commitments (note 17)
Page 7
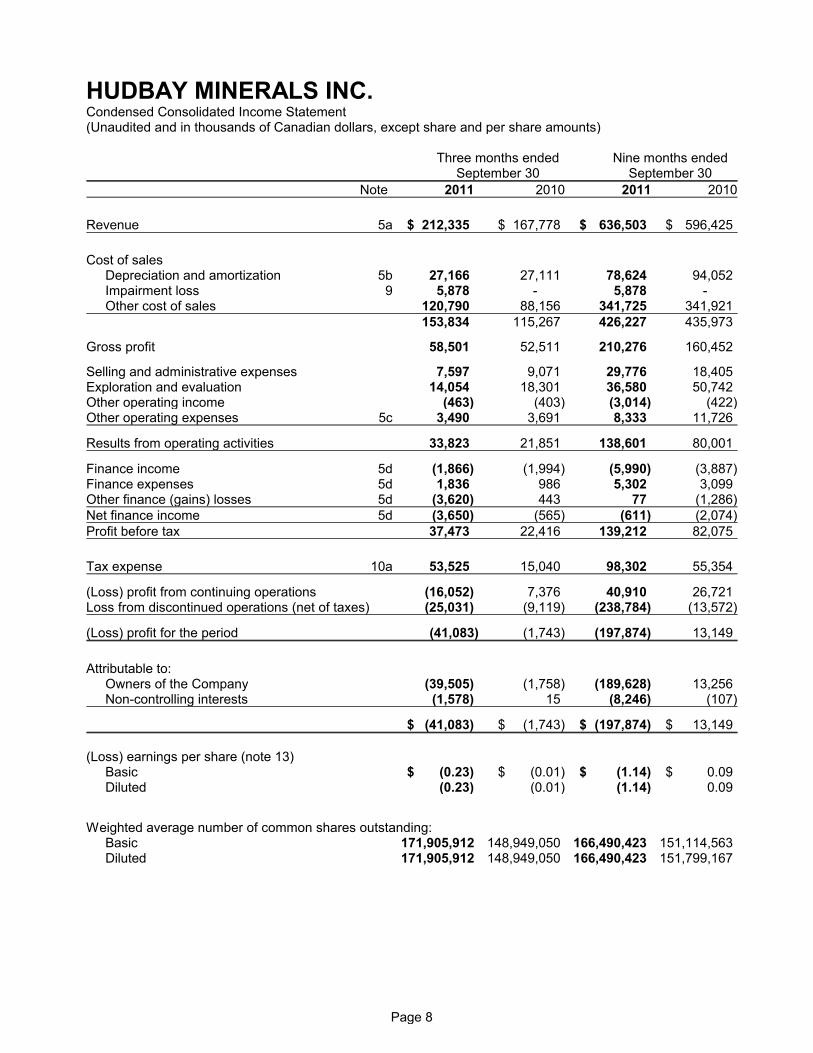
HUDBAY MINERALS INC.Condensed Consolidated Income Statement(Unaudited and in thousands of Canadian dollars, except share and per share amounts)
Three months ended Nine months endedSeptember 30 September 30
Note 2011 2010 2011 2010
Revenue 5a $ 212,335 $ 167,778 $ 636,503 $ 596,425
Cost of salesDepreciation and amortization 5b 27,166 27,111 78,624 94,052Impairment loss 9 5,878 - 5,878 -Other cost of sales 120,790 88,156 341,725 341,921
153,834 115,267 426,227 435,973
Gross profit 58,501 52,511 210,276 160,452
Selling and administrative expenses 7,597 9,071 29,776 18,405Exploration and evaluation 14,054 18,301 36,580 50,742Other operating income (463) (403) (3,014) (422)Other operating expenses 5c 3,490 3,691 8,333 11,726
Results from operating activities 33,823 21,851 138,601 80,001
Finance income 5d (1,866) (1,994) (5,990) (3,887)Finance expenses 5d 1,836 986 5,302 3,099Other finance (gains) losses 5d (3,620) 443 77 (1,286)Net finance income 5d (3,650) (565) (611) (2,074)Profit before tax 37,473 22,416 139,212 82,075
Tax expense 10a 53,525 15,040 98,302 55,354
(Loss) profit from continuing operations (16,052) 7,376 40,910 26,721Loss from discontinued operations (net of taxes) (25,031) (9,119) (238,784) (13,572)
(Loss) profit for the period (41,083) (1,743) (197,874) 13,149
Attributable to:Owners of the Company (39,505) (1,758) (189,628) 13,256Non-controlling interests (1,578) 15 (8,246) (107)
$ (41,083) $ (1,743) $ (197,874) $ 13,149
(Loss) earnings per share (note 13) Basic $ (0.23) $ (0.01) $ (1.14) $ 0.09Diluted (0.23) (0.01) (1.14) 0.09
Weighted average number of common shares outstanding:Basic 171,905,912 148,949,050 166,490,423 151,114,563Diluted 171,905,912 148,949,050 166,490,423 151,799,167
Page 8
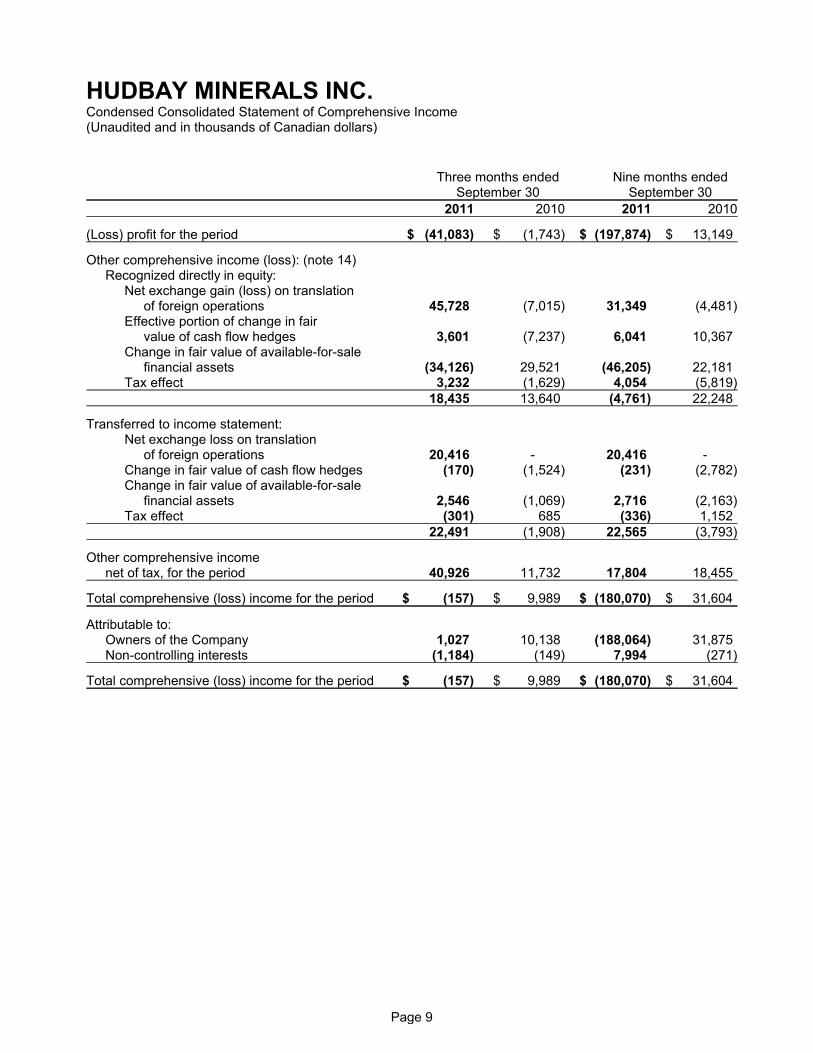
HUDBAY MINERALS INC.Condensed Consolidated Statement of Comprehensive Income(Unaudited and in thousands of Canadian dollars)
Three months ended Nine months endedSeptember 30 September 30
2011 2010 2011 2010
(Loss) profit for the period $ (41,083) $ (1,743) $ (197,874) $ 13,149
Other comprehensive income (loss): (note 14) Recognized directly in equity:
Net exchange gain (loss) on translationof foreign operations 45,728 (7,015) 31,349 (4,481)
Effective portion of change in fairvalue of cash flow hedges 3,601 (7,237) 6,041 10,367
Change in fair value of available-for-salefinancial assets (34,126) 29,521 (46,205) 22,181
Tax effect 3,232 (1,629) 4,054 (5,819)18,435 13,640 (4,761) 22,248
Transferred to income statement:Net exchange loss on translation
of foreign operations 20,416 - 20,416 -Change in fair value of cash flow hedges (170) (1,524) (231) (2,782)Change in fair value of available-for-sale
financial assets 2,546 (1,069) 2,716 (2,163)Tax effect (301) 685 (336) 1,152
22,491 (1,908) 22,565 (3,793)
Other comprehensive incomenet of tax, for the period 40,926 11,732 17,804 18,455
Total comprehensive (loss) income for the period $ (157) $ 9,989 $ (180,070) $ 31,604
Attributable to: Owners of the Company 1,027 10,138 (188,064) 31,875Non-controlling interests (1,184) (149) 7,994 (271)
Total comprehensive (loss) income for the period $ (157) $ 9,989 $ (180,070) $ 31,604
Page 9
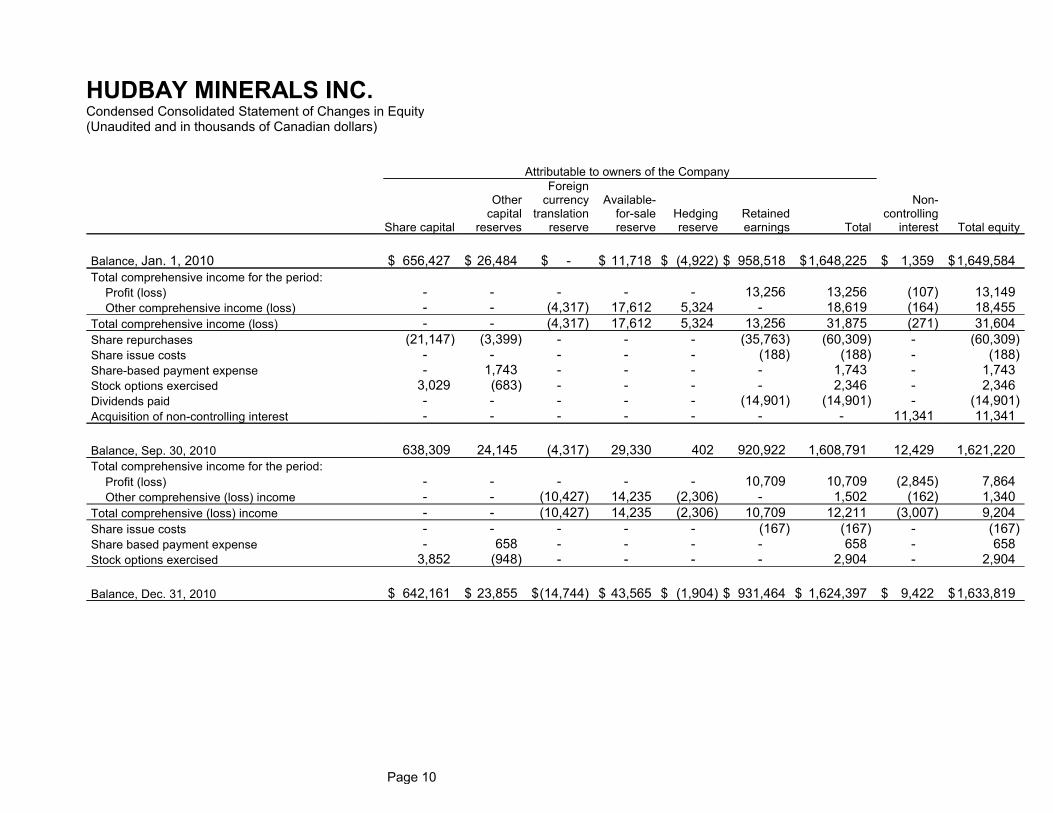
HUDBAY MINERALS INC.Condensed Consolidated Statement of Changes in Equity(Unaudited and in thousands of Canadian dollars)
Attributable to owners of the Company
Share capital
Othercapital
reserves
Foreigncurrency
translationreserve
Available-for-salereserve
Hedgingreserve
Retainedearnings Total
Non-controlling
interest Total equity
Balance, Jan. 1, 2010 $ 656,427 $ 26,484 $ - $ 11,718 $ (4,922) $ 958,518 $1,648,225 $ 1,359 $1,649,584Total comprehensive income for the period:
Profit (loss) - - - - - 13,256 13,256 (107) 13,149Other comprehensive income (loss) - - (4,317) 17,612 5,324 - 18,619 (164) 18,455
Total comprehensive income (loss) - - (4,317) 17,612 5,324 13,256 31,875 (271) 31,604Share repurchases (21,147) (3,399) - - - (35,763) (60,309) - (60,309)Share issue costs - - - - - (188) (188) - (188)Share-based payment expense - 1,743 - - - - 1,743 - 1,743Stock options exercised 3,029 (683) - - - - 2,346 - 2,346Dividends paid - - - - - (14,901) (14,901) - (14,901)Acquisition of non-controlling interest - - - - - - - 11,341 11,341
Balance, Sep. 30, 2010 638,309 24,145 (4,317) 29,330 402 920,922 1,608,791 12,429 1,621,220Total comprehensive income for the period:
Profit (loss) - - - - - 10,709 10,709 (2,845) 7,864Other comprehensive (loss) income - - (10,427) 14,235 (2,306) - 1,502 (162) 1,340
Total comprehensive (loss) income - - (10,427) 14,235 (2,306) 10,709 12,211 (3,007) 9,204Share issue costs - - - - - (167) (167) - (167)Share based payment expense - 658 - - - - 658 - 658Stock options exercised 3,852 (948) - - - - 2,904 - 2,904
Balance, Dec. 31, 2010 $ 642,161 $ 23,855 $(14,744) $ 43,565 $ (1,904) $ 931,464 $ 1,624,397 $ 9,422 $1,633,819
Page 10
HUDBAY MINERALS INC.Condensed Consolidated Statement of Changes in Equity(Unaudited and in thousands of Canadian dollars)
Attributable to owners of the Company
Share capital
Othercapital
reserves
Foreigncurrency
translationreserve
Available-for-salereserve
Hedgingreserve
Retainedearnings Total
Non-controlling
interest Total equity
Balance, Jan. 1 2011 $ 642,161 $ 23,855 $(14,744) $ 43,565 $ (1,904) $ 931,464 $ 1,624,397 $ 9,422 $1,633,819Total comprehensive income for the period:
Loss - - - - - (189,629) (189,629) (8,245) (197,874)Other comprehensive (loss) income - - 51,513 (38,034) 4,073 - 17,552 252 17,804
Total comprehensive loss - - 51,513 (38,034) 4,073 (189,629) (172,077) (7,993) (180,070)Shares issued for acquisition 345,119 - - - - - 345,119 - 345,119Share issue costs (239) - - - - - (239) - (239)Share-based payment expense - 1,700 - - - - 1,700 - 1,700Stock options exercised 216 (63) - - - - 153 - 153Dividends paid - - - - - (34,346) (34,346) - (34,346)Acquisition/disposition of non-controlling interest 32,869 - - - - (5,285) 27,584 2,362 29,946
Balance, Sep. 30, 2011 $1,020,126 $ 25,492 $ 36,769 $ 5,531 $ 2,169 $ 702,204 $ 1,792,291 $ 3,791 $ 1,796,082
Page 11
HUDBAY MINERALS INC.Condensed Consolidated Statement of Cash Flows(Unaudited and in thousands of Canadian dollars)
Three months ended Nine months endedSeptember 30 September 30
Note 2011 2010 2011 2010
Cash generated from (used in) operating activities:Profit before tax $ 37,473 $ 22,416 $ 139,212 $ 82,075Loss from discontinued operations (25,031) (9,119) (238,784) (13,572)
12,442 13,297 (99,572) 68,503Items not affecting cash:
Depreciation and amortization 27,271 27,174 79,030 94,193Equity-settled share-based payment expense (697) 2,936 1,871 4,012Net finance costs (116) (895) (688) (430)Change in fair value of derivatives 5,626 (6,095) 5,864 (2,945)Items reclassified from other
comprehensive income 3,766 (2,592) 2,485 (4,944)Gain on disposition (36) (22) (2,463) (22)Impairment losses 5d, 9 8,424 - 9,814 -Loss from discontinued operations 25,031 9,119 238,784 13,572Other (5,692) (4,857) (11,516) (12,778)Operating interest paid (691) (254) (691) (264)
Operating cash flows of discontinued operations (2,058) (243) (2,126) (665)Change in non-cash working capital 18 23,076 (12,061) 20,701 5,252Taxes paid (17,886) (6,619) (88,377) (8,857)
78,460 18,888 153,116 154,627
Cash generated from (used in) investing activities:Interest received - 1,673 4,464 3,437Proceeds on disposition of assets 136,896 6,030 139,802 8,051Acquisition of property, plant and equipment (68,385) (30,114) (158,106) (79,381)Acquisition of intangible assets (860) (1,260) (4,781) (2,562)Acquisition of investments (8,650) (38,348) (40,455) (40,278)Acquisition of subsidiary, net
of cash acquired 4 - - (94,855) -Release of (additions to) restricted cash (170) (580) 135 (2,512)Sale of short-term investments - - 20,112 -Acquisition of non-controlling interests 4 (2,320) - (11,476) -Investing cash flows of discontinued operations - (403) (7,163) (1,828)
56,511 (63,002) (152,323) (115,073)
Cash generated from (used in) financing activities:Repurchase of common shares - - - (60,309)Share issue costs - - (237) -Proceeds from exercise of stock options 83 1,387 145 2,351Dividends paid 11 (17,194) (14,901) (34,346) (14,901)
(17,111) (13,514) (34,438) (72,859)
Effect of movement in exchange rates on cash and cash equivalents 5,519 (2,411) 3,041 (1,770)
Net increase (decrease) in cash and cash equivalents 123,379 (60,039) (30,604) (35,075)Cash and cash equivalents, beginning of period 747,710 911,778 901,693 886,814
Cash and cash equivalents, end of period $ 871,089 $ 851,739 $ 871,089 $ 851,739
For supplemental information, see note 18.
Page 12
HUDBAY MINERALS INC.Notes to Unaudited Condensed Consolidated Interim Financial Statements(Unaudited and in thousands of Canadian dollars)For the three and nine months ended September 30, 2011
1. Reporting entity
HudBay Minerals Inc. (the "Company") is a Canadian company continued under the Canada BusinessCorporations Act on October 25, 2005. The address of the Company's principal executive office is 25 YorkStreet, Suite 800, Toronto, Ontario. The condensed consolidated interim financial statements of theCompany for the period ended September 30, 2011 contemplate the financial position and results ofoperations of the Company and its subsidiaries (together referred to as the “Group” or “HudBay” andindividually as “Group entities”).
Significant subsidiaries include Hudson Bay Mining and Smelting Co., Limited (“HBMS”), Hudson BayExploration and Development Company Limited (“HBED”), HudBay Marketing and Sales Inc. (“HMS”),HudBay Peru Inc. ("HudBay Peru") (previously named Norsemont Mining Inc.), St. Lawrence ZincCompany LLC (“St. Lawrence”), HudBay Michigan Inc. and HudBay Metal Marketing Inc.
HudBay is a Canadian integrated mining company with assets in North and South America. Through itssubsidiaries, HudBay owns copper/zinc/gold mines, ore concentrators and zinc production facilities innorthern Manitoba and Saskatchewan and a copper project in Peru. HudBay produces copper concentrate(containing copper, gold and silver) and zinc metal. HudBay's shares are listed on the Toronto and NewYork stock exchanges under the symbol "HBM".
These condensed consolidated interim financial statements have been prepared on a going concern basisas management believes there are no uncertainties that lead to significant doubt the entity can continueas a going concern in the foreseeable future.
Management does not consider the impact of seasonality on operations to be significant on thecondensed consolidated interim financial statements.
Page 13

HUDBAY MINERALS INC.Notes to Unaudited Condensed Consolidated Interim Financial Statements(Unaudited and in thousands of Canadian dollars)For the three and nine months ended September 30, 2011
2. Basis of preparation
(a) Statement of compliance:
The Company has adopted International Financial Reporting Standards (“IFRSs”) as issued by theInternational Accounting Standards Board ("IASB") effective for the year ended December 31, 2011.
These are the Company's IFRS condensed consolidated interim financial statements for part of theperiod covered by the first IFRS consolidated annual financial statements. These condensedconsolidated interim financial statements have been prepared in accordance with IAS 34 InterimFinancial Reporting, and IFRS 1 First-time Adoption of International Financial Reporting Standardshas been applied. They do not include all of the information required for full annual financialstatements and should be read in conjunction with the Group's first IFRS condensed consolidatedinterim financial statements for the three months ended March 31, 2011. The Group's consolidatedfinancial statements for the year ended December 31, 2010 were prepared under Canadian generallyaccepted accounting principles ("GAAP") and are available at www.sedar.com.
Previously, the Company prepared its consolidated annual and condensed consolidated interimfinancial statements in accordance with Canadian GAAP.
Note 20 contains an explanation of the effect the transition to IFRSs had on the Group’s reportedfinancial position, financial performance and cash flows. This note includes reconciliations of equityand comprehensive income for comparative periods reported under GAAP to those reported forthose periods and at the date of transition under IFRS.
The Board of Directors approved these condensed consolidated interim financial statements onNovember 2, 2011.
(b) Functional and presentation currency:
The Group's condensed consolidated interim financial statements are presented in Canadian dollars,which is the Company’s functional currency. All values are rounded to the nearest thousand ($000)except where otherwise indicated.
(c) Use of estimates and judgments:
The preparation of the condensed consolidated interim financial statements in conformity with IFRSsrequires management to make judgments, estimates and assumptions that affect the application ofaccounting policies and reported amounts of assets, liabilities and disclosure of contingent assetsand liabilities at the date of the condensed consolidated interim financial statements and reportedamounts of revenue and expenses during the reporting period. Actual results may differ from theseestimates.
Significant areas requiring management judgment include estimates of ore reserves and resources,which, for example, affect the carrying value of property, plant and equipment; units-of-productiondepreciation; plant and equipment estimated useful lives and residual values; mining propertiesexpenditures capitalized; cost allocations for mine development; acquisition method accounting;
Page 14
HUDBAY MINERALS INC.Notes to Unaudited Condensed Consolidated Interim Financial Statements(Unaudited and in thousands of Canadian dollars)For the three and nine months ended September 30, 2011
estimates of fair value of financial instruments; in-process inventory quantities and provision forinventory obsolescence; recoverability of exploration and evaluation assets; assessments related toimpairment; pensions and other employee benefits; decommissioning, restoration and similarliabilities; taxes; share-based payment expense; contingent liabilities; assaying used to determinerevenue; and determinations of functional currency.
Estimates and underlying assumptions are reviewed on an ongoing basis, and are based onmanagement’s experience and other factors, including expectations of future events that are believedto be reasonable under the circumstances. Revisions to accounting estimates are recognized in theperiod in which the estimates are revised and in any future periods affected.
3. Significant accounting policies
The condensed consolidated interim financial statements reflect standards and interpretations anticipatedto be in effect at December 31, 2011 that are required to be applied by an entity with an annual periodbeginning on or after January 1, 2010. For a description of the significant accounting policies applied, referto note 3 to the Group's condensed consolidated interim financial statements for the three months endedMarch 31, 2011. Any subsequent changes to IFRSs that become effective and are adopted for theDecember 31, 2011 consolidated annual financial statements could result in revisions to accountingpolicies applied in these condensed consolidated interim financial statements and, if applicable, theopening balance sheet and reconciliations.
New standards and interpretations not yet adopted
IFRS 9 Financial Instruments
In November 2009, the IASB issued IFRS 9 Financial Instruments as the first step in its project to replaceIAS 39 Financial Instruments: Recognition and Measurement. IFRS 9 retains but simplifies the mixedmeasurement model and establishes two primary measurement categories for financial assets: amortizedcost and fair value. The basis of classification depends on an entity’s business model and the contractualcash flow of the financial asset. Gains and losses on remeasurement of financial assets measured at fairvalue will be recognized in profit or loss, except that for an investment in an equity instrument which is notheld-for-trading, IFRS 9 provides, on initial recognition, an irrevocable election to present all fair valuechanges from the investment in other comprehensive income (“OCI”). Amounts presented in OCI will notbe reclassified to profit or loss at a later date. The new standard also requires use of a single impairmentmethod, replacing the multiple impairment methods in IAS 39 and amends some of the requirements ofIFRS 7 Financial Instruments: Disclosures.
IFRS 9 (2010) added guidance to IFRS 9 (2009) on the classification and measurement of financialliabilities, and this guidance is consistent with the guidance in IAS 39, except for changes related tofinancial liabilities measured at fair value under the fair value option and derivative liabilities that are linkedto and must be settled by delivery of an unquoted equity instrument.
IFRS 9 will be effective for annual periods beginning on or after January 1, 2013, with early adoptionpermitted. The Group has not yet determined the effect of adoption of IFRS 9 on its consolidated financialstatements.
Page 15
HUDBAY MINERALS INC.Notes to Unaudited Condensed Consolidated Interim Financial Statements(Unaudited and in thousands of Canadian dollars)For the three and nine months ended September 30, 2011
Amendments to IAS 12 Deferred Tax: Recovery of Underlying Assets
In December 2010, the IASB published Deferred Tax: Recovery of Underlying Assets Amendments to IAS12. This amendment introduces an exception to the current measurement principles of deferred taxassets and liabilities arising from investment property measured using the fair value model in accordancewith IAS 40 Investment Property. The exception also applies to investment properties acquired in abusiness combination accounted for in accordance with IFRS 3 Business Combinations provided theacquirer subsequently measures these assets applying the fair value model. The effective date for theamendment is for periods beginning on or after January 1, 2012 and is applied retrospectively. Earlyapplication is permitted. The Group does not expect the amendment to have a material effect on itsconsolidated financial statements.
Amendments to IFRS 7 Disclosures – Transfers of Financial Assets
In October 2010 the IASB issued Amendments to IFRS 7 Disclosures - Transfers of Financial Assets,which require disclosure of information that enables users of financial statements to understand therelationship between transferred financial assets that are not derecognized in their entirety and theassociated liabilities and to evaluate the nature of, and risks associated with, the entity’s continuinginvolvement in derecognized financial assets. The effective date for the amendment is for periodsbeginning on or after January 1, 2012. The Group does not expect the amendment to have a materialeffect on its consolidated financial statements.
IFRS 10 Consolidated Financial Statements
In May 2011, the IASB issued IFRS 10 Consolidated Financial Statements, which replaces the guidance inIAS 27 Consolidated and Separate Financial Statements and SIC-12 Consolidation - Special PurposeEntities. IAS 27 (2008) survives as IAS 27 (2011) Separate Financial Statements, only to carry forward theexisting accounting requirements for separate financial statements. IFRS 10 provides a single model to beapplied in the control analysis for all investees, including entities that currently are special purpose entitieswithin the scope of SIC-12, stating that an investor controls an investee when it is exposed, or has rights,to variable returns from its involvement with the investee and has the ability to affect those returns throughits power over the investee. In addition, IFRS 10 carries forward the consolidation procedures substantiallyunmodified from IAS 27 (2008). IFRS 10 is effective for annual periods beginning on or after January 1,2013, with early adoption permitted. If an entity applies this Standard earlier, it also applies IFRS 11, IFRS12, IAS 27 (2011) and IAS 28 (2011) at the same time. The Group does not expect the adoption of IFRS10 to have a material effect on its consolidated financial statements based on its current facts andcircumstances.
IFRS 11 Joint Arrangements
In May 2011, the IASB issued IFRS 11 Joint Arrangements, which replaces the guidance in IAS 31Interests in Joint Ventures. IFRS 11 classifies joint arrangements as either joint operations or jointventures based on an entity's rights and obligations. A joint operator will recognize its share of the assets,liabilities, revenue and expenses of the joint operation. A joint venturer will recognize an investment andaccount for that investment using the equity method. Under existing IFRS, entities have the choice toproportionately consolidate or apply the equity method to interests in jointly controlled entities. IFRS 11 iseffective for annual periods beginning on or after January 1, 2013, with early adoption permitted. If anentity applies this Standard earlier, it shall also apply IFRS 10, IFRS 12, IAS 27 (2011) and IAS 28 (2011)at the same time. The Group does not expect the adoption of IFRS 11 to have a material effect on its
Page 16
HUDBAY MINERALS INC.Notes to Unaudited Condensed Consolidated Interim Financial Statements(Unaudited and in thousands of Canadian dollars)For the three and nine months ended September 30, 2011
consolidated financial statements based on its current facts and circumstances.
IFRS 12 Disclosure of Interests in Other Entities
In May 2011, the IASB issued IFRS 12 Disclosure of Interests in Other Entities, which contains disclosurerequirements for entities that have interests in subsidiaries, joint arrangements (i.e., joint operations orjoint ventures), associates and/or unconsolidated structured entities. The required disclosures aim toenable users to evaluate the nature of, and the risks associated with, an entity’s interest in other entities,and the effects of those interests on the entity’s financial position, financial performance and cash flows.IFRS 12 is effective for annual periods beginning on or after January 1, 2013, with early adoptionpermitted. The Group will provide additional disclosures as required and does not otherwise expect theadoption of IFRS 12 to have a material effect on its consolidated financial statements.
IFRS 13 Fair Value Measurement
In May 2011, the IASB published IFRS 13 Fair Value Measurement, which replaces the fair valuemeasurement guidance contained in individual IFRSs with a single source of fair value measurementguidance. It defines fair value as the price that would be received to sell an asset or paid to transfer aliability in an orderly transaction between market participants at the measurement date (i.e., an exit price).The standard establishes a framework for measuring fair value and sets out disclosure requirements forfair value measurements. IFRS 13 is effective prospectively for annual periods beginning on or afterJanuary 1, 2013. The disclosure requirements of IFRS 13 need not be applied in comparative informationfor periods before initial application. The Group has not yet determined the effect of adoption of IFRS 13on its consolidated financial statements.
Amendments to IAS 28 Investments in Associates and Joint Ventures
In May 2011, the IASB issued Amendments to IAS 28 Investments in Associates and Joint Ventures,which carries forward the requirements of IAS 28 (2008), with limited amendments related to associatesand joint ventures held for sale, as well as to changes in interests held in associates and joint ventureswhen an entity retains an interest in the investment. IAS 28 (2011) is effective for annual periodsbeginning on or after January 1, 2013, with early adoption permitted. If an entity applies this Standardearlier, it shall also apply IFRS 10, IFRS 11, IFRS 12 and IAS 27 (2011) at the same time. The Group hasnot yet determined the effect of adoption of the amendments on its consolidated financial statements. TheGroup does not expect the amendments to have a material effect on its consolidated financial statementsbased on the current facts and circumstances.
Amendments to IAS 1 Presentation of Financial Statements: Presentation of Items of OtherComprehensive Income
In June 2011, the IASB issued amendments to IAS 1 Presentation of Financial Statements: Presentationof Items of Other Comprehensive Income. The amendments require separate presentation of the items ofOCI that may be reclassified to profit or loss in the future from those that will never be reclassified to profitor loss. The standard is effective for annual periods beginning on or after July 1, 2012, with early adoptionpermitted. The Group has not yet determined the effect of adoption of the amendments on itsconsolidated financial statements.
Page 17

HUDBAY MINERALS INC.Notes to Unaudited Condensed Consolidated Interim Financial Statements(Unaudited and in thousands of Canadian dollars)For the three and nine months ended September 30, 2011
IAS 19 Employee Benefits
In June 2011, the IASB issued an amended version of IAS 19 Employee Benefits to revise certain aspectsof the accounting for pension plans and other benefits. The amendments eliminate the corridor method ofaccounting for defined benefit plans and require immediate recognition of actuarial gains and losses inOCI; eliminate use of an expected rate of return on plan assets and require use of the discount rate todetermine the interest on the plan asset component of the net interest cost; and set out additionaldisclosure requirements. The standard is effective for annual periods beginning on or after January 1,2013, with early adoption permitted. The Group has not yet determined the effect of adoption of theamendments on its consolidated financial statements.
IFRIC 20, Stripping Costs in the Production Phase of a Surface Mine
In October 2011, the IASB issued IFRIC 20 Stripping Costs in the Production Phase of a Surface Mine,which provides guidance on the accounting for waste removal costs that are incurred in surface miningactivity during the production phase of a mine when two benefits accrue to the entity from the strippingactivity: useable ore that can be used to produce inventory and improved access to further quantities ofmaterial that will be mined in future periods. IFRIC 20 must be applied starting January 1, 2013 with earlyadoption permitted. The Group has not yet determined the effect of adoption of IFRIC 20 on itsconsolidated financial statements.
4. Acquisition of HudBay Peru
On March 1, 2011, the Group obtained control of HudBay Peru (formerly Norsemont Mining Inc.), aCanadian mineral exploration and development company focused on its wholly-owned Constancia copperproject in southern Peru. HudBay obtained control of HudBay Peru by acquiring 90.5% of the share capitaland voting interests in the company. As a result, the Group's equity interest in HudBay Peru increasedfrom 1.2% to 91.7%. On July 5, 2011, HudBay acquired the remaining common shares and now whollyowns HudBay Peru. Acquiring control of HudBay Peru allows the Group an opportunity to develop theConstancia project and significantly increase HudBay's future copper production.
Since acquisition, HudBay Peru contributed a loss of $23,216 to the Group's results. HudBay Peru doesnot currently earn revenue as it is in the development stage. If the acquisition had occurred on January 1,2011, management estimates that consolidated revenue would have been $636,503 and consolidatedloss for the period would have been $198,411. In determining these amounts, management has assumedthat the fair value adjustments, determined provisionally, that arose on the date of acquisition would havebeen the same if the acquisition had occurred on January 1, 2011.
Consideration transferred
The following summarizes the acquisition date fair value of the major classes of consideration transferred:
Cash consideration $ 118,525Equity instruments (20,372,986 common shares) 345,119
Total consideration transferred 463,644Less: cash acquired (23,669)
Total consideration transferred, net of cash acquired $ 439,975
Page 18

HUDBAY MINERALS INC.Notes to Unaudited Condensed Consolidated Interim Financial Statements(Unaudited and in thousands of Canadian dollars)For the three and nine months ended September 30, 2011
The fair value of the common shares issued was based on HudBay's listed share price of $16.94 at theMarch 1, 2011 acquisition date.
The Group incurred acquisition related costs of $5,778 mainly relating to external legal and advisory feesand due diligence costs. These costs have been included in selling and administrative expenses in theGroup’s consolidated income statement. In addition, the Group incurred share issue costs of $239 andpresented them as a deduction from share capital. For cash flow purposes, the Group paid $94,855 uponacquisition of HudBay Peru representing $118,525 of cash paid, net of $23,669 cash received.
Identifiable assets acquired and liabilities assumed
During the three months ended September 30, 2011, the Group completed the purchase price allocationresulting in recognized amounts of identifiable assets acquired and liabilities assumed as follows:
Provisional fair valueCash and cash equivalents $ 23,669Short-term investments 20,053Receivables and prepaid expenses 19,447Mineral properties 520,768Other property, plant and equipment 561Deferred tax assets 750Trade and other payables (13,827)Provisions - decommissioning and restoration liabilities (978)Deferred tax liabilities (129,586)
Total net identifiable assets $ 440,857
Acquired receivables were valued at $19,248. Based on the valuation performed at the acquisition date,management expected all contractual cash flows to be collectible. Receivables related primarily to thetiming of receipt of proceeds by HudBay Peru from exercises of stock options and warrants. Subsequentto the acquisition date, all receivables relating to the exercises of stock options and warrants werecollected. Upon finalization of the purchase price allocation, the deferred tax liabilities were adjusted from$128,211 to $129,586. There was also a minor adjustment to other property, plant and equipment.
Goodwill
The Group recognized goodwill as a result of the acquisition as follows:
Total consideration transferred $ 463,644Fair value of previous 1.2% interest in the acquiree 6,043Non-controlling interests of 8.3% measured based on the proportionate
share of identifiable net assets 36,591Less: value of net identifiable asset acquired (440,857)
Goodwill upon acquisition March 1, 2011 65,421
The goodwill increased from $64,157 to $65,421 as a result of finalizing the purchase price.
The goodwill balance arose from the requirement to record deferred income tax liabilities measured at the
Page 19

HUDBAY MINERALS INC.Notes to Unaudited Condensed Consolidated Interim Financial Statements(Unaudited and in thousands of Canadian dollars)For the three and nine months ended September 30, 2011
tax effect of the difference between the fair values of the assets acquired and liabilities assumed and theirtax bases. None of the goodwill recognized is expected to be deductible for income tax purposes.
As a result of foreign exchange translation from HudBay Peru's US dollar functional currency to theGroup's Canadian dollar presentation currency, the goodwill balance was $70,340 as at September 30,2011.
The Group recognized a gain of $2,100 in other finance gains and losses as a result of remeasuring itsexisting 1.2% interest in HudBay Peru to fair value. Of this amount, $1,219 represented a transfer of gainsrecognized in previous periods from the available-for-sale reserve within equity into the income statement(note 5d).
Acquisition of non-controlling interests
On March 15, 2011, the Group acquired an additional 6.9% interest in HudBay Peru. The Grouptransferred consideration of $33,914 to the non-controlling interest holders, consisting of cash of $9,156and 1,566,945 HudBay common shares. The carrying amount of HudBay Peru's net assets in the Group'sfinancial statements on the acquisition date was $511,495 and the carrying value of the additional interestacquired was $30,809. The Group recognized the difference of $3,105 between the considerationtransferred and the carrying value of the interest acquired in retained earnings.
Subsequent to the acquisition, HudBay Peru issued additional shares to non-controlling interest holdersupon the exercise of warrants. The Group received proceeds of $2,474 and recognized an increase tonon-controlling interests of $3,549 and a decrease to retained earnings of $1,077.
On July 5, 2011, the Group acquired the remaining shares in HudBay Peru pursuant to a compulsoryacquisition. The Group transferred consideration of $10,431, consisting of cash of $2,320 and 535,773HudBay common shares, and recognized a decrease to non-controlling interests of $9,469 and adecrease to retained earnings of $962.
As at September 30, 2011, the Group's ownership interest in HudBay Peru was 100%.
The following summarizes the effect of changes in the Group's ownership interest in HudBay Peru:
Ownership interest before acquisition $ 6,043Effect of increase in ownership interest upon acquisition of control 463,644Effect of increase in ownership interest upon acquisition
of non-controlling interest, on March 15, 2011 30,809Effect of decrease from HudBay Peru shares issued upon exercises of warrants (1,077)Less: share of comprehensive loss (13,193)Effect of increase in ownership interest upon acquisition of remaining common shares 9,469
Ownership interest at September 30, 2011 $ 495,695
Page 20

HUDBAY MINERALS INC.Notes to Unaudited Condensed Consolidated Interim Financial Statements(Unaudited and in thousands of Canadian dollars)For the three and nine months ended September 30, 2011
5. Revenue and expenses
(a) Revenue:
The Group’s revenue by significant product types:
Three months ended Nine months endedSeptember 30 September 30
2011 2010 2011 2010Copper $ 122,742 $ 75,394 $ 337,805 $ 293,402Zinc 35,114 43,655 117,216 135,094Gold 37,511 22,832 96,241 80,845Silver 5,937 3,042 18,893 16,011Other 20,618 27,456 91,590 78,298
221,922 172,379 661,745 603,650Less: treatment and refining charges (9,587) (4,601) (25,242) (7,225)
$ 212,335 $ 167,778 $ 636,503 $ 596,425
During the nine months ended September 30, 2011, copper, gold and silver revenues were from thesale of metal contained in concentrates or anodes after deducting applicable treatment and refiningcosts. During 2010, copper revenues also included sales of copper cathode. Other revenues includesales of zinc oxide.
A portion of the Group’s revenue from sales of zinc is hedged and designated as cash flow hedges.For the nine months ended September 30, 2011, revenues from zinc sales include losses of $680(three months ended September 30, 2011 – losses of $137) from the hedging reserve (note 16b).
(b) Depreciation and amortization:
Three months ended Nine months endedSeptember 30 September 30
2011 2010 2011 2010
Total depreciation and amortization presented in:Cost of sales $ 27,166 $ 27,111 $ 78,624 $ 94,052Selling and administrative expenses 105 63 406 141
$ 27,271 $ 27,174 $ 79,030 $ 94,193
Page 21
HUDBAY MINERALS INC.Notes to Unaudited Condensed Consolidated Interim Financial Statements(Unaudited and in thousands of Canadian dollars)For the three and nine months ended September 30, 2011
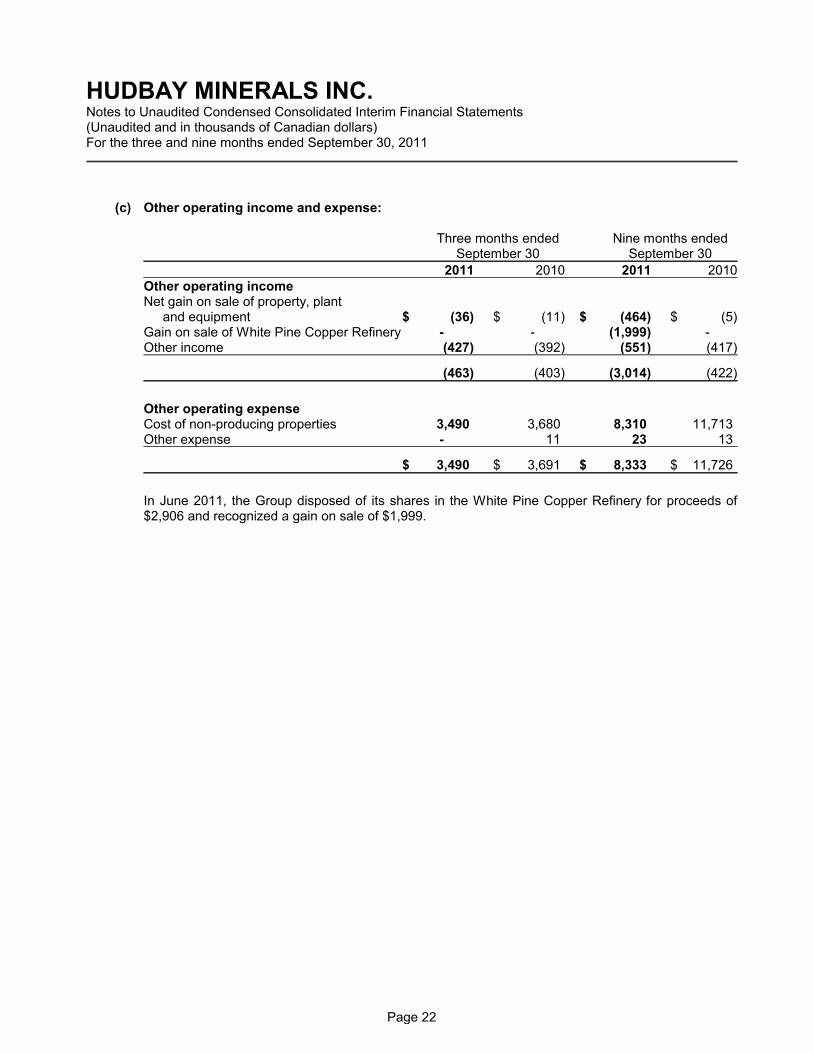
(c) Other operating income and expense:
Three months ended Nine months endedSeptember 30 September 30
2011 2010 2011 2010Other operating incomeNet gain on sale of property, plant
and equipment $ (36) $ (11) $ (464) $ (5)Gain on sale of White Pine Copper Refinery - - (1,999) -Other income (427) (392) (551) (417)
(463) (403) (3,014) (422)
Other operating expenseCost of non-producing properties 3,490 3,680 8,310 11,713Other expense - 11 23 13
$ 3,490 $ 3,691 $ 8,333 $ 11,726
In June 2011, the Group disposed of its shares in the White Pine Copper Refinery for proceeds of$2,906 and recognized a gain on sale of $1,999.
Page 22
HUDBAY MINERALS INC.Notes to Unaudited Condensed Consolidated Interim Financial Statements(Unaudited and in thousands of Canadian dollars)For the three and nine months ended September 30, 2011
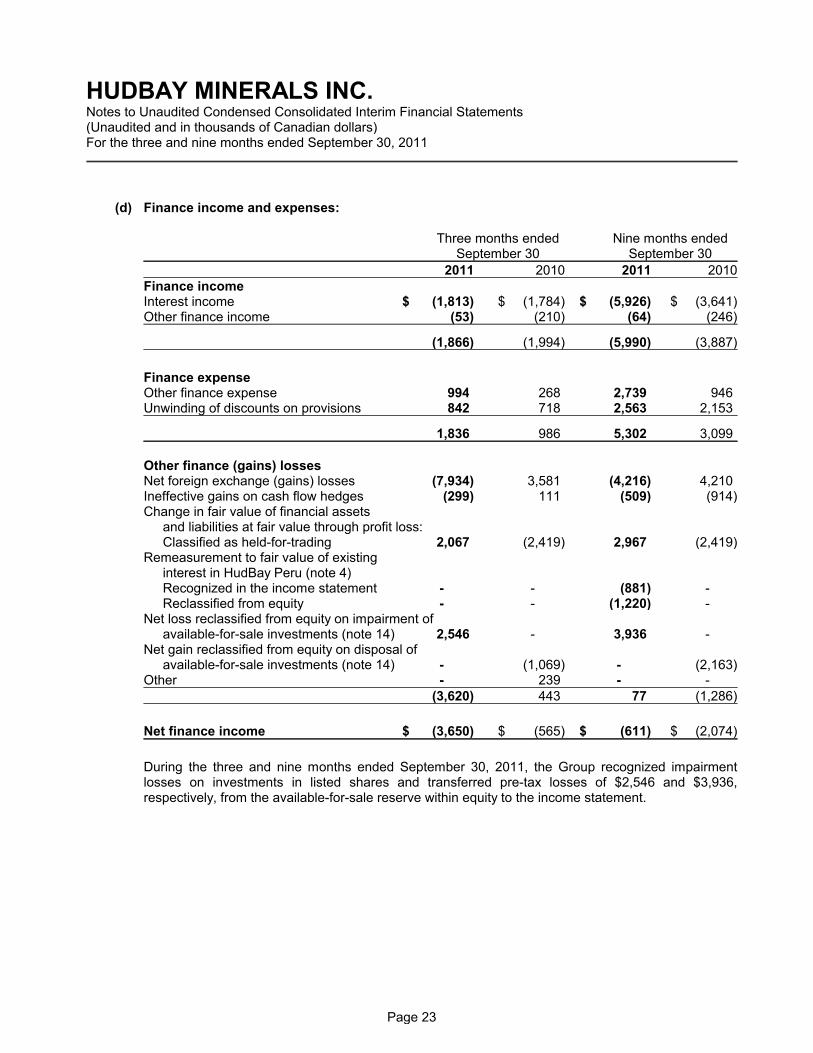
(d) Finance income and expenses:
Three months ended Nine months endedSeptember 30 September 30
2011 2010 2011 2010Finance incomeInterest income $ (1,813) $ (1,784) $ (5,926) $ (3,641)Other finance income (53) (210) (64) (246)
(1,866) (1,994) (5,990) (3,887)
Finance expenseOther finance expense 994 268 2,739 946Unwinding of discounts on provisions 842 718 2,563 2,153
1,836 986 5,302 3,099
Other finance (gains) lossesNet foreign exchange (gains) losses (7,934) 3,581 (4,216) 4,210Ineffective gains on cash flow hedges (299) 111 (509) (914)Change in fair value of financial assets
and liabilities at fair value through profit loss:Classified as held-for-trading 2,067 (2,419) 2,967 (2,419)
Remeasurement to fair value of existing interest in HudBay Peru (note 4)Recognized in the income statement - - (881) -Reclassified from equity - - (1,220) -
Net loss reclassified from equity on impairment of available-for-sale investments (note 14) 2,546 - 3,936 -
Net gain reclassified from equity on disposal ofavailable-for-sale investments (note 14) - (1,069) - (2,163)
Other - 239 - -(3,620) 443 77 (1,286)
Net finance income $ (3,650) $ (565) $ (611) $ (2,074)
During the three and nine months ended September 30, 2011, the Group recognized impairmentlosses on investments in listed shares and transferred pre-tax losses of $2,546 and $3,936,respectively, from the available-for-sale reserve within equity to the income statement.
Page 23
HUDBAY MINERALS INC.Notes to Unaudited Condensed Consolidated Interim Financial Statements(Unaudited and in thousands of Canadian dollars)For the three and nine months ended September 30, 2011
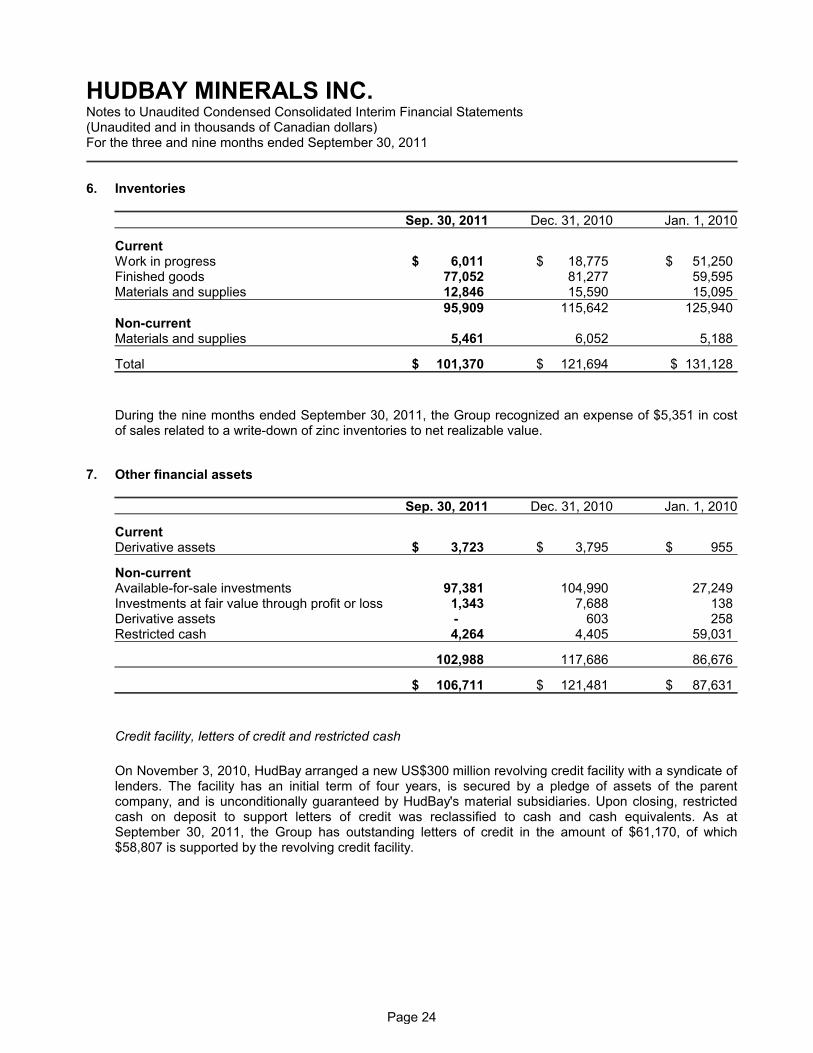
6. Inventories
Sep. 30, 2011 Dec. 31, 2010 Jan. 1, 2010
CurrentWork in progress $ 6,011 $ 18,775 $ 51,250Finished goods 77,052 81,277 59,595Materials and supplies 12,846 15,590 15,095
95,909 115,642 125,940Non-currentMaterials and supplies 5,461 6,052 5,188
Total $ 101,370 $ 121,694 $ 131,128
During the nine months ended September 30, 2011, the Group recognized an expense of $5,351 in costof sales related to a write-down of zinc inventories to net realizable value.
7. Other financial assets
Sep. 30, 2011 Dec. 31, 2010 Jan. 1, 2010
CurrentDerivative assets $ 3,723 $ 3,795 $ 955
Non-currentAvailable-for-sale investments 97,381 104,990 27,249Investments at fair value through profit or loss 1,343 7,688 138Derivative assets - 603 258Restricted cash 4,264 4,405 59,031
102,988 117,686 86,676
$ 106,711 $ 121,481 $ 87,631
Credit facility, letters of credit and restricted cash
On November 3, 2010, HudBay arranged a new US$300 million revolving credit facility with a syndicate oflenders. The facility has an initial term of four years, is secured by a pledge of assets of the parentcompany, and is unconditionally guaranteed by HudBay's material subsidiaries. Upon closing, restrictedcash on deposit to support letters of credit was reclassified to cash and cash equivalents. As atSeptember 30, 2011, the Group has outstanding letters of credit in the amount of $61,170, of which$58,807 is supported by the revolving credit facility.
Page 24
HUDBAY MINERALS INC.Notes to Unaudited Condensed Consolidated Interim Financial Statements(Unaudited and in thousands of Canadian dollars)For the three and nine months ended September 30, 2011
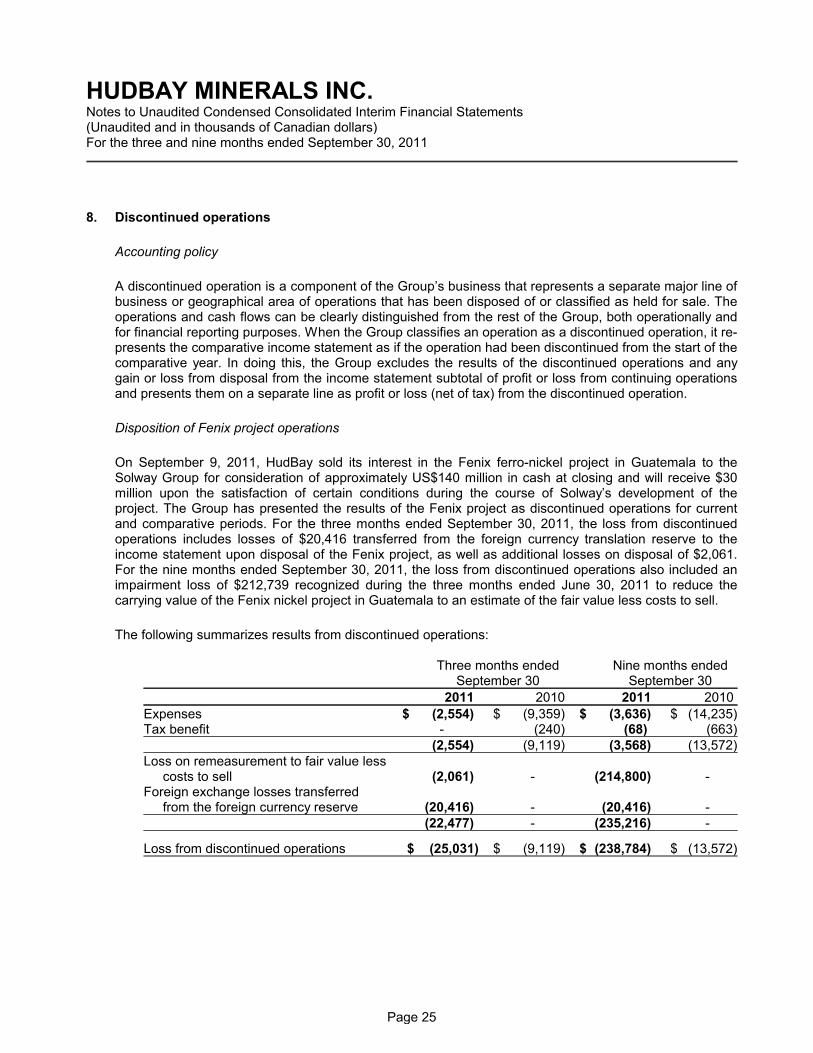
8. Discontinued operations
Accounting policy
A discontinued operation is a component of the Group’s business that represents a separate major line ofbusiness or geographical area of operations that has been disposed of or classified as held for sale. Theoperations and cash flows can be clearly distinguished from the rest of the Group, both operationally andfor financial reporting purposes. When the Group classifies an operation as a discontinued operation, it re-presents the comparative income statement as if the operation had been discontinued from the start of thecomparative year. In doing this, the Group excludes the results of the discontinued operations and anygain or loss from disposal from the income statement subtotal of profit or loss from continuing operationsand presents them on a separate line as profit or loss (net of tax) from the discontinued operation.
Disposition of Fenix project operations
On September 9, 2011, HudBay sold its interest in the Fenix ferro-nickel project in Guatemala to theSolway Group for consideration of approximately US$140 million in cash at closing and will receive $30million upon the satisfaction of certain conditions during the course of Solway’s development of theproject. The Group has presented the results of the Fenix project as discontinued operations for currentand comparative periods. For the three months ended September 30, 2011, the loss from discontinuedoperations includes losses of $20,416 transferred from the foreign currency translation reserve to theincome statement upon disposal of the Fenix project, as well as additional losses on disposal of $2,061.For the nine months ended September 30, 2011, the loss from discontinued operations also included animpairment loss of $212,739 recognized during the three months ended June 30, 2011 to reduce thecarrying value of the Fenix nickel project in Guatemala to an estimate of the fair value less costs to sell.
The following summarizes results from discontinued operations:
Three months ended Nine months endedSeptember 30 September 30
2011 2010 2011 2010
Expenses $ (2,554) $ (9,359) $ (3,636) $ (14,235)Tax benefit - (240) (68) (663)
(2,554) (9,119) (3,568) (13,572)Loss on remeasurement to fair value less
costs to sell (2,061) - (214,800) -Foreign exchange losses transferred
from the foreign currency reserve (20,416) - (20,416) -(22,477) - (235,216) -
Loss from discontinued operations $ (25,031) $ (9,119) $ (238,784) $ (13,572)
Page 25

HUDBAY MINERALS INC.Notes to Unaudited Condensed Consolidated Interim Financial Statements(Unaudited and in thousands of Canadian dollars)For the three and nine months ended September 30, 2011
Three months ended Nine months endedSeptember 30 September 30
2011 2010 2011 2010
Loss from discontinued operations attributable to:Owners of the Company $ (25,031) $ (9,134) $ (235,270) $ (13,465)Non-controlling interests - 15 (3,514) (107)
$ (25,031) $ (9,119) $ (238,784) $ (13,572)
(Loss) profit from continuing operations attributable to:Owners of the Company $ (14,474) $ 7,376 $ 45,642 $ 26,721Non-controlling interests (1,578) - (4,732) -
(16,052) 7,376 40,910 26,721
Loss per share - discontinued operationsBasic $ (0.15) $ (0.06) $ (1.41) $ (0.09)Diluted (0.15) (0.06) (1.41) (0.09)
(Loss) earnings per share - continuing operations Basic $ (0.08) $ 0.05 $ 0.27 $ 0.18Diluted (0.08) 0.05 0.27 0.18
9. Assets held for sale
Accounting policy
The Group classifies non-current assets, or disposal groups consisting of assets and liabilities, as held forsale when it expects to recover their carrying amounts primarily through sale rather than throughcontinuing use. To meet criteria to be held for sale, the sale must be highly probable, and the assets ordisposal groups must be available for immediate sale in their present condition. The Group must becommitted to a plan to sell the assets or disposal group, and the sale should be expected to qualify forrecognition as a completed sale within one year from the date of classification.
The Group measures assets or disposal groups at the lower of their carrying amount and fair value lesscosts to sell. Any impairment loss on a disposal group first is allocated to goodwill, and then to remainingassets and liabilities on pro rata basis, except that no loss is allocated to inventories, financial assets,deferred tax assets, employee benefit assets, investment property or biological assets. Impairment losseson initial classification as held for sale and subsequent gains and losses on remeasurement arerecognized in profit or loss; however, gains are not recognized in excess of any cumulative impairmentloss. Upon classifying assets or disposal groups as held for sale, the Group presents the assetsseparately as a single amount and the liabilities separately as a single amount on the balance sheet.
Page 26

HUDBAY MINERALS INC.Notes to Unaudited Condensed Consolidated Interim Financial Statements(Unaudited and in thousands of Canadian dollars)For the three and nine months ended September 30, 2011
Zochem
At September 30, 2011, the Group was in advanced discussions regarding a sale of Zochem, its zincoxide production facility in Ontario, and concluded it met criteria for classification as held for sale at thattime. During the three months ended September 30, 2011, the Group recognized an impairment loss of$5,878 to re-measure the Zochem disposal group to its fair value less costs to sell of $16,294, which waslower than its carrying value prior to classification as held for sale. The Group determined the fair valuebased on offers received from third parties. The Group has applied the impairment to the property, plantand equipment of the Zochem operations. On the income statement, the impairment loss is presentedwithin cost of sales. Zochem is reported within the HBMS operating segment.
As at September 30, 2011, the major classes of assets and liabilities of Zochem are as follows:
AssetsTrade and other receivables $ 9,986Inventories 5,735Other assets 372Property, plant and equipment 2,919
Zochem assets held for sale $ 19,012
LiabilitiesTrade and other payables $ (1,376)Taxes payable (1,026)Derivative liabilities (252)Provisions (64)Zochem liabilities associated with assets held for sale $ (2,718)
Zochem net assets held for sale $ 16,294
On November 1, 2011, the sale of Zochem to a third party was completed.
Page 27
HUDBAY MINERALS INC.Notes to Unaudited Condensed Consolidated Interim Financial Statements(Unaudited and in thousands of Canadian dollars)For the three and nine months ended September 30, 2011
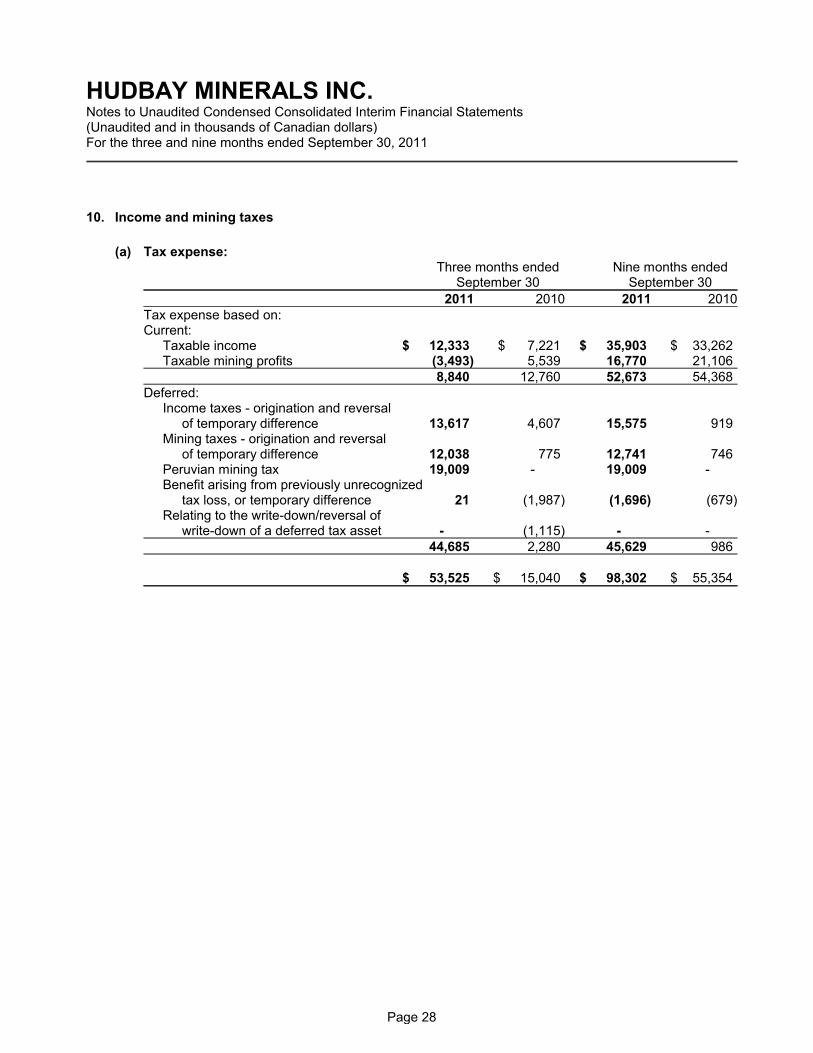
10. Income and mining taxes
(a) Tax expense:Three months ended Nine months ended
September 30 September 30
2011 2010 2011 2010Tax expense based on: Current:
Taxable income $ 12,333 $ 7,221 $ 35,903 $ 33,262Taxable mining profits (3,493) 5,539 16,770 21,106
8,840 12,760 52,673 54,368Deferred:
Income taxes - origination and reversal of temporary difference 13,617 4,607 15,575 919
Mining taxes - origination and reversal of temporary difference 12,038 775 12,741 746
Peruvian mining tax 19,009 - 19,009 -Benefit arising from previously unrecognized
tax loss, or temporary difference 21 (1,987) (1,696) (679)Relating to the write-down/reversal of
write-down of a deferred tax asset - (1,115) - -44,685 2,280 45,629 986
$ 53,525 $ 15,040 $ 98,302 $ 55,354
Page 28
HUDBAY MINERALS INC.Notes to Unaudited Condensed Consolidated Interim Financial Statements(Unaudited and in thousands of Canadian dollars)For the three and nine months ended September 30, 2011
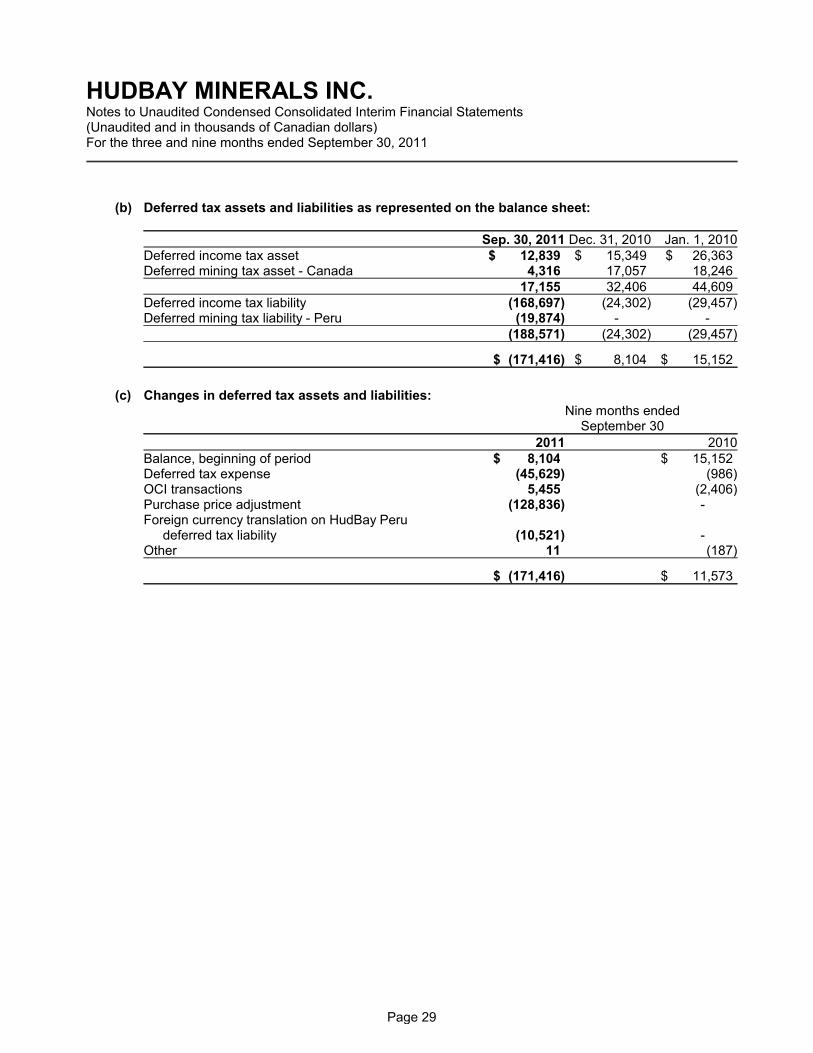
(b) Deferred tax assets and liabilities as represented on the balance sheet:
Sep. 30, 2011 Dec. 31, 2010 Jan. 1, 2010Deferred income tax asset $ 12,839 $ 15,349 $ 26,363Deferred mining tax asset - Canada 4,316 17,057 18,246
17,155 32,406 44,609Deferred income tax liability (168,697) (24,302) (29,457)Deferred mining tax liability - Peru (19,874) - -
(188,571) (24,302) (29,457)
$ (171,416) $ 8,104 $ 15,152
(c) Changes in deferred tax assets and liabilities: Nine months ended
September 30
2011 2010Balance, beginning of period $ 8,104 $ 15,152Deferred tax expense (45,629) (986)OCI transactions 5,455 (2,406)Purchase price adjustment (128,836) -Foreign currency translation on HudBay Peru
deferred tax liability (10,521) -Other 11 (187)
$ (171,416) $ 11,573
Page 29
HUDBAY MINERALS INC.Notes to Unaudited Condensed Consolidated Interim Financial Statements(Unaudited and in thousands of Canadian dollars)For the three and nine months ended September 30, 2011
11. Share capital
(a) Preference shares:
Authorized: Unlimited preference shares without par value
(b) Common shares:
Authorized: Unlimited common shares without par value
Issued and fully paid:Nine months ended Year ended
Sep. 30, 2011 Dec. 31, 2010Common Common
shares Amount shares Amount
Balance, beginning of period 149,431,339 $ 642,161 153,854,655 $ 656,427Exercise of options 30,622 216 623,784 6,881Shares repurchased - - (5,047,100) (21,147)Share issue costs, net of tax - (239) - -Issued - acquisition of HudBay Peru (note 4) 20,372,986 345,119 - -Issued - acquisition of non-controlling
interest (note 4) 2,102,718 32,869 - -
Balance, end of period 171,937,665 $ 1,020,126 149,431,339 $ 642,161
The Company paid dividends of $0.10 per share on March 31, 2011 to shareholders of record as ofMarch 31, 2011 and on September 30, 2011 to shareholders of record as of September 15, 2011.
Page 30

HUDBAY MINERALS INC.Notes to Unaudited Condensed Consolidated Interim Financial Statements(Unaudited and in thousands of Canadian dollars)For the three and nine months ended September 30, 2011
12. Share-based payment
(a) Cash-settled share-based payment:
The Group has two cash-settled share-based payment plans, as described below.
Deferred share units
At September 30, 2011, the value of the outstanding liability related to the DSU plan was $2,145(December 31, 2010 - $3,167). The following table outlines information related to DSUs granted inthe period and the expense recognized in the period.
Three months ended Nine months endedSeptember 30 September 30
2011 2010 2011 2010Granted during the period:
Number of units 15,683 30,995 43,325 89,657Weighted average price ($/unit) $ 14.18 $ 12.04 $ 15.60 $ 12.57
Expense (gain) recognized during the period1 $ (791) $ 964 $ (1,022) $ 1,410
1 This expense relates to the grant of DSUs, as well as mark-to-market adjustments, and is presented withinselling and administrative expenses on the income statement.
Restricted share units
At September 30, 2011, the value of the outstanding liability related to the RSU plan was $2,168(December 31, 2010 - $1,641). The following table outlines information related to RSUs granted inthe period and the expense recognized in the period.
Three months ended Nine months endedSeptember 30 September 30
2011 2010 2011 2010Granted during the period
Number of units 6,559 151,591 323,116 435,880Weighted average price ($/unit) $ 10.46 $ 13.02 $ 15.79 $ 13.25
Expense (gain) recognized during the period1 $ 102 $ 560 $ 1,432 $ 864Payments made during the period $ 905 $ - $ 905 $ -
1 This net expense reflects recognition of RSU expense over the service period, as well as mark-to-marketadjustments, and is presented mainly within cost of sales and selling and administrative expenses.
Page 31
HUDBAY MINERALS INC.Notes to Unaudited Condensed Consolidated Interim Financial Statements(Unaudited and in thousands of Canadian dollars)For the three and nine months ended September 30, 2011
(b) Equity-settled share-based payment - stock options:
Nine months ended Year endedSep. 30, 2011 Dec. 31, 2010
Number Weighted Number Weightedof shares average of shares average
subject exercise subject exerciseto option price to option price
Balance, beginning of period 4,368,784 $ 14.50 4,637,113 $ 14.25Granted - - 900,000 12.17Exercised (30,622) 5.00 (623,784) 8.42Forfeited (276,671) 17.22 (145,557) 10.42Expired - - (398,988) 17.31
Balance, end of period 4,061,491 $ 14.39 4,368,784 $ 14.50
The following table summarizes the options outstanding at September 30, 2011:
Weighted-average Weighted- Weighted-
Number of remaining average Number of averageRange of options contractual life exercise options exercise
exercise prices outstanding (years) price exercisable price$ 2.59 - 10.20 981,653 3.8 $ 6.91 904,988 $ 6.82
10.21 - 14.02 1,007,000 2.7 12.01 707,000 11.9514.03 - 16.55 706,701 6.5 15.86 706,701 15.8616.56 - 20.78 205,200 0.3 18.54 205,200 18.5420.79 - 23.74 1,160,937 5.5 21.14 1,160,937 21.14
$ 2.59 - 23.74 4,061,491 4.32 $ 14.39 3,684,826 $ 14.70
13. Earnings per share data Three months ended Nine months ended
September 30 September 30
2011 2010 2011 2010Weighted average common shares outstanding
Basic 171,905,912 148,949,050 166,490,423 151,114,563Plus net incremental shares from assumed
conversion: stock options 442,299 738,960 597,738 684,604Diluted weighted average common
shares outstanding 172,348,211 149,688,010 167,088,161 151,799,167
When calculating earnings per share for periods where the Group has a loss, HudBay's calculation ofdiluted earnings per share excludes any incremental shares from the assumed conversion of stockoptions as they would be anti-dilutive.
Page 32
HUDBAY MINERALS INC.Notes to Unaudited Condensed Consolidated Interim Financial Statements(Unaudited and in thousands of Canadian dollars)For the three and nine months ended September 30, 2011
14. Other comprehensive income (loss) (“OCI”)
Three months endedSep. 30, 2011
Three months endedSep. 30, 2010
Pre-tax Tax Net of
tax Pre-tax Tax Net of
tax
Foreign currency translationNet exchange gain (loss) ontranslation of foreignoperations $ 45,728 $ - $ 45,728 $ (7,015) $ - $ (7,015)Transfer to income statementon disposal of foreignoperations 20,416 - 20,416 - - -
66,144 - 66,144 (7,015) - (7,015)
Available-for-saleChange in fair value ofavailable-for-sale investments (34,126) 4,279 (29,847) 29,521 (3,729) 25,792Transfer to income statementon impairment of investments 2,546 (320) 2,226 - - -Transfer to income statementon sale of investments - - - (1,069) 165 (904)
(31,580) 3,959 (27,621) 28,452 (3,564) 24,888
Cash flow hedgeEffective portion of change infair value of cash flow hedge 3,601 (1,047) 2,554 (7,237) 2,100 (5,137)Transfer to income statementas hedged transactionsoccurred (170) 19 (151) (1,524) 520 (1,004)
3,431 (1,028) 2,403 (8,761) 2,620 (6,141)
Total OCI (loss) $ 37,995 $ 2,931 $ 40,926 $ 12,676 $ (944) $ 11,732
Page 33

HUDBAY MINERALS INC.Notes to Unaudited Condensed Consolidated Interim Financial Statements(Unaudited and in thousands of Canadian dollars)For the three and nine months ended September 30, 2011
Nine months endedSep. 30, 2011
Nine months endedSep. 30, 2010
Pre-tax Tax Net of
tax Pre-tax Tax Net of
tax
Foreign currency translationNet exchange gain (loss) ontranslation of foreignoperations $ 31,349 $ - $ 31,349 $ (4,481) $ - $ (4,481)Transfer to income statementon disposal of foreignoperations 20,416 - 20,416 - - -
51,765 - 51,765 (4,481) - (4,481)
Available-for-saleChange in fair value ofavailable-for-sale investments (46,205) 5,795 (40,410) 22,181 (2,715) 19,466Transfer to income statementon impairment of investments 3,936 (492) 3,444 - - -Transfer to income statementon sale of investments (1,220) 152 (1,068) (2,163) 309 (1,854)
(43,489) 5,455 (38,034) 20,018 (2,406) 17,612
Cash flow hedgeEffective portion of change infair value of cash flow hedge 6,041 (1,741) 4,300 10,367 (3,104) 7,263Transfer to income statementas hedged transactionsoccurred (231) 4 (227) (2,782) 843 (1,939)
5,810 (1,737) 4,073 7,585 (2,261) 5,324
Total OCI (loss) $ 14,086 $ 3,718 $ 17,804 $ 23,122 $ (4,667) $ 18,455
Gains and losses transferred from equity into profit or loss during the period are included in the followingline items in the income statement:
Three months ended Nine months endedSeptember 30 September 30
2011 2010 2011 2010Revenue $ 170 $ 1,524 $ 231 $ 2,782Other finance gains/losses (2,546) 1,069 (2,716) 2,163Discontinued operations (20,416) - (20,416) -Tax expense 301 (685) 336 (1,152)
$ (22,491) $ 1,908 $ (22,565) $ 3,793
Page 34
HUDBAY MINERALS INC.Notes to Unaudited Condensed Consolidated Interim Financial Statements(Unaudited and in thousands of Canadian dollars)For the three and nine months ended September 30, 2011
15. Non-controlling interests
Prior to the disposition of the Fenix project on September 9, 2011, the Group owned 98.2% of CompañíaGuatemalteca de Níquel ("CGN"). As a result of the transaction, the Group is no longer required toaccount for the related non-controlling interest.
HudBay owns 51% of the Back Forty project in accordance with a Subscription, Option and Joint VentureAgreement with Aquila Resources Inc. ("Aquila"). HudBay has control over the Back Forty project andaccordingly consolidates the Back Forty project in its consolidated financial statements.
In accordance with a Joint Venture Agreement with VMS Ventures Inc. ("VMS"), HudBay owns 70% of theReed Lake project and the two claims immediately to the south. HudBay has control over the project andaccordingly consolidates the Reed Lake project in its consolidated financial statements.
The Group acquired 90.5% of HudBay Peru on March 1, 2011 and increased its ownership throughout theyear, resulting in a 100% ownership interest as at September 30, 2011 (note 4).
CGN Back Forty Reed Lake HudBay Peru TotalProject Project
Balance, January 1, 2010 $ 1,359 $ - $ - $ - $ 1,359Share of assets acquired - 10,221 1,122 - 11,343Share of OCI - (164) - - (164)Share of net loss (109) - - - (109)
Balance, September 30, 2010 1,250 10,057 1,122 - 12,429Share of OCI - (162) - - (162)Share of net loss (121) (1,865) (859) - (2,845)
Balance, December 31, 2010 1,129 8,030 263 - 9,422Share of assets acquired - - - 9,446 9,446Share of OCI - 252 - - 252Share of net loss (3,514) (3,702) (1,052) 23 (8,245)Disposition of subsidiary 2,385 - - - 2,385Acquisition of
non-controlling interest - - - (9,469) (9,469)
Balance September 30, 2011 $ - $ 4,580 $ (789) $ - $ 3,791
Page 35
HUDBAY MINERALS INC.Notes to Unaudited Condensed Consolidated Interim Financial Statements(Unaudited and in thousands of Canadian dollars)For the three and nine months ended September 30, 2011
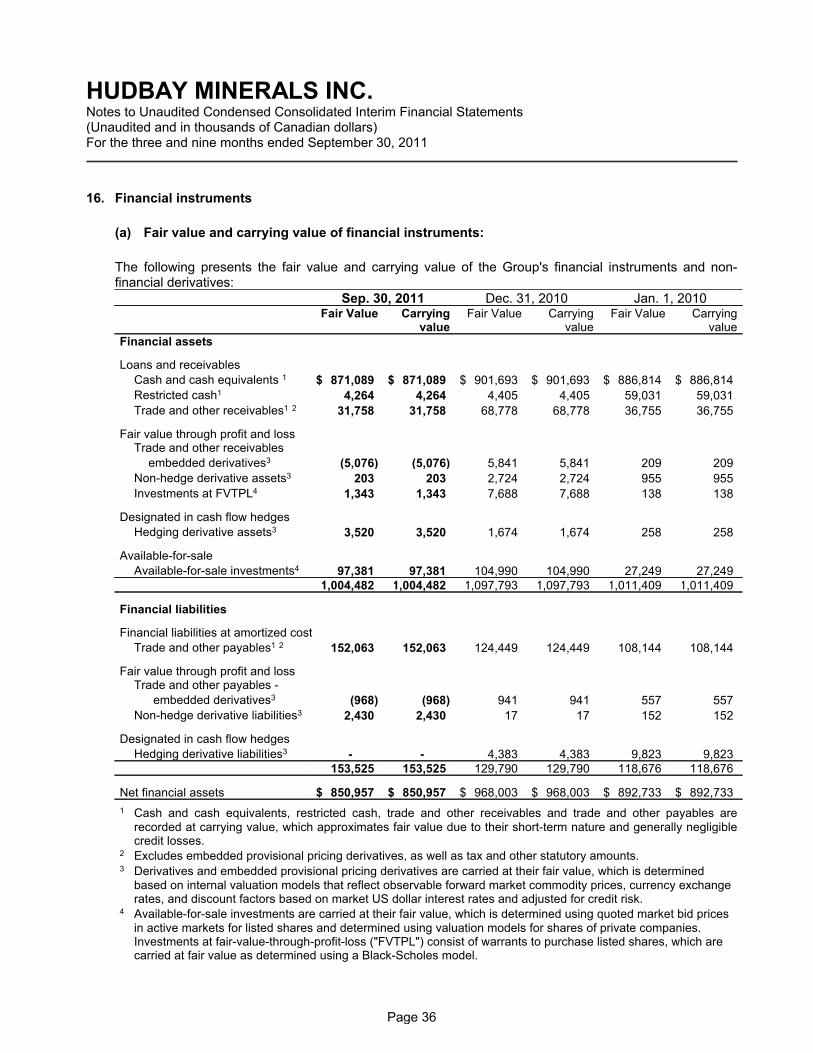
16. Financial instruments
(a) Fair value and carrying value of financial instruments:
The following presents the fair value and carrying value of the Group's financial instruments and non-financial derivatives:
Sep. 30, 2011 Dec. 31, 2010 Jan. 1, 2010Fair Value Carrying
valueFair Value Carrying
valueFair Value Carrying
valueFinancial assets
Loans and receivables
Cash and cash equivalents 1 $ 871,089 $ 871,089 $ 901,693 $ 901,693 $ 886,814 $ 886,814
Restricted cash1 4,264 4,264 4,405 4,405 59,031 59,031
Trade and other receivables1 2 31,758 31,758 68,778 68,778 36,755 36,755
Fair value through profit and lossTrade and other receivables
embedded derivatives3 (5,076) (5,076) 5,841 5,841 209 209
Non-hedge derivative assets3 203 203 2,724 2,724 955 955
Investments at FVTPL4 1,343 1,343 7,688 7,688 138 138
Designated in cash flow hedges
Hedging derivative assets3 3,520 3,520 1,674 1,674 258 258
Available-for-sale
Available-for-sale investments4 97,381 97,381 104,990 104,990 27,249 27,2491,004,482 1,004,482 1,097,793 1,097,793 1,011,409 1,011,409
Financial liabilities
Financial liabilities at amortized cost
Trade and other payables1 2 152,063 152,063 124,449 124,449 108,144 108,144
Fair value through profit and lossTrade and other payables -
embedded derivatives3 (968) (968) 941 941 557 557
Non-hedge derivative liabilities3 2,430 2,430 17 17 152 152
Designated in cash flow hedges
Hedging derivative liabilities3 - - 4,383 4,383 9,823 9,823153,525 153,525 129,790 129,790 118,676 118,676
Net financial assets $ 850,957 $ 850,957 $ 968,003 $ 968,003 $ 892,733 $ 892,733
1 Cash and cash equivalents, restricted cash, trade and other receivables and trade and other payables arerecorded at carrying value, which approximates fair value due to their short-term nature and generally negligiblecredit losses.
2 Excludes embedded provisional pricing derivatives, as well as tax and other statutory amounts.3 Derivatives and embedded provisional pricing derivatives are carried at their fair value, which is determined
based on internal valuation models that reflect observable forward market commodity prices, currency exchangerates, and discount factors based on market US dollar interest rates and adjusted for credit risk.
4 Available-for-sale investments are carried at their fair value, which is determined using quoted market bid pricesin active markets for listed shares and determined using valuation models for shares of private companies.Investments at fair-value-through-profit-loss ("FVTPL") consist of warrants to purchase listed shares, which arecarried at fair value as determined using a Black-Scholes model.
Page 36
HUDBAY MINERALS INC.Notes to Unaudited Condensed Consolidated Interim Financial Statements(Unaudited and in thousands of Canadian dollars)For the three and nine months ended September 30, 2011
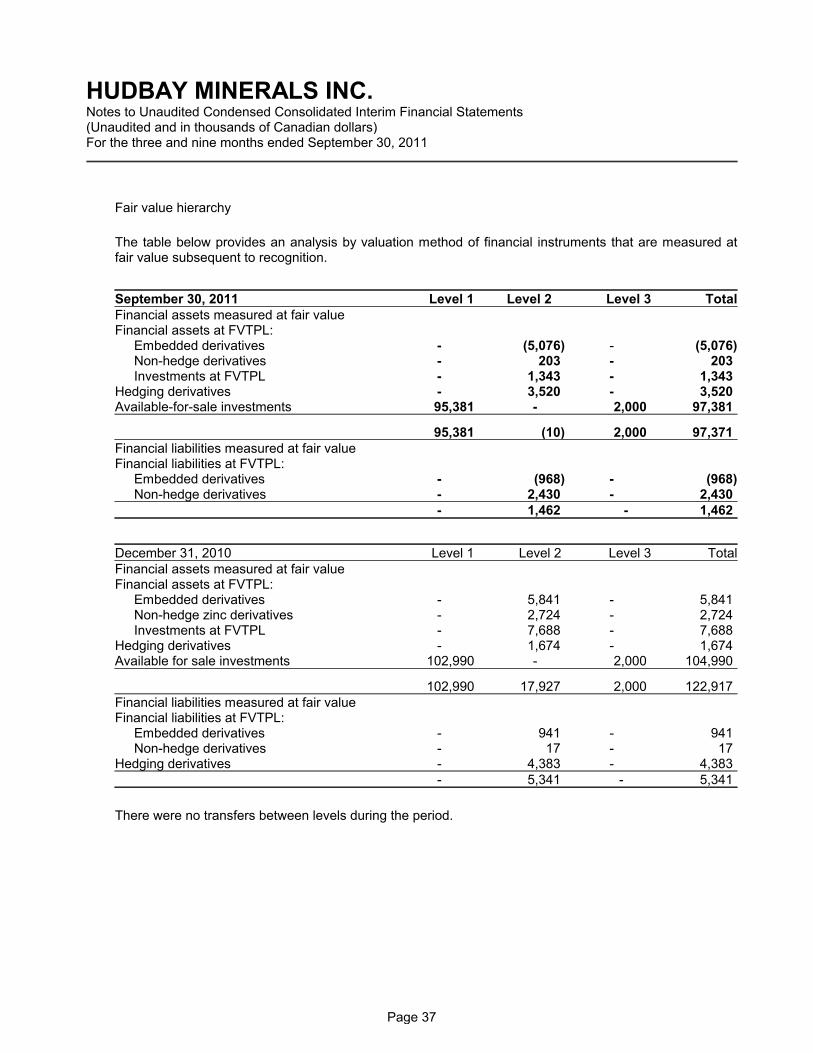
Fair value hierarchy
The table below provides an analysis by valuation method of financial instruments that are measured atfair value subsequent to recognition.
September 30, 2011 Level 1 Level 2 Level 3 TotalFinancial assets measured at fair valueFinancial assets at FVTPL:
Embedded derivatives - (5,076) - (5,076)Non-hedge derivatives - 203 - 203Investments at FVTPL - 1,343 - 1,343
Hedging derivatives - 3,520 - 3,520Available-for-sale investments 95,381 - 2,000 97,381
95,381 (10) 2,000 97,371Financial liabilities measured at fair valueFinancial liabilities at FVTPL:
Embedded derivatives - (968) - (968)Non-hedge derivatives - 2,430 - 2,430
- 1,462 - 1,462
December 31, 2010 Level 1 Level 2 Level 3 TotalFinancial assets measured at fair valueFinancial assets at FVTPL:
Embedded derivatives - 5,841 - 5,841Non-hedge zinc derivatives - 2,724 - 2,724Investments at FVTPL - 7,688 - 7,688
Hedging derivatives - 1,674 - 1,674Available for sale investments 102,990 - 2,000 104,990
102,990 17,927 2,000 122,917Financial liabilities measured at fair valueFinancial liabilities at FVTPL:
Embedded derivatives - 941 - 941Non-hedge derivatives - 17 - 17
Hedging derivatives - 4,383 - 4,383- 5,341 - 5,341
There were no transfers between levels during the period.
Page 37

HUDBAY MINERALS INC.Notes to Unaudited Condensed Consolidated Interim Financial Statements(Unaudited and in thousands of Canadian dollars)For the three and nine months ended September 30, 2011
(b) Derivatives and hedging:
Non-hedge derivative zinc contracts
HudBay enters into fixed price sales contracts with zinc and zinc oxide customers and, to ensure thatthe Group continues to receive a floating or unhedged realized zinc price, enters into forward zincpurchase contracts that effectively offset the fixed price sales contracts. The fixed-price salescontracts with customers are not recognized as derivatives, as they are executory contracts enteredinto and held for the purpose of the Group’s expected sale requirements. However, the zinc forwardpurchase contracts are recorded as derivatives. Gains and losses on these contracts are recorded inrevenues, and cash flows are classified in operating activities.
At September 30, 2011, the Group held contracts for forward zinc purchases of 11,640 tonnes thatrelated to forward customer sales of zinc and zinc oxide. Prices ranged from US$1,732 to US$2,330per tonne, and settlement dates extended out up to June 2012.
Cash flow hedging derivatives
In 2009, the Group entered into a foreign exchange swap contract to hedge foreign exchange risk forfuture receipts of US dollars and commodity swap contracts to hedge prices for a portion of futuresales of zinc. These contracts expire in July 2012. The risk management objective for these hedgingrelationships is to mitigate the impact on the Group of fluctuating zinc prices and exchange rates.Cash flow hedge accounting has been applied to the hedging relationships. The effective portion ofthe change in fair value of cash flow hedging derivatives recognized in other comprehensive incomeis presented in note 14, and the ineffective portion recognized in other finance gains and losses in theincome statement is presented in note 5d. Gains and losses reclassified from the cash flow hedgereserve to revenue are presented in note 14.
The following tables summarizes the Group’s cash flow hedging derivatives, indicating the periods inwhich cash flows associated with the cash flow hedging derivatives are expected to occur:
Weighted Fair value of Expectedaverage derivative cash
September 30, 2011 Quantity price asset flows
Zinc swaps - US$ denominated contracts Metric tonnes US$/MT
Maturing between 0 to 12 months 10,065 2,220 3,386 3,386
Foreign currency swaps - sell US$/buy C$
Value RateMaturing between 0 to 12 months 14,951 1.0668 229 229
Page 38

HUDBAY MINERALS INC.Notes to Unaudited Condensed Consolidated Interim Financial Statements(Unaudited and in thousands of Canadian dollars)For the three and nine months ended September 30, 2011
Fair value ofWeighted derivative Expected
average asset cashDecember 31, 2010 Quantity price (liability) flowsZinc swaps - US$ denominated contracts Maturing between: Metric tonnes US$/MT
0 to 12 months 11,437 2,220 (2,560) (2,560)13 to 24 months 7,320 2,220 (1,826) (1,826)
18,757 2,220 (4,386) (4,386)
Foreign currency swaps - sell US$/buy C$Maturing between: Value Rate
0 to 12 months 16,310 1.0668 1,071 1,07113 to 24 months 10,873 1.0668 603 603
27,183 1.0668 1,674 1,674
(c) Embedded derivatives
The Group records embedded derivatives related to provisional pricing in concentrate purchase,concentrate sale, anode sale, and certain other sale contracts. Under the terms of these contracts,prices are subject to final adjustment at the end of a future period after title transfers based onquoted market prices during the quotational period specified in the contract. The period betweenprovisional pricing and final pricing is typically up to three months.
Embedded derivatives are presented in trade and other receivables when they relate to salescontracts and in trade and other payables when they relate to purchase contracts. At each reportingdate, provisionally priced metals are marked to market based on the forward market price for thequotational period stipulated in the contract, with changes in fair value recognized in revenues forsales contracts and in cost of sales for purchase concentrate contracts. Cash flows related toprovisional pricing embedded derivatives are classified in operating activities.
At September 30, 2011, the Group’s net position consisted of contracts awaiting final pricing for salesof 2,557 tonnes of copper, purchases of 7,074 tonnes of zinc, sales of 1,507 ounces of gold andsales of 20,862 ounces of silver.
17. Capital commitments
As at September 30, 2011, the Group had outstanding capital commitments of approximately $133 millionrelated to its Lalor project and $32 million related to its Constancia project, including amounts pursuant tocontracts the Group is able to terminate upon relatively short notice.
Page 39

HUDBAY MINERALS INC.Notes to Unaudited Condensed Consolidated Interim Financial Statements(Unaudited and in thousands of Canadian dollars)For the three and nine months ended September 30, 2011
18. Supplementary cash flow information
(a) Change in non-cash working capital:Three months ended Nine months ended
September 30 September 30
2011 2010 2011 2010
Change in:Trade and other receivables $ (20,414) $ (13,372) $ 36,187 $ (22,846)Inventories 6,333 (13,135) 6,004 32,567Prepaid expenses and other current
assets 43 2,384 (854) 4,417Trade and other payables 34,942 9,392 7,501 (8,886)Provisions and other liabilities 2,172 2,670 (28,137) -
$ 23,076 $ (12,061) $ 20,701 $ 5,252
(b) Non-cash transactions:
During the nine months ended September 30, 2011, the Group entered into the following non-cashinvesting and financing activities which are not reflected in the statement of cash flows:
Remeasurements of the Group's provision for decommissioning liability led to increases in
related assets of $20,117 (three months ended September 30, 2011 - $19,943). For the nine
months ended September 30, 2010, such increases in property, plant and equipment were
$12,093 (three months ended September 30, 2010 - $4,653);
Depreciation of $315 (three months ended September 30, 2011 - $35) was capitalized for fixed
assets in construction; and
As at September 30, 2011, additions to property, plant and equipment of $19,400 were
purchased using trade credit which was not yet paid. These additions will be reflected in the
statement of cash flows in the period payment is made.
Page 40

HUDBAY MINERALS INC.Notes to Unaudited Condensed Consolidated Interim Financial Statements(Unaudited and in thousands of Canadian dollars)For the three and nine months ended September 30, 2011
19. Segmented information
The Group is an integrated metals producer. When making decisions on expansions, opening or closingmines, as well as day to day operations, management evaluates the profitability of the overall operation ofthe Group. The Group's main mining operations are located in Manitoba and Saskatchewan and areincluded in the HBMS segment. The HBMS revenue segment generates the majority of revenues as itsells copper, zinc, gold, silver and other metals. The Peru segment consists of the Group's Constanciaproject in Peru, which HudBay acquired on March 1, 2011. The “Other Segment” includes operatingsegments that are not individually significant, as they do not meet the quantitative thresholds, and includethe Balmat segment which consists of a zinc mine and concentrator, the Michigan segment which includesthe Back Forty property and other exploration properties. The Balmat mine suspended operations onAugust 22, 2008. The group previously disclosed HMI Nickel as a segment; however, upon selling theFenix project in September 2011 (note 8), HudBay reclassified these activities to loss from discontinuedoperations. Corporate activities are not considered a segment and are included as a reconciliation to totalconsolidated results. Accounting policies for each reported segment are the same. Segment profit or lossrepresents the profit earned by each segment without allocation of corporate costs. This is the measurereported to the chief operating decision-maker for the purposes of resource allocation and the assessmentof segment performance. Total assets and liabilities do not reflect intercompany balances, which havebeen eliminated on consolidation.
Three months ended September 30, 2011
HBMS Peru Other
Corporateactivities
and unallo-catedcosts Total
Revenue from external customers $ 212,335 $ - $ - $ - $ 212,335
Cost of sales not including depreciationand amortization and impairment loss 120,790 - - - 120,790
Cost of sales - depreciation andamortization 27,166 - - - 27,166
Cost of sales - impairment loss 5,878 - - - 5,878Gross profit 58,501 - - - 58,501Selling and administrative expenses 601 - - 6,996 7,597Exploration and evaluation 7,940 2,270 1,208 2,636 14,054Other operating income (226) - - (237) (463)Other operating expense 677 (285) 3,098 - 3,490
Results from operating activities $ 49,509 $ (1,985) $ (4,306) $ (9,395) $ 33,823Finance income (1,866)Finance expenses 1,836Other finance gains (3,620)Profit before tax 37,473Tax expense 53,525Profit from continuing operations (16,052)Loss from discontinued operations (25,031)
Loss for the period $ (41,083)
Page 41

HUDBAY MINERALS INC.Notes to Unaudited Condensed Consolidated Interim Financial Statements(Unaudited and in thousands of Canadian dollars)For the three and nine months ended September 30, 2011
Three months ended September 30, 2010
HBMS Other
Corporateactivities and
unallocatedcosts Total
Revenue from external customers $ 167,778 $ - $ - $ 167,778
Cost of sales not including depreciationand amortization and impairment loss 88,156 - - 88,156
Cost of sales - depreciation andamortization 27,111 - - 27,111
Gross profit 52,511 - - 52,511Selling and administrative expenses 763 - 8,308 9,071Exploration and evaluation 16,620 1,631 50 18,301Other operating income (403) - - (403)Other operating expense 1,945 1,739 7 3,691Results from operating activities $ 33,586 $ (3,370) $ (8,365) $ 21,851Finance income (1,994)Finance expenses 986Other finance losses 443Profit before tax 22,416Tax expense 15,040Loss from continuing operations 7,376Loss from discontinued operations (9,119)
Loss for the period $ (1,743)
Nine months ended September 30, 2011
HBMS Peru Other
Corporateactivities and
unallocatedcosts Total
Revenue from external customers $ 636,503 $ - $ - $ - $ 636,503
Cost of sales not including depreciationand amortization and impairmentloss 341,725 - - - 341,725
Cost of sales - depreciation andamortization 78,624 - - - 78,624
Cost of sales - impairment loss 5,878 - - - 5,878Gross profit 210,276 - - - 210,276Selling and administrative expenses 1,882 - - 27,894 29,776Exploration and evaluation 20,698 4,168 9,089 2,625 36,580Other operating income (2,777) - - (237) (3,014)Other operating expense 2,435 815 5,083 - 8,333
Results from operating activities $ 188,038 $ (4,983) $ (14,172) $ (30,282) $ 138,601Finance income (5,990)Finance expenses 5,302Other finance losses 77Profit before tax 139,212Tax expense 98,302Profit from continuing operations 40,910Loss from discontinued operations (238,784)
Loss for the period $ (197,874)
Page 42
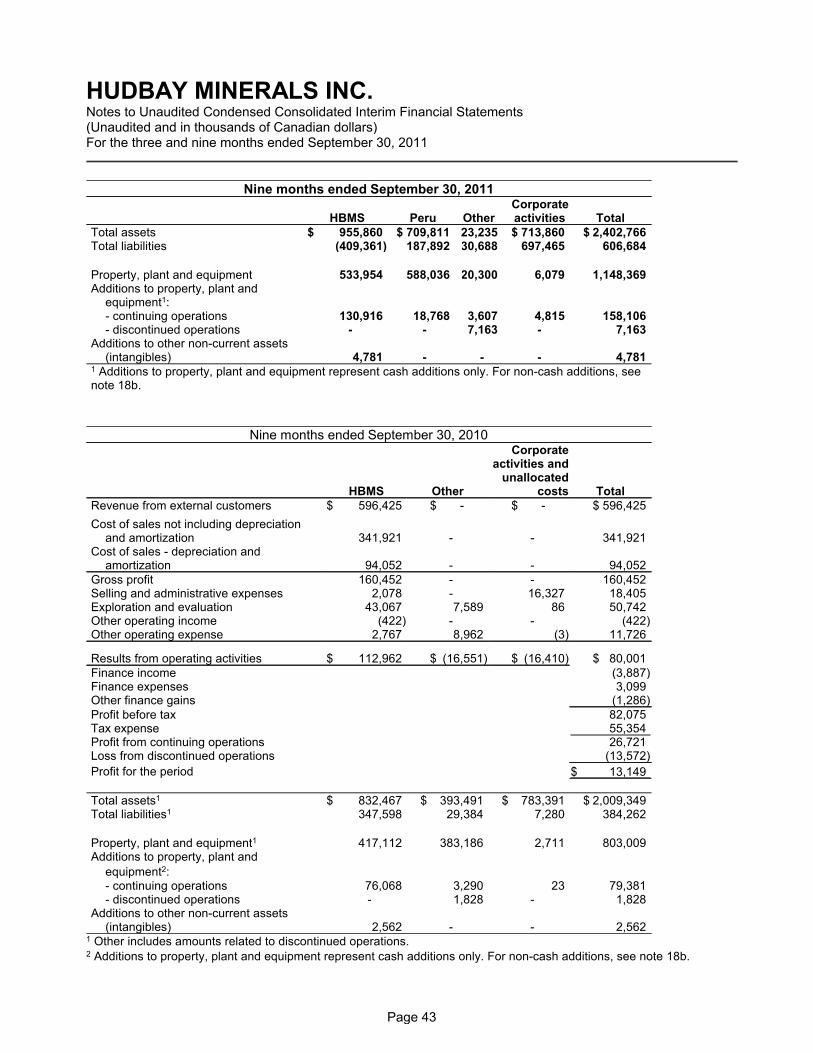
HUDBAY MINERALS INC.Notes to Unaudited Condensed Consolidated Interim Financial Statements(Unaudited and in thousands of Canadian dollars)For the three and nine months ended September 30, 2011
Nine months ended September 30, 2011
HBMS Peru OtherCorporateactivities Total
Total assets $ 955,860 $ 709,811 23,235 $ 713,860 $ 2,402,766Total liabilities (409,361) 187,892 130,688 697,465 606,684
Property, plant and equipment 533,954 588,036 20,300 6,079 1,148,369Additions to property, plant and
equipment1:- continuing operations 130,916 18,768 3,607 4,815 158,106- discontinued operations - - 7,163 - 7,163
Additions to other non-current assets(intangibles) 4,781 - - - 4,781
1 Additions to property, plant and equipment represent cash additions only. For non-cash additions, seenote 18b.
Nine months ended September 30, 2010
HBMS Other
Corporateactivities and
unallocatedcosts Total
Revenue from external customers $ 596,425 $ - $ - $ 596,425
Cost of sales not including depreciationand amortization 341,921 - - 341,921
Cost of sales - depreciation andamortization 94,052 - - 94,052
Gross profit 160,452 - - 160,452Selling and administrative expenses 2,078 - 16,327 18,405Exploration and evaluation 43,067 7,589 86 50,742Other operating income (422) - - (422)Other operating expense 2,767 8,962 (3) 11,726
Results from operating activities $ 112,962 $ (16,551) $ (16,410) $ 80,001Finance income (3,887)Finance expenses 3,099Other finance gains (1,286)Profit before tax 82,075Tax expense 55,354Profit from continuing operations 26,721Loss from discontinued operations (13,572)
Profit for the period $ 13,149
Total assets1 $ 832,467 $ 393,491 $ 783,391 $ 2,009,349Total liabilities1 347,598 29,384 7,280 384,262
Property, plant and equipment1 417,112 383,186 2,711 803,009Additions to property, plant and
equipment2:- continuing operations 76,068 3,290 23 79,381- discontinued operations - 1,828 - 1,828
Additions to other non-current assets(intangibles) 2,562 - - 2,562
1 Other includes amounts related to discontinued operations.2 Additions to property, plant and equipment represent cash additions only. For non-cash additions, see note 18b.
Page 43
HUDBAY MINERALS INC.Notes to Unaudited Condensed Consolidated Interim Financial Statements(Unaudited and in thousands of Canadian dollars)For the three and nine months ended September 30, 2011
20. Transition to IFRS
As stated in note 2a, the Group will present its first consolidated annual financial statements prepared inaccordance with IFRS for the year ending December 31, 2011, which will include comparative figures forthe year ended December 31, 2010.
The accounting policies disclosed in note 3 to the condensed consolidated interim financial statements forthe three months ended March 31, 2011, have been applied in preparing the condensed consolidatedinterim financial statements for the three and nine months ended September 30, 2011, the comparativeinformation presented in these interim financial statements for the three and nine months endedSeptember 30, 2010 and the year ended December 31, 2010 and in the preparation of an opening IFRSbalance sheet as at January 1, 2010 (the Group’s transition date).
In preparing its opening IFRS balance sheet, the Group has adjusted amounts reported previously infinancial statements prepared in accordance with Canadian GAAP. An explanation of the effect oftransition from Canadian GAAP to IFRS on the Group’s financial position, financial performance and cashflows is set out in the following tables and the notes that accompany the tables.
Exemptions applied:
IFRS 1, First-time Adoption of International Financial Reporting Standards, allows first-time adopterscertain optional exemptions from full retrospective application of IFRSs. The Group applied the followingexemptions as at January 1, 2010, its date of transition to IFRS:
Business combination exemption – The Group has elected not to apply IFRS 3, Business
Combinations, retrospectively to acquisitions of subsidiaries or of interests in associates and
joint ventures that occurred before January 1, 2010. This exemption also applies to purchases
accounted for as asset acquisitions under Canadian GAAP that would qualify as business
combinations under IFRS 3 (2008), which contains a broader definition of a business. The
Group has determined that its 2008 acquisition of HMI Nickel would qualify as a business
combination under IFRS 3 (2008). Accordingly, the Group has carried forward its Canadian
GAAP accounting treatment for such acquisitions. In addition, and as a condition under IFRS 1
in applying this exemption, goodwill relating to business combinations that occurred prior to
January 1, 2010 requires testing for impairment at the date of transition. However, no goodwill
was recognized in the Canadian GAAP accounting treatment for such acquisitions.
Employee benefits exemptions – The Group has elected to recognize all cumulative (and
previously unrecognized) actuarial gains and losses in retained earnings for defined benefit
plans as at January 1, 2010. The Group has also elected not to provide additional disclosures
regarding employee benefit plans, including certain information in respect of defined benefit
plans for the previous four annual periods, to the extent that such disclosures relate to a period
prior to the Group’s date of transition to IFRS.
Page 44
HUDBAY MINERALS INC.Notes to Unaudited Condensed Consolidated Interim Financial Statements(Unaudited and in thousands of Canadian dollars)For the three and nine months ended September 30, 2011
Exemption for decommissioning, restoration and similar liabilities included in the cost of
property, plant and equipment – The Group has elected not to apply IFRIC 1, Changes in
Existing Decommissioning, Restoration and Similar Liabilities, retrospectively to determine the
amount of decommissioning, restoration and similar liabilities to be included in the carrying value
of property, plant and equipment as at January 1, 2010. Instead, the Group has determined such
carrying values by determining the amount of the liability as at January 1, 2010 in accordance
with IAS 37, Provisions, Contingent Liabilities and Contingent Assets, estimating the amount that
would have been included in the cost of the related asset when the liability first arose and
calculating the accumulated depreciation on that amount as at January 1, 2010 based on the
Group’s current estimate of the useful life of the asset and the depreciation policy applied in
accordance with IFRS.
Deemed cost exemption – The Group has elected to use fair value as at September 30, 2008
as deemed cost for its Balmat property, plant and equipment as at this date. On September 30,
2008, the Group revalued these Balmat assets to their fair value of nil as a result of recognizing
impairment losses, as previously reported in the Group’s Canadian GAAP December 31, 2008
audited annual consolidated financial statements.
Cumulative translation differences exemption – The Group has elected to deem cumulative
translation differences for all foreign operations to be zero at January 1, 2010, and reclassify any
such amounts determined in accordance with Canadian GAAP at that date to retained earnings.
Borrowing costs exemption – The Group has elected to apply IAS 23, Borrowing Costs,
prospectively to borrowing costs related to qualifying assets for which the commencement date
for capitalization was on or after August 1, 2008. Accordingly, the Group has carried forward its
Canadian GAAP accounting treatment for borrowing costs related to qualifying assets for which
the commencement date for capitalization was prior to August 1, 2008.
Share-based payment exemption – The Group has elected not to apply IFRS 2, Share-based
Payment, retrospectively to equity instruments in share-based payment transactions that were
granted on or before November 7, 2002, equity instruments granted after November 7, 2002 that
vested before January 1, 2010, and liabilities for cash-settled share-based payment transactions
that were settled before January 1, 2010.
Lease exemption – The Group has elected to determine whether arrangements existing at
January 1, 2010 contain a lease on the basis of facts and circumstances existing at that date.
Page 45
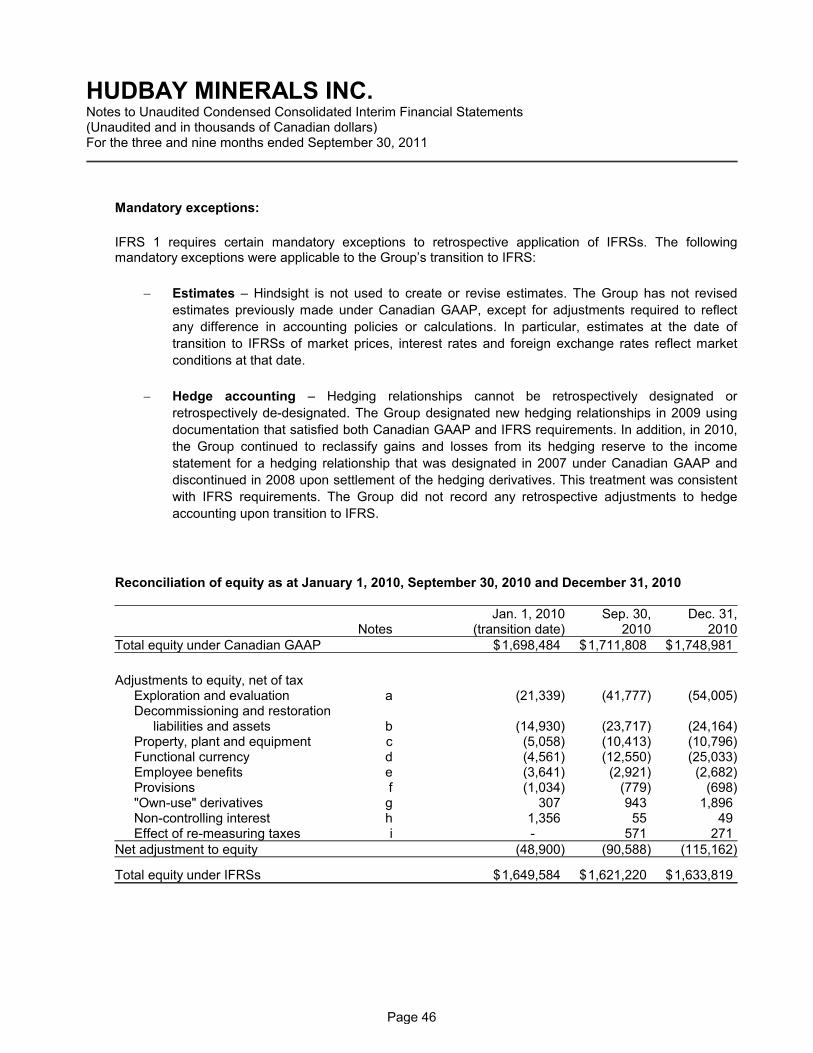
HUDBAY MINERALS INC.Notes to Unaudited Condensed Consolidated Interim Financial Statements(Unaudited and in thousands of Canadian dollars)For the three and nine months ended September 30, 2011
Mandatory exceptions:
IFRS 1 requires certain mandatory exceptions to retrospective application of IFRSs. The followingmandatory exceptions were applicable to the Group’s transition to IFRS:
Estimates – Hindsight is not used to create or revise estimates. The Group has not revised
estimates previously made under Canadian GAAP, except for adjustments required to reflect
any difference in accounting policies or calculations. In particular, estimates at the date of
transition to IFRSs of market prices, interest rates and foreign exchange rates reflect market
conditions at that date.
Hedge accounting – Hedging relationships cannot be retrospectively designated or
retrospectively de-designated. The Group designated new hedging relationships in 2009 using
documentation that satisfied both Canadian GAAP and IFRS requirements. In addition, in 2010,
the Group continued to reclassify gains and losses from its hedging reserve to the income
statement for a hedging relationship that was designated in 2007 under Canadian GAAP and
discontinued in 2008 upon settlement of the hedging derivatives. This treatment was consistent
with IFRS requirements. The Group did not record any retrospective adjustments to hedge
accounting upon transition to IFRS.
Reconciliation of equity as at January 1, 2010, September 30, 2010 and December 31, 2010
Jan. 1, 2010 Sep. 30, Dec. 31,Notes (transition date) 2010 2010
Total equity under Canadian GAAP $1,698,484 $1,711,808 $1,748,981
Adjustments to equity, net of taxExploration and evaluation a (21,339) (41,777) (54,005)Decommissioning and restoration
liabilities and assets b (14,930) (23,717) (24,164)Property, plant and equipment c (5,058) (10,413) (10,796)Functional currency d (4,561) (12,550) (25,033)Employee benefits e (3,641) (2,921) (2,682)Provisions f (1,034) (779) (698)"Own-use" derivatives g 307 943 1,896Non-controlling interest h 1,356 55 49Effect of re-measuring taxes i - 571 271
Net adjustment to equity (48,900) (90,588) (115,162)
Total equity under IFRSs $1,649,584 $1,621,220 $1,633,819
Page 46
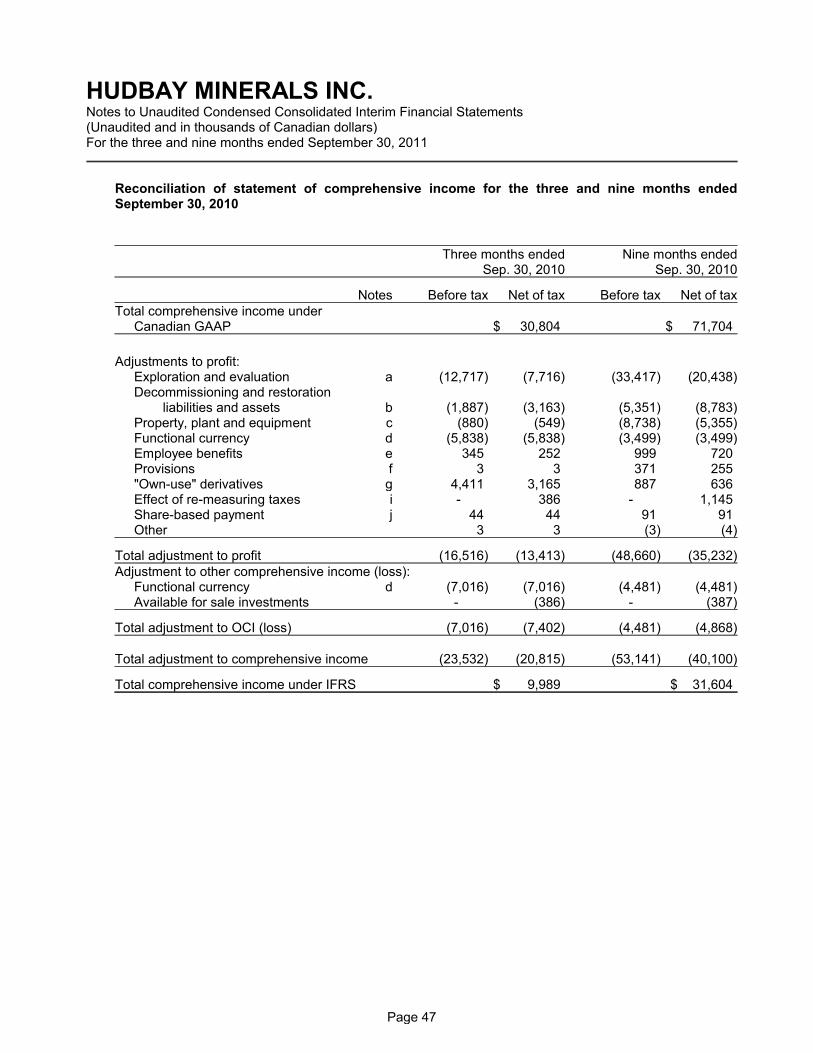
HUDBAY MINERALS INC.Notes to Unaudited Condensed Consolidated Interim Financial Statements(Unaudited and in thousands of Canadian dollars)For the three and nine months ended September 30, 2011
Reconciliation of statement of comprehensive income for the three and nine months endedSeptember 30, 2010
Three months ended Nine months endedSep. 30, 2010 Sep. 30, 2010
Notes Before tax Net of tax Before tax Net of taxTotal comprehensive income under
Canadian GAAP $ 30,804 $ 71,704
Adjustments to profit:Exploration and evaluation a (12,717) (7,716) (33,417) (20,438)Decommissioning and restoration
liabilities and assets b (1,887) (3,163) (5,351) (8,783)Property, plant and equipment c (880) (549) (8,738) (5,355)Functional currency d (5,838) (5,838) (3,499) (3,499)Employee benefits e 345 252 999 720Provisions f 3 3 371 255"Own-use" derivatives g 4,411 3,165 887 636Effect of re-measuring taxes i - 386 - 1,145Share-based payment j 44 44 91 91Other 3 3 (3) (4)
Total adjustment to profit (16,516) (13,413) (48,660) (35,232)Adjustment to other comprehensive income (loss):
Functional currency d (7,016) (7,016) (4,481) (4,481)Available for sale investments - (386) - (387)
Total adjustment to OCI (loss) (7,016) (7,402) (4,481) (4,868)
Total adjustment to comprehensive income (23,532) (20,815) (53,141) (40,100)
Total comprehensive income under IFRS $ 9,989 $ 31,604
Page 47
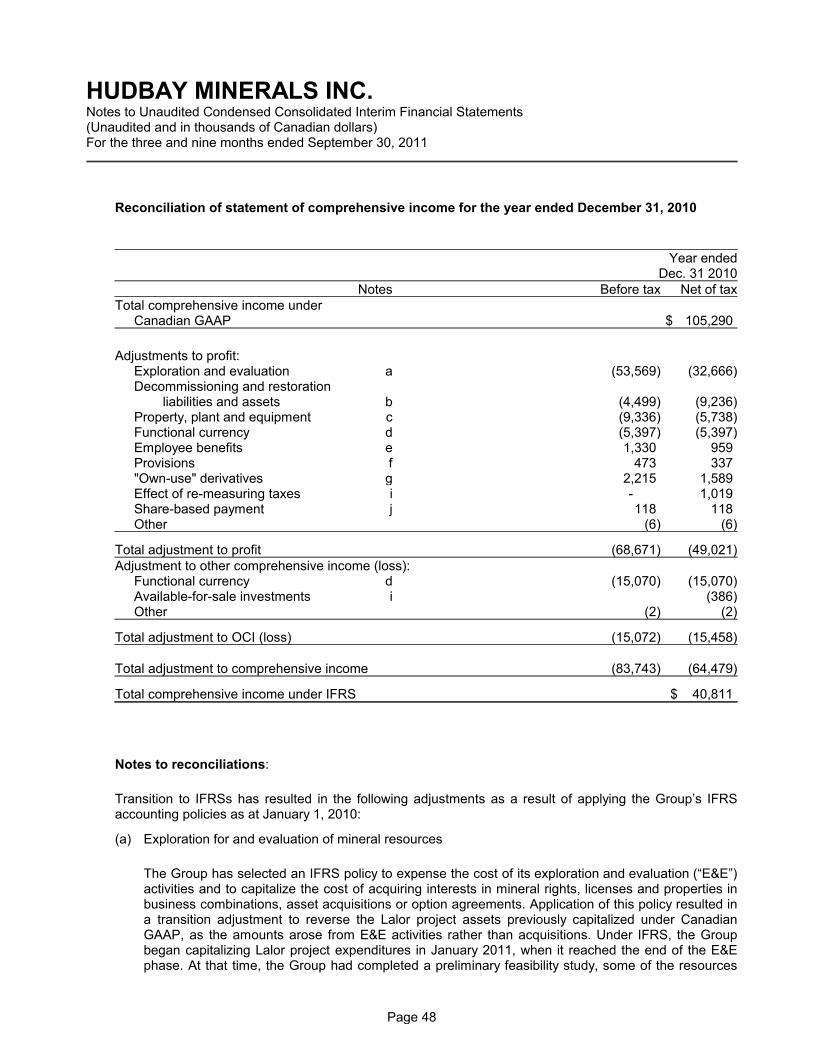
HUDBAY MINERALS INC.Notes to Unaudited Condensed Consolidated Interim Financial Statements(Unaudited and in thousands of Canadian dollars)For the three and nine months ended September 30, 2011
Reconciliation of statement of comprehensive income for the year ended December 31, 2010
Year endedDec. 31 2010
Notes Before tax Net of taxTotal comprehensive income under
Canadian GAAP $ 105,290
Adjustments to profit:Exploration and evaluation a (53,569) (32,666)Decommissioning and restoration
liabilities and assets b (4,499) (9,236)Property, plant and equipment c (9,336) (5,738)Functional currency d (5,397) (5,397)Employee benefits e 1,330 959Provisions f 473 337"Own-use" derivatives g 2,215 1,589Effect of re-measuring taxes i - 1,019Share-based payment j 118 118Other (6) (6)
Total adjustment to profit (68,671) (49,021)Adjustment to other comprehensive income (loss):
Functional currency d (15,070) (15,070)Available-for-sale investments i (386)Other (2) (2)
Total adjustment to OCI (loss) (15,072) (15,458)
Total adjustment to comprehensive income (83,743) (64,479)
Total comprehensive income under IFRS $ 40,811
Notes to reconciliations:
Transition to IFRSs has resulted in the following adjustments as a result of applying the Group’s IFRSaccounting policies as at January 1, 2010:
(a) Exploration for and evaluation of mineral resources
The Group has selected an IFRS policy to expense the cost of its exploration and evaluation (“E&E”)activities and to capitalize the cost of acquiring interests in mineral rights, licenses and properties inbusiness combinations, asset acquisitions or option agreements. Application of this policy resulted ina transition adjustment to reverse the Lalor project assets previously capitalized under CanadianGAAP, as the amounts arose from E&E activities rather than acquisitions. Under IFRS, the Groupbegan capitalizing Lalor project expenditures in January 2011, when it reached the end of the E&Ephase. At that time, the Group had completed a preliminary feasibility study, some of the resources
Page 48
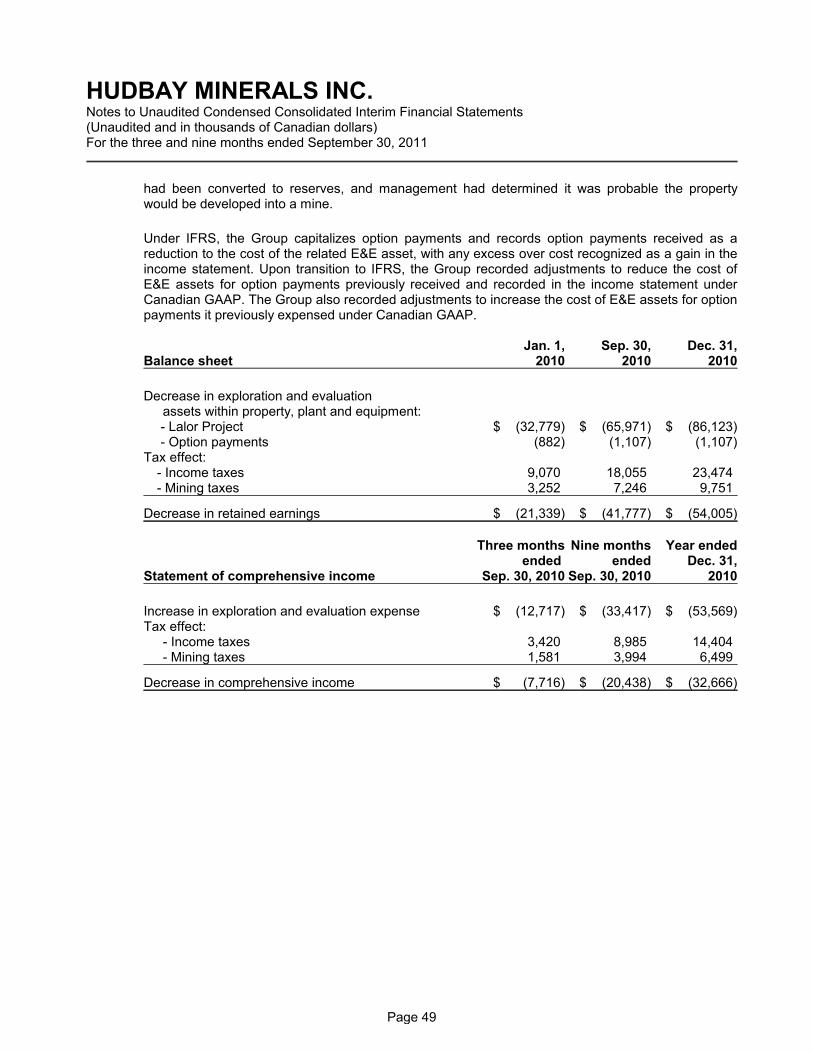
HUDBAY MINERALS INC.Notes to Unaudited Condensed Consolidated Interim Financial Statements(Unaudited and in thousands of Canadian dollars)For the three and nine months ended September 30, 2011
had been converted to reserves, and management had determined it was probable the propertywould be developed into a mine.
Under IFRS, the Group capitalizes option payments and records option payments received as areduction to the cost of the related E&E asset, with any excess over cost recognized as a gain in theincome statement. Upon transition to IFRS, the Group recorded adjustments to reduce the cost ofE&E assets for option payments previously received and recorded in the income statement underCanadian GAAP. The Group also recorded adjustments to increase the cost of E&E assets for optionpayments it previously expensed under Canadian GAAP.
Jan. 1, Sep. 30, Dec. 31,Balance sheet 2010 2010 2010
Decrease in exploration and evaluationassets within property, plant and equipment:
- Lalor Project $ (32,779) $ (65,971) $ (86,123) - Option payments (882) (1,107) (1,107)
Tax effect: - Income taxes 9,070 18,055 23,474 - Mining taxes 3,252 7,246 9,751
Decrease in retained earnings $ (21,339) $ (41,777) $ (54,005)
Three months Nine months Year endedended ended Dec. 31,
Statement of comprehensive income Sep. 30, 2010 Sep. 30, 2010 2010
Increase in exploration and evaluation expense $ (12,717) $ (33,417) $ (53,569)Tax effect:
- Income taxes 3,420 8,985 14,404- Mining taxes 1,581 3,994 6,499
Decrease in comprehensive income $ (7,716) $ (20,438) $ (32,666)
Page 49
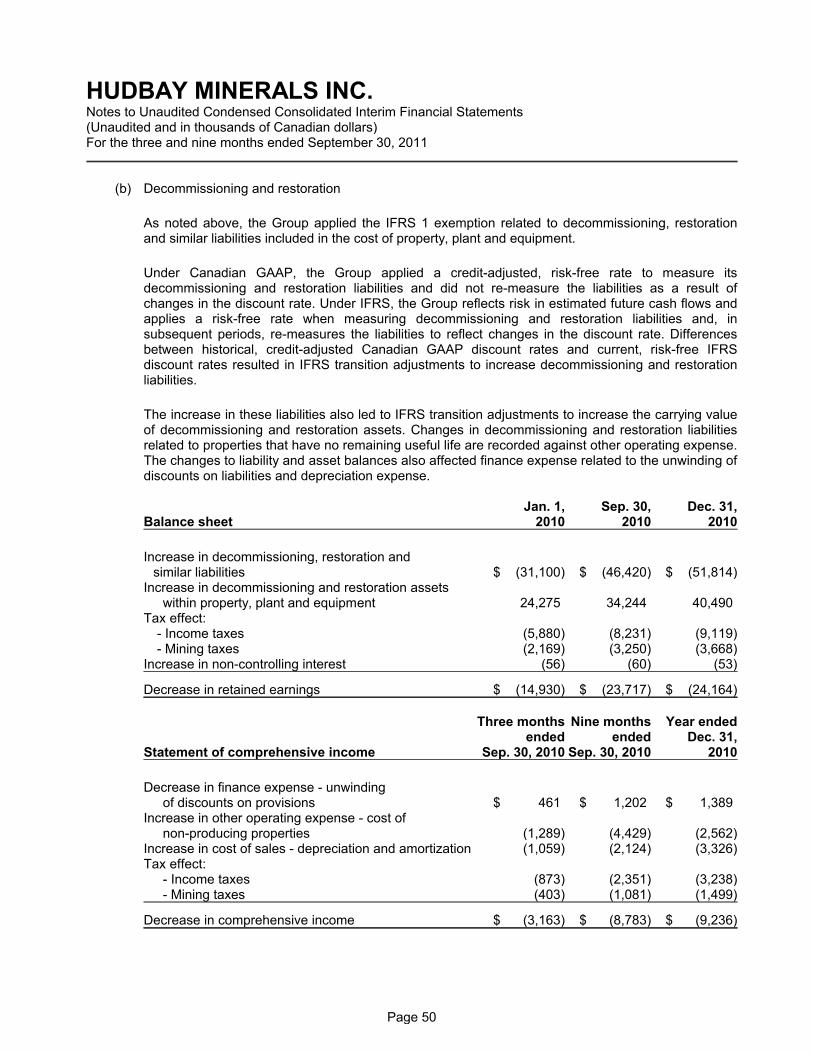
HUDBAY MINERALS INC.Notes to Unaudited Condensed Consolidated Interim Financial Statements(Unaudited and in thousands of Canadian dollars)For the three and nine months ended September 30, 2011
(b) Decommissioning and restoration
As noted above, the Group applied the IFRS 1 exemption related to decommissioning, restorationand similar liabilities included in the cost of property, plant and equipment.
Under Canadian GAAP, the Group applied a credit-adjusted, risk-free rate to measure itsdecommissioning and restoration liabilities and did not re-measure the liabilities as a result ofchanges in the discount rate. Under IFRS, the Group reflects risk in estimated future cash flows andapplies a risk-free rate when measuring decommissioning and restoration liabilities and, insubsequent periods, re-measures the liabilities to reflect changes in the discount rate. Differencesbetween historical, credit-adjusted Canadian GAAP discount rates and current, risk-free IFRSdiscount rates resulted in IFRS transition adjustments to increase decommissioning and restorationliabilities.
The increase in these liabilities also led to IFRS transition adjustments to increase the carrying valueof decommissioning and restoration assets. Changes in decommissioning and restoration liabilitiesrelated to properties that have no remaining useful life are recorded against other operating expense.The changes to liability and asset balances also affected finance expense related to the unwinding ofdiscounts on liabilities and depreciation expense.
Jan. 1, Sep. 30, Dec. 31,Balance sheet 2010 2010 2010
Increase in decommissioning, restoration andsimilar liabilities $ (31,100) $ (46,420) $ (51,814)
Increase in decommissioning and restoration assetswithin property, plant and equipment 24,275 34,244 40,490
Tax effect: - Income taxes (5,880) (8,231) (9,119) - Mining taxes (2,169) (3,250) (3,668)
Increase in non-controlling interest (56) (60) (53)
Decrease in retained earnings $ (14,930) $ (23,717) $ (24,164)
Three months Nine months Year endedended ended Dec. 31,
Statement of comprehensive income Sep. 30, 2010 Sep. 30, 2010 2010
Decrease in finance expense - unwinding of discounts on provisions $ 461 $ 1,202 $ 1,389
Increase in other operating expense - cost of non-producing properties (1,289) (4,429) (2,562)
Increase in cost of sales - depreciation and amortization (1,059) (2,124) (3,326)Tax effect:
- Income taxes (873) (2,351) (3,238)- Mining taxes (403) (1,081) (1,499)
Decrease in comprehensive income $ (3,163) $ (8,783) $ (9,236)
Page 50
HUDBAY MINERALS INC.Notes to Unaudited Condensed Consolidated Interim Financial Statements(Unaudited and in thousands of Canadian dollars)For the three and nine months ended September 30, 2011
(c) Property, plant and equipment
IFRS requires capitalized costs to be directly attributable to bringing assets to a working condition fortheir intended use and requires depreciation to be calculated separately for individual components ofan item of property, plant and equipment that have costs significant in relation to the total cost of theitem. Under IFRS, components may be physical or non-physical. Costs of major inspections andoverhauls are capitalized as separate components and depreciated over the useful lives of the majorinspection or overhaul. Requirements under Canadian GAAP, while similar, are less specific.
Application of IFRS required the Group to account for components at a more detailed level.Identification of additional components with shorter useful lives than that of the item of property, plantand equipment resulted in IFRS transition adjustments to increase accumulated depreciation. Forcertain equipment, the increase in accumulated depreciation also reflected a change in depreciationmethod from unit-of-production to straight-line because the expected pattern of future economicbenefits was different at the lower level of componentization.
The Group recorded IFRS transition adjustments to increase the carrying value of property, plant andequipment for major inspection and overhauls of mobile equipment that required capitalization asseparate components under IFRS but were expensed under Canadian GAAP.
In addition, IFRS requires depreciation of equipment used in construction projects to be capitalized.Canadian GAAP requirements, while similar, are less specific. The Group has recorded IFRSadjustments to reflect the capitalization of depreciation of equipment used in capital minedevelopment. This resulted in increases to the capital cost of mining properties.
The Group recorded IFRS transition adjustments to decrease the carrying value of property, plantand equipment for owners’ costs that were capitalized to a development project under CanadianGAAP but under IFRS are not considered directly attributable to bringing the assets to a workingcondition for their intended use.
These changes resulted in adjustments to the Group's depreciation expense throughout its 2010transition year.
Page 51

HUDBAY MINERALS INC.Notes to Unaudited Condensed Consolidated Interim Financial Statements(Unaudited and in thousands of Canadian dollars)For the three and nine months ended September 30, 2011
Jan. 1, Sep. 30, Dec. 31,Balance sheet 2010 2010 2010
Decrease in property, plant and equipment $ (7,994) $ (16,732) $ (17,330)Tax effect:
- Income taxes 2,149 4,499 4,656 - Mining taxes 787 1,820 1,878
Decrease in retained earnings $ (5,058) $ (10,413) $ (10,796)
Three months Nine months Year endedended ended Dec. 31,
Statement of comprehensive income Sep. 30, 2010 Sep. 30, 2010 2010
Increase in cost of sales - depreciation and amortization and other cost of sales $ (880) $ (8,738) $ (9,336)
Tax effect:- Income taxes 236 2,350 2,507- Mining taxes 95 1,033 1,091
Decrease in comprehensive income $ (549) $ (5,355) $ (5,738)
Page 52
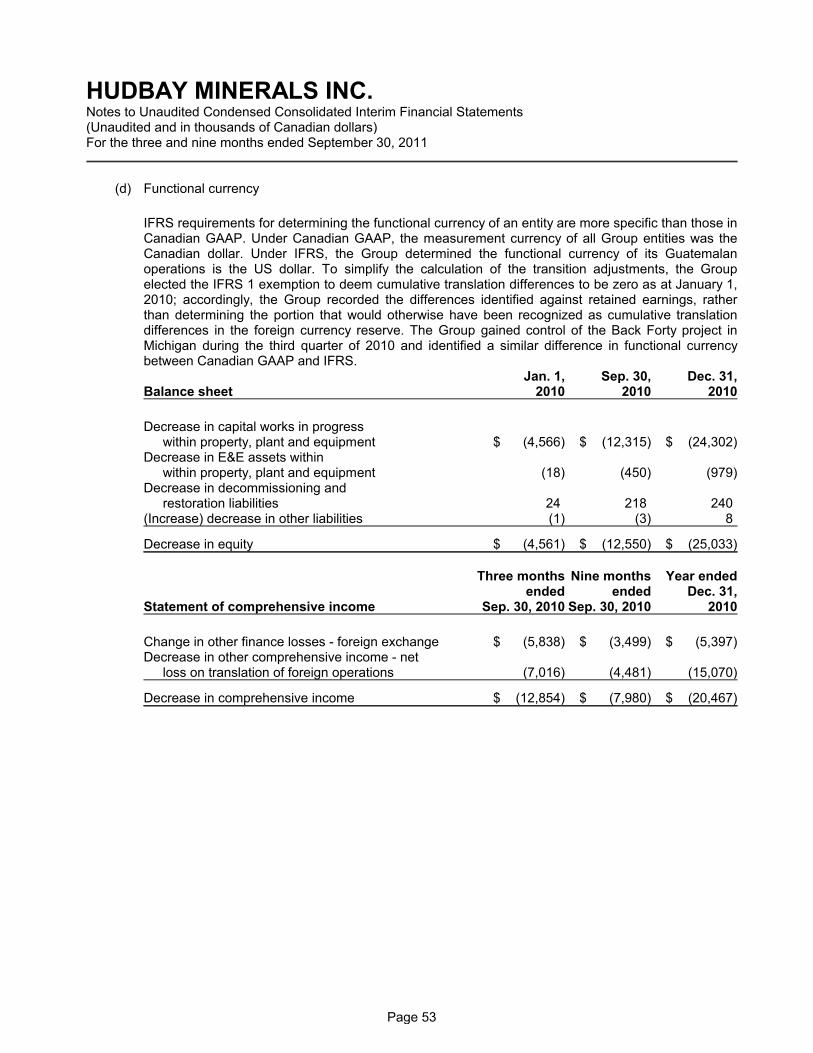
HUDBAY MINERALS INC.Notes to Unaudited Condensed Consolidated Interim Financial Statements(Unaudited and in thousands of Canadian dollars)For the three and nine months ended September 30, 2011
(d) Functional currency
IFRS requirements for determining the functional currency of an entity are more specific than those inCanadian GAAP. Under Canadian GAAP, the measurement currency of all Group entities was theCanadian dollar. Under IFRS, the Group determined the functional currency of its Guatemalanoperations is the US dollar. To simplify the calculation of the transition adjustments, the Groupelected the IFRS 1 exemption to deem cumulative translation differences to be zero as at January 1,2010; accordingly, the Group recorded the differences identified against retained earnings, ratherthan determining the portion that would otherwise have been recognized as cumulative translationdifferences in the foreign currency reserve. The Group gained control of the Back Forty project inMichigan during the third quarter of 2010 and identified a similar difference in functional currencybetween Canadian GAAP and IFRS.
Jan. 1, Sep. 30, Dec. 31,Balance sheet 2010 2010 2010
Decrease in capital works in progress within property, plant and equipment $ (4,566) $ (12,315) $ (24,302)
Decrease in E&E assets withinwithin property, plant and equipment (18) (450) (979)
Decrease in decommissioning and restoration liabilities 24 218 240
(Increase) decrease in other liabilities (1) (3) 8
Decrease in equity $ (4,561) $ (12,550) $ (25,033)
Three months Nine months Year endedended ended Dec. 31,
Statement of comprehensive income Sep. 30, 2010 Sep. 30, 2010 2010
Change in other finance losses - foreign exchange $ (5,838) $ (3,499) $ (5,397)Decrease in other comprehensive income - net
loss on translation of foreign operations (7,016) (4,481) (15,070)
Decrease in comprehensive income $ (12,854) $ (7,980) $ (20,467)
Page 53
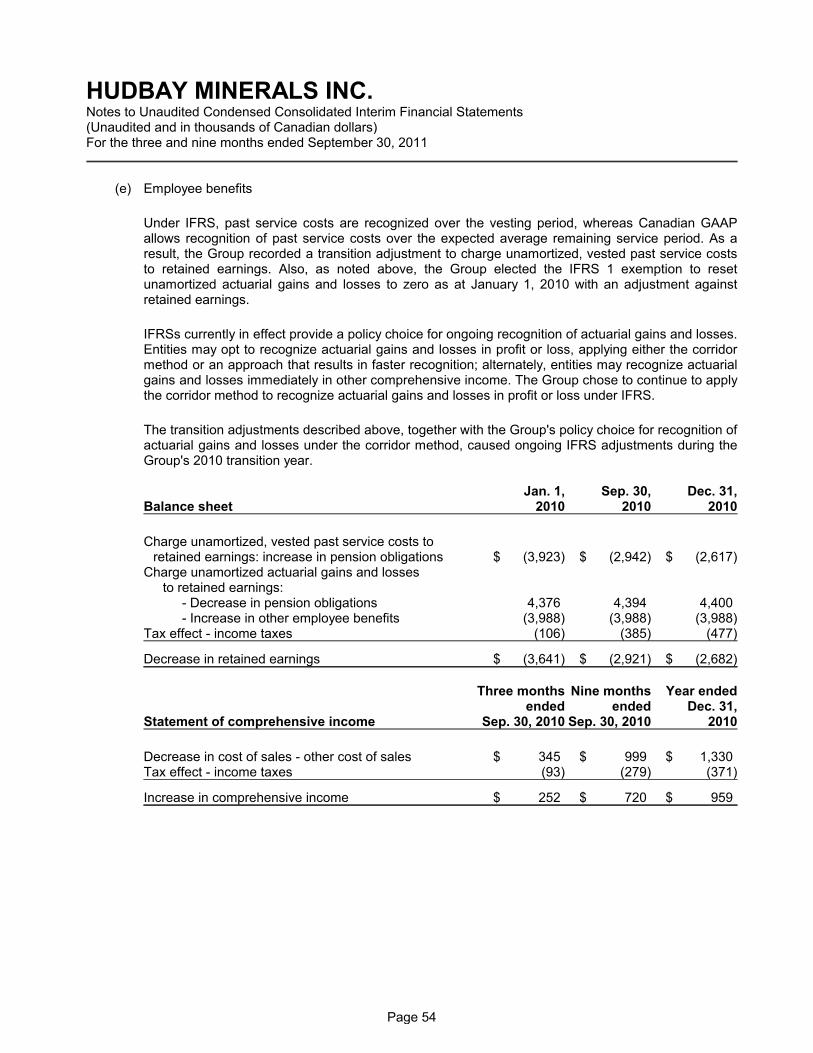
HUDBAY MINERALS INC.Notes to Unaudited Condensed Consolidated Interim Financial Statements(Unaudited and in thousands of Canadian dollars)For the three and nine months ended September 30, 2011
(e) Employee benefits
Under IFRS, past service costs are recognized over the vesting period, whereas Canadian GAAPallows recognition of past service costs over the expected average remaining service period. As aresult, the Group recorded a transition adjustment to charge unamortized, vested past service coststo retained earnings. Also, as noted above, the Group elected the IFRS 1 exemption to resetunamortized actuarial gains and losses to zero as at January 1, 2010 with an adjustment againstretained earnings.
IFRSs currently in effect provide a policy choice for ongoing recognition of actuarial gains and losses.Entities may opt to recognize actuarial gains and losses in profit or loss, applying either the corridormethod or an approach that results in faster recognition; alternately, entities may recognize actuarialgains and losses immediately in other comprehensive income. The Group chose to continue to applythe corridor method to recognize actuarial gains and losses in profit or loss under IFRS.
The transition adjustments described above, together with the Group's policy choice for recognition ofactuarial gains and losses under the corridor method, caused ongoing IFRS adjustments during theGroup's 2010 transition year.
Jan. 1, Sep. 30, Dec. 31,Balance sheet 2010 2010 2010
Charge unamortized, vested past service costs to retained earnings: increase in pension obligations $ (3,923) $ (2,942) $ (2,617)
Charge unamortized actuarial gains and losses to retained earnings:
- Decrease in pension obligations 4,376 4,394 4,400- Increase in other employee benefits (3,988) (3,988) (3,988)
Tax effect - income taxes (106) (385) (477)
Decrease in retained earnings $ (3,641) $ (2,921) $ (2,682)
Three months Nine months Year endedended ended Dec. 31,
Statement of comprehensive income Sep. 30, 2010 Sep. 30, 2010 2010
Decrease in cost of sales - other cost of sales $ 345 $ 999 $ 1,330Tax effect - income taxes (93) (279) (371)
Increase in comprehensive income $ 252 $ 720 $ 959
Page 54

HUDBAY MINERALS INC.Notes to Unaudited Condensed Consolidated Interim Financial Statements(Unaudited and in thousands of Canadian dollars)For the three and nine months ended September 30, 2011
(f) Provisions
IFRS requires recognition of provisions that are constructive obligations, which arise when an entity’spast practice or sufficiently detailed public statements have created a valid expectation in otherparties that it will carry out an action. The Group recorded transition adjustments for donationcommitments previously made that require recognition under IFRS as constructive obligations butunder Canadian GAAP were recorded as payments were made.
Jan. 1, Sep. 30, Dec. 31,Balance sheet 2010 2010 2010
Increase in other provisions - Current (presented in other liabilities) $ (546) $ (575) $ (524)- Non-current (810) (410) (359)
Tax effect - income taxes 317 201 181Decrease in non-controlling interest 5 5 4
Decrease in retained earnings $ (1,034) $ (779) $ (698)
Three months Nine months Year endedended ended Dec. 31,
Statement of comprehensive income Sep. 30, 2010 Sep. 30, 2010 2010
Decrease in cost of sales - other cost of sales $ 3 $ 171 $ 237Decrease in selling and administrative expenses - 200 200Decrease in other operating expenses - - 36Tax effect - income taxes - (116) (136)
Increase in comprehensive income $ 3 $ 255 $ 337
Page 55
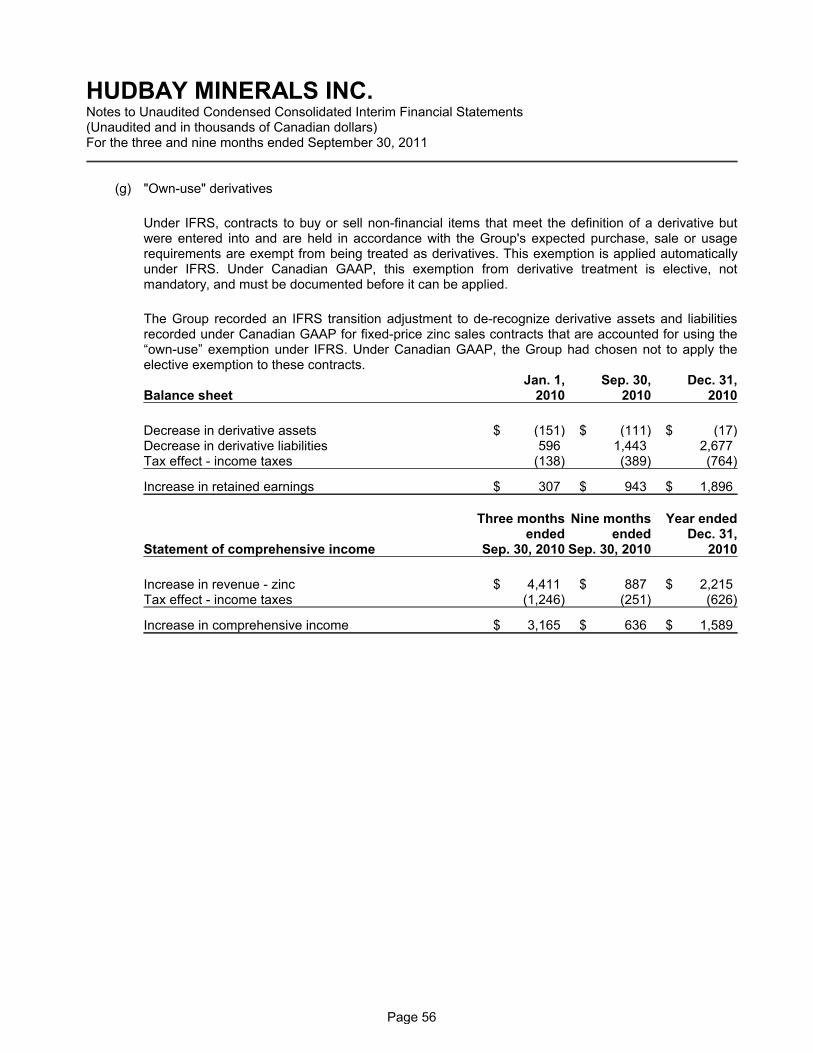
HUDBAY MINERALS INC.Notes to Unaudited Condensed Consolidated Interim Financial Statements(Unaudited and in thousands of Canadian dollars)For the three and nine months ended September 30, 2011
(g) "Own-use" derivatives
Under IFRS, contracts to buy or sell non-financial items that meet the definition of a derivative butwere entered into and are held in accordance with the Group's expected purchase, sale or usagerequirements are exempt from being treated as derivatives. This exemption is applied automaticallyunder IFRS. Under Canadian GAAP, this exemption from derivative treatment is elective, notmandatory, and must be documented before it can be applied.
The Group recorded an IFRS transition adjustment to de-recognize derivative assets and liabilitiesrecorded under Canadian GAAP for fixed-price zinc sales contracts that are accounted for using the“own-use” exemption under IFRS. Under Canadian GAAP, the Group had chosen not to apply theelective exemption to these contracts.
Jan. 1, Sep. 30, Dec. 31,Balance sheet 2010 2010 2010
Decrease in derivative assets $ (151) $ (111) $ (17)Decrease in derivative liabilities 596 1,443 2,677Tax effect - income taxes (138) (389) (764)
Increase in retained earnings $ 307 $ 943 $ 1,896
Three months Nine months Year endedended ended Dec. 31,
Statement of comprehensive income Sep. 30, 2010 Sep. 30, 2010 2010
Increase in revenue - zinc $ 4,411 $ 887 $ 2,215Tax effect - income taxes (1,246) (251) (626)
Increase in comprehensive income $ 3,165 $ 636 $ 1,589
Page 56
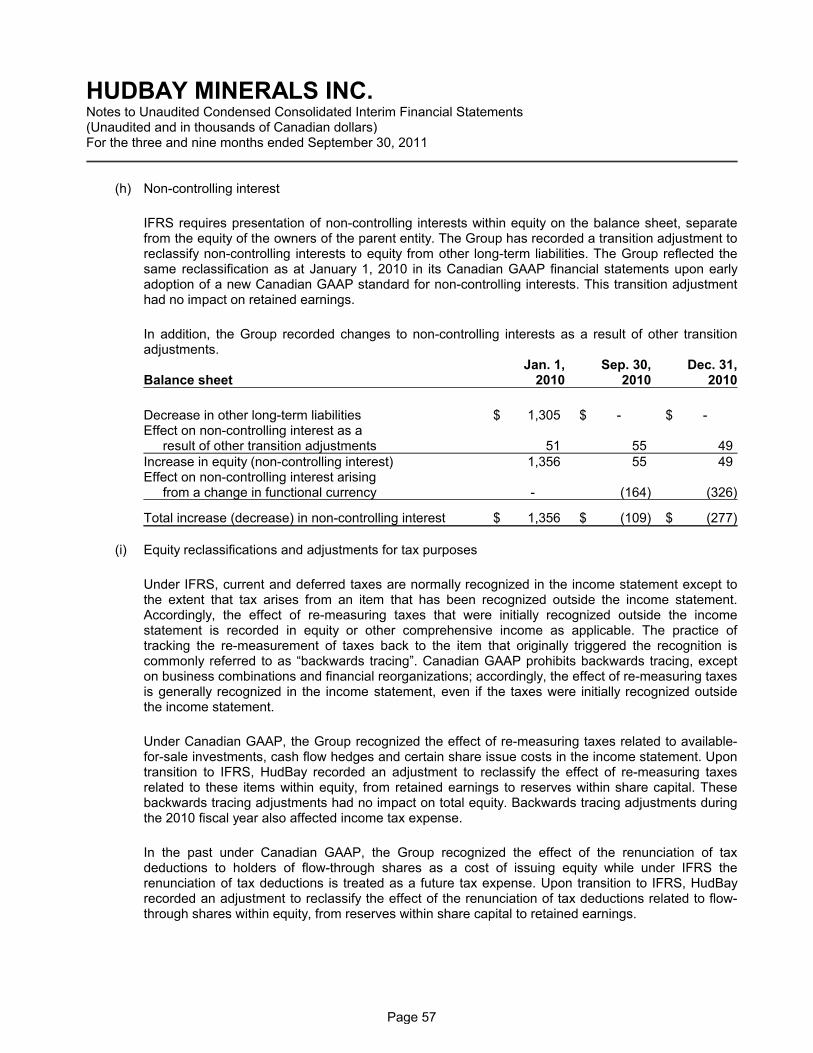
HUDBAY MINERALS INC.Notes to Unaudited Condensed Consolidated Interim Financial Statements(Unaudited and in thousands of Canadian dollars)For the three and nine months ended September 30, 2011
(h) Non-controlling interest
IFRS requires presentation of non-controlling interests within equity on the balance sheet, separatefrom the equity of the owners of the parent entity. The Group has recorded a transition adjustment toreclassify non-controlling interests to equity from other long-term liabilities. The Group reflected thesame reclassification as at January 1, 2010 in its Canadian GAAP financial statements upon earlyadoption of a new Canadian GAAP standard for non-controlling interests. This transition adjustmenthad no impact on retained earnings.
In addition, the Group recorded changes to non-controlling interests as a result of other transitionadjustments.
Jan. 1, Sep. 30, Dec. 31,Balance sheet 2010 2010 2010
Decrease in other long-term liabilities $ 1,305 $ - $ -Effect on non-controlling interest as a
result of other transition adjustments 51 55 49Increase in equity (non-controlling interest) 1,356 55 49Effect on non-controlling interest arising
from a change in functional currency - (164) (326)
Total increase (decrease) in non-controlling interest $ 1,356 $ (109) $ (277)
(i) Equity reclassifications and adjustments for tax purposes
Under IFRS, current and deferred taxes are normally recognized in the income statement except tothe extent that tax arises from an item that has been recognized outside the income statement.Accordingly, the effect of re-measuring taxes that were initially recognized outside the incomestatement is recorded in equity or other comprehensive income as applicable. The practice oftracking the re-measurement of taxes back to the item that originally triggered the recognition iscommonly referred to as “backwards tracing”. Canadian GAAP prohibits backwards tracing, excepton business combinations and financial reorganizations; accordingly, the effect of re-measuring taxesis generally recognized in the income statement, even if the taxes were initially recognized outsidethe income statement.
Under Canadian GAAP, the Group recognized the effect of re-measuring taxes related to available-for-sale investments, cash flow hedges and certain share issue costs in the income statement. Upontransition to IFRS, HudBay recorded an adjustment to reclassify the effect of re-measuring taxesrelated to these items within equity, from retained earnings to reserves within share capital. Thesebackwards tracing adjustments had no impact on total equity. Backwards tracing adjustments duringthe 2010 fiscal year also affected income tax expense.
In the past under Canadian GAAP, the Group recognized the effect of the renunciation of taxdeductions to holders of flow-through shares as a cost of issuing equity while under IFRS therenunciation of tax deductions is treated as a future tax expense. Upon transition to IFRS, HudBayrecorded an adjustment to reclassify the effect of the renunciation of tax deductions related to flow-through shares within equity, from reserves within share capital to retained earnings.
Page 57

HUDBAY MINERALS INC.Notes to Unaudited Condensed Consolidated Interim Financial Statements(Unaudited and in thousands of Canadian dollars)For the three and nine months ended September 30, 2011
In addition, during the three months ended June 30, 2010, the Group adjusted its estimate ofdeferred mining taxes related to IFRS adjustments as a result of changes in assumptions related tothe tax rate that will be applicable when temporary differences reverse. The province of Manitobaimposes a mining tax rate based on the level of mining profit of mineral products mined in theprovince. Consequently, changes in assumptions regarding future mining profit can significantly affectthe applicable tax rate.
Jan. 1, Sep. 30, Dec. 31,Balance sheet 2010 2010 2010
Backwards tracing - share issue costs- Increase to share capital $ (5,931) $ (5,931) $ (5,931)
Flow through shares - Increase to share capital (6,369) (6,369) (6,369)
Backwards tracing - other comprehensive income- Increase to available-for-sale reserve (491) (491) (491)- Decrease to hedging reserve 140 140 140
Effect of change in estimates - Income taxes - increase to deferred tax liability - - (300)- Mining taxes - increase to deferred tax asset - 571 571
Decrease in retained earnings $ (12,651) $ (12,080) $ (12,380)
Three months Nine months Year endedended ended Dec. 31,
Statement of comprehensive income Sep. 30, 2010 Sep. 30, 2010 2010
Transfer from available-for-sale reserve to income statement:Decrease in income tax expense $ 386 $ 386 $ 386Decrease in OCI (386) (386) (386)
Decrease in income tax expense - 188 62Decrease in mining tax expense - 571 571
Increase in comprehensive income $ - $ 759 $ 633
Page 58

HUDBAY MINERALS INC.Notes to Unaudited Condensed Consolidated Interim Financial Statements(Unaudited and in thousands of Canadian dollars)For the three and nine months ended September 30, 2011
(j) Share-based payment
IFRS requires measurement of equity-settled instruments based on the number of equity instrumentsthat are expected to vest, unless forfeitures are due to market-based conditions. Under CanadianGAAP, HudBay accrues compensation cost as if all equity instruments granted were expected to vestand recognizes the effect of actual forfeitures as they occur.
Upon transition to IFRS, the Group calculated an adjustment to reflect the effect of estimatingforfeitures for unvested stock options outstanding as at January 1, 2010 and reclassified amountswithin equity, from other capital reserve to retained earnings. The Group determined its estimate offorfeitures using historical information available at the transition date.
This transition adjustment had no impact on total equity.Jan. 1, Sep. 30, Dec. 31,
Balance sheet 2010 2010 2010
Decrease in other capital reserve $ 232 $ 323 $ 350
Increase in retained earnings $ 232 $ 323 $ 350
Three months Nine months Year endedended ended Dec. 31,
Statement of comprehensive income Sep. 30, 2010 Sep. 30, 2010 2010
Decrease in selling and administrative expenses - share-based payment $ 44 $ 91 $ 118
Increase in comprehensive income $ 44 $ 91 $ 118
Page 59

HUDBAY MINERALS INC.Notes to Unaudited Condensed Consolidated Interim Financial Statements(Unaudited and in thousands of Canadian dollars)For the three and nine months ended September 30, 2011
Effect of transition to IFRS on statement of cash flows for the three months ended September 30, 2010:
Canadian GAAP IFRS changes IFRSNet cash flows from operating activities $ 31,933 $ (13,045) $ 18,888Net cash flows from investing activities (76,047) 13,045 (63,002)
Net cash flows from financing activities (13,514) - (13,514)
Effect of movement in exchange rates on cashand cash equivalents (2,411) - (2,411)Net increase (decrease) in cash and cashequivalents (60,039) - (60,039)Cash and cash equivalents, beginning of period 911,778 - 911,778Cash and cash equivalents, end of period $ 851,739 $ - $ 851,739
Effect of transition to IFRS on statement of cash flows for the nine months ended ended September 30,2010:
Canadian GAAP IFRS changes IFRSNet cash flows from operating activities $ 190,726 $ (36,099) $ 154,627Net cash flows from investing activities (151,172) 36,099 (115,073)
Net cash flows from financing activities (72,859) - (72,859)
Effect of movement in exchange rates on cashand cash equivalents (1,770) - (1,770)Net increase (decrease) in cash and cashequivalents (35,075) - (35,075)Cash and cash equivalents, beginning of period 886,814 - 886,814Cash and cash equivalents, end of period $ 851,739 $ - $ 851,739
Effect of transition to IFRS on statement of cash flows for the year ended December 31, 2010:
Canadian GAAP IFRS changes IFRSNet cash flows from operating activities $ 255,590 $ (64,280) $ 191,310Net cash flows from investing activities (162,275) 64,280 (97,995)
Net cash flows from financing activities (75,610) - (75,610)
Effect of movement in exchange rates on cashand cash equivalents (2,826) - (2,826)Net increase (decrease) in cash and cashequivalents 14,879 - 14,879Cash and cash equivalents, beginning of period 886,814 - 886,814Cash and cash equivalents, end of period $ 901,693 $ - $ 901,693
Page 60
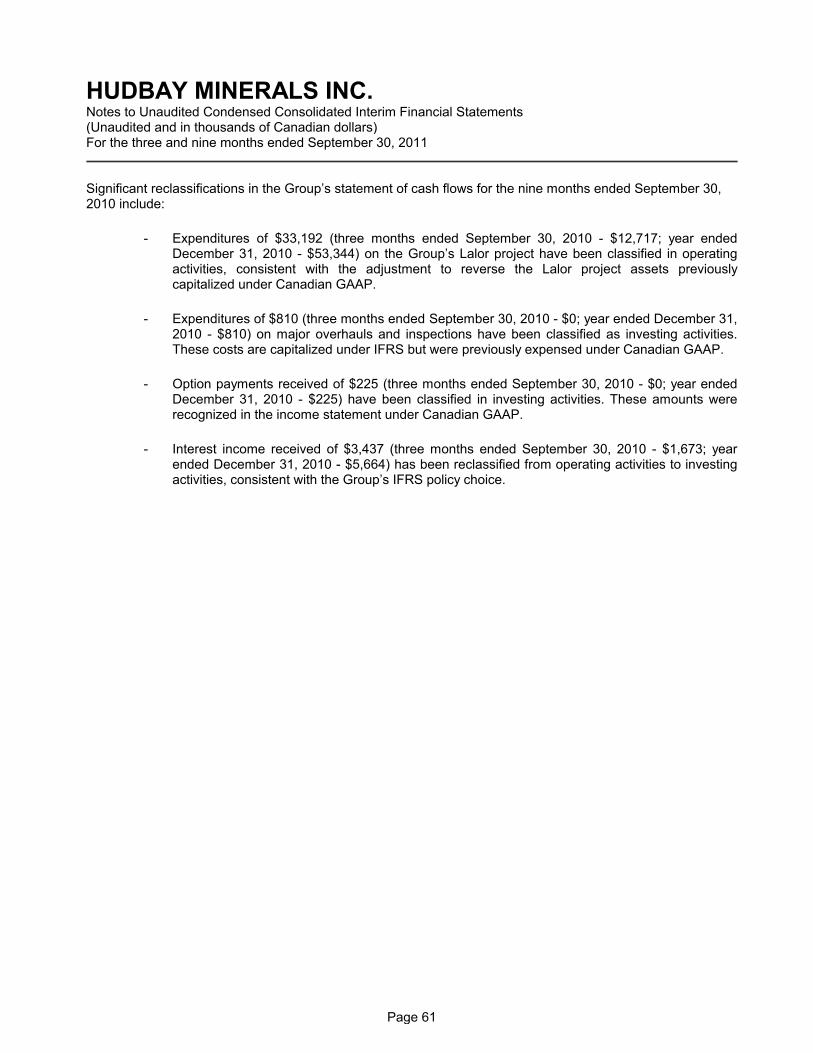
HUDBAY MINERALS INC.Notes to Unaudited Condensed Consolidated Interim Financial Statements(Unaudited and in thousands of Canadian dollars)For the three and nine months ended September 30, 2011
Significant reclassifications in the Group’s statement of cash flows for the nine months ended September 30,2010 include:
- Expenditures of $33,192 (three months ended September 30, 2010 - $12,717; year endedDecember 31, 2010 - $53,344) on the Group’s Lalor project have been classified in operatingactivities, consistent with the adjustment to reverse the Lalor project assets previouslycapitalized under Canadian GAAP.
- Expenditures of $810 (three months ended September 30, 2010 - $0; year ended December 31,2010 - $810) on major overhauls and inspections have been classified as investing activities.These costs are capitalized under IFRS but were previously expensed under Canadian GAAP.
- Option payments received of $225 (three months ended September 30, 2010 - $0; year endedDecember 31, 2010 - $225) have been classified in investing activities. These amounts wererecognized in the income statement under Canadian GAAP.
- Interest income received of $3,437 (three months ended September 30, 2010 - $1,673; yearended December 31, 2010 - $5,664) has been reclassified from operating activities to investingactivities, consistent with the Group’s IFRS policy choice.
Page 61