hub participation report - north carolinaestablished by law and provided operational funding during...
TRANSCRIPT

Page 1
OFFICE FOR HISTORICALLY UNDERUTILIZED BUSINESSES
HUB PARTICIPATION REPORT
P U R C H A S I N G ( G O O D S A N D S E R V I C E S ) A N D C O N S T R U C T I O N P R O J E C T S
Fiscal Year 2011 - 2012 (July 1, 2011 to June 30, 2012)
Governor Beverly Eaves Perdue
Moses Carey, Jr., Secretary of Administration
Bridget L. Wall-Lennon, Assistant to the Secretary for HUB Outreach
Jerry Ryan, Statistician
1336 Mail Service Center Raleigh, NC 27699-1336 www.doa.nc.gov/hub
Page 2
TABLE OF CONTENTS
INTRODUCTION ........................................................................................................................................................ 3
EXECUTIVE SUMMARY .............................................................................................................................................. 4
PURCHASING (GOODS AND SERVICES) SUMMARY ................................................................................................ 6
REPORTING FOR ALL FOUR QUARTERS ................................................................................................................ 8
CONSTRUCTION PROJECTS SUMMARY ................................................................................................................... 9
ANALYSIS ................................................................................................................................................................ 11
HIGHLIGHTS:....................................................................................................................................................... 11
PURCHASING PARTICIPATION BY HUB BUSINESS TYPE (Fiscal Year 2011-12) ................................................ 11
CONSTRUCTION PARTICIPATION BY HUB BUSINESS TYPE (Fiscal Uear 2011-12) ........................................... 12
HUB AND TOTAL PURCHASING BY QUARTER (Fiscal Year 2011-12) ............................................................... 13
HUB OFFICE ACTIVITIES .......................................................................................................................................... 14
STATUTORY REQUIREMENTS .................................................................................................................................. 15
PURCHASING (GOODS and SERVICES) ............................................................................................................. 15
CONSTRUCTION PROJECTS ............................................................................................................................... 16

Page 3
INTRODUCTION
The mission of the state of North Carolina Office for Historically Underutilized Businesses is to promote economic opportunities for certified firms in state government contracting and procurement that will foster their growth and profitability. The HUB Office provides outreach, training and networking opportunities for new and established, certified HUB firms. The HUB website (www.doa.state.nc.us/hub/) provides access to programs and core services, a HUB vendor/firm database, upcoming bids with various state agencies and public entities, HUB Annual Reports, HUBSCO Construction Reporting System information, and the latest news and calendar information for training and conference sessions. The HUB Office was created by Executive Order 150 on April 20, 1999. The HUB Office was codified, established by law and provided operational funding during the 2001 Legislative Session. The HUB Office was established to:
Increase the amount of goods and services acquired by state agencies from certified HUB firms Work towards eliminating barriers that reduce the participation of HUB firms in the marketplace,
and in state government procurement and contracting Encourage purchasing officers and capital project coordinators within state agencies,
departments, universities and community colleges to identify and utilize HUB vendors, contractors and service providers
Educate HUB firms on “How To Do Business” with the State of North Carolina Provide resources for HUB firms
Links to websites and legislation are available by clicking the words in underlined blue text (such as above) associated with each item.

Page 4
EXECUTIVE SUMMARY
HUB participation in North Carolina state Purchasing and Construction for Fiscal Year 2012 (July 1, 2011-June 30, 2012) was as follows:
Category Total Expenditures HUB Participation HUB %
Purchasing (Goods and Services) $5,181,560,178 $ 316,599,464 6.11%
Construction Projects $ 476,258,120 $ 74,118,772 15.56%
State Reporting Entities required to submit Purchasing Reports (Goods and Services) to the HUB Office include: State Agencies, Council of State Agencies, Supporting Agencies, State Universities, Community Colleges and Public School Systems. Based on previous Annual HUB Reports, HUB participation from these entities in state Purchasing (Goods and Services) has ranged from $288,686,783 to $460,315,864 million between Fiscal Year 1999-2000 and Fiscal Year 2011-12. The reported total for Fiscal Year 2011-12 was $316,599,464:
PURCHASING (Goods & Services)
FISCAL
YEAR
TOTAL
EXPENDITURES
HUB
PARTICIPATION
HUB %
2000 $4,331,476,351 $384,307,890 8.87%
2001 $5,195,006,350 $460,315,864 8.86%
2002 $5,493,749,153 $431,307,304 7.85%
2003 $5,984,410,852 $435,903,962 7.28%
2004 $4,290,863,992 $288,686,783 6.73%
2005 $4,671,886,832 $338,548,716 7.25%
2006 $4,671,063,040 $381,322,909 8.16%
2007 $4,795,305,661 $372,682,156 7.77%
2008 $5,525,951,064 $442,606,269 8.01%
2009 $4,940,654,978 $376,916,008 7.63%
2010 $4,466,041,356 $292,210,342 6.54%
2011 $5,776,666,933 $380,375,160 6.58%
2012 $5,181,560,178 $316,599,464 6.11%
TOTAL $65,324,636,740 $4,901,782,827 7.50%

Page 5
As compared to Fiscal year 2010-11, this indicates a decrease in HUB participation of $63,775,696. HUB participation in state Purchasing (Goods and Services) between Fiscal Year 1999-2000 and Fiscal Year 2011-12 has ranged from 6.11% to 8.87%. The reported total for Fiscal Year 20-1112 was 6.11%. Between Fiscal Year 2001-02 and Fiscal Year 2011-12, reported HUB participation in State Construction projects has ranged from $434,477 to $143,619,331. The reported total for Fiscal Year 2011-12 was $74,118,772:
CONSTRUCTION
FISCAL
YEAR
TOTAL
EXPENDITURES
HUB
PARTICIPATION
HUB %
2002 $2,752,519 $434,477 15.78%
2003 $211,864,707 $38,624,435 18.23%
2004 $271,799,065 $39,581,113 14.56%
2005 $750,834,641 $125,744,548 16.75%
2006 $652,390,561 $113,791,100 17.44%
2007 $781,070,180 $100,367,227 12.85%
2008 $1,031,739,875 $139,865,141 13.56%
2009 $677,474,669 $123,567,901 18.24%
2010 $776,545,058 $143,619,331 18.49%
2011 $475,944,753 $101,242,582 21.27%
2012 $476,258,120 $74,118,772 15.56%
TOTAL $6,108,674,148 $1,000,956,627 16.39%
As compared to Fiscal Year 20-1011, this indicates a decrease in HUB participation of $27,123,810. HUB participation in state Construction projects between Fiscal Year 2001-02 and Fiscal Year 2011-12 has ranged from 12.85% to 21.27%. The reported total for Fiscal Year 2011-12 was 15.56%.

Page 6
PURCHASING (GOODS AND SERVICES) SUMMARY Per N.C.G.S. § 143‑48, based on the North Carolina fiscal year (July 1 to June 30), 10 Cabinet Agencies, 9 Council of State Agencies, 13 Supporting Agencies, 19 State Universities & Affiliates, 58 Community Colleges and 115 Public School Districts are required to submit reports on a quarterly basis detailing the percentage of purchases made from minority-owned businesses. The reporting schedule of submission dates is as follows:
Period Dates Report Due
1st Quarter July 1 to September 30 October 30
2nd Quarter October 1 to December 31 January 30
3rd Quarter January 1 to March 31 April 30
4th Quarter April 1 to June 30 July 30
This schedule is also available at the HUB office website: www.doa.nc.gov/hub As a group, the purchasing reporting percentage for Fiscal Year 2011-12 equaled 6.11%.
Cabinet Agencies: For Fiscal Year 2011-12, Cabinet Agencies reported 6.05% HUB participation. Agencies reported total purchases of $865,740,043 with $52,396,956 reported HUB participation. 60% reported for all four quarters:
Cabinet Agencies Total Expenditures HUB Participation HUB %
Administration $34,759,359 $852,653 2.45%
Commerce $50,829,970 $503,036 0.99%
Correction $127,659,072 $2,223,062 1.74%
Crime Control $155,156,021 $2,068,166 1.33%
Cultural Resources $3,673,577 $358,394 9.76%
Environment and Natural Resources $13,903,123 $400,192 2.88%
Health and Human Services $42,982,277 $5,961,377 13.87%
Juvenile Justice $7,530,671 $581,908 7.73%
Revenue $8,412,814 $484,791 5.76%
Transportation $420,833,159 $38,963,377 9.26%
TOTAL $865,740,043 $52,396,956 6.05%

Page 7
Council of State Agencies: For Fiscal Year 2011-12, Council Agencies reported 4.44% HUB participation. Agencies reported total purchases of $104,353,780 with $4,637,683 reported HUB participation. 92% of these entities reported for all four quarters.
Council of State Agencies Total Purchasing HUB Purchasing HUB %
Agriculture $20,340,658 $446,857 2.20%
Insurance $813,161 $39,201 4.82%
Justice $15,632,000 $950,407 6.08%
Labor $1,259,498 $283,478 22.51%
Lt. Governor’s Office $209 $116 55.50%
Public Instruction $60,999,183 $1,627,451 2.67%
Secretary of State $617,931 $185,501 30.02%
State Auditor $587,494 $28,226 4.80%
Treasurer $4,103,646 $1,076,446 26.23%
TOTAL $104,353,780 $4,637,683 4.44%
Supporting Agencies: For Fiscal Year 2011-12, Supporting Agencies reported 3.34% HUB participation. Agencies reported total purchases of $146,751,425 with $4,905,980 reported HUB participation. 77% of these entities reported for all four quarters.
Supporting Agencies Total Purchasing HUB Purchasing HUB %
Administrative Hearings $314,434 $9,194 2.92%
Administrative Office of the Courts $0 $0 0.00%
Board of Elections $1,435,567 $8,624 0.60%
Community College System $13,620,885 $199,131 1.46%
Education Lottery $44,828,753 $325,507 0.73%
Employment Security Commission $8,770,424 $1,211,179 13.81%
General Assembly $1,512,142 $157,118 10.39%
Information Technology Services $45,154,699 $1,252,433 2.77%
N.C. Institute for Minority Economic Development
$1,044,983 $643,396 61.57%
Page 8
Ports Authority $5,715,772 $217,434 3.80%
Rural Economic Development $1,107,335 $173,859 15.70%
State Controller’s Office $14,410,703 $13,585 0.09%
Wildlife Resources Commission $8,835,728 $694,520 7.86%
TOTAL $146,751,425 $4,905,980 3.34%
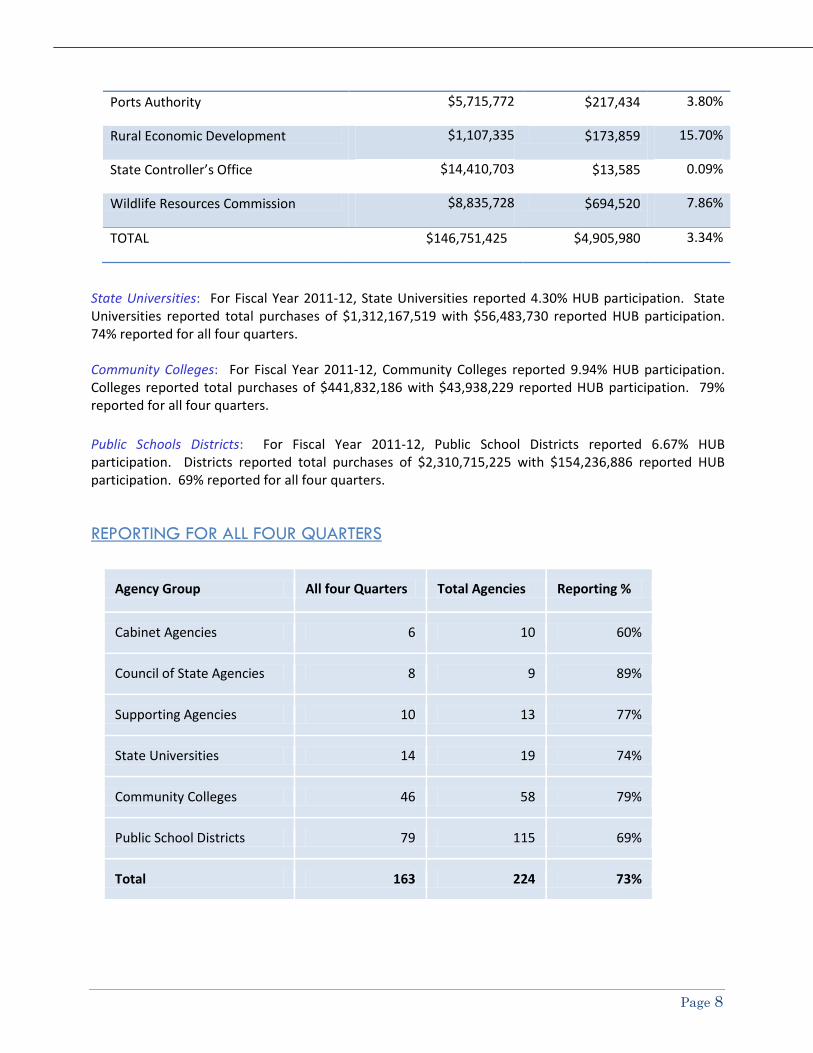
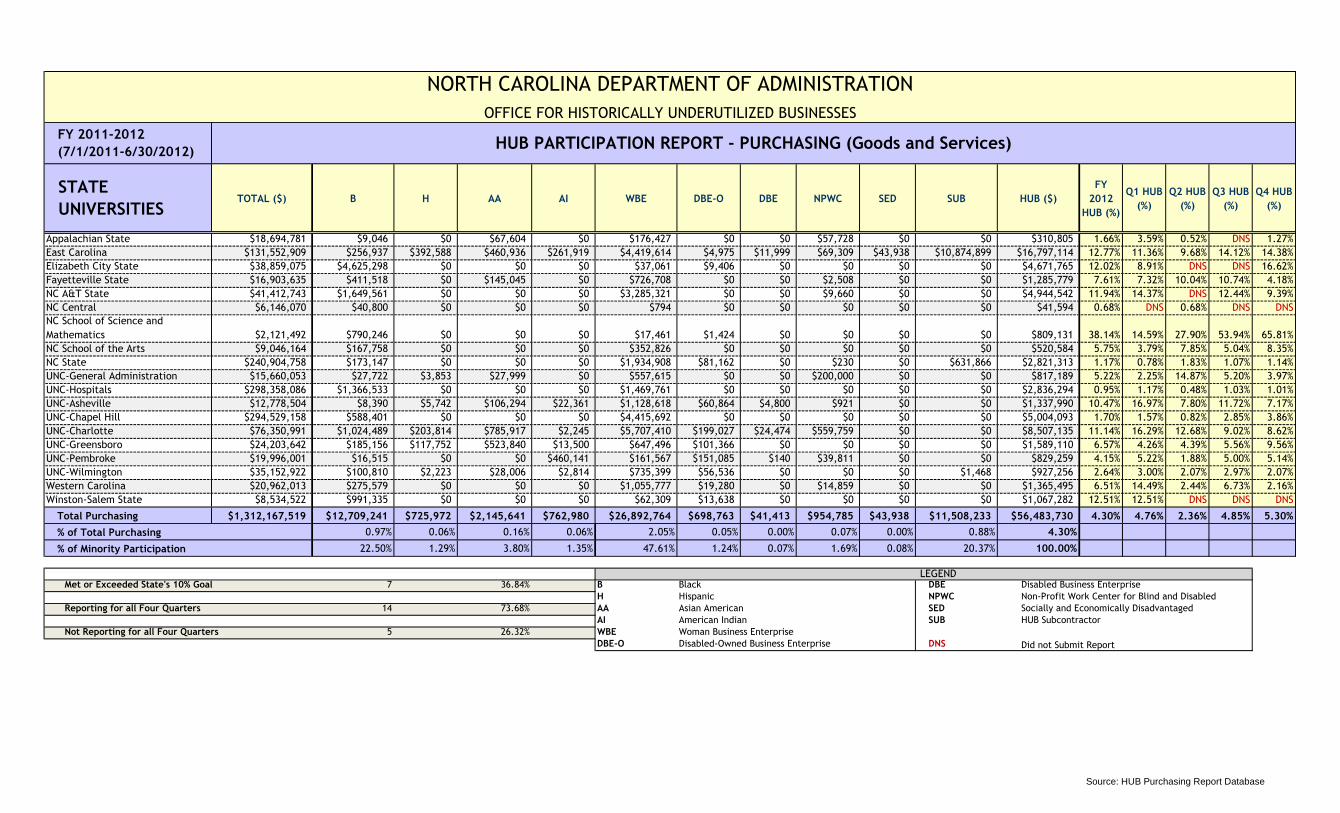
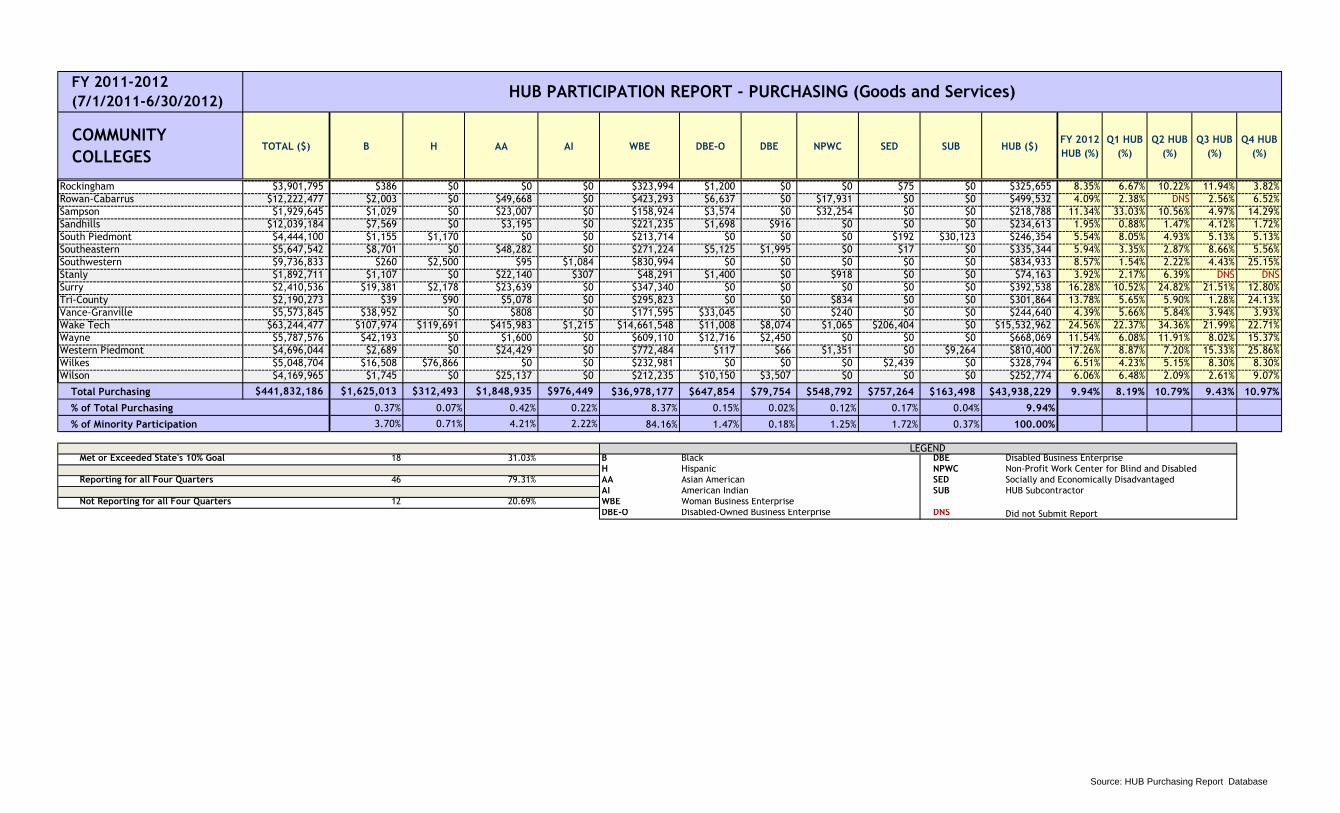
State Universities: For Fiscal Year 2011-12, State Universities reported 4.30% HUB participation. State Universities reported total purchases of $1,312,167,519 with $56,483,730 reported HUB participation. 74% reported for all four quarters. Community Colleges: For Fiscal Year 2011-12, Community Colleges reported 9.94% HUB participation. Colleges reported total purchases of $441,832,186 with $43,938,229 reported HUB participation. 79% reported for all four quarters.
Public Schools Districts: For Fiscal Year 2011-12, Public School Districts reported 6.67% HUB participation. Districts reported total purchases of $2,310,715,225 with $154,236,886 reported HUB participation. 69% reported for all four quarters.
REPORTING FOR ALL FOUR QUARTERS
Agency Group All four Quarters Total Agencies Reporting %
Cabinet Agencies 6 10 60%
Council of State Agencies 8 9 89%
Supporting Agencies 10 13 77%
State Universities 14 19 74%
Community Colleges 46 58 79%
Public School Districts 79 115 69%
Total 163 224 73%

Page 9
CONSTRUCTION PROJECTS SUMMARY
NC General Statute § 143‑128.3 requires all public entities subject to N.C.G.S.§ 143‑128.2 to report construction spending information to the Department of Administration, Office for Historically Underutilized Businesses on a regular basis.
The HUB Office and the State Construction Office developed the web-based HUBSCO Construction Reporting System (HUBSCO) to capture construction project information from state and public entities. Public Entities who receive state funds for capital projects are to register in the HUBSCO System and report their HUB/MWBE participation for construction projects, upon completion of the project.
State agencies and public entities can also track their expenditures with the system, and use it as a benchmarking tool to meet or exceed their HUB utilization goals for construction-related expenditures in each of the following categories:
Heavy Construction
Building Construction
Special Trade Construction
Professional Services
Other Services
The HUBSCO system captures data instantly. In some cases, dollar figures may change while the system is
in the process of generating reports.
The quarterly and annual HUBSCO reports were finalized on August 10, 2012. These reports showed the
following information for each category of reporting entities:
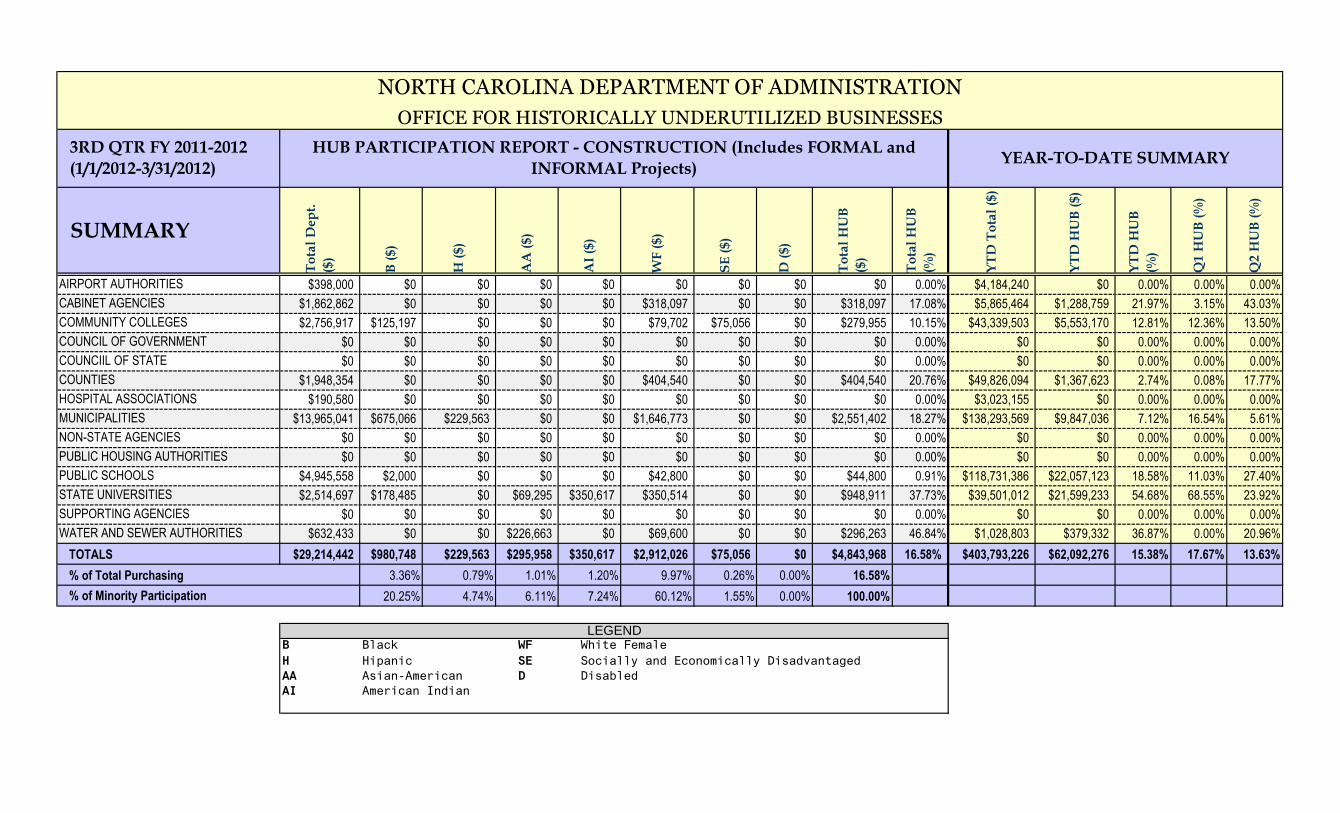
Airport Authorities: For Fiscal Year 2011-12, Airport Authorities registered in the HUBSCO System reported 0.00% HUB participation. Airports reported total construction spending of $4,184,240 with $0 reported HUB participation. Cabinet Agencies: For Fiscal Year 2011-12, Cabinet Agencies reported 22.48% HUB participation. Agencies reported total construction spending of $6,320,360 with $1,420,788 reported HUB participation. Community Colleges: For Fiscal Year 2011-12, Community Colleges reported 10.22% HUB participation. Colleges reported total construction spending of $57,347,643 with $5,860,505 reported HUB participation. Council of Government Agencies: For Fiscal Year 2011-12, Council Agencies reported 0.00% HUB participation. Agencies reported total construction spending of $0 with $0 reported HUB participation. Council of State Agencies: For Fiscal Year 2011-12, Council Agencies reported 0.00% HUB participation. Agencies reported total construction spending of $0 with $0 reported HUB participation.

Page 10
Counties: For Fiscal Year 2011-12, Counties reported 10.54% HUB participation. Counties reported total construction spending of $91,512,315 with $9,647,504 reported HUB participation.
Hospital Associations: For Fiscal Year 2011-12, Hospital Associations registered in the HUBSCO System reported 0.00% HUB participation. Associations reported total construction spending of $3,053,556 with $0 reported HUB participation. Municipalities: For fiscal year 2011-12, Municipalities reported 7.55% HUB participation. Municipalities reported total construction spending of $147,006,870 with $11,097,081 reported HUB participation. Non-State Agencies: For Fiscal Year 2011-12, Non-State Agencies reported 0.00% HUB participation. Agencies reported total construction spending of $0 with $0 reported HUB participation. Public Housing Authorities: For Fiscal Year 2011-12, Housing Authorities reported 0.00% HUB participation. Authorities reported total construction spending of $535,854 with $0 reported HUB participation. Public School Districts: For Fiscal Year 2011-12, Public School Districts reported 18.48% HUB participation. Districts reported total construction spending of $120,518,232 with $22,268,959 reported HUB participation.
State Universities: For Fiscal Year 2011-12, State Universities reported 53.79% HUB participation. Universities reported total construction spending of $43,525,112 with $23,412,430 reported HUB participation. Supporting Agencies: For Fiscal Year 2011-12, Supporting Agencies reported 0.00% HUB participation. Agencies reported total construction spending of $338,100 with $0 reported HUB participation. Water and Sewer Authorities: For Fiscal Year 2011-12, Water and Sewer Authorities reported 16.78% HUB participation. Authorities reported total construction spending of $2,451,692 with $411,505 reported HUB participation.
Page 11
ANALYSIS
HIGHLIGHTS for Purchasing & Construction:
For Fiscal Year 2011-12, HUB firms were awarded $316,599,464 or 6.11% in state Purchasing
contracts.
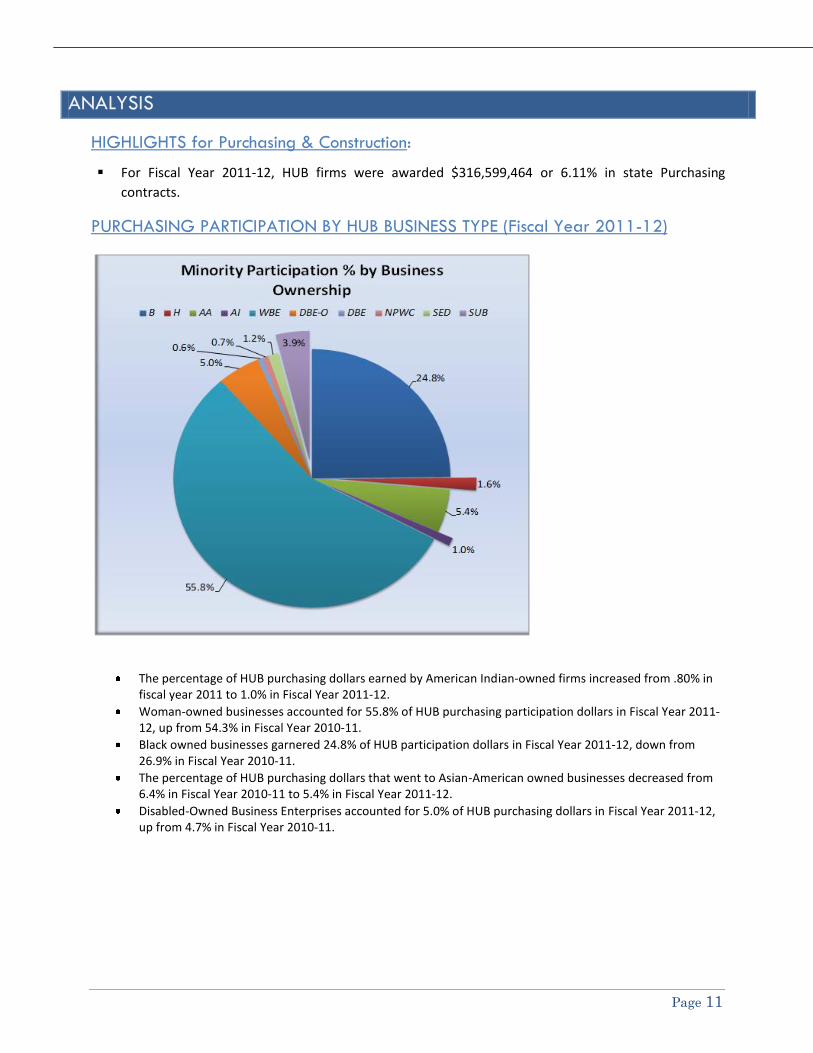
PURCHASING PARTICIPATION BY HUB BUSINESS TYPE (Fiscal Year 2011-12)
The percentage of HUB purchasing dollars earned by American Indian-owned firms increased from .80% in
fiscal year 2011 to 1.0% in Fiscal Year 2011-12.
Woman-owned businesses accounted for 55.8% of HUB purchasing participation dollars in Fiscal Year 2011-12, up from 54.3% in Fiscal Year 2010-11.
Black owned businesses garnered 24.8% of HUB participation dollars in Fiscal Year 2011-12, down from 26.9% in Fiscal Year 2010-11.
The percentage of HUB purchasing dollars that went to Asian-American owned businesses decreased from 6.4% in Fiscal Year 2010-11 to 5.4% in Fiscal Year 2011-12.
Disabled-Owned Business Enterprises accounted for 5.0% of HUB purchasing dollars in Fiscal Year 2011-12, up from 4.7% in Fiscal Year 2010-11.

Page 12
CONSTRUCTION PARTICIPATION BY HUB BUSINESS TYPE (Fiscal Year 2011-12)
White female-owned businesses accounted for 72.9% of HUB construction dollars in Fiscal Year 2011-12, up from 49.2% in Fiscal Year 2010-11.
Black-owned businesses earned 16.1% of HUB construction participation dollars in Fiscal Year 2011-12, down from 33.5% in Fiscal Year 2010-11.
The percentage of HUB construction dollars that went to Asian-American owned businesses increased from 0.5% in Fiscal Year 2010-11 to 3.3% in Fiscal Year 2011-12.
Hispanic-Owned Business Enterprises accounted for 4.4% of HUB construction dollars in Fiscal Year 2011-12, down from 10.1% in Fiscal Year 2010-11.
The following chart summarizes HUB construction participation from Fiscal Year 2001-02 to Fiscal Year 2011-12. The
information presented was generated from the HUBSCO System:
FISCAL YEAR Total PURCHASES ($) B H AA AI WF SE D HUB Purchases ($) HUB (%)
2002 $2,752,519 $52,803 $400 $0 $1,500 $339,974 $39,800 n/a $434,477 15.78%
2003 $211,864,707 $7,031,962 $6,390,754 $148,538 $1,510,254 $23,330,284 $212,644 n/a $38,624,436 18.23%
2004 $271,799,065 $7,988,463 $6,352,119 $273,994 $2,941,715 $20,758,908 $1,265,914 n/a $39,581,113 14.56%
2005 $750,834,641 $34,713,413 $11,038,191 $3,409,612 $12,234,280 $63,910,657 $438,395 $0 $125,744,548 16.75%
2006 $652,390,561 $23,284,129 $14,183,853 $2,089,076 $2,281,823 $70,285,379 $1,666,840 n/a $113,791,100 17.44%
2007 $781,070,180 $17,885,045 $10,845,109 $2,563,730 $4,120,236 $63,237,307 $1,715,800 n/a $100,367,227 12.85%
2008 $1,031,739,875 $26,095,890 $10,219,177 $3,738,799 $6,737,280 $91,077,560 $1,994,822 $1,612 $139,865,140 13.56%
2009 $677,474,669 $35,064,387 $9,948,345 $6,275,443 $829,756 $69,412,488 $1,919,343 $118,140 $123,567,902 18.24%
2010 $776,545,058 $25,562,257 $7,550,852 $6,407,896 $1,069,353 $96,481,756 $6,477,544 $69,673 $143,619,331 18.49%
2011 $475,944,753 $33,933,958 $10,194,331 $496,310 $2,316,675 $49,831,456 $2,305,090 $2,164,762 $101,242,582 21.27%
2012 $476,258,120 $11,904,420 $3,275,236 $2,449,233 $1,225,805 $54,056,834 $911,875 $295,370 $74,118,773 15.56%
TOTAL $6,108,674,148 $223,516,727 $89,998,367 $27,852,631 $35,268,677 $602,722,603 $18,948,067 $2,649,557 $1,000,956,629 16.39%
3.66% 1.47% 0.46% 0.58% 9.87% 0.31% 0.04% 16.39%
22.33% 8.99% 2.78% 3.52% 60.21% 1.89% 0.26% 100.00%
% TOTAL $
% HUB $

Page 13
TOTAL and HUB PURCHASING BY QUARTER (Fiscal Year 2011-12)
Total % of Total HUB HUB % of HUB
CABINET Purchasing ($) Purchasing Purchasing (%) Purchasing ($) Purchasing
Q1 $1,379,045,582 26.61% 6.19% $85,410,495 26.98%
Q2 1,089,600,321 21.03% 5.75% 62,665,006 19.79%
Q3 994,706,988 19.20% 7.94% 78,981,333 24.95%
Q4 1,718,207,287 33.16% 5.21% 89,542,630 28.28%
Total $5,181,560,178 100.00% 6.11% $316,599,464 100.00%
0%
5%
10%
15%
20%
25%
30%
35%
Q1Q2
Q3Q4
SEASONALITY:Total vs HUB Purchasing
HUB Purchasing
Total Purchasing

Page 14
HUB OFFICE ACTIVITIES July 1, 2011 – June 30, 2012
• Responded to 8,953 telephone and email inquiries from HUB vendors/contractors, state agencies,
other entities and the general public in Fiscal Year 2011-12. The HUB staff provides assistance and
information on topics such as:
1) North Carolina’s HUB Program
2) HUB’s Certification/Verification
3) E-Procurement
4) Purchasing and Construction Opportunities (Senate Bill 914/HUB)
5) Minority Business Construction Reporting Requirements (§ 143-128.2, § 143-128.3, and § 143.131)
6) NC General Statute N.C.G.S.§143-48 HUB/MWBE – Minority Business Purchasing Reporting
Requirements.
• Participated in 47 conferences, workshops, seminars, training session or presentations for the
purpose of promoting
1) The HUB Office
2) Vendor Link
3) E-Procurement
4) Higher Education Bond Program
5) Senate Bill 914/Minority Business Construction Reporting Requirements
6) HUB/MWBE–Minority Business Purchasing Reporting Requirements.
• Certified 951 businesses as HUB firms and/or contractors.
• Conducted 6 on-site and off-site HUBSCO training sessions in Fiscal Year 2011-12, involving 11 participants.

Page 15
STATUTORY REQUIREMENTS Effective April 20, 1999, and as a result of Executive Order No. 150, the Office for Historically
Underutilized Businesses (HUB Office) was established in the Office of the Secretary of the North
Carolina Department of Administration. HUB participation goals and reporting requirements for state
agencies and public entities are contained in North Carolina Statute (N.C.G.S.) § 143-48 for goods and
services and N.C.G.S. § 143-128.2, § 143-128.3 and § 143-131 for construction. Further discussion of
these statutes is mentioned below.
The report for Fiscal Year 2011-12 includes Purchasing (Goods and Services) and Construction projects data submitted to the HUB Office by state agencies and other public entities.
PURCHASING (GOODS and SERVICES)
The Office for Historically Underutilized Businesses (HUB Office) serves as an advocate for HUB vendors, which includes businesses owned by minorities, women, persons with a disability, disabled businesses, and non-profit work centers for the blind and severely disabled. The HUB Office promotes the State’s on-line vendor registration and HUB certification process, provides technical assistance, and conducts training on how to conduct business with state government. The HUB Office captures data reflecting the State’s HUB utilization and expenditures of the state agencies, community colleges, public schools and universities, while also serving as a resource to these agencies.
Executive Order No. 150 states that North Carolina’s Historically Underutilized Business participation
goal is at least ten percent (10%), by dollar amount, of the State’s purchases of goods and services, will
be derived from HUB vendors. Executive Order No. 150 further requires the submission of quarterly
HUB purchasing reports to the HUB Office. The goal for Fiscal Year 2012 (July 1, 2011 through June
30, 2012) remained at 10 percent. The following legislation also addresses the State’s minority business goals and reporting requirements
for goods and services:
G.S. 143-48 (b) states “in part”…. “Every governmental entity required by statute to use the services of
the Department of Administration in the purchase of goods and services, every local school
administrative unit, and every private, non-profit corporation other than an institution of higher
education or a hospital that receives an appropriation of five hundred thousand dollars ($500,000) or
more during a fiscal year from the General Assembly shall report.”
Cabinet Agencies, Council Agencies, Supporting Agencies, Community Colleges, Public School Districts
and State Universities submit a quarterly HUB purchasing report to the Office for Historically
Underutilized Businesses. The figures reported include multi-year contracts. Because those figures are only reported in the year
that the contract is actually awarded, HUB participation numbers may be reduced in subsequent fiscal
years. Total purchases and HUB participation are subject to change or differ from the submitted quarterly
purchasing report data due to the “run date” of each report.

Page 16
Agencies reporting through NCAS (North Carolina Accounting System) provide a snapshot of its purchases
quarterly. The HUB Office compiles the reported purchase transactions and generates a cumulative
report.
Total Purchasing and HUB Participation Quarterly Report data include purchase orders, and service
contracts awarded each quarter.
Reports from state reporting entities are due no later than thirty (30) days after the end of each quarter and reflect each entity’s HUB purchases within the following categories:
• Term Contracts • Commodity Purchases (Non-term contract) • Service Contracts
CONSTRUCTION PROJECTS
Construction project data is an important component of the overall HUB participation reporting requirements. On December 6, 2001, the General Assembly enacted Senate Bill 914, which made historic changes to laws governing public construction in the State of North Carolina. Senate Bill 914 was signed by Governor Michael F. Easley on December 19, 2001, and became effective January 1, 2002. Senate Bill 914 affords flexibility in the public construction bidding process, provides for significant new requirements for promoting the use of minority contractors, as well as documenting and reporting good faith effort to that end. All public entities, including but not limited to, state agencies, universities, community colleges, public schools, county governments, municipalities and other local governments, are required to report both formal bids (=>$500,000) and informal bids (<$500,000) construction project data. Note: Effective August 23, 2007, for projects funded on or after July1, 2007, the formal project threshold increased from $300,000 to $500,000. The following legislation addresses the State’s minority business goals and reporting requirements for construction: N.C.G.S. § 143-128.2 states “in part”… “The State shall have a verifiable ten percent (10%) goal for participation by minority businesses in the total value of work for each State building project, including building projects done by a private entity on a facility to be leased or purchased by the State." N.C.G.S. § 143-128.3 states “in part “… “All public entities subject to N . C . G.S. § 143-128.2 shall report to the Department of Administration, Office of Historically Underutilized Businesses, the following with respect to each building project:
(1) The verifiable percentage goal. (2) The type and total dollar value of the project, minority business utilization by minority business
category, trade, total dollar value of: a. Contracts awarded to each minority group for each project b. The applicable good faith effort guidelines or c. Rules used to recruit minority business participation, and good faith documentation
accepted by the public entity from the successful bidder. (3) The utilization of minority businesses under the various construction methods under N.C.G.S.
§ 143-128 (a1).
Page 17
N.C.G.S. § 143-131 states “in part”…“ (b) All public entities shall solicit minority participation in contracts for the erection, construction, alteration or repair of any building awarded pursuant to this section. The public entity shall maintain a record of contractors solicited and shall document efforts to recruit minority business participation in those contracts. Construction data is captured electronically through the HUBSCO Construction Reporting System via a web-based Internet site. All public entities are required to report completed construction project data and submit it to the HUB Office. The HUBSCO system has the capability that allows each entity to generate and view its own report (http://www.hubsco.com/). The report includes both total construction project value and HUB participation for construction projects. The design- related and miscellaneous values are captured by the HUBSCO system, but not reported as a part of HUB participation (not required by N.C.G.S. § 143-128). The HUB Office offers HUBSCO training to public entities on how to access and utilize the HUBSCO Construction Reporting System. The training schedule, training request form, and system access form are available via the HUB Office website (http://www.doa.nc.gov/hub/index.htm).

TOTAL ($) B H AA AI WBE DBE-O DBE NPWC SED SUB HUB ($)FY 2012
HUB (%)
Q1 HUB
(%)
Q2 HUB
(%)
Q3 HUB
(%)
Q4 HUB
(%)
$865,740,043 $3,643,354 $125,340 $5,967,029 $173,914 $41,923,548 $112,639 $405,119 $0 $46,013 $0 $52,396,956 6.05% 5.88% 6.41% 10.13% 4.59%
$104,353,780 $270,253 $31,664 $1,443,492 $7,947 $2,840,213 $0 $481 $43,633 $0 $0 $4,637,683 4.44% 4.72% 4.45% 5.60% 3.32%
$146,751,425 $1,291,772 $1,635 $741,868 $7,075 $2,852,422 $9,333 $1,875 $0 $0 $0 $4,905,980 3.34% 1.61% 8.24% 5.02% 3.65%
$1,312,167,519 $12,709,241 $725,972 $2,145,641 $762,980 $26,892,764 $698,763 $41,413 $954,785 $43,938 $11,508,233 $56,483,730 4.30% 4.76% 2.36% 4.85% 5.30%
$441,832,186 $1,625,013 $312,493 $1,848,935 $976,449 $36,978,177 $647,854 $79,754 $548,792 $757,264 $163,498 $43,938,229 9.94% 8.19% 10.79% 9.43% 10.97%
$2,310,715,225 $59,001,249 $3,822,398 $4,850,061 $1,323,280 $65,174,639 $14,285,963 $1,354,276 $648,776 $2,975,325 $800,919 $154,236,886 6.67% 7.45% 7.10% 9.12% 4.45%
$5,181,560,178 $78,540,882 $5,019,502 $16,997,026 $3,251,645 $176,661,763 $15,754,552 $1,882,918 $2,195,986 $3,822,540 $12,472,650 $316,599,464 6.11% 6.19% 5.75% 7.94% 5.21%
1.52% 0.10% 0.33% 0.06% 3.41% 0.30% 0.04% 0.04% 0.07% 0.24% 6.11%
24.81% 1.59% 5.37% 1.03% 55.80% 4.98% 0.59% 0.69% 1.21% 3.94% 100.00%
Met or Exceeded State's 10% Goal 73 32.59% B Black DBE Disabled Business Enterprise
H Hispanic NPWC Non-Profit Work Center for Blind and Disabled
Reporting for all Four Quarters 163 72.88% AA Asian American SED Socially and Economically Disadvantaged
AI American Indian SUB HUB Subcontractor
Not Reporting for all Four Quarters 61 27.12% WBE Woman Business Enterprise
DBE-O Disabled-Owned Business Enterprise DNS Did not Submit Report
LEGEND
NORTH CAROLINA DEPARTMENT OF ADMINISTRATION
OFFICE FOR HISTORICALLY UNDERUTILIZED BUSINESSES
% of Minority Participation
SUMMARY
FY 2011-2012
(7/1/2011-6/30/2012)
Total Purchasing
% of Total Purchasing
HUB PARTICIPATION REPORT - PURCHASING (Goods and Services)
CABINET AGENCIES
COUNCIL AGENCIES
SUPPORTING AGENCIES
STATE UNIVERSITIES
COMMUNITY COLLEGES
PUBLIC SCHOOLS
1/10 Source: HUB Purchasing Report Database

TOTAL ($) B H AA AI WBE DBE-O DBE NPWC SED SUB HUB ($)FY 2012
HUB (%)
Q1 HUB
(%)
Q2 HUB
(%)
Q3 HUB
(%)
Q4 HUB
(%)
$34,759,359 $419,003 $21,467 $279,958 $0 $132,225 $0 $0 $0 $0 $0 $852,653 2.45% 8.41% 0.65% 10.62% 0.96%
$50,829,970 $186,360 $0 $164,320 $0 $152,356 $0 $0 $0 $0 $0 $503,036 0.99% 0.08% 7.78% 7.47% 15.20%
$127,659,072 $79,992 $22,270 $664,870 $8,847 $1,272,688 $36,103 $103,030 $0 $35,262 $0 $2,223,062 1.74% 2.91% 1.11% DNS 1.15%
$155,156,021 $342,913 $45,505 $13,813 $7,953 $1,592,008 $8,735 $46,488 $0 $10,751 $0 $2,068,166 1.33% 2.82% 5.02% 2.59% 0.98%
$3,673,577 $110,132 $0 $0 $0 $181,131 $67,031 $100 $0 $0 $0 $358,394 9.76% 6.45% 30.65% 14.76% 5.13%
$13,903,123 $1,820 $0 $0 $0 $398,372 $0 $0 $0 $0 $0 $400,192 2.88% 2.88% DNS DNS DNS
$42,982,277 $87,221 $2,332 $1,939,265 $73,112 $3,847,905 $770 $10,772 $0 $0 $0 $5,961,377 13.87% 15.80% DNS 13.45% 13.33%
$7,530,671 $182,864 $0 $171,200 $0 $222,673 $0 $5,171 $0 $0 $0 $581,908 7.73% 0.58% 15.40% DNS 34.69%
$8,412,814 $74,814 $0 $10,000 ($9,999) $409,976 $0 $0 $0 $0 $0 $484,791 5.76% 7.74% 2.35% 2.32% 8.94%
$420,833,159 $2,158,235 $33,766 $2,723,603 $94,001 $33,714,214 $0 $239,558 $0 $0 $0 $38,963,377 9.26% 9.20% 8.19% 10.95% 8.98%
$865,740,043 $3,643,354 $125,340 $5,967,029 $173,914 $41,923,548 $112,639 $405,119 $0 $46,013 $0 $52,396,956 6.05% 5.88% 6.41% 10.13% 4.59%
0.42% 0.01% 0.69% 0.02% 4.84% 0.01% 0.05% 0.00% 0.01% 0.00% 6.05%
6.95% 0.24% 11.39% 0.33% 80.01% 0.21% 0.77% 0.00% 0.09% 0.00% 100.00%
Met or Exceeded State's 10% Goal 1 10.00% B Black DBE Disabled Business Enterprise
H Hispanic NPWC Non-Profit Work Center for Blind and Disabled
Reporting for all Four Quarters 6 60.00% AA Asian American SED Socially and Economically Disadvantaged
AI American Indian SUB HUB Subcontractor
Not Reporting for all Four Quarters 4 40.00% WBE Woman Business Enterprise
DBE-O Disabled-Owned Business Enterprise DNS Did not Submit Report
Juvenile Justice & Delinquency Prevention
Revenue
Transportation
LEGEND
FY 2011-2012
(7/1/2011-6/30/2012)
CABINET AGENCIES
NORTH CAROLINA DEPARTMENT OF ADMINISTRATION
OFFICE FOR HISTORICALLY UNDERUTILIZED BUSINESSES
Total Purchasing
% of Total Purchasing
% of Minority Participation
HUB PARTICIPATION REPORT - PURCHASING (Goods and Services)
Administration
Commerce
Correction
Crime Control & Public Safety
Cultural Resources
Environment and Natural Resources
Health and Human Services
Source: HUB Purchasing Report Database

TOTAL ($) B H AA AI WBE DBE-O DBE NPWC SED SUB HUB ($)
FY
2012
HUB (%)
Q1 HUB
(%)
Q2 HUB
(%)
Q3 HUB
(%)
Q4 HUB
(%)
$20,340,658 $31,457 $0 $0 $0 $415,400 $0 $0 $0 $0 $0 $446,857 2.20% 2.21% 1.63% 1.39% 3.31%
$587,494 $7,282 $0 $0 $0 $20,944 $0 $0 $0 $0 $0 $28,226 4.80% 18.95% 0.46% 25.45% 2.00%
$813,161 $2,750 $0 $0 $0 $36,451 $0 $0 $0 $0 $0 $39,201 4.82% 4.82% DNS DNS DNS
$15,632,000 $37,255 $0 $280,636 $7,947 $620,280 $0 $356 $3,933 $0 $0 $950,407 6.08% 7.19% 10.51% 4.17% 4.78%
$1,259,498 $14,390 $0 $0 $0 $269,088 $0 $0 $0 $0 $0 $283,478 22.51% 25.72% 29.96% 8.86% 26.36%
$209 $0 $0 $0 $0 $116 $0 $0 $0 $0 $0 $116 55.50% 0.00% 0.00% 100.00% 0.00%
$60,999,183 $174,801 $31,664 $1,019,661 $0 $361,625 $0 $0 $39,700 $0 $0 $1,627,451 2.67% 2.97% 2.76% 4.85% 0.62%
$617,931 $0 $0 $0 $0 $185,501 $0 $0 $0 $0 $0 $185,501 30.02% 21.11% 38.57% 41.79% 24.80%
$4,103,646 $2,318 $0 $143,195 $0 $930,808 $0 $125 $0 $0 $0 $1,076,446 26.23% 17.85% 37.18% 30.42% 21.11%
$104,353,780 $270,253 $31,664 $1,443,492 $7,947 $2,840,213 $0 $481 $43,633 $0 $0 $4,637,683 4.44% 4.72% 4.45% 5.60% 3.32%
0.26% 0.03% 1.38% 0.01% 2.72% 0.00% 0.00% 0.04% 0.00% 0.00% 4.44%
5.83% 0.68% 31.13% 0.17% 61.24% 0.00% 0.01% 0.94% 0.00% 0.00% 100.00%
Met or Exceeded State's 10% Goal 4 44.44% B Black DBE Disabled Business Enterprise
H Hispanic NPWC Non-Profit Work Center for Blind and Disabled
Reporting for all Four Quarters 8 91.67% AA Asian American SED Socially and Economically Disadvantaged
AI American Indian SUB HUB Subcontractor
Not Reporting for all Four Quarters 1 8.33% WBE Woman Business Enterprise
DBE-O Disabled-Owned Business Enterprise DNS Did not Submit Report
Secretary of State
Treasurer
LEGEND
FY 2011-2012
(7/1/2011-6/30/2012)
COUNCIL AGENCIES
NORTH CAROLINA DEPARTMENT OF ADMINISTRATION
OFFICE FOR HISTORICALLY UNDERUTILIZED BUSINESSES
Total Purchasing
% of Total Purchasing
% of Minority Participation
HUB PARTICIPATION REPORT - PURCHASING (Goods and Services)
Agriculture & Consumer Services
Auditor
Insurance
Justice
Labor
Lt. Governor's Office
Public Instruction
Source: HUB Purchasing Report Database

TOTAL ($) B H AA AI WBE DBE-O DBE NPWC SED SUB HUB ($)
FY
2012
HUB (%)
Q1 HUB
(%)
Q2 HUB
(%)
Q3 HUB
(%)
Q4 HUB
(%)
$314,434 $0 $0 $0 $0 $9,194 $0 $0 $0 $0 $0 $9,194 2.92% 0.63% DNS DNS n/a
$0 $0 $0 $0 $0 $0 $0 $0 $0 $0 $0 $0 DNS DNS DNS DNS DNS
$1,435,567 $0 $0 $3,680 $0 $4,944 $0 $0 $0 $0 $0 $8,624 0.60% 0.07% 0.00% 210.97% 0.12%
$13,620,885 $1,555 $0 $56,442 $5,475 $135,659 $0 $0 $0 $0 $0 $199,131 1.46% 0.73% 3.74% 21.09% 6.56%
$44,828,753 $73,096 $0 $0 $1,600 $250,811 $0 $0 $0 $0 $0 $325,507 0.73% 0.36% 0.99% 2.29% 23.39%
$8,770,424 $0 $0 $551,795 $0 $659,384 $0 $0 $0 $0 $0 $1,211,179 13.81% 9.59% 23.76% 30.90% 2.48%
$1,512,142 $340 $0 $0 $0 $156,778 $0 $0 $0 $0 $0 $157,118 10.39% 29.71% 100.00% 1.81% 8.46%
$45,154,699 $372,681 $0 $129,879 $0 $748,937 $936 $0 $0 $0 $0 $1,252,433 2.77% 1.62% 6.00% 5.23% 1.42%
$1,044,983 $643,396 $0 $0 $0 $0 $0 $0 $0 $0 $0 $643,396 61.57% 51.96% 71.77% 59.71% 63.45%
$5,715,772 $25,199 $1,635 $72 $0 $182,131 $8,397 $0 $0 $0 $0 $217,434 3.80% 1.88% DNS 3.67% 5.33%
$1,107,335 $5,192 $0 $0 $0 $168,667 $0 $0 $0 $0 $0 $173,859 15.70% 18.37% 12.98% 8.50% 32.44%
$14,410,703 $14 $0 $0 $0 $13,571 $0 $0 $0 $0 $0 $13,585 0.09% 0.24% 0.03% 0.01% 0.46%
$8,835,728 $170,299 $0 $0 $0 $522,346 $0 $1,875 $0 $0 $0 $694,520 7.86% 3.53% 15.18% 7.92% 8.48%
$146,751,425 $1,291,772 ###### $741,868 ###### $2,852,422 $9,333 $1,875 $0 $0 $0 $4,905,980 3.34% 1.61% 8.24% 5.02% 3.65%
0.88% 0.00% 0.51% 0.00% 1.94% 0.01% 0.00% 0.00% 0.00% 0.00% 3.34%
% of Minority Participation 26.33% 0.03% 15.12% 0.14% 58.14% 0.19% 0.04% 0.00% 0.00% 0.00% 100.00%
Met or Exceeded State's 10% Goal 4 30.77% B Black DBE Disabled Business Enterprise
H Hispanic NPWC Non-Profit Work Center for Blind and Disabled
Reporting for all Four Quarters 10 76.92% AA Asian American SED Socially and Economically Disadvantaged
AI American Indian SUB HUB Subcontractor
Not Reporting for all Four Quarters 3 23.08% WBE Woman Business Enterprise
DBE-O Disabled-Owned Business Enterprise DNS Did not Submit Report
LEGEND
FY 2011-2012
(7/1/2011-6/30/2012)
SUPPORTING
AGENCIES
NORTH CAROLINA DEPARTMENT OF ADMINISTRATION
OFFICE FOR HISTORICALLY UNDERUTILIZED BUSINESSES
Total Purchasing
% of Total Purchasing
HUB PARTICIPATION REPORT - PURCHASING (Goods and Services)
Administrative Hearings
Administrative Office of the
Courts
Board of Elections
Community Colleges
Education Lottery
Employment Security
General Assembly
Wildlife Resources Commission
Information Technology Services
Minority Economic Development
Ports Authority
Rural Economic Development
State Controller
Source: HUB Purchasing Report Database
TOTAL ($) B H AA AI WBE DBE-O DBE NPWC SED SUB HUB ($)
FY
2012
HUB (%)
Q1 HUB
(%)
Q2 HUB
(%)
Q3 HUB
(%)
Q4 HUB
(%)
$18,694,781 $9,046 $0 $67,604 $0 $176,427 $0 $0 $57,728 $0 $0 $310,805 1.66% 3.59% 0.52% DNS 1.27%
$131,552,909 $256,937 $392,588 $460,936 $261,919 $4,419,614 $4,975 $11,999 $69,309 $43,938 $10,874,899 $16,797,114 12.77% 11.36% 9.68% 14.12% 14.38%
$38,859,075 $4,625,298 $0 $0 $0 $37,061 $9,406 $0 $0 $0 $0 $4,671,765 12.02% 8.91% DNS DNS 16.62%
$16,903,635 $411,518 $0 $145,045 $0 $726,708 $0 $0 $2,508 $0 $0 $1,285,779 7.61% 7.32% 10.04% 10.74% 4.18%
$41,412,743 $1,649,561 $0 $0 $0 $3,285,321 $0 $0 $9,660 $0 $0 $4,944,542 11.94% 14.37% DNS 12.44% 9.39%
$6,146,070 $40,800 $0 $0 $0 $794 $0 $0 $0 $0 $0 $41,594 0.68% DNS 0.68% DNS DNS
$2,121,492 $790,246 $0 $0 $0 $17,461 $1,424 $0 $0 $0 $0 $809,131 38.14% 14.59% 27.90% 53.94% 65.81%
$9,046,164 $167,758 $0 $0 $0 $352,826 $0 $0 $0 $0 $0 $520,584 5.75% 3.79% 7.85% 5.04% 8.35%
$240,904,758 $173,147 $0 $0 $0 $1,934,908 $81,162 $0 $230 $0 $631,866 $2,821,313 1.17% 0.78% 1.83% 1.07% 1.14%
$15,660,053 $27,722 $3,853 $27,999 $0 $557,615 $0 $0 $200,000 $0 $0 $817,189 5.22% 2.25% 14.87% 5.20% 3.97%
$298,358,086 $1,366,533 $0 $0 $0 $1,469,761 $0 $0 $0 $0 $0 $2,836,294 0.95% 1.17% 0.48% 1.03% 1.01%
$12,778,504 $8,390 $5,742 $106,294 $22,361 $1,128,618 $60,864 $4,800 $921 $0 $0 $1,337,990 10.47% 16.97% 7.80% 11.72% 7.17%
$294,529,158 $588,401 $0 $0 $0 $4,415,692 $0 $0 $0 $0 $0 $5,004,093 1.70% 1.57% 0.82% 2.85% 3.86%
$76,350,991 $1,024,489 $203,814 $785,917 $2,245 $5,707,410 $199,027 $24,474 $559,759 $0 $0 $8,507,135 11.14% 16.29% 12.68% 9.02% 8.62%
$24,203,642 $185,156 $117,752 $523,840 $13,500 $647,496 $101,366 $0 $0 $0 $0 $1,589,110 6.57% 4.26% 4.39% 5.56% 9.56%
$19,996,001 $16,515 $0 $0 $460,141 $161,567 $151,085 $140 $39,811 $0 $0 $829,259 4.15% 5.22% 1.88% 5.00% 5.14%
$35,152,922 $100,810 $2,223 $28,006 $2,814 $735,399 $56,536 $0 $0 $0 $1,468 $927,256 2.64% 3.00% 2.07% 2.97% 2.07%
$20,962,013 $275,579 $0 $0 $0 $1,055,777 $19,280 $0 $14,859 $0 $0 $1,365,495 6.51% 14.49% 2.44% 6.73% 2.16%
$8,534,522 $991,335 $0 $0 $0 $62,309 $13,638 $0 $0 $0 $0 $1,067,282 12.51% 12.51% DNS DNS DNS
$1,312,167,519 $12,709,241 $725,972 $2,145,641 $762,980 $26,892,764 $698,763 $41,413 $954,785 $43,938 $11,508,233 $56,483,730 4.30% 4.76% 2.36% 4.85% 5.30%
0.97% 0.06% 0.16% 0.06% 2.05% 0.05% 0.00% 0.07% 0.00% 0.88% 4.30%
% of Minority Participation 22.50% 1.29% 3.80% 1.35% 47.61% 1.24% 0.07% 1.69% 0.08% 20.37% 100.00%
Met or Exceeded State's 10% Goal 7 36.84% B Black DBE Disabled Business Enterprise
H Hispanic NPWC Non-Profit Work Center for Blind and Disabled
Reporting for all Four Quarters 14 73.68% AA Asian American SED Socially and Economically Disadvantaged
AI American Indian SUB HUB Subcontractor
Not Reporting for all Four Quarters 5 26.32% WBE Woman Business Enterprise
DBE-O Disabled-Owned Business Enterprise DNS Did not Submit Report
LEGEND
FY 2011-2012
(7/1/2011-6/30/2012)
STATE
UNIVERSITIES
NORTH CAROLINA DEPARTMENT OF ADMINISTRATION
OFFICE FOR HISTORICALLY UNDERUTILIZED BUSINESSES
Total Purchasing
% of Total Purchasing
HUB PARTICIPATION REPORT - PURCHASING (Goods and Services)
Appalachian State
East Carolina
Elizabeth City State
Fayetteville State
NC A&T State
NC Central
NC School of Science and
Mathematics
NC School of the Arts
NC State
UNC-General Administration
UNC-Hospitals
UNC-Asheville
Western Carolina
Winston-Salem State
UNC-Chapel Hill
UNC-Charlotte
UNC-Greensboro
UNC-Pembroke
UNC-Wilmington
Source: HUB Purchasing Report Database

TOTAL ($) B H AA AI WBE DBE-O DBE NPWC SED SUB HUB ($)FY 2012
HUB (%)
Q1 HUB
(%)
Q2 HUB
(%)
Q3 HUB
(%)
Q4 HUB
(%)
$6,574,727 $23,900 $4,679 $4,671 $709 $198,037 $1,043 $0 $25,920 $0 $601 $259,560 3.95% 2.61% 2.82% 3.50% 6.06%
$12,905,806 $1,800 $0 $47,678 $245 $982,170 $1,197 $184 $40,252 $0 $0 $1,073,526 8.32% 9.56% 6.73% 8.18% 9.02%
$2,038,644 $1,572 $0 $14,359 $14,149 $325,400 $481 $53 $0 $957 $0 $356,971 17.51% 11.12% 11.32% DNS 21.80%
$2,136,246 $48,223 $0 $0 $7,578 $247,313 $6,980 $160 $0 $1,129 $0 $311,383 14.58% 8.15% 14.86% 12.21% 19.31%
$4,036,645 $1,556 $0 $2,151 $0 $97,034 $4,936 $0 $43,862 $0 $0 $149,539 3.70% 2.31% 5.17% 4.09% 3.48%
$3,829,573 $1,643 $0 $26,205 $0 $383,432 $338 $0 $855 $0 $0 $412,473 10.77% 10.90% 11.05% 9.58% 11.08%
$5,271,967 $39 $138 $38,496 $0 $189,572 $2,014 $0 $1,425 $637 $0 $232,321 4.41% 4.16% 6.37% DNS 3.15%
$39,713,970 $474 $0 $59,164 $216,966 $779,341 $2,424 $1,535 $711 $34,500 $1,002 $1,096,117 2.76% 2.07% 3.60% 2.02% 3.89%
$2,363,146 $653 $0 $22,791 $634 $181,792 $6,104 $4,525 $0 $0 $0 $216,499 9.16% 9.37% 9.14% 10.64% 8.60%
$8,077,826 $20,766 $1,668 $198 $0 $394,247 $5,343 $0 $1,434 $1,334 $0 $424,990 5.26% 4.05% 5.53% 6.20% 5.24%
$6,801,721 $10,610 $0 $9,731 $40,176 $340,639 $5,607 $0 $49,016 $0 $0 $455,779 6.70% 7.94% DNS 7.35% 5.60%
$8,952,874 $180,694 $63,722 $128,010 $0 $323,828 $2,222 $0 $0 $51,221 $0 $749,697 8.37% DNS DNS DNS 8.37%
$6,642,484 $9,133 $240 $17,770 $0 $685,403 $12,237 $2,570 $1,678 $11,210 $0 $740,241 11.14% 12.41% 6.27% 9.13% 13.50%
$6,368,763 $216,049 $0 $353 $0 $193,464 $7,546 $1,033 $3,387 $0 $0 $421,832 6.62% 4.29% DNS 6.90% 8.56%
$3,762,329 $21,724 $0 $0 $0 $67,652 $0 $0 $917 $0 $0 $90,293 2.40% 0.99% 2.82% 0.84% 3.51%
$6,111,679 $3,032 $0 $33,123 $0 $498,583 $3,632 $0 $1,128 $649 $0 $540,147 8.84% 5.71% 4.54% 11.92% 10.95%
$6,668,912 $5,487 $0 $52,971 $74,366 $273,598 $2,597 $23,916 $1,012 $0 $84,032 $517,979 7.77% 14.38% 4.29% 2.97% 100.00%
$0 $0 $0 $0 $0 $0 $0 $0 $0 $0 $0 $0 DNS DNS DNS DNS DNS
$4,126,358 $20,459 $0 $27,162 $0 $220,707 $1,522 $0 $14,059 $0 $17,623 $301,532 7.31% 4.67% 9.76% 9.62% 6.50%
$14,398,344 $29,256 $0 $68,430 $0 $2,171,822 $3,573 $7,336 $64,737 $47,600 $0 $2,392,754 16.62% 10.25% 13.80% 26.61% 13.67%
$17,934,016 $84,613 $0 $129,057 $28 $653,008 $407,971 $0 $0 $126,098 $0 $1,400,775 7.81% 4.29% 6.07% 13.25% 9.00%
$14,368,444 $23,766 $270 $450 $0 $777,612 $0 $4,360 $100 $103,682 $0 $910,240 6.33% 7.78% 10.90% 4.36% 3.92%
$15,926,849 $198,079 $15,158 $167,547 $1,100 $1,636,549 $53,740 $0 $0 $0 $0 $2,072,173 13.01% 7.96% 14.00% 10.11% 17.55%
$2,368,462 $3,749 $0 $0 $53 $54,418 $0 $0 $0 $0 $0 $58,220 2.46% 2.68% 4.89% 1.14% 1.53%
$4,245,776 $54,955 $19,833 $19,908 $0 $474,974 $0 $0 $2,614 $1,521 $0 $573,805 13.51% 10.06% 10.75% 13.41% 16.11%
$0 $0 $0 $0 $0 $0 $0 $0 $0 $0 $0 $0 DNS DNS DNS DNS DNS
$2,637,196 $15,265 $0 $9,477 $0 $138,702 $4,234 $1,572 $1,279 $0 $0 $170,529 6.47% 4.29% 10.89% 6.37% 5.83%
$9,166,188 $59,001 $0 $66,723 $0 $207,413 $0 $0 $0 $0 $0 $333,137 3.63% 4.08% 2.36% 2.69% 4.45%
$5,159,186 $124 $0 $47,010 $0 $299,346 $3,874 $161 $213,083 $0 $0 $563,598 10.92% 6.57% 13.01% 14.63% 9.93%
$1,417,317 $255 $0 $0 $7,523 $99,892 $0 $0 $0 $0 $0 $107,670 7.60% 6.41% 6.54% 6.51% 9.71%
$1,756,313 $5,883 $0 $13,772 $0 $97,738 $0 $1,964 $3,066 $0 $0 $122,423 6.97% 5.50% DNS 10.66% 5.89%
$2,526,647 $3,409 $2,138 $1,882 $0 $93,727 $0 $0 $1,154 $0 $0 $102,310 4.05% 6.10% 4.26% 4.45% 2.64%
$4,140,036 $2,397 $0 $6,326 $0 $340,497 $1,013 $9,214 $960 $0 $0 $360,407 8.71% 8.77% 7.13% DNS 9.41%
$1,453,895 $2,398 $0 $0 $0 $18,388 $0 $0 $256 $0 $3,380 $24,422 1.68% 2.64% 0.98% 2.09% 1.76%
$6,162,335 $72,464 $310 $30,421 $86 $173,428 $0 $0 $0 $0 $0 $276,709 4.49% 8.00% 5.27% 4.53% 2.30%
$727,473 $366 $250 $11,374 $0 $54,370 $685 $277 $6,145 $0 $9,958 $83,425 11.47% 24.13% 8.85% 16.04% 5.92%
$2,336,025 $3,528 $91 $190 $0 $178,563 $949 $342 $0 $0 $0 $183,663 7.86% DNS 5.85% DNS 8.73%
$32,509,525 $307 $1,501 $33,680 $484 $1,431,495 $0 $0 $8,166 $378 $7,515 $1,483,526 4.56% 2.51% 3.95% 4.50% 7.93%
$8,923,417 $43,830 $0 $51,202 $0 $338,579 $0 $0 $1,775 $0 $0 $435,386 4.88% 6.22% 4.60% 4.79% 4.66%
$2,627,608 $3,455 $0 $46,669 $0 $326,685 $3,796 $0 $0 $0 $0 $380,605 14.48% 9.24% 4.15% 8.75% 26.36%
$1,507,109 $0 $0 $0 $0 $277,339 $1,172 $0 $1,500 $0 $0 $280,011 18.58% 1.05% 21.80% 30.80% 13.23%
$8,220,648 $198,408 $0 $16,923 $609,746 $956,635 $13,954 $3,544 $3,708 $167,221 $0 $1,970,139 23.97% 26.73% 33.43% 30.00% 17.64%
FY 2011-2012
(7/1/2011-6/30/2012)
COMMUNITY
COLLEGES
NORTH CAROLINA DEPARTMENT OF ADMINISTRATION
OFFICE FOR HISTORICALLY UNDERUTILIZED BUSINESSES
HUB PARTICIPATION REPORT - PURCHASING (Goods and Services)
Alamance
Asheville-Buncombe Tech
Beaufort
Bladen
Blue Ridge
Brunswick
Caldwell
Cape Fear
Carteret
Catawba Valley
Central Carolina
Central Piedmont
Cleveland
Coastal Carolina
College of The Albemarle
Craven
Davidson
Durham Tech
Edgecombe
Fayetteville
Forsyth Tech
Gaston
Guilford Tech
Halifax
Haywood
Isothermal
James Sprunt
Johnston
Lenoir
Martin
Mayland
McDowell Tech
Mitchell
Montgomery
Nash
Pamlico
Piedmont
Pitt
Randolph
Richmond
Roanoke-Chowan
Robeson
Source: HUB Purchasing Report Database
TOTAL ($) B H AA AI WBE DBE-O DBE NPWC SED SUB HUB ($)FY 2012
HUB (%)
Q1 HUB
(%)
Q2 HUB
(%)
Q3 HUB
(%)
Q4 HUB
(%)
FY 2011-2012
(7/1/2011-6/30/2012)
COMMUNITY
COLLEGES
HUB PARTICIPATION REPORT - PURCHASING (Goods and Services)
Alamance $3,901,795 $386 $0 $0 $0 $323,994 $1,200 $0 $0 $75 $0 $325,655 8.35% 6.67% 10.22% 11.94% 3.82%
$12,222,477 $2,003 $0 $49,668 $0 $423,293 $6,637 $0 $17,931 $0 $0 $499,532 4.09% 2.38% DNS 2.56% 6.52%
$1,929,645 $1,029 $0 $23,007 $0 $158,924 $3,574 $0 $32,254 $0 $0 $218,788 11.34% 33.03% 10.56% 4.97% 14.29%
$12,039,184 $7,569 $0 $3,195 $0 $221,235 $1,698 $916 $0 $0 $0 $234,613 1.95% 0.88% 1.47% 4.12% 1.72%
$4,444,100 $1,155 $1,170 $0 $0 $213,714 $0 $0 $0 $192 $30,123 $246,354 5.54% 8.05% 4.93% 5.13% 5.13%
$5,647,542 $8,701 $0 $48,282 $0 $271,224 $5,125 $1,995 $0 $17 $0 $335,344 5.94% 3.35% 2.87% 8.66% 5.56%
$9,736,833 $260 $2,500 $95 $1,084 $830,994 $0 $0 $0 $0 $0 $834,933 8.57% 1.54% 2.22% 4.43% 25.15%
$1,892,711 $1,107 $0 $22,140 $307 $48,291 $1,400 $0 $918 $0 $0 $74,163 3.92% 2.17% 6.39% DNS DNS
$2,410,536 $19,381 $2,178 $23,639 $0 $347,340 $0 $0 $0 $0 $0 $392,538 16.28% 10.52% 24.82% 21.51% 12.80%
$2,190,273 $39 $90 $5,078 $0 $295,823 $0 $0 $834 $0 $0 $301,864 13.78% 5.65% 5.90% 1.28% 24.13%
$5,573,845 $38,952 $0 $808 $0 $171,595 $33,045 $0 $240 $0 $0 $244,640 4.39% 5.66% 5.84% 3.94% 3.93%
$63,244,477 $107,974 $119,691 $415,983 $1,215 $14,661,548 $11,008 $8,074 $1,065 $206,404 $0 $15,532,962 24.56% 22.37% 34.36% 21.99% 22.71%
$5,787,576 $42,193 $0 $1,600 $0 $609,110 $12,716 $2,450 $0 $0 $0 $668,069 11.54% 6.08% 11.91% 8.02% 15.37%
$4,696,044 $2,689 $0 $24,429 $0 $772,484 $117 $66 $1,351 $0 $9,264 $810,400 17.26% 8.87% 7.20% 15.33% 25.86%
$5,048,704 $16,508 $76,866 $0 $0 $232,981 $0 $0 $0 $2,439 $0 $328,794 6.51% 4.23% 5.15% 8.30% 8.30%
$4,169,965 $1,745 $0 $25,137 $0 $212,235 $10,150 $3,507 $0 $0 $0 $252,774 6.06% 6.48% 2.09% 2.61% 9.07%
$441,832,186 $1,625,013 $312,493 $1,848,935 $976,449 $36,978,177 $647,854 $79,754 $548,792 $757,264 $163,498 $43,938,229 9.94% 8.19% 10.79% 9.43% 10.97%
0.37% 0.07% 0.42% 0.22% 8.37% 0.15% 0.02% 0.12% 0.17% 0.04% 9.94%
% of Minority Participation 3.70% 0.71% 4.21% 2.22% 84.16% 1.47% 0.18% 1.25% 1.72% 0.37% 100.00%
Met or Exceeded State's 10% Goal 18 31.03% B Black DBE Disabled Business EnterpriseH Hispanic NPWC Non-Profit Work Center for Blind and Disabled
Reporting for all Four Quarters 46 79.31% AA Asian American SED Socially and Economically DisadvantagedAI American Indian SUB HUB Subcontractor
Not Reporting for all Four Quarters 12 20.69% WBE Woman Business EnterpriseDBE-O Disabled-Owned Business Enterprise DNS Did not Submit Report
LEGEND
Total Purchasing
% of Total Purchasing
Rockingham
Rowan-Cabarrus
Sampson
Sandhills
South Piedmont
Southeastern
Southwestern
Stanly
Surry
Tri-County
Wilson
Vance-Granville
Wake Tech
Wayne
Western Piedmont
Wilkes
Source: HUB Purchasing Report Database

TOTAL ($) B H AA AI WBE DBE-O DBE NPWC SED SUB HUB ($)
FY
2012
HUB (%)
Q1 HUB
(%)
Q2 HUB
(%)
Q3 HUB
(%)
Q4 HUB
(%)
$60,287,866 $915,784 $0 $0 $0 $236,218 $0 $0 $0 $0 $0 $1,152,002 1.91% 0.26% 2.25% 2.17% 2.72%
$740,419 $127 $0 $2,805 $0 $42,342 $0 $0 $195 $0 $0 $45,469 6.14% DNS DNS DNS 6.14%
$1,376,283 $0 $0 $0 $0 $30,405 $0 $0 $0 $0 $0 $30,405 2.21% DNS 1.47% DNS 2.95%
$6,317,093 $6,491 $0 $0 $0 $208,790 $407 $0 $0 $0 $0 $215,688 3.41% 4.20% 2.54% 4.16% 2.75%
$15,221,067 $67,533 $0 $0 $0 $226,142 $198,626 $0 $0 $0 $0 $492,301 3.23% 2.81% 4.67% 3.33% 2.52%
$12,834,222 $83,330 $0 $0 $0 $28,348 $95,227 $102,192 $0 $0 $0 $309,097 2.41% 0.51% 0.22% 3.97% 5.37%
$3,611,660 $980,094 $0 $0 $0 $256,535 $0 $500 $0 $0 $0 $1,237,129 34.25% DNS DNS 35.43% 33.34%
$1,660,120 $1,765 $0 $0 $0 $4,130 $0 $0 $0 $0 $0 $5,895 0.36% 0.07% 0.40% 0.65% 0.03%
$7,506,151 $1,878,111 $0 $0 $0 $326,808 $120,351 $3,800 $0 $0 $0 $2,329,070 31.03% 33.05% 27.38% 30.81% 30.74%
$0 $0 $0 $0 $0 $0 $0 $0 $0 $0 $0 $0 DNS DNS DNS DNS DNS
$4,447,904 $306,826 $0 $12,734 $0 $104,297 $16,178 $0 $0 $0 $0 $440,035 9.89% 24.09% 6.33% 8.30% 10.03%
$8,217,130 $76,466 $0 $0 $0 $845,479 $0 $0 $0 $0 $0 $921,945 11.22% DNS 2.61% 18.38% 7.82%
$29,508,365 $0 $0 $0 $0 $1,343,045 $0 $20,574 $0 $2,707,958 $0 $4,071,577 13.80% 15.51% 12.23% 14.11% 9.22%
$10,901,668 $566 $0 $1,538 $1,479 $672,270 $0 $0 $0 $0 $0 $675,853 6.20% 1.02% 12.45% 8.85% 4.38%
$9,105,958 $23,744 $0 $0 $0 $313,990 $240 $0 $20,397 $0 $0 $358,371 3.94% 4.03% 3.96% 3.96% 3.86%
$62,748,623 $100 $442 $0 $0 $55,345 $358 $1,535 $0 $0 $0 $57,780 0.09% 0.23% 0.02% 0.03% DNS
$788,489 $428,426 $0 $0 $0 $54,826 $8,652 $0 $0 $0 $0 $491,904 62.39% 40.04% 16.88% 71.78% 99.87%
$15,297,834 $46,467 $0 $0 $0 $647,447 $0 $7,168 $0 $0 $0 $701,082 4.58% 2.18% 3.82% 6.00% 6.46%
$197,011 $20,110 $2,250 $1,490 $1,160 $143,677 $0 $0 $0 $0 $0 $168,687 85.62% 62.60% DNS 84.57% 91.09%
$5,406,109 $0 $0 $0 $0 $255,623 $0 $0 $0 $0 $0 $255,623 4.73% 8.90% 2.85% 3.40% 4.58%
$5,842,933 $0 $0 $0 $0 $0 $0 $0 $0 $0 $0 $0 0.00% 0.00% 0.00% 0.00% 0.00%
$183,419,301 $2,257,020 $751,012 $2,922,166 $4,619 $6,039,847 $15,396 $63,201 $0 $0 $0 $12,053,261 6.57% 4.88% 7.17% 6.56% 7.73%
$12,794,877 $194,988 $0 $0 $1,400 $1,059,182 $0 $0 $0 $0 $0 $1,255,570 9.81% 6.33% 7.58% 11.39% 13.42%
$2,614,219 $6,829 $0 $0 $0 $65,348 $0 $0 $0 $0 $58,168 $130,345 4.99% 6.50% 2.23% 6.68% DNS
$203,250 $7,115 $1,772 $0 $988 $15,432 $0 $0 $0 $0 $0 $25,307 12.45% DNS DNS 11.56% 12.86%
$11,069,225 $80,676 $2,177 $302 $20,493 $392,717 $226 $415,157 $25,888 $0 $0 $937,636 8.47% 7.46% 4.29% 12.06% DNS
$4,510,113 $3,101 $0 $0 $0 $26,031 $0 $0 $0 $0 $0 $29,132 0.65% DNS 0.23% 0.97% DNS
$2,099,454 $199,999 $0 $0 $0 $38,862 $366,507 $7,180 $0 $0 $0 $612,548 29.18% DNS 31.78% DNS 25.18%
$22,139,316 $2,416,566 $0 $3,826 $0 $79,438 $0 $0 $0 $0 $0 $2,499,830 11.29% 9.77% 6.94% 15.12% DNS
$38,648,205 $184,137 $1,746 $18,034 $14,400 $10,807,947 $67,855 $113,378 $5,089 $0 $0 $11,212,586 29.01% 19.91% 27.71% 40.17% 34.81%
$12,562,000 $2,233 $0 $0 $0 $150,763 $3,672 $661 $0 $0 $0 $157,329 1.25% 0.39% 2.12% 2.44% 1.60%
$3,698,835 $118,663 $113,255 $0 $0 $375,324 $0 $0 $0 $0 $0 $607,242 16.42% 21.93% 14.43% 13.38% 11.26%
$53,188,782 $345,302 $0 $0 $0 $615,176 $26,781 $0 $7,366 $0 $0 $994,625 1.87% 1.60% 1.44% 1.96% 2.39%
$4,334,372 $9,883 $0 $0 $0 $1,109,120 $0 $0 $185 $0 $0 $1,119,188 25.82% 12.31% 29.99% 28.14% 27.27%
$16,162,417 $0 $28,000 $0 $0 $78,653 $0 $0 $0 $0 $0 $106,653 0.66% 0.88% 1.10% 0.79% 0.22%
$124,643,882 $14,950,432 $0 $0 $0 $1,863,651 $100,671 $0 $27,250 $0 $0 $16,942,004 13.59% 11.21% 11.74% 15.75% 15.00%
$2,128,317 $120,640 $1,305 $51 $0 $6,182 $0 $0 $0 $0 $0 $128,178 6.02% 6.84% 4.89% 6.37% DNS
$12,479,974 $10,627 $0 $0 $2 $251,415 $0 $22,946 $0 $0 $0 $284,990 2.28% 0.51% 2.19% 2.19% 3.22%
Avery County
Beaufort County
Bertie County
Bladen County
Brunswick County
FY 2011-2012
(7/1/2011-6/30/2012)
PUBLIC SCHOOLS
NORTH CAROLINA DEPARTMENT OF ADMINISTRATION
OFFICE FOR HISTORICALLY UNDERUTILIZED BUSINESSES
HUB PARTICIPATION REPORT - PURCHASING (Goods and Services)
Alamance/Burlington
Alexander County
Alleghany County
Anson County
Ashe County
Asheboro City
Asheville City
Carteret County
Caswell County
Catawba County
Chapel Hill/Carrboro City
Charlotte-Mecklenburg
Buncombe County
Burke County
Cabarrus County
Caldwell County
Camden County
Columbus County
Craven County
Cumberland County
Currituck County
Dare County
Chatham County
Cherokee County
Clay County
Cleveland County
Clinton City
Edgecombe County
Davidson County
Davie County
Duplin County
Durham City
Edenton/Chowan
Source: HUB Purchasing Report Database

TOTAL ($) B H AA AI WBE DBE-O DBE NPWC SED SUB HUB ($)
FY
2012
HUB (%)
Q1 HUB
(%)
Q2 HUB
(%)
Q3 HUB
(%)
Q4 HUB
(%)PUBLIC SCHOOLS
Alamance/Burlington $0 $0 $0 $0 $0 $0 $0 $0 $0 $0 $0 $0 DNS DNS DNS DNS DNS
$269,549 $401 $0 $0 $0 $4,960 $0 $0 $0 $0 $0 $5,361 1.99% 2.27% 1.26% 2.88% 1.72%
$25,258,132 $0 $0 $0 $0 $766,253 $12,409 $0 $0 $0 $0 $778,662 3.08% 5.51% 1.21% 1.14% 0.31%
$74,540,336 $2,205,168 $0 $143,734 $10,769 $4,771,000 $6,406 $79,841 $0 $0 $0 $7,216,918 9.68% 7.46% 7.75% 14.89% 16.74%
$2,052,002 $38,848 $0 $0 $0 $14,022 $0 $0 $0 $0 $0 $52,870 2.58% 1.25% 4.18% 4.30% 1.09%
$1,740,010 $70,287 $0 $0 $0 $366,536 $0 $0 $0 $0 $0 $436,823 25.10% 20.61% 28.34% 21.29% 29.50%
$14,116,806 $1,981 $0 $0 $0 $264,992 $0 $0 $0 $0 $0 $266,973 1.89% 1.23% 0.66% 0.31% 9.08%
$28,807,706 $690,418 $0 $0 $0 $463,117 $0 $0 $0 $0 $0 $1,153,535 4.00% 3.72% 4.60% DNS 3.59%
$18,354,452 $148,475 $0 $0 $0 $1,150,949 $0 $0 $0 $0 $0 $1,299,424 7.08% DNS DNS 7.08% DNS
$2,467,247 $938,996 $0 $0 $0 $13,705 $0 $0 $0 $0 $0 $952,701 38.61% 43.19% 74.82% 22.40% 18.65%
$3,954,935 $316,997 $0 $3,692 $0 $147,843 $0 $1,561 $0 $0 $0 $470,093 11.89% DNS 11.89% DNS DNS
$1,089,250 $207,467 $0 $0 $0 $30,688 $0 $0 $0 $0 $0 $238,155 21.86% 21.86% DNS DNS DNS
$3,619,205 $0 $0 $0 $0 $531,363 $250,474 $404,596 $0 $0 $0 $1,186,433 32.78% 43.74% 20.46% 33.51% DNS
$17,512,636 $3,209,809 $0 $0 $0 $64,813 $15,892 $0 $0 $0 $0 $3,290,514 18.79% 13.36% 26.50% 25.83% 7.03%
$872,358 $174,464 $0 $0 $0 $4,184 $0 $0 $0 $0 $0 $178,648 20.48% 20.48% DNS DNS DNS
$1,906,439 $1,000 $0 $0 $0 $38,934 $1,100 $0 $0 $0 $9,925 $50,959 2.67% DNS 1.84% 3.27% DNS
$6,531,677 $195,583 $79,489 $0 $0 $170,325 $0 $0 $0 $486 $0 $445,883 6.83% 5.09% 8.66% 7.24% 6.08%
$15,017,349 $618,348 $0 $0 $0 $2,721,754 $48,935 $4,658 $102,445 $0 $0 $3,496,140 23.28% 16.63% 36.67% 17.52% 30.52%
$8,781,683 $13,210 $0 $0 $178,376 $205,925 $0 $0 $0 $0 $0 $397,511 4.53% 0.91% 1.82% 10.70% 3.10%
$43,372,471 $4,066,530 $1,322,589 $1,387,330 $0 $928,406 $81,858 $0 $0 $0 $0 $7,786,713 17.95% 16.74% 22.17% 15.18% 18.12%
$3,621,119 $1,780 $0 $3,222 $0 $65,883 $0 $0 $0 $0 $0 $70,885 1.96% 0.13% 0.59% 0.02% 6.15%
$9,666,418 $8,549 $0 $538 $0 $333,736 $0 $1,497 $318 $0 $0 $344,638 3.57% 2.11% 11.82% 3.42% 1.54%
$4,858,731 $1,157,680 $174,510 $2,950 $0 $1,633,198 $0 $0 $0 $0 $0 $2,968,338 61.09% 64.47% 63.65% 65.86% 51.63%
$10,680,957 $1,565,278 $0 $0 $0 $778,024 $1,003 $0 $0 $0 $0 $2,344,305 21.95% 37.24% 24.18% 13.90% 5.01%
$3,192,189 $1,000 $0 $25,240 $0 $146,499 $3,572 $0 $0 $0 $726,234 $902,545 28.27% 26.60% 18.10% 39.70% 24.08%
$6,717,191 $2,814,351 $0 $0 $0 $283,571 $0 $0 $0 $0 $3,592 $3,101,514 46.17% 42.93% 48.11% 55.88% 25.81%
$3,080,739 $138,319 $0 $0 $1,320 $27,185 $1,000 $0 $0 $0 $0 $167,824 5.45% 1.79% 6.26% 4.33% 9.61%
$2,824,906 $3,077 $0 $0 $0 $57,459 $0 $0 $0 $0 $0 $60,536 2.14% 2.40% 1.82% DNS DNS
$981,675 $122,359 $0 $0 $0 $153,520 $523 $0 $0 $0 $0 $276,402 28.16% 28.16% DNS DNS DNS
$6,788,165 $0 $0 $0 $0 $153,144 $0 $0 $0 $0 $0 $153,144 2.26% DNS 3.16% 2.93% 1.50%
$927,282 $0 $0 $0 $0 $0 $0 $0 $0 $0 $0 $0 0.00% 0.00% 0.00% 0.00% 0.00%
$4,018,639 $0 $0 $0 $0 $18,933 $0 $0 $0 $0 $0 $18,933 0.47% 0.02% 0.55% 1.48% 0.12%
$10,527,274 $33,956 $54,813 $0 $28,230 $645,935 $0 $0 $25 $0 $0 $762,959 7.25% 0.98% 6.34% 9.07% 13.16%
$2,576,246 $1,539 $0 $0 $0 $22,410 $0 $0 $0 $0 $0 $23,949 0.93% 2.38% 4.25% 0.30% 0.42%
$3,410,221 $0 $0 $0 $0 $150,102 $362 $0 $0 $0 $0 $150,464 4.41% 12.47% 0.37% 5.15% 0.83%
$0 $0 $0 $0 $0 $0 $0 $0 $0 $0 $0 $0 DNS DNS DNS DNS DNS
$0 $0 $0 $0 $0 $0 $0 $0 $0 $0 $0 $0 DNS DNS DNS DNS DNS
$5,632,521 $128 $1,722 $0 $0 $48,098 $0 $0 $0 $0 $0 $49,948 0.89% 1.24% 1.24% 0.95% 0.60%
$5,194,445 $0 $0 $0 $0 $76,989 $93,271 $0 $0 $0 $0 $170,260 3.28% 2.63% 4.41% 0.12% 9.90%
$32,060,992 $955,366 $0 $0 $0 $929,126 $57,735 $461 $830 $0 $0 $1,943,518 6.06% 6.79% 6.39% 4.92% 6.37%
$16,016,563 $302,679 $0 $0 $0 $561,597 $6,993 $7,235 $0 $0 $0 $878,504 5.48% 7.69% 4.82% 3.83% 6.26%
$383,850 $15,054 $0 $0 $0 $10,443 $0 $0 $0 $0 $0 $25,497 6.64% 5.78% 6.82% DNS 7.44%
$33,710,157 $0 $0 $0 $0 $0 $0 $0 $0 $0 $0 $0 0.00% 0.00% 0.00% 0.00% 0.00%
$552,770 $447,775 $0 $0 $0 $12,050 $0 $225 $0 $0 $0 $460,050 83.23% 69.34% 94.30% 83.50% DNS
Elizabeth City
Elkin City
Franklin County
Gaston County
Halifax County
Harnett County
Haywood County
Henderson County
Hertford County
Gates County
Graham County
Granville County
Greene County
Guilford County
Johnston County
Jones County
Kannapolis City
Lee County
Lenoir County
Hickory City
Hoke County
Hyde County
Iredell-Statesville
Jackson County
McDowell County
Mitchell County
Montgomery County
Moore County
Mooresville City
Lexington City
Lincoln County
Macon County
Madison County
Martin County
Onslow County
Orange County
Pamlico County
Pender County
Perquimans County
Mount Airy City
Nash-Rocky Mount
New Hanover County
Newton-Conover City
Northampton County
Source: HUB Purchasing Report Database

TOTAL ($) B H AA AI WBE DBE-O DBE NPWC SED SUB HUB ($)
FY
2012
HUB (%)
Q1 HUB
(%)
Q2 HUB
(%)
Q3 HUB
(%)
Q4 HUB
(%)PUBLIC SCHOOLS
Alamance/Burlington $3,825,793 $0 $0 $0 $0 $197,497 $1,310 $0 $0 $0 $0 $198,807 5.20% 1.02% 1.16% 17.52% 4.69%
$17,121,512 $105,614 $0 $46,127 $0 $1,810,468 $2,740,238 $20,513 $455,188 $0 $0 $5,178,148 30.24% 47.68% 17.90% 13.84% DNS
$4,921,164 $0 $0 $150 $0 $56,791 $0 $0 $0 $0 $0 $56,941 1.16% 0.03% 0.05% 2.08% 1.70%
$93,224,515 $122,726 $24,142 $0 $0 $38,544 $2,328 $0 $0 $0 $0 $187,740 0.20% 0.23% 0.16% 0.18% 0.24%
$9,650,723 $169,942 $1,875 $110 $12,641 $1,216,678 $6,444 $0 $0 $0 $0 $1,407,690 14.59% 16.07% 16.55% 14.62% 12.51%
$3,171,522 $632,998 $0 $0 $0 $156,010 $4,162 $168 $0 $0 $0 $793,338 25.01% 73.07% 30.03% 1.00% 8.10%
$97,409,262 $329,276 $0 $0 $0 $5,647 $101,561 $0 $0 $0 $0 $436,484 0.45% 0.52% 0.38% 0.39% 0.52%
$6,269,845 $275,271 $0 $0 $0 $615,409 $0 $0 $0 $0 $0 $890,680 14.21% 12.32% 17.50% 9.84% 18.00%
$24,033,471 $291,592 $0 $219,973 $0 $163,116 $0 $0 $0 $0 $0 $674,681 2.81% 11.25% 3.14% 3.64% 0.00%
$11,409,426 $0 $0 $0 $0 $6,269 $0 $0 $0 $0 $0 $6,269 0.05% 0.18% 0.29% 0.00% 0.00%
$12,472,449 $0 $0 $0 $0 $687,297 $3,769,296 $0 $0 $0 $3,000 $4,459,593 35.76% 36.52% 38.13% 34.80% DNS
$4,353,227 $928,308 $42,992 $1,588 $6,275 $55,389 $7,280 $0 $0 $0 $0 $1,041,832 23.93% 23.05% 24.93% DNS DNS
$6,205,474 $293,038 $0 $0 $0 $69,353 $0 $0 $0 $0 $0 $362,391 5.84% 5.79% 1.78% 9.18% DNS
$8,789,258 $6,038 $0 $5,717 $0 $363,779 $340 $0 $0 $0 $0 $375,874 4.28% 6.64% 0.62% 5.18% 5.40%
$9,851,250 $324 $75,354 $0 $0 $160,342 $1,509 $651 $0 $0 $0 $238,180 2.42% 2.23% 2.14% 2.02% 3.37%
$2,226,175 $103,596 $0 $0 $240 $112,072 $0 $0 $0 $254,836 $0 $470,744 21.15% 15.28% 12.34% 33.41% DNS
$1,354,185 $1,900 $0 $0 $0 $846,066 $0 $0 $0 $0 $0 $847,966 62.62% 67.64% 63.96% 58.70% 61.44%
$2,596,468 $630 $0 $0 $0 $8,479 $0 $0 $0 $0 $0 $9,109 0.35% DNS 0.35% DNS DNS
$2,045,114 $12,249 $1,378 $259 $0 $119,317 $0 $0 $0 $0 $0 $133,203 6.51% DNS 5.09% 4.34% 14.16%
$89,216,748 $4,050 $0 $440 $0 $1,721,192 $750 $0 $0 $11,945 $0 $1,738,377 1.95% 2.90% 0.77% DNS DNS
$7,234,273 $23,402 $0 $0 $508 $17,569 $0 $0 $0 $0 $0 $41,479 0.57% 0.59% 0.34% 0.84% 0.49%
$475,949,943 $188,824 $350 $44,065 $987,964 $907,398 $0 $36,956 $0 $0 $0 $2,165,557 0.45% 2.46% 0.93% 2.20% 0.00%
$8,363,144 $0 $0 $0 $0 $0 $0 $0 $0 $0 $0 $0 0.00% 0.00% 0.00% 0.00% 0.00%
$0 $0 $0 $0 $0 $0 $0 $0 $0 $0 $0 $0 DNS DNS DNS DNS DNS
$2,767,857 $0 $0 $0 $0 $82,318 $0 $0 $0 $0 $0 $82,318 2.97% 1.48% 8.28% 3.14% 2.12%
$17,027,834 $1,261,236 $160 $1,980 $52,416 $840,514 $13,225 $0 $0 $0 $0 $2,169,531 12.74% 15.25% 12.83% 11.05% 12.65%
$453,900 $0 $0 $0 $0 $0 $0 $0 $0 $0 $0 $0 0.00% 0.00% 0.00% 0.00% 0.00%
$727,969 $0 $0 $0 $0 $0 $0 $0 $0 $0 $0 $0 0.00% 0.00% 0.00% 0.00% 0.00%
$10,007,845 $0 $0 $0 $0 $107,013 $44,642 $32,606 $0 $0 $0 $184,261 1.84% 18.01% 0.51% 11.23% 19.95%
$64,314,375 $1,805,738 $0 $0 $0 $500,526 $0 $0 $0 $0 $0 $2,306,264 3.59% 3.38% 2.33% 4.86% 3.96%
$99,963,123 $6,149,998 $1,141,065 $0 $0 $6,566,492 $5,990,198 $0 $0 $0 $0 $19,847,753 19.86% 15.36% 20.50% 22.50% 26.12%
$868,168 $0 $0 $0 $0 $179,150 $0 $5,016 $3,600 $100 $0 $187,866 21.64% 11.94% 22.74% 30.07% 18.39%
$6,488,476 $83,476 $0 $0 $0 $25,468 $0 $0 $0 $0 $0 $108,944 1.68% 1.36% 2.01% DNS DNS
$2,310,715,225 $59,001,249 $3,822,398 $4,850,061 $1,323,280 $65,174,639 $14,285,963 $1,354,276 $648,776 $2,975,325 $800,919 $154,236,886 6.67% 7.45% 7.10% 9.12% 4.45%
2.55% 0.17% 0.21% 0.06% 2.82% 0.62% 0.06% 0.03% 0.13% 0.03% 6.67%
38.25% 2.48% 3.14% 0.86% 42.26% 9.26% 0.88% 0.42% 1.93% 0.52% 100.00%
Met or Exceeded State's 10% Goal 39 33.91% B Black DBE Disabled Business Enterprise
H Hispanic NPWC Non-Profit Work Center for Blind and Disabled
Reporting for all Four Quarters 79 68.70% AA Asian American SED Socially and Economically Disadvantaged
AI American Indian SUB HUB Subcontractor
Not Reporting for all Four Quarters 36 31.30% WBE Woman Business Enterprise
DBE-O Disabled-Owned Business Enterprise DNS Did not Submit Report
LEGEND
Total Purchasing
% of Total Purchasing
% of Minority Participation
Roanoke Rapids City
Robeson County
Rockingham County
Rowan County/Salisbury
Rutherford County
Person County
Pitt County
Polk County
Randolph County
Richmond County
Swain County
Thomasville City
Transylvania County
Tyrell County
Union County
Sampson County
Scotland County
Stanly County
Stokes County
Surry County
Winston-Salem/Forsyth County
Yadkin County
Yancey County
Wayne County
Weldon City
Whiteville City
Wilkes County
Wilson County
Vance County
Wake County
Warren County
Washington County
Watauga County
Source: HUB Purchasing Report Database

To
tal
De
pt.
($)
B (
$)
H (
$)
AA
($
)
AI
($)
WF
($
)
SE
($
)
D (
$)
To
tal
HU
B
($)
To
tal
HU
B
(%)
Q1
HU
B (
%)
Q2
HU
B (
%)
Q3
HU
B (
%)
Q4
HU
B (
%)
$4,184,240 $0 $0 $0 $0 $0 $0 $0 $0 0.00% 0.00% 0.00% 0.00% 0.00%
$6,320,360 $301,579 $2,270 $0 $0 $1,116,940 $0 $0 $1,420,789 22.48% 3.15% 43.03% 17.08% 29.02%
$57,347,643 $784,559 $343,564 $0 $118,912 $3,935,993 $476,266 $201,211 $5,860,505 10.22% 12.36% 13.50% 10.15% 2.19%
$0 $0 $0 $0 $0 $0 $0 $0 $0 0.00% 0.00% 0.00% 0.00% 0.00%
$0 $0 $0 $0 $0 $0 $0 $0 $0 0.00% 0.00% 0.00% 0.00% 0.00%
$91,512,315 $2,113,535 $431,306 $0 $40,050 $7,049,178 $13,435 $0 $9,647,504 10.54% 0.08% 17.77% 20.76% 19.86%
$3,053,556 $0 $0 $0 $0 $0 $0 $0 $0 0.00% 0.00% 0.00% 0.00% 0.00%
$147,006,870 $2,367,808 $663,606 $531 $11,023 $7,618,844 $422,174 $13,096 $11,097,082 7.55% 16.54% 5.61% 18.27% 14.35%
$0 $0 $0 $0 $0 $0 $0 $0 $0 0.00% 0.00% 0.00% 0.00% 0.00%
$0 $0 $0 $0 $0 $0 $0 $0 $0 0.00% 0.00% 0.00% 0.00% 0.00%
$120,518,232 $3,956,850 $1,398,521 $2,082,170 $509,039 $14,315,136 $0 $7,243 $22,268,959 18.48% 11.03% 27.40% 0.91% 11.86%
$43,525,112 $2,344,666 $435,969 $139,870 $546,781 $19,871,324 $0 $73,820 $23,412,430 53.79% 68.55% 23.92% 37.73% 45.06%
$338,100 $0 $0 $0 $0 $0 $0 $0 $0 0.00% 0.00% 0.00% 0.00% 0.00%
$2,451,692 $35,423 $0 $226,663 $0 $149,419 $0 $0 $411,505 16.78% 0.00% 20.96% 46.84% 2.26%
$476,258,120 $11,904,420 $3,275,236 $2,449,234 $1,225,805 $54,056,834 $911,875 $295,370 $74,118,774 15.56% 17.67% 13.63% 16.58% 16.60%
2.50% 0.69% 0.51% 0.26% 11.35% 0.19% 0.06% 15.56%
16.06% 4.42% 3.30% 1.65% 72.93% 1.23% 0.40% 100.00%
B Black WF White Female
H Hipanic SE Socially and Economically Disadvantaged
AA Asian-American D Disabled
AI American Indian
NORTH CAROLINA DEPARTMENT OF ADMINISTRATION
OFFICE FOR HISTORICALLY UNDERUTILIZED BUSINESSES
% of Minority Participation
LEGEND
FY 2011-2012
(7/1/2011-6/30/2012)
SUMMARY
TOTALS
% of Total Purchasing
HUB PARTICIPATION REPORT - CONSTRUCTION (Includes FORMAL and INFORMAL Projects)
AIRPORT AUTHORITIES
CABINET AGENCIES
COMMUNITY COLLEGES
COUNCIL OF GOVERNMENT
COUNCIIL OF STATE
COUNTIES
HOSPITAL ASSOCIATIONS
SUPPORTING AGENCIES
WATER AND SEWER AUTHORITIES
MUNICIPALITIES
NON-STATE AGENCIES
PUBLIC HOUSING AUTHORITIES
PUBLIC SCHOOLS
STATE UNIVERSITIES

To
tal
De
pt.
($)
B (
$)
H (
$)
AA
($
)
AI
($)
WF
($
)
SE
($
)
D (
$)
To
tal
HU
B
($)
To
tal
HU
B
(%)
YT
D T
ota
l ($
)
YT
D H
UB
($
)
YT
D H
UB
(%)
$3,176,444 $0 $0 $0 $0 $0 $0 $0 $0 0.00% $3,176,444 $0 0.00%
$1,884,450 $0 $2,270 $0 $0 $57,029 $0 $0 $59,299 3.15% $1,884,450 $59,299 3.15%
$18,075,349 $149,520 $186,513 $0 $0 $1,894,405 $4,042 $0 $2,234,480 12.36% $18,075,349 $2,234,480 12.36%
$0 $0 $0 $0 $0 $0 $0 $0 $0 0.00% $0 $0 0.00%
$0 $0 $0 $0 $0 $0 $0 $0 $0 0.00% $0 $0 0.00%
$42,657,015 $26,864 $0 $0 $0 $8,524 $0 $0 $35,388 0.08% $42,657,015 $35,388 0.08%
$2,364,545 $0 $0 $0 $0 $0 $0 $0 $0 0.00% $2,364,545 $0 0.00%
$2,972,377 $0 $0 $0 $0 $482,254 $0 $9,339 $491,593 16.54% $2,972,377 $491,593 16.54%
$0 $0 $0 $0 $0 $0 $0 $0 $0 0.00% $0 $0 0.00%
$0 $0 $0 $0 $0 $0 $0 $0 $0 0.00% $0 $0 0.00%
$55,987,233 $2,922,103 $146,982 $0 $508,065 $2,600,449 $0 $0 $6,177,599 11.03% $55,987,233 $6,177,599 11.03%
$26,448,360 $1,506,409 $289,701 $42,825 $190,759 $16,100,097 $0 $0 $18,129,791 68.55% $26,448,360 $18,129,791 68.55%
$0 $0 $0 $0 $0 $0 $0 $0 $0 0.00% $0 $0 0.00%
$0 $0 $0 $0 $0 $0 $0 $0 $0 0.00% $0 $0 0.00%
$153,565,773 $4,604,896 $625,466 $42,825 $698,824 $21,142,758 $4,042 $9,339 $27,128,150 17.67% $153,565,773 $27,128,150 17.67%
3.00% 0.41% 0.03% 0.46% 13.77% 0.00% 0.01% 17.67%
16.97% 2.31% 0.16% 2.58% 77.94% 0.01% 0.03% 100.00%
B Black WF White Female
H Hipanic SE Socially and Economically Disadvantaged
AA Asian-American D Disabled
AI American Indian
LEGEND
% of Minority Participation
NORTH CAROLINA DEPARTMENT OF ADMINISTRATION
OFFICE FOR HISTORICALLY UNDERUTILIZED BUSINESSES
1ST QTR FY 2011-2012
(7/1/2011-9/30/2011)
SUMMARY
YEAR-TO-DATE
SUMMARY
HUB PARTICIPATION REPORT - CONSTRUCTION (Includes FORMAL and INFORMAL
Projects)
TOTALS
% of Total Purchasing
AIRPORT AUTHORITIES
CABINET AGENCIES
COMMUNITY COLLEGES
COUNCIL OF GOVERNMENT
COUNCIIL OF STATE
COUNTIES
STATE UNIVERSITIES
SUPPORTING AGENCIES
WATER AND SEWER AUTHORITIES
HOSPITAL ASSOCIATIONS
MUNICIPALITIES
NON-STATE AGENCIES
PUBLIC HOUSING AUTHORITIES
PUBLIC SCHOOLS

To
tal
De
pt.
($)
B (
$)
H (
$)
AA
($
)
AI
($)
WF
($
)
SE
($
)
D (
$)
To
tal
HU
B
($)
To
tal
HU
B
(%)
YT
D T
ota
l ($
)
YT
D H
UB
($
)
YT
D H
UB
(%)
Q1
HU
B (
%)
$609,796 $0 $0 $0 $0 $0 $0 $0 $0 0.00% $3,786,240 $0 0.00% 0.00%
$2,118,152 $281,999 $0 $0 $0 $629,364 $0 $0 $911,363 43.03% $4,002,602 $970,662 24.25% 3.15%
$22,507,237 $431,705 $151,260 $0 $115,912 $1,846,316 $292,331 $201,211 $3,038,735 13.50% $40,582,586 $5,273,215 12.99% 12.36%
$0 $0 $0 $0 $0 $0 $0 $0 $0 0.00% $0 $0 0.00% 0.00%
$0 $0 $0 $0 $0 $0 $0 $0 $0 0.00% $0 $0 0.00% 0.00%
$5,220,725 $0 $89,500 $0 $40,050 $798,145 $0 $0 $927,695 17.77% $47,877,740 $963,083 2.01% 0.08%
$468,030 $0 $0 $0 $0 $0 $0 $0 $0 0.00% $2,832,575 $0 0.00% 0.00%
$121,356,151 $1,658,354 $400,238 $531 $0 $4,327,367 $417,551 $0 $6,804,041 5.61% $124,328,528 $7,295,634 5.87% 16.54%
$0 $0 $0 $0 $0 $0 $0 $0 $0 0.00% $0 $0 0.00% 0.00%
$0 $0 $0 $0 $0 $0 $0 $0 $0 0.00% $0 $0 0.00% 0.00%
$57,798,595 $943,671 $1,159,296 $2,082,170 $974 $11,641,370 $0 $7,243 $15,834,724 27.40% $113,785,828 $22,012,323 19.35% 11.03%
$10,537,955 $269,856 $146,268 $0 $0 $2,084,467 $0 $19,940 $2,520,531 23.92% $36,986,315 $20,650,322 55.83% 68.55%
$0 $0 $0 $0 $0 $0 $0 $0 $0 0.00% $0 $0 0.00% 0.00%
$396,370 $3,250 $0 $0 $0 $79,819 $0 $0 $83,069 20.96% $396,370 $83,069 20.96% 0.00%
$221,013,011 $3,588,835 $1,946,562 $2,082,701 $156,936 $21,406,848 $709,882 $228,394 $30,120,158 13.63% $374,578,784 $57,248,308 15.28% 17.67%
1.62% 0.88% 0.94% 0.07% 9.69% 0.32% 0.10% 13.63%
11.92% 6.46% 6.91% 0.52% 71.07% 2.36% 0.76% 100.00%
B Black WF White Female
H Hipanic SE Socially and Economically Disadvantaged
AA Asian-American D Disabled
AI American Indian
% of Minority Participation
LEGEND
YEAR-TO-DATE SUMMARY
NORTH CAROLINA DEPARTMENT OF ADMINISTRATION
OFFICE FOR HISTORICALLY UNDERUTILIZED BUSINESSES
TOTALS
% of Total Purchasing
2ND QTR FY 2011-2012
(10/1/2011-12/31/2011)
HUB PARTICIPATION REPORT - CONSTRUCTION (Includes FORMAL and INFORMAL
Projects)
SUMMARY
AIRPORT AUTHORITIES
CABINET AGENCIES
COMMUNITY COLLEGES
COUNCIL OF GOVERNMENT
COUNCIIL OF STATE
COUNTIES
STATE UNIVERSITIES
SUPPORTING AGENCIES
WATER AND SEWER AUTHORITIES
HOSPITAL ASSOCIATIONS
MUNICIPALITIES
NON-STATE AGENCIES
PUBLIC HOUSING AUTHORITIES
PUBLIC SCHOOLS
To
tal
De
pt.
($)
B (
$)
H (
$)
AA
($
)
AI
($)
WF
($
)
SE
($
)
D (
$)
To
tal
HU
B
($)
To
tal
HU
B
(%)
YT
D T
ota
l ($
)
YT
D H
UB
($
)
YT
D H
UB
(%)
Q1
HU
B (
%)
Q2
HU
B (
%)
$398,000 $0 $0 $0 $0 $0 $0 $0 $0 0.00% $4,184,240 $0 0.00% 0.00% 0.00%
$1,862,862 $0 $0 $0 $0 $318,097 $0 $0 $318,097 17.08% $5,865,464 $1,288,759 21.97% 3.15% 43.03%
$2,756,917 $125,197 $0 $0 $0 $79,702 $75,056 $0 $279,955 10.15% $43,339,503 $5,553,170 12.81% 12.36% 13.50%
$0 $0 $0 $0 $0 $0 $0 $0 $0 0.00% $0 $0 0.00% 0.00% 0.00%
$0 $0 $0 $0 $0 $0 $0 $0 $0 0.00% $0 $0 0.00% 0.00% 0.00%
$1,948,354 $0 $0 $0 $0 $404,540 $0 $0 $404,540 20.76% $49,826,094 $1,367,623 2.74% 0.08% 17.77%
$190,580 $0 $0 $0 $0 $0 $0 $0 $0 0.00% $3,023,155 $0 0.00% 0.00% 0.00%
$13,965,041 $675,066 $229,563 $0 $0 $1,646,773 $0 $0 $2,551,402 18.27% $138,293,569 $9,847,036 7.12% 16.54% 5.61%
$0 $0 $0 $0 $0 $0 $0 $0 $0 0.00% $0 $0 0.00% 0.00% 0.00%
$0 $0 $0 $0 $0 $0 $0 $0 $0 0.00% $0 $0 0.00% 0.00% 0.00%
$4,945,558 $2,000 $0 $0 $0 $42,800 $0 $0 $44,800 0.91% $118,731,386 $22,057,123 18.58% 11.03% 27.40%
$2,514,697 $178,485 $0 $69,295 $350,617 $350,514 $0 $0 $948,911 37.73% $39,501,012 $21,599,233 54.68% 68.55% 23.92%
$0 $0 $0 $0 $0 $0 $0 $0 $0 0.00% $0 $0 0.00% 0.00% 0.00%
$632,433 $0 $0 $226,663 $0 $69,600 $0 $0 $296,263 46.84% $1,028,803 $379,332 36.87% 0.00% 20.96%
$29,214,442 $980,748 $229,563 $295,958 $350,617 $2,912,026 $75,056 $0 $4,843,968 16.58% $403,793,226 $62,092,276 15.38% 17.67% 13.63%
3.36% 0.79% 1.01% 1.20% 9.97% 0.26% 0.00% 16.58%
20.25% 4.74% 6.11% 7.24% 60.12% 1.55% 0.00% 100.00%
B Black WF White Female
H Hipanic SE Socially and Economically Disadvantaged
AA Asian-American D Disabled
AI American Indian
TOTALS
% of Minority Participation
LEGEND
NORTH CAROLINA DEPARTMENT OF ADMINISTRATION
OFFICE FOR HISTORICALLY UNDERUTILIZED BUSINESSES
YEAR-TO-DATE SUMMARY3RD QTR FY 2011-2012
(1/1/2012-3/31/2012)
HUB PARTICIPATION REPORT - CONSTRUCTION (Includes FORMAL and
INFORMAL Projects)
SUMMARY
% of Total Purchasing
AIRPORT AUTHORITIES
CABINET AGENCIES
COMMUNITY COLLEGES
COUNCIL OF GOVERNMENT
COUNCIIL OF STATE
COUNTIES
STATE UNIVERSITIES
SUPPORTING AGENCIES
WATER AND SEWER AUTHORITIES
HOSPITAL ASSOCIATIONS
MUNICIPALITIES
NON-STATE AGENCIES
PUBLIC HOUSING AUTHORITIES
PUBLIC SCHOOLS

To
tal
De
pt.
($)
B (
$)
H (
$)
AA
($
)
AI
($)
WF
($
)
SE
($
)
D (
$)
To
tal
HU
B
($)
To
tal
HU
B
(%)
YT
D T
ota
l ($
)
YT
D H
UB
($
)
YT
D H
UB
(%)
Q1
HU
B (
%)
Q2
HU
B (
%)
Q3
HU
B (
%)
$0 $0 $0 $0 $0 $0 $0 $0 $0 0.00% $4,184,240 $0 0.00% 0.00% 0.00% 0.00%
$454,895 $19,580 $0 $0 $0 $112,450 $0 $0 $132,030 29.02% $6,320,359 $1,420,789 22.48% 3.15% 43.03% 17.08%
$14,008,141 $78,137 $5,791 $0 $3,000 $115,571 $104,837 $0 $307,336 2.19% $57,347,644 $5,860,506 10.22% 12.36% 13.50% 10.15%
$0 $0 $0 $0 $0 $0 $0 $0 $0 0.00% $0 $0 0.00% 0.00% 0.00% 0.00%
$0 $0 $0 $0 $0 $0 $0 $0 $0 0.00% $0 $0 0.00% 0.00% 0.00% 0.00%
$41,686,221 $2,086,671 $341,806 $0 $0 $5,837,969 $13,435 $0 $8,279,881 19.86% $91,512,315 $9,647,504 10.54% 0.08% 17.77% 20.76%
$30,401 $0 $0 $0 $0 $0 $0 $0 $0 0.00% $3,053,556 $0 0.00% 0.00% 0.00% 0.00%
$8,713,301 $34,388 $33,805 $0 $11,023 $1,162,450 $4,623 $3,757 $1,250,046 14.35% $147,006,870 $11,097,082 7.55% 16.54% 5.61% 18.27%
$0 $0 $0 $0 $0 $0 $0 $0 $0 0.00% $0 $0 0.00% 0.00% 0.00% 0.00%
$0 $0 $0 $0 $0 $0 $0 $0 $0 0.00% $0 $0 0.00% 0.00% 0.00% 0.00%
$1,786,846 $89,076 $92,243 $0 $0 $30,517 $0 $0 $211,836 11.86% $120,518,232 $22,268,959 18.48% 11.03% 27.40% 0.91%
$4,024,100 $389,916 $0 $27,750 $5,405 $1,336,247 $0 $53,880 $1,813,198 45.06% $43,525,112 $23,412,431 53.79% 68.55% 23.92% 37.73%
$338,100 $0 $0 $0 $0 $0 $0 $0 $0 0.00% $338,100 $0 0.00% 0.00% 0.00% 0.00%
$1,422,890 $32,173 $0 $0 $0 $0 $0 $0 $32,173 2.26% $2,451,693 $411,505 16.78% 0.00% 20.96% 46.84%
$72,464,895 $2,729,941 $473,645 $27,750 $19,428 $8,595,204 $122,895 $57,637 $12,026,500 16.60% $476,258,121 $74,118,776 15.56% 17.67% 13.63% 16.58%
3.77% 0.65% 0.04% 0.03% 11.86% 0.17% 0.08% 16.60%
22.70% 3.94% 0.23% 0.16% 71.47% 1.02% 0.48% 100.00%
B Black WF White Female
H Hipanic SE Socially and Economically Disadvantaged
AA Asian-American D Disabled
AI American Indian
NORTH CAROLINA DEPARTMENT OF ADMINISTRATION
OFFICE FOR HISTORICALLY UNDERUTILIZED BUSINESSES
LEGEND
4TH QTR FY 2011-2012
(4/1/2012-6/30/2012)
HUB PARTICIPATION REPORT - CONSTRUCTION (Includes FORMAL and
INFORMAL Projects)YEAR-TO-DATE SUMMARY
TOTALS
% of Total Purchasing
% of Minority Participation
SUMMARY
AIRPORT AUTHORITIES
CABINET AGENCIES
COMMUNITY COLLEGES
COUNCIL OF GOVERNMENT
COUNCIIL OF STATE
COUNTIES
STATE UNIVERSITIES
SUPPORTING AGENCIES
WATER AND SEWER AUTHORITIES
HOSPITAL ASSOCIATIONS
MUNICIPALITIES
NON-STATE AGENCIES
PUBLIC HOUSING AUTHORITIES
PUBLIC SCHOOLS
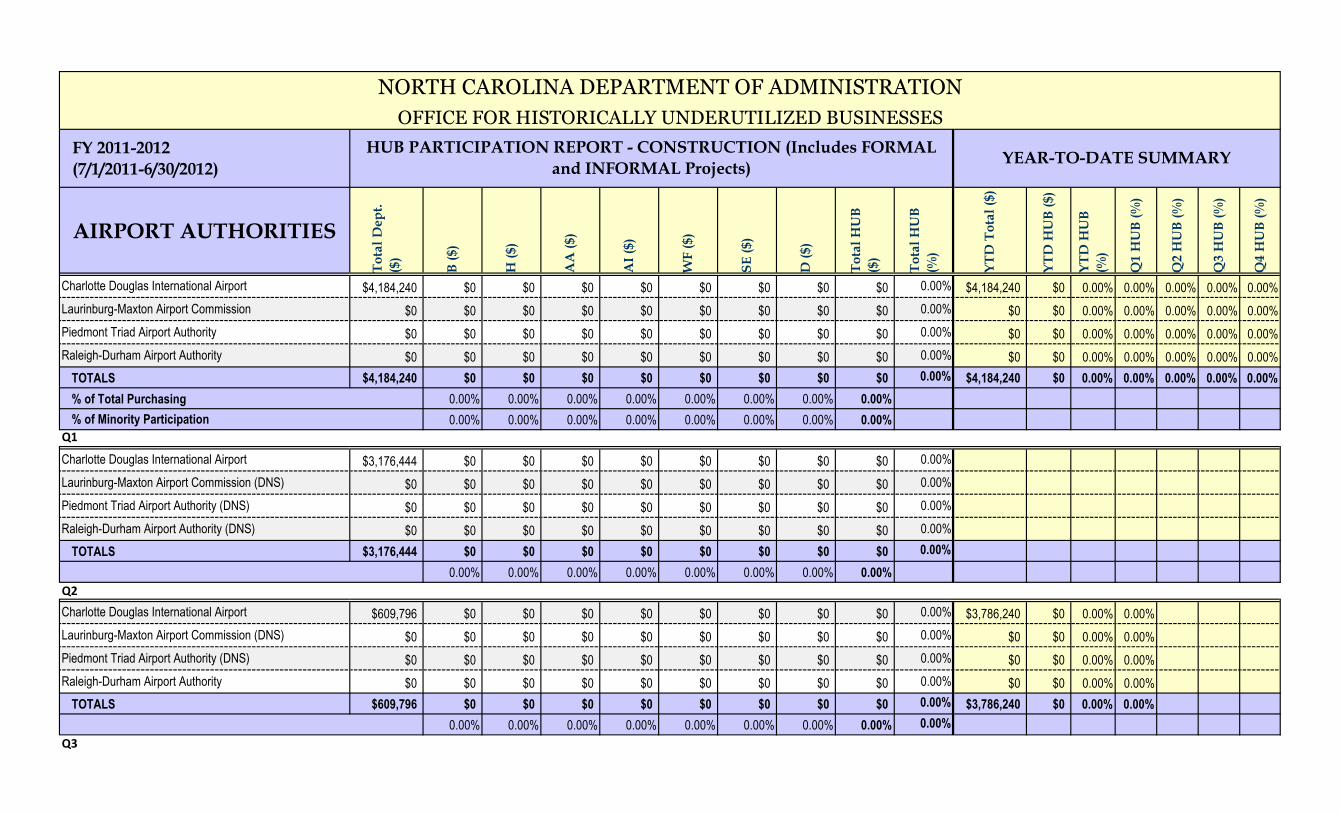
FY 2011-2012
(7/1/2011-6/30/2012)
AIRPORT AUTHORITIES
To
tal
De
pt.
($)
B (
$)
H (
$)
AA
($
)
AI
($)
WF
($
)
SE
($
)
D (
$)
To
tal
HU
B
($)
To
tal
HU
B
(%)
YT
D T
ota
l ($
)
YT
D H
UB
($
)
YT
D H
UB
(%)
Q1
HU
B (
%)
Q2
HU
B (
%)
Q3
HU
B (
%)
Q4
HU
B (
%)
Charlotte Douglas International Airport $4,184,240 $0 $0 $0 $0 $0 $0 $0 $0 0.00% $4,184,240 $0 0.00% 0.00% 0.00% 0.00% 0.00%
Laurinburg-Maxton Airport Commission $0 $0 $0 $0 $0 $0 $0 $0 $0 0.00% $0 $0 0.00% 0.00% 0.00% 0.00% 0.00%
Piedmont Triad Airport Authority $0 $0 $0 $0 $0 $0 $0 $0 $0 0.00% $0 $0 0.00% 0.00% 0.00% 0.00% 0.00%
Raleigh-Durham Airport Authority $0 $0 $0 $0 $0 $0 $0 $0 $0 0.00% $0 $0 0.00% 0.00% 0.00% 0.00% 0.00%
TOTALS $4,184,240 $0 $0 $0 $0 $0 $0 $0 $0 0.00% $4,184,240 $0 0.00% 0.00% 0.00% 0.00% 0.00%
% of Total Purchasing 0.00% 0.00% 0.00% 0.00% 0.00% 0.00% 0.00% 0.00%
0.00% 0.00% 0.00% 0.00% 0.00% 0.00% 0.00% 0.00%
Q1
Charlotte Douglas International Airport $3,176,444 $0 $0 $0 $0 $0 $0 $0 $0 0.00%
Laurinburg-Maxton Airport Commission (DNS) $0 $0 $0 $0 $0 $0 $0 $0 $0 0.00%
Piedmont Triad Airport Authority (DNS) $0 $0 $0 $0 $0 $0 $0 $0 $0 0.00%
Raleigh-Durham Airport Authority (DNS) $0 $0 $0 $0 $0 $0 $0 $0 $0 0.00%
TOTALS $3,176,444 $0 $0 $0 $0 $0 $0 $0 $0 0.00%
0.00% 0.00% 0.00% 0.00% 0.00% 0.00% 0.00% 0.00%
Q2
Charlotte Douglas International Airport $609,796 $0 $0 $0 $0 $0 $0 $0 $0 0.00% $3,786,240 $0 0.00% 0.00%
Laurinburg-Maxton Airport Commission (DNS) $0 $0 $0 $0 $0 $0 $0 $0 $0 0.00% $0 $0 0.00% 0.00%
Piedmont Triad Airport Authority (DNS) $0 $0 $0 $0 $0 $0 $0 $0 $0 0.00% $0 $0 0.00% 0.00%
Raleigh-Durham Airport Authority $0 $0 $0 $0 $0 $0 $0 $0 $0 0.00% $0 $0 0.00% 0.00%
TOTALS $609,796 $0 $0 $0 $0 $0 $0 $0 $0 0.00% $3,786,240 $0 0.00% 0.00%
0.00% 0.00% 0.00% 0.00% 0.00% 0.00% 0.00% 0.00% 0.00%
Q3
HUB PARTICIPATION REPORT - CONSTRUCTION (Includes FORMAL
and INFORMAL Projects)YEAR-TO-DATE SUMMARY
NORTH CAROLINA DEPARTMENT OF ADMINISTRATION
OFFICE FOR HISTORICALLY UNDERUTILIZED BUSINESSES
% of Minority Participation

Charlotte Douglas International Airport $398,000 $0 $0 $0 $0 $0 $0 $0 $0 0.00% $4,184,240 $0 0.00% 0.00% 0.00%
Laurinburg-Maxton Airport Commission (DNS) $0 $0 $0 $0 $0 $0 $0 $0 $0 0.00% $0 $0 0.00% 0.00% 0.00%
Piedmont Triad Airport Authority (DNS) $0 $0 $0 $0 $0 $0 $0 $0 $0 0.00% $0 $0 0.00% 0.00% 0.00%
Raleigh-Durham Airport Authority $0 $0 $0 $0 $0 $0 $0 $0 $0 0.00% $0 $0 0.00% 0.00% 0.00%
TOTALS $398,000 $0 $0 $0 $0 $0 $0 $0 $0 0.00% $4,184,240 $0 0.00% 0.00% 0.00%
0.00% 0.00% 0.00% 0.00% 0.00% 0.00% 0.00% 0.00% 0.00%
Q4
Charlotte Douglas International Airport (DNS) $0 $0 $0 $0 $0 $0 $0 $0 $0 0.00% $4,184,240 $0 0.00% 0.00% 0.00% 0.00%
Laurinburg-Maxton Airport Commission (DNS) $0 $0 $0 $0 $0 $0 $0 $0 $0 0.00% $0 $0 0.00% 0.00% 0.00% 0.00%
Piedmont Triad Airport Authority (DNS) $0 $0 $0 $0 $0 $0 $0 $0 $0 0.00% $0 $0 0.00% 0.00% 0.00% 0.00%
Raleigh-Durham Airport Authority (DNS) $0 $0 $0 $0 $0 $0 $0 $0 $0 0.00% $0 $0 0.00% 0.00% 0.00% 0.00%
TOTALS $0 $0 $0 $0 $0 $0 $0 $0 $0 0.00% $4,184,240 $0 0.00% 0.00% 0.00% 0.00%
0.00% 0.00% 0.00% 0.00% 0.00% 0.00% 0.00% 0.00% 0.00%
B Black WF White Female
H Hipanic SE Socially and Economically Disadvantaged
AA Asian-American D Disabled
AI American Indian DNS Did Not Submit report
LEGEND

FY 2011-2012
(7/1/2011-6/30/2012)
CABINET AGENCIES
To
tal
Dep
t.
($)
B (
$)
H (
$)
AA
($)
AI
($)
WF
($)
SE
($)
D (
$)
To
tal
HU
B
($)
To
tal
HU
B
(%)
YT
D T
ota
l ($
)
YT
D H
UB
($)
YT
D H
UB
(%)
Q1 H
UB
(%
)
Q2 H
UB
(%
)
Q3 H
UB
(%
)
Q4 H
UB
(%
)
NC Crime Control & Public Safety - Army
National Guard $234,279 $55,702 $0 $0 $0 $0 $0 $0 $55,702 23.78% $234,279 $55,702 23.78% 0.00% 97.45% 0.00% 0.00%
NC Department of Administration Facility
Management Division $0 $0 $0 $0 $0 $0 $0 $0 0.00% $0 $0 0.00% 0.00% 0.00% 0.00% 0.00%
NC Department of Administraton - State
Construction Office $1,662,867 $0 $0 $0 $336,919 $0 $0 $336,919 20.26% $1,662,867 $336,919 20.26% 0.65% 30.76% 0.00% 0.00%
NC Department of Commerce $0 $0 $0 $0 $0 $0 $0 $0 0.00% $0 $0 0.00% 0.00% 0.00% 0.00% 0.00%
NC Department of Correction $2,253,618 $0 $0 $0 $595,097 $0 $0 $595,097 26.41% $2,253,618 $595,097 26.41% 0.00% 41.47% 30.93% 0.00%
NC Department of Cultural Resources $0 $0 $0 $0 $0 $0 $0 $0 0.00% $0 $0 0.00% 0.00% 0.00% 0.00% 0.00%
NC Department of Environment and Natural
Resources (NCDENR) $1,039,710 $2,270 $0 $0 $55,859 $0 $0 $58,129 5.59% $1,039,710 $58,129 5.59% 6.67% 0.00% 0.00% 0.00%
NC Department of Health and Human Services
(NC DHHS) $0 $0 $0 $0 $0 $0 $0 $0 0.00% $0 $0 0.00% 0.00% 0.00% 0.00% 0.00%
NC Department of Juvenile Justice &
Delinquency Prevention $0 $0 $0 $0 $0 $0 $0 $0 0.00% $0 $0 0.00% 0.00% 0.00% 0.00% 0.00%
NC Department of Revenue $0 $0 $0 $0 $0 $0 $0 $0 0.00% $0 $0 0.00% 0.00% 0.00% 0.00% 0.00%
NC Department of Transportation (NC DOT) $0 $0 $0 $0 $0 $0 $0 $0 0.00% $0 $0 0.00% 0.00% 0.00% 0.00% 0.00%
NC DOT- Facility Design, Construction &
Maintenanace Unit $1,129,886 $0 $0 $0 $129,065 $0 $0 $129,065 11.42% $1,129,886 $374,942 33.18% 0.00% 85.93% 4.64% 42.31%
TOTALS $6,320,360 $55,702 $2,270 $0 $0 $1,116,940 $0 $0 $1,174,912 18.59% $6,320,360 $1,420,789 22.48% 3.15% 43.03% 17.08% 29.02%
% of Total Purchasing 0.88% 0.04% 0.00% 0.00% 17.67% 0.00% 0.00% 18.59%
4.74% 0.19% 0.00% 0.00% 95.07% 0.00% 0.00% 100.00%
Q1
NC Crime Control & Public Safety - Army
National Guard $177,122 $0 $0 $0 $0 $0 $0 $0 $0 0.00%
NC Department of Administration Facility
Management Division $0 $0 $0 $0 $0 $0 $0 $0 $0 0.00%
NC Department of Administraton - State
Construction Office $179,640 $0 $0 $0 $0 $1,170 $0 $0 $1,170 0.65%
YEAR-TO-DATE SUMMARY
NORTH CAROLINA DEPARTMENT OF ADMINISTRATION
OFFICE FOR HISTORICALLY UNDERUTILIZED BUSINESSES
% of Minority Participation
HUB PARTICIPATION REPORT - CONSTRUCTION (Includes FORMAL and
INFORMAL Projects)

NC Department of Commerce $0 $0 $0 $0 $0 $0 $0 $0 $0 0.00%
NC Department of Correction $426,717 $0 $0 $0 $0 $0 $0 $0 $0 0.00%
NC Department of Cultural Resources (DNS) $0 $0 $0 $0 $0 $0 $0 $0 $0 0.00%
NC Department of Environment and Natural
Resources (NCDENR) $871,588 $0 $2,270 $0 $0 $55,859 $0 $0 $58,129 6.67%
NC Department of Health and Human Services
(NC DHHS) (DNS) $0 $0 $0 $0 $0 $0 $0 $0 $0 0.00%
NC Department of Juvenile Justice &
Delinquency Prevention (DNS) $0 $0 $0 $0 $0 $0 $0 $0 $0 0.00%
NC Department of Revenue (DNS) $0 $0 $0 $0 $0 $0 $0 $0 $0 0.00%NC Department of Transportation (NC DOT)
(DNS) $0 $0 $0 $0 $0 $0 $0 $0 $0 0.00%
NC DOT- Facility Management Division $229,383 $0 $0 $0 $0 $0 $0 $0 $0 0.00%
TOTALS $1,884,450 $0 $2,270 $0 $0 $57,029 $0 $0 $59,299 3.15%
0.00% 0.12% 0.00% 0.00% 3.03% 0.00% 0.00% 3.15%
Q2
NC Crime Control & Public Safety - Army
National Guard $57,157 $55,702 $0 $0 $0 $0 $0 $0 $55,702 97.45% $234,279 $55,702 23.78% 0.00%
NC Department of Administration Facility
Management Division $0 $0 $0 $0 $0 $0 $0 $0 $0 0.00% $0 $0 0.00% 0.00%
NC Department of Administraton - State
Construction Office $1,091,665 $0 $0 $0 $0 $335,749 $0 $0 $335,749 30.76% $1,271,305 $336,919 26.50% 0.65%
NC Department of Commerce (DNS) $0 $0 $0 $0 $0 $0 $0 $0 $0 0.00% $0 $0 0.00% 0.00%
NC Department of Correction $704,109 $0 $0 $0 $0 $292,000 $0 $0 $292,000 41.47% $1,130,826 $292,000 25.82% 0.00%
NC Department of Cultural Resources (DNS) $0 $0 $0 $0 $0 $0 $0 $0 $0 0.00% $0 $0 0.00% 0.00%
NC Department of Environment and Natural
Resources (NCDENR) (DNS) $0 $0 $0 $0 $0 $0 $0 $0 $0 0.00% $871,588 $58,129 6.67% 6.67%
NC Department of Health and Human Services
(NC DHHS) (DNS) $0 $0 $0 $0 $0 $0 $0 $0 $0 0.00% $0 $0 0.00% 0.00%
NC Department of Juvenile Justice &
Delinquency Prevention (DNS) $0 $0 $0 $0 $0 $0 $0 $0 $0 0.00% $0 $0 0.00% 0.00%
NC Department of Revenue (DNS) $0 $0 $0 $0 $0 $0 $0 $0 $0 0.00% $0 $0 0.00% 0.00%NC Department of Transportation (NC DOT)
(DNS) $0 $0 $0 $0 $0 $0 $0 $0 $0 0.00% $0 $0 0.00% 0.00%
NC DOT- Facility Management Division $265,221 $226,297 $0 $0 $0 $1,615 $0 $0 $227,912 85.93% $494,604 $227,912 46.08% 0.00%
TOTALS $2,118,152 $281,999 $0 $0 $0 $629,364 $0 $0 $911,363 43.03% $4,002,603 $970,662 24.25% 3.15%
13.31% 0.00% 0.00% 0.00% 29.71% 0.00% 0.00% 43.03%

Q3
NC Crime Control & Public Safety - Army
National Guard (DNS) $0 $0 $0 $0 $0 $0 $0 $0 $0 0.00% $234,279 $55,702 23.78% 0.00% 97.45%
NC Department of Administration Facility
Management Division $0 $0 $0 $0 $0 $0 $0 $0 $0 0.00% $0 $0 0.00% 0.00% 0.00%
NC Department of Administraton - State
Construction Office $391,562 $0 $0 $0 $0 $0 $0 $0 $0 0.00% $1,662,867 $336,919 20.26% 0.65% 30.76%
NC Department of Commerce $0 $0 $0 $0 $0 $0 $0 $0 $0 0.00% $0 $0 0.00% 0.00% 0.00%
NC Department of Correction $979,937 $0 $0 $0 $0 $303,097 $0 $0 $303,097 30.93% $2,110,763 $595,097 28.19% 0.00% 41.47%
NC Department of Cultural Resources (DNS) $0 $0 $0 $0 $0 $0 $0 $0 $0 0.00% $0 $0 0.00% 0.00% 0.00%
NC Department of Environment and Natural
Resources (NCDENR) $168,122 $0 $0 $0 $0 $0 $0 $0 $0 0.00% $1,039,710 $58,129 5.59% 6.67% 0.00%
NC Department of Health and Human Services
(NC DHHS) (DNS) $0 $0 $0 $0 $0 $0 $0 $0 $0 0.00% $0 $0 0.00% 0.00% 0.00%
NC Department of Juvenile Justice &
Delinquency Prevention (DNS) $0 $0 $0 $0 $0 $0 $0 $0 $0 0.00% $0 $0 0.00% 0.00% 0.00%
NC Department of Revenue (DNS) $0 $0 $0 $0 $0 $0 $0 $0 $0 0.00% $0 $0 0.00% 0.00% 0.00%NC Department of Transportation (NC DOT)
(DNS) $0 $0 $0 $0 $0 $0 $0 $0 $0 0.00% $0 $0 0.00% 0.00% 0.00%
NC DOT- Facility Management Division $323,241 $0 $0 $0 $0 $15,000 $0 $0 $15,000 4.64% $817,845 $242,912 29.70% 0.00% 85.93%
TOTALS $1,862,862 $0 $0 $0 $0 $318,097 $0 $0 $318,097 17.08% $5,865,464 $1,288,758 21.97% 3.15% 43.03%
0.00% 0.00% 0.00% 0.00% 17.08% 0.00% 0.00% 17.08%
Q4
NC Crime Control & Public Safety - Army
National Guard (DNS) $0 $0 $0 $0 $0 $0 $0 $0 $0 0.00% $234,279 $55,702 23.78% 0.00% 97.45% 0.00%
NC Department of Administration Facility
Management Division $0 $0 $0 $0 $0 $0 $0 $0 $0 0.00% $0 $0 0.00% 0.00% 0.00% 0.00%
NC Department of Administraton - State
Construction Office (DNS) $0 $0 $0 $0 $0 $0 $0 $0 $0 0.00% $1,662,867 $336,919 20.26% 0.65% 30.76% 0.00%
NC Department of Commerce $0 $0 $0 $0 $0 $0 $0 $0 $0 0.00% $0 $0 0.00% 0.00% 0.00% 0.00%
NC Department of Correction $142,854 $0 $0 $0 $0 $0 $0 $0 $0 0.00% $2,253,618 $595,097 26.41% 0.00% 41.47% 30.93%
NC Department of Cultural Resources (DNS) $0 $0 $0 $0 $0 $0 $0 $0 $0 0.00% $0 $0 0.00% 0.00% 0.00% 0.00%
NC Department of Environment and Natural
Resources (NCDENR) (DNS) $0 $0 $0 $0 $0 $0 $0 $0 $0 0.00% $1,039,710 $58,129 5.59% 6.67% 0.00% 0.00%
NC Department of Health and Human Services
(NC DHHS) (DNS) $0 $0 $0 $0 $0 $0 $0 $0 $0 0.00% $0 $0 0.00% 0.00% 0.00% 0.00%
NC Department of Juvenile Justice &
Delinquency Prevention (DNS) $0 $0 $0 $0 $0 $0 $0 $0 $0 0.00% $0 $0 0.00% 0.00% 0.00% 0.00%

NC Department of Revenue (DNS) $0 $0 $0 $0 $0 $0 $0 $0 $0 0.00% $0 $0 0.00% 0.00% 0.00% 0.00%NC Department of Transportation (NC DOT)
(DNS) $0 $0 $0 $0 $0 $0 $0 $0 $0 0.00% $0 $0 0.00% 0.00% 0.00% 0.00%
NC DOT- Facility Management Division $312,041 $19,580 $0 $0 $0 $112,450 $0 $0 $132,030 42.31% $1,129,886 $374,942 33.18% 0.00% 85.93% 4.64%
TOTALS $454,895 $19,580 $0 $0 $0 $112,450 $0 $0 $132,030 29.02% $6,320,360 $1,420,788 22.48% 3.15% 43.03% 17.08%
4.30% 0.00% 0.00% 0.00% 24.72% 0.00% 0.00% 29.02%
B Black WF White Female
H Hipanic SE Socially and Economically Disadvantaged
AA Asian-American D Disabled
AI American Indian DNS Did Not Submit report
LEGEND

FY 2011-2012
(7/1/2011-6/30/2012)
COMMUNITY
COLLEGES
To
tal
De
pt.
($)
B (
$)
H (
$)
AA
($
)
AI
($)
WF
($
)
SE
($
)
D (
$)
To
tal
HU
B
($)
To
tal
HU
B
(%)
YT
D T
ota
l ($
)
YT
D H
UB
($
)
YT
D H
UB
(%)
Q1
HU
B (
%)
Q2
HU
B (
%)
Q3
HU
B (
%)
Q4
HU
B (
%)
Alamance Community College $36,435 $0 $0 $0 $0 $0 $0 $0 $0 0.00% $36,435 $0 0.00% 0.00% 0.00% 0.00% 0.00%
Asheville-Buncombe Technical Community College $0 $0 $0 $0 $0 $0 $0 $0 $0 0.00% $0 $0 0.00% 0.00% 0.00% 0.00% 0.00%
Beaufort County Community College $4,877,805 $0 $0 $0 $0 $49,900 $0 $0 $49,900 1.02% $4,877,805 $49,900 1.02% 0.00% 0.00% 0.00% 1.02%
Bladen Community College $0 $0 $0 $0 $0 $0 $0 $0 $0 0.00% $0 $0 0.00% 0.00% 0.00% 0.00% 0.00%
Blue Ridge Community College $0 $0 $0 $0 $0 $0 $0 $0 $0 0.00% $0 $0 0.00% 0.00% 0.00% 0.00% 0.00%
Brunswick Community College $0 $0 $0 $0 $0 $0 $0 $0 $0 0.00% $0 $0 0.00% 0.00% 0.00% 0.00% 0.00%
Caldwell Community College & Technical Institute $0 $0 $0 $0 $0 $0 $0 $0 $0 0.00% $0 $0 0.00% 0.00% 0.00% 0.00% 0.00%
Cape Fear Community College $0 $0 $0 $0 $0 $0 $0 $0 $0 0.00% $0 $0 0.00% 0.00% 0.00% 0.00% 0.00%
Carteret Community College $0 $0 $0 $0 $0 $0 $0 $0 $0 0.00% $0 $0 0.00% 0.00% 0.00% 0.00% 0.00%
Catawba Valley Community College $0 $0 $0 $0 $0 $0 $0 $0 $0 0.00% $0 $0 0.00% 0.00% 0.00% 0.00% 0.00%
Central Carolina Community College $0 $0 $0 $0 $0 $0 $0 $0 $0 0.00% $0 $0 0.00% 0.00% 0.00% 0.00% 0.00%
Central Piedmont Community College $0 $0 $0 $0 $0 $0 $0 $0 $0 0.00% $0 $0 0.00% 0.00% 0.00% 0.00% 0.00%
Cleveland Community College $0 $0 $0 $0 $0 $0 $0 $0 $0 0.00% $0 $0 0.00% 0.00% 0.00% 0.00% 0.00%
Coastal Carolina Community College $0 $0 $0 $0 $0 $0 $0 $0 $0 0.00% $0 $0 0.00% 0.00% 0.00% 0.00% 0.00%
College of The Albemarle $0 $0 $0 $0 $0 $0 $0 $0 $0 0.00% $0 $0 0.00% 0.00% 0.00% 0.00% 0.00%
Craven Community College $0 $0 $0 $0 $0 $0 $0 $0 $0 0.00% $0 $0 0.00% 0.00% 0.00% 0.00% 0.00%
Davidson County Community College $0 $0 $0 $0 $0 $0 $0 $0 $0 0.00% $0 $0 0.00% 0.00% 0.00% 0.00% 0.00%
Durham Technical Community College $0 $0 $0 $0 $0 $0 $0 $0 $0 0.00% $0 $0 0.00% 0.00% 0.00% 0.00% 0.00%
Edgecombe Community College $0 $0 $0 $0 $0 $0 $0 $0 $0 0.00% $0 $0 0.00% 0.00% 0.00% 0.00% 0.00%
Fayetteville Technical Community College $0 $0 $0 $0 $0 $0 $0 $0 $0 0.00% $0 $0 0.00% 0.00% 0.00% 0.00% 0.00%
Forsyth Technical Community College $5,976,053 $0 $74,500 $0 $0 $162,046 $0 $0 $236,546 3.96% $5,976,053 $236,546 3.96% 0.49% 4.44% 0.00% 2.93%
Gaston College $8,541,477 $0 $0 $0 $0 $30,800 $89,000 $0 $119,800 1.40% $8,541,477 $119,800 1.40% 0.00% 0.00% 0.00% 1.67%
Guilford Technical Community College $23,306,359 $630,882 $254,004 $0 $67,502 $1,995,894 $263,029 $201,211 $3,412,522 14.64% $23,306,359 $3,412,522 14.64% 11.65% 20.07% 34.05% 18.09%
Halifax Community College $0 $0 $0 $0 $0 $0 $0 $0 $0 0.00% $0 $0 0.00% 0.00% 0.00% 0.00% 0.00%
Haywood Community College $0 $0 $0 $0 $0 $0 $0 $0 $0 0.00% $0 $0 0.00% 0.00% 0.00% 0.00% 0.00%
Isothermal Community College $0 $0 $0 $0 $0 $0 $0 $0 $0 0.00% $0 $0 0.00% 0.00% 0.00% 0.00% 0.00%
James Sprunt Community College $0 $0 $0 $0 $0 $0 $0 $0 $0 0.00% $0 $0 0.00% 0.00% 0.00% 0.00% 0.00%
Johnston Community College $0 $0 $0 $0 $0 $0 $0 $0 $0 0.00% $0 $0 0.00% 0.00% 0.00% 0.00% 0.00%
HUB PARTICIPATION REPORT - CONSTRUCTION (Includes FORMAL and
INFORMAL Projects)YEAR-TO-DATE SUMMARY
NORTH CAROLINA DEPARTMENT OF ADMINISTRATION
OFFICE FOR HISTORICALLY UNDERUTILIZED BUSINESSES

Lenoir Community College $399,528 $0 $0 $0 $3,000 $2,680 $0 $0 $5,680 1.42% $399,528 $5,680 1.42% 0.00% 0.00% 0.00% 13.82%
Martin Community College $0 $0 $0 $0 $0 $0 $0 $0 $0 0.00% $0 $0 0.00% 0.00% 0.00% 0.00% 0.00%
Mayland Community College $0 $0 $0 $0 $0 $0 $0 $0 $0 0.00% $0 $0 0.00% 0.00% 0.00% 0.00% 0.00%
McDowell Technical Community College $0 $0 $0 $0 $0 $0 $0 $0 $0 0.00% $0 $0 0.00% 0.00% 0.00% 0.00% 0.00%
Mitchell Community College $5,474,517 $0 $0 $0 $0 $1,255,906 $124,237 $0 $1,380,143 25.21% $5,474,517 $1,380,143 25.21% 91.27% 19.44% 20.60% 0.00%
Montgomery Community College $0 $0 $0 $0 $0 $0 $0 $0 $0 0.00% $0 $0 0.00% 0.00% 0.00% 0.00% 0.00%
Nash Community College $0 $0 $0 $0 $0 $0 $0 $0 $0 0.00% $0 $0 0.00% 0.00% 0.00% 0.00% 0.00%
North Carolina Center for Applied Textiles $0 $0 $0 $0 $0 $0 $0 $0 $0 0.00% $0 $0 0.00% 0.00% 0.00% 0.00% 0.00%
Pamlico Community College $0 $0 $0 $0 $0 $0 $0 $0 $0 0.00% $0 $0 0.00% 0.00% 0.00% 0.00% 0.00%
Piedmont Community College $0 $0 $0 $0 $0 $0 $0 $0 $0 0.00% $0 $0 0.00% 0.00% 0.00% 0.00% 0.00%
Pitt Community College $0 $0 $0 $0 $0 $0 $0 $0 $0 0.00% $0 $0 0.00% 0.00% 0.00% 0.00% 0.00%
Randolph Community College $649,818 $1,575 $7,900 $0 $0 $96,272 $0 $0 $105,747 16.27% $649,818 $105,747 16.27% 0.00% 16.45% 42.38% 0.00%
Richmond Community College $0 $0 $0 $0 $0 $0 $0 $0 $0 0.00% $0 $0 0.00% 0.00% 0.00% 0.00% 0.00%
Roanoke-Chowan Community College $0 $0 $0 $0 $0 $0 $0 $0 $0 0.00% $0 $0 0.00% 0.00% 0.00% 0.00% 0.00%
Robeson Community College $0 $0 $0 $0 $0 $0 $0 $0 $0 0.00% $0 $0 0.00% 0.00% 0.00% 0.00% 0.00%
Rockingham Community College $241,272 $0 $0 $0 $0 $0 $0 $0 $0 0.00% $241,272 $0 0.00% 0.00% 0.00% 0.00% 0.00%
Rowan-Cabarrus Community College $0 $0 $0 $0 $0 $0 $0 $0 $0 0.00% $0 $0 0.00% 0.00% 0.00% 0.00% 0.00%
Sampson Community College $0 $0 $0 $0 $0 $0 $0 $0 $0 0.00% $0 $0 0.00% 0.00% 0.00% 0.00% 0.00%
Sandhills Community College $0 $0 $0 $0 $0 $0 $0 $0 $0 0.00% $0 $0 0.00% 0.00% 0.00% 0.00% 0.00%
South Piedmont Community College $0 $0 $0 $0 $0 $0 $0 $0 $0 0.00% $0 $0 0.00% 0.00% 0.00% 0.00% 0.00%
Southeastern Community College $317,285 $0 $0 $0 $0 $0 $0 $0 $0 0.00% $317,285 $0 0.00% 0.00% 0.00% 0.00% 0.00%
Southwestern Community College $0 $0 $0 $0 $0 $0 $0 $0 $0 0.00% $0 $0 0.00% 0.00% 0.00% 0.00% 0.00%
Stanly Community College $0 $0 $0 $0 $0 $0 $0 $0 $0 0.00% $0 $0 0.00% 0.00% 0.00% 0.00% 0.00%
Surry Community College $0 $0 $0 $0 $0 $0 $0 $0 $0 0.00% $0 $0 0.00% 0.00% 0.00% 0.00% 0.00%
Tri-County Community College $0 $0 $0 $0 $0 $0 $0 $0 $0 0.00% $0 $0 0.00% 0.00% 0.00% 0.00% 0.00%
Vance-Granville Community College $208,401 $14,220 $0 $0 $0 $0 $0 $0 $14,220 6.82% $208,401 $14,220 6.82% 0.00% 0.00% 7.99% 0.00%
Wake Technical Community College $7,318,693 $137,882 $7,160 $0 $48,410 $342,496 $0 $0 $535,948 7.32% $7,318,693 $535,948 7.32% 0.00% 9.02% 0.00% 0.00%
Wayne Community College $0 $0 $0 $0 $0 $0 $0 $0 $0 0.00% $0 $0 0.00% 0.00% 0.00% 0.00% 0.00%
Western Piedmont Community College $0 $0 $0 $0 $0 $0 $0 $0 $0 0.00% $0 $0 0.00% 0.00% 0.00% 0.00% 0.00%
Wilkes Community College $0 $0 $0 $0 $0 $0 $0 $0 $0 0.00% $0 $0 0.00% 0.00% 0.00% 0.00% 0.00%
Wilson Technical Community College $0 $0 $0 $0 $0 $0 $0 $0 $0 0.00% $0 $0 0.00% 0.00% 0.00% 0.00% 0.00%
TOTALS $57,347,643 $784,559 $343,564 $0 $118,912 $3,935,994 $476,266 $201,211 $5,860,506 10.22% $57,347,643 $5,860,506 10.22% 12.36% 13.50% 10.15% 2.19%
% of Total Purchasing 1.37% 0.60% 0.00% 0.21% 6.86% 0.83% 0.35% 10.22%
13.39% 5.86% 0.00% 2.03% 67.16% 8.13% 3.43% 100.00%
Q1
Alamance Community College (DNS) $0 $0 $0 $0 $0 $0 $0 $0 $0 0.00%
Asheville-Buncombe Technical Community College $0 $0 $0 $0 $0 $0 $0 $0 $0 0.00%
Beaufort County Community College $0 $0 $0 $0 $0 $0 $0 $0 $0 0.00%
Bladen Community College (DNS) $0 $0 $0 $0 $0 $0 $0 $0 $0 0.00%
% of Minority Participation
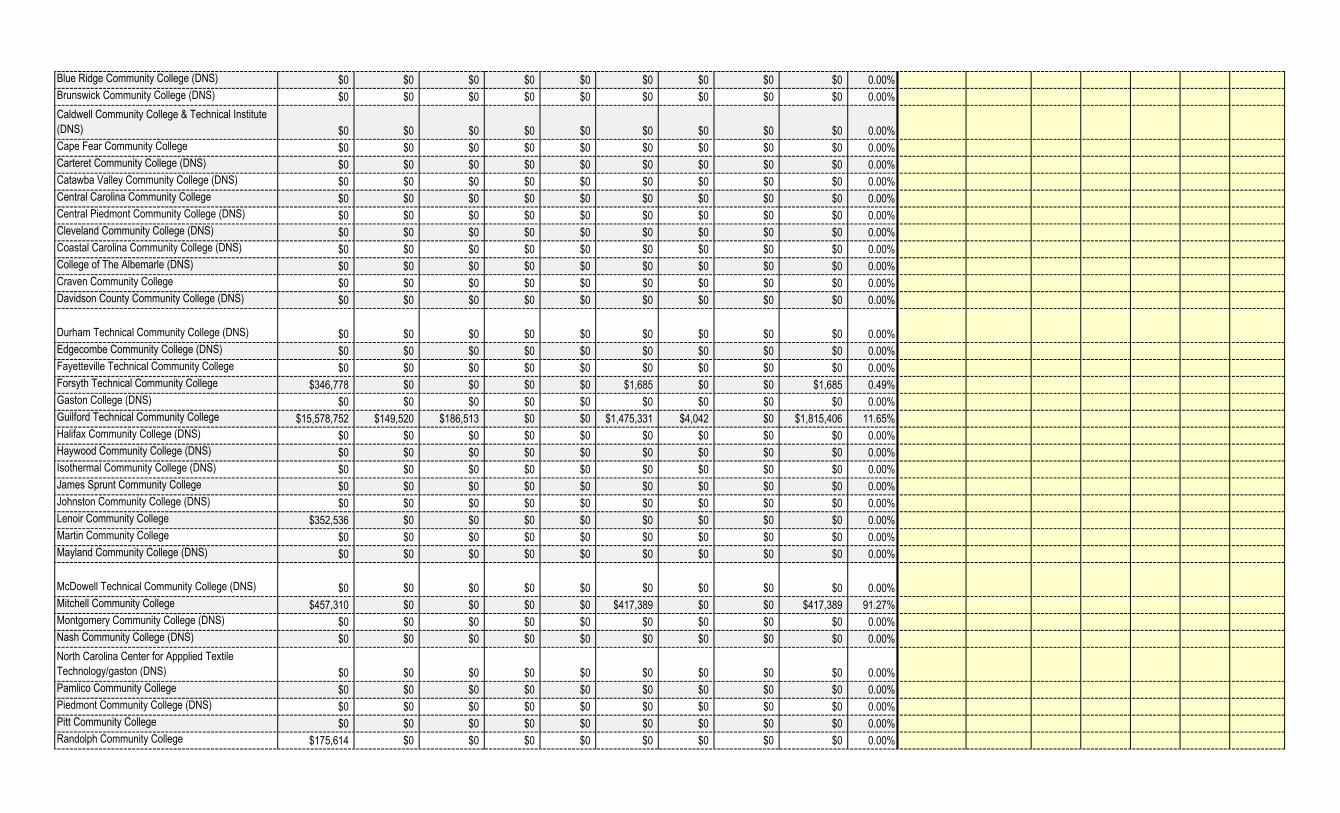
Blue Ridge Community College (DNS) $0 $0 $0 $0 $0 $0 $0 $0 $0 0.00%
Brunswick Community College (DNS) $0 $0 $0 $0 $0 $0 $0 $0 $0 0.00%
Caldwell Community College & Technical Institute
(DNS) $0 $0 $0 $0 $0 $0 $0 $0 $0 0.00%
Cape Fear Community College $0 $0 $0 $0 $0 $0 $0 $0 $0 0.00%
Carteret Community College (DNS) $0 $0 $0 $0 $0 $0 $0 $0 $0 0.00%
Catawba Valley Community College (DNS) $0 $0 $0 $0 $0 $0 $0 $0 $0 0.00%
Central Carolina Community College $0 $0 $0 $0 $0 $0 $0 $0 $0 0.00%
Central Piedmont Community College (DNS) $0 $0 $0 $0 $0 $0 $0 $0 $0 0.00%
Cleveland Community College (DNS) $0 $0 $0 $0 $0 $0 $0 $0 $0 0.00%
Coastal Carolina Community College (DNS) $0 $0 $0 $0 $0 $0 $0 $0 $0 0.00%
College of The Albemarle (DNS) $0 $0 $0 $0 $0 $0 $0 $0 $0 0.00%
Craven Community College $0 $0 $0 $0 $0 $0 $0 $0 $0 0.00%
Davidson County Community College (DNS) $0 $0 $0 $0 $0 $0 $0 $0 $0 0.00%
Durham Technical Community College (DNS) $0 $0 $0 $0 $0 $0 $0 $0 $0 0.00%
Edgecombe Community College (DNS) $0 $0 $0 $0 $0 $0 $0 $0 $0 0.00%
Fayetteville Technical Community College $0 $0 $0 $0 $0 $0 $0 $0 $0 0.00%
Forsyth Technical Community College $346,778 $0 $0 $0 $0 $1,685 $0 $0 $1,685 0.49%
Gaston College (DNS) $0 $0 $0 $0 $0 $0 $0 $0 $0 0.00%
Guilford Technical Community College $15,578,752 $149,520 $186,513 $0 $0 $1,475,331 $4,042 $0 $1,815,406 11.65%
Halifax Community College (DNS) $0 $0 $0 $0 $0 $0 $0 $0 $0 0.00%
Haywood Community College (DNS) $0 $0 $0 $0 $0 $0 $0 $0 $0 0.00%
Isothermal Community College (DNS) $0 $0 $0 $0 $0 $0 $0 $0 $0 0.00%
James Sprunt Community College $0 $0 $0 $0 $0 $0 $0 $0 $0 0.00%
Johnston Community College (DNS) $0 $0 $0 $0 $0 $0 $0 $0 $0 0.00%
Lenoir Community College $352,536 $0 $0 $0 $0 $0 $0 $0 $0 0.00%
Martin Community College $0 $0 $0 $0 $0 $0 $0 $0 $0 0.00%
Mayland Community College (DNS) $0 $0 $0 $0 $0 $0 $0 $0 $0 0.00%
McDowell Technical Community College (DNS) $0 $0 $0 $0 $0 $0 $0 $0 $0 0.00%
Mitchell Community College $457,310 $0 $0 $0 $0 $417,389 $0 $0 $417,389 91.27%
Montgomery Community College (DNS) $0 $0 $0 $0 $0 $0 $0 $0 $0 0.00%
Nash Community College (DNS) $0 $0 $0 $0 $0 $0 $0 $0 $0 0.00%
North Carolina Center for Appplied Textile
Technology/gaston (DNS) $0 $0 $0 $0 $0 $0 $0 $0 $0 0.00%
Pamlico Community College $0 $0 $0 $0 $0 $0 $0 $0 $0 0.00%
Piedmont Community College (DNS) $0 $0 $0 $0 $0 $0 $0 $0 $0 0.00%
Pitt Community College $0 $0 $0 $0 $0 $0 $0 $0 $0 0.00%
Randolph Community College $175,614 $0 $0 $0 $0 $0 $0 $0 $0 0.00%
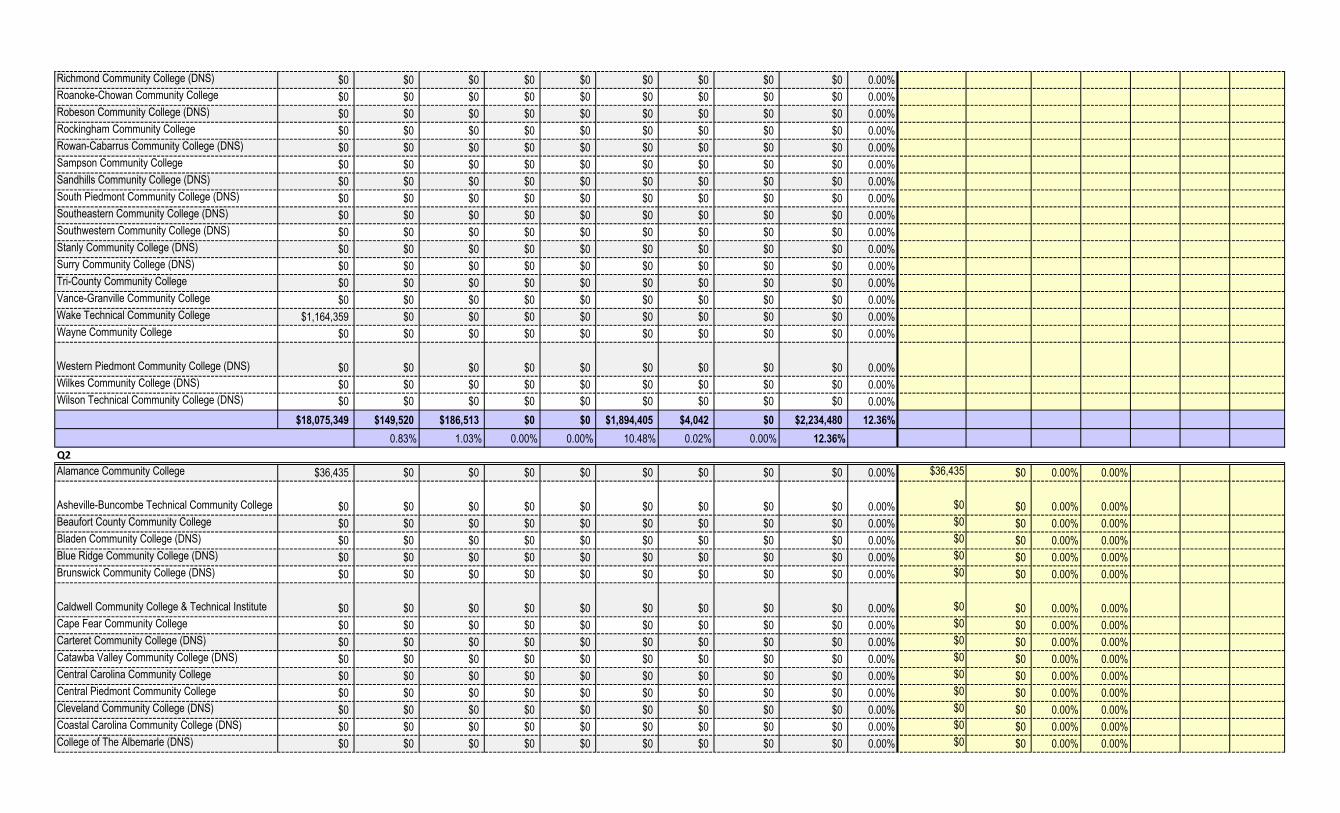
Richmond Community College (DNS) $0 $0 $0 $0 $0 $0 $0 $0 $0 0.00%
Roanoke-Chowan Community College $0 $0 $0 $0 $0 $0 $0 $0 $0 0.00%
Robeson Community College (DNS) $0 $0 $0 $0 $0 $0 $0 $0 $0 0.00%
Rockingham Community College $0 $0 $0 $0 $0 $0 $0 $0 $0 0.00%
Rowan-Cabarrus Community College (DNS) $0 $0 $0 $0 $0 $0 $0 $0 $0 0.00%
Sampson Community College $0 $0 $0 $0 $0 $0 $0 $0 $0 0.00%
Sandhills Community College (DNS) $0 $0 $0 $0 $0 $0 $0 $0 $0 0.00%
South Piedmont Community College (DNS) $0 $0 $0 $0 $0 $0 $0 $0 $0 0.00%
Southeastern Community College (DNS) $0 $0 $0 $0 $0 $0 $0 $0 $0 0.00%
Southwestern Community College (DNS) $0 $0 $0 $0 $0 $0 $0 $0 $0 0.00%
Stanly Community College (DNS) $0 $0 $0 $0 $0 $0 $0 $0 $0 0.00%
Surry Community College (DNS) $0 $0 $0 $0 $0 $0 $0 $0 $0 0.00%
Tri-County Community College $0 $0 $0 $0 $0 $0 $0 $0 $0 0.00%
Vance-Granville Community College $0 $0 $0 $0 $0 $0 $0 $0 $0 0.00%
Wake Technical Community College $1,164,359 $0 $0 $0 $0 $0 $0 $0 $0 0.00%
Wayne Community College $0 $0 $0 $0 $0 $0 $0 $0 $0 0.00%
Western Piedmont Community College (DNS) $0 $0 $0 $0 $0 $0 $0 $0 $0 0.00%
Wilkes Community College (DNS) $0 $0 $0 $0 $0 $0 $0 $0 $0 0.00%
Wilson Technical Community College (DNS) $0 $0 $0 $0 $0 $0 $0 $0 $0 0.00%
$18,075,349 $149,520 $186,513 $0 $0 $1,894,405 $4,042 $0 $2,234,480 12.36%
0.83% 1.03% 0.00% 0.00% 10.48% 0.02% 0.00% 12.36%
Q2
Alamance Community College $36,435 $0 $0 $0 $0 $0 $0 $0 $0 0.00% $36,435 $0 0.00% 0.00%
Asheville-Buncombe Technical Community College $0 $0 $0 $0 $0 $0 $0 $0 $0 0.00% $0 $0 0.00% 0.00%
Beaufort County Community College $0 $0 $0 $0 $0 $0 $0 $0 $0 0.00% $0 $0 0.00% 0.00%
Bladen Community College (DNS) $0 $0 $0 $0 $0 $0 $0 $0 $0 0.00% $0 $0 0.00% 0.00%
Blue Ridge Community College (DNS) $0 $0 $0 $0 $0 $0 $0 $0 $0 0.00% $0 $0 0.00% 0.00%
Brunswick Community College (DNS) $0 $0 $0 $0 $0 $0 $0 $0 $0 0.00% $0 $0 0.00% 0.00%
Caldwell Community College & Technical Institute $0 $0 $0 $0 $0 $0 $0 $0 $0 0.00% $0 $0 0.00% 0.00%
Cape Fear Community College $0 $0 $0 $0 $0 $0 $0 $0 $0 0.00% $0 $0 0.00% 0.00%
Carteret Community College (DNS) $0 $0 $0 $0 $0 $0 $0 $0 $0 0.00% $0 $0 0.00% 0.00%
Catawba Valley Community College (DNS) $0 $0 $0 $0 $0 $0 $0 $0 $0 0.00% $0 $0 0.00% 0.00%
Central Carolina Community College $0 $0 $0 $0 $0 $0 $0 $0 $0 0.00% $0 $0 0.00% 0.00%
Central Piedmont Community College $0 $0 $0 $0 $0 $0 $0 $0 $0 0.00% $0 $0 0.00% 0.00%
Cleveland Community College (DNS) $0 $0 $0 $0 $0 $0 $0 $0 $0 0.00% $0 $0 0.00% 0.00%
Coastal Carolina Community College (DNS) $0 $0 $0 $0 $0 $0 $0 $0 $0 0.00% $0 $0 0.00% 0.00%
College of The Albemarle (DNS) $0 $0 $0 $0 $0 $0 $0 $0 $0 0.00% $0 $0 0.00% 0.00%
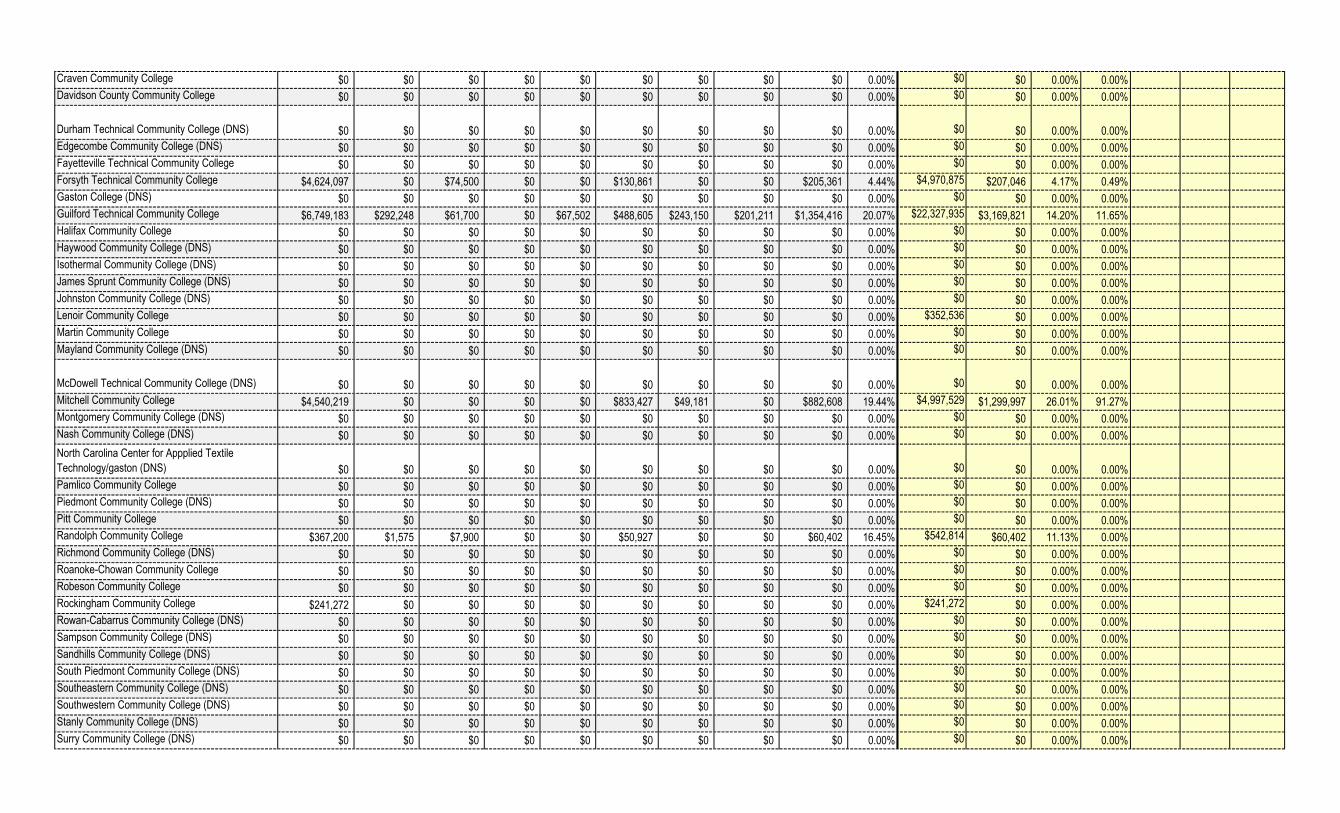
Craven Community College $0 $0 $0 $0 $0 $0 $0 $0 $0 0.00% $0 $0 0.00% 0.00%
Davidson County Community College $0 $0 $0 $0 $0 $0 $0 $0 $0 0.00% $0 $0 0.00% 0.00%
Durham Technical Community College (DNS) $0 $0 $0 $0 $0 $0 $0 $0 $0 0.00% $0 $0 0.00% 0.00%
Edgecombe Community College (DNS) $0 $0 $0 $0 $0 $0 $0 $0 $0 0.00% $0 $0 0.00% 0.00%
Fayetteville Technical Community College $0 $0 $0 $0 $0 $0 $0 $0 $0 0.00% $0 $0 0.00% 0.00%
Forsyth Technical Community College $4,624,097 $0 $74,500 $0 $0 $130,861 $0 $0 $205,361 4.44% $4,970,875 $207,046 4.17% 0.49%
Gaston College (DNS) $0 $0 $0 $0 $0 $0 $0 $0 $0 0.00% $0 $0 0.00% 0.00%
Guilford Technical Community College $6,749,183 $292,248 $61,700 $0 $67,502 $488,605 $243,150 $201,211 $1,354,416 20.07% $22,327,935 $3,169,821 14.20% 11.65%
Halifax Community College $0 $0 $0 $0 $0 $0 $0 $0 $0 0.00% $0 $0 0.00% 0.00%
Haywood Community College (DNS) $0 $0 $0 $0 $0 $0 $0 $0 $0 0.00% $0 $0 0.00% 0.00%
Isothermal Community College (DNS) $0 $0 $0 $0 $0 $0 $0 $0 $0 0.00% $0 $0 0.00% 0.00%
James Sprunt Community College (DNS) $0 $0 $0 $0 $0 $0 $0 $0 $0 0.00% $0 $0 0.00% 0.00%
Johnston Community College (DNS) $0 $0 $0 $0 $0 $0 $0 $0 $0 0.00% $0 $0 0.00% 0.00%
Lenoir Community College $0 $0 $0 $0 $0 $0 $0 $0 $0 0.00% $352,536 $0 0.00% 0.00%
Martin Community College $0 $0 $0 $0 $0 $0 $0 $0 $0 0.00% $0 $0 0.00% 0.00%
Mayland Community College (DNS) $0 $0 $0 $0 $0 $0 $0 $0 $0 0.00% $0 $0 0.00% 0.00%
McDowell Technical Community College (DNS) $0 $0 $0 $0 $0 $0 $0 $0 $0 0.00% $0 $0 0.00% 0.00%
Mitchell Community College $4,540,219 $0 $0 $0 $0 $833,427 $49,181 $0 $882,608 19.44% $4,997,529 $1,299,997 26.01% 91.27%
Montgomery Community College (DNS) $0 $0 $0 $0 $0 $0 $0 $0 $0 0.00% $0 $0 0.00% 0.00%
Nash Community College (DNS) $0 $0 $0 $0 $0 $0 $0 $0 $0 0.00% $0 $0 0.00% 0.00%
North Carolina Center for Appplied Textile
Technology/gaston (DNS) $0 $0 $0 $0 $0 $0 $0 $0 $0 0.00% $0 $0 0.00% 0.00%
Pamlico Community College $0 $0 $0 $0 $0 $0 $0 $0 $0 0.00% $0 $0 0.00% 0.00%
Piedmont Community College (DNS) $0 $0 $0 $0 $0 $0 $0 $0 $0 0.00% $0 $0 0.00% 0.00%
Pitt Community College $0 $0 $0 $0 $0 $0 $0 $0 $0 0.00% $0 $0 0.00% 0.00%
Randolph Community College $367,200 $1,575 $7,900 $0 $0 $50,927 $0 $0 $60,402 16.45% $542,814 $60,402 11.13% 0.00%
Richmond Community College (DNS) $0 $0 $0 $0 $0 $0 $0 $0 $0 0.00% $0 $0 0.00% 0.00%
Roanoke-Chowan Community College $0 $0 $0 $0 $0 $0 $0 $0 $0 0.00% $0 $0 0.00% 0.00%
Robeson Community College $0 $0 $0 $0 $0 $0 $0 $0 $0 0.00% $0 $0 0.00% 0.00%
Rockingham Community College $241,272 $0 $0 $0 $0 $0 $0 $0 $0 0.00% $241,272 $0 0.00% 0.00%
Rowan-Cabarrus Community College (DNS) $0 $0 $0 $0 $0 $0 $0 $0 $0 0.00% $0 $0 0.00% 0.00%
Sampson Community College (DNS) $0 $0 $0 $0 $0 $0 $0 $0 $0 0.00% $0 $0 0.00% 0.00%
Sandhills Community College (DNS) $0 $0 $0 $0 $0 $0 $0 $0 $0 0.00% $0 $0 0.00% 0.00%
South Piedmont Community College (DNS) $0 $0 $0 $0 $0 $0 $0 $0 $0 0.00% $0 $0 0.00% 0.00%
Southeastern Community College (DNS) $0 $0 $0 $0 $0 $0 $0 $0 $0 0.00% $0 $0 0.00% 0.00%
Southwestern Community College (DNS) $0 $0 $0 $0 $0 $0 $0 $0 $0 0.00% $0 $0 0.00% 0.00%
Stanly Community College (DNS) $0 $0 $0 $0 $0 $0 $0 $0 $0 0.00% $0 $0 0.00% 0.00%
Surry Community College (DNS) $0 $0 $0 $0 $0 $0 $0 $0 $0 0.00% $0 $0 0.00% 0.00%
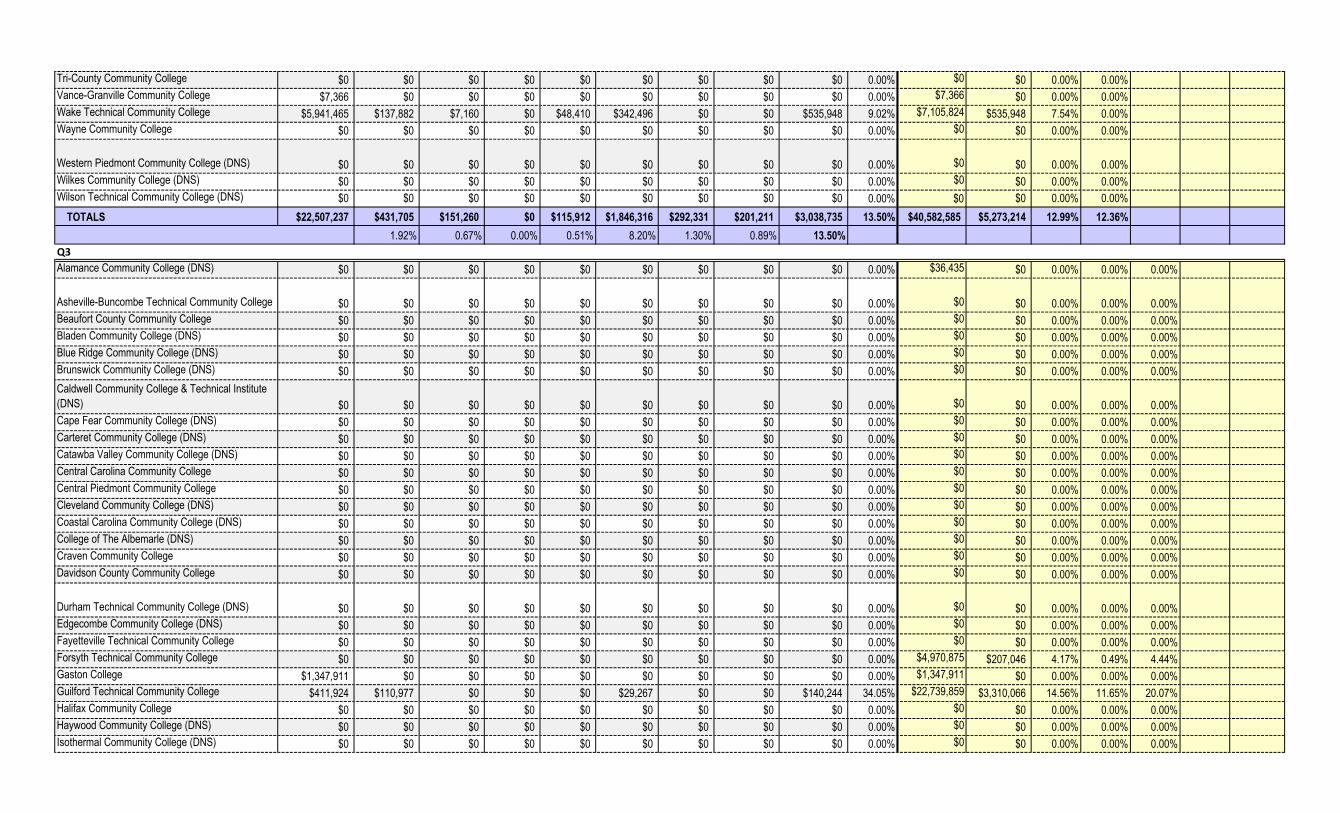
Tri-County Community College $0 $0 $0 $0 $0 $0 $0 $0 $0 0.00% $0 $0 0.00% 0.00%
Vance-Granville Community College $7,366 $0 $0 $0 $0 $0 $0 $0 $0 0.00% $7,366 $0 0.00% 0.00%
Wake Technical Community College $5,941,465 $137,882 $7,160 $0 $48,410 $342,496 $0 $0 $535,948 9.02% $7,105,824 $535,948 7.54% 0.00%
Wayne Community College $0 $0 $0 $0 $0 $0 $0 $0 $0 0.00% $0 $0 0.00% 0.00%
Western Piedmont Community College (DNS) $0 $0 $0 $0 $0 $0 $0 $0 $0 0.00% $0 $0 0.00% 0.00%
Wilkes Community College (DNS) $0 $0 $0 $0 $0 $0 $0 $0 $0 0.00% $0 $0 0.00% 0.00%
Wilson Technical Community College (DNS) $0 $0 $0 $0 $0 $0 $0 $0 $0 0.00% $0 $0 0.00% 0.00%
TOTALS $22,507,237 $431,705 $151,260 $0 $115,912 $1,846,316 $292,331 $201,211 $3,038,735 13.50% $40,582,585 $5,273,214 12.99% 12.36%
1.92% 0.67% 0.00% 0.51% 8.20% 1.30% 0.89% 13.50%
Q3
Alamance Community College (DNS) $0 $0 $0 $0 $0 $0 $0 $0 $0 0.00% $36,435 $0 0.00% 0.00% 0.00%
Asheville-Buncombe Technical Community College $0 $0 $0 $0 $0 $0 $0 $0 $0 0.00% $0 $0 0.00% 0.00% 0.00%
Beaufort County Community College $0 $0 $0 $0 $0 $0 $0 $0 $0 0.00% $0 $0 0.00% 0.00% 0.00%
Bladen Community College (DNS) $0 $0 $0 $0 $0 $0 $0 $0 $0 0.00% $0 $0 0.00% 0.00% 0.00%
Blue Ridge Community College (DNS) $0 $0 $0 $0 $0 $0 $0 $0 $0 0.00% $0 $0 0.00% 0.00% 0.00%
Brunswick Community College (DNS) $0 $0 $0 $0 $0 $0 $0 $0 $0 0.00% $0 $0 0.00% 0.00% 0.00%
Caldwell Community College & Technical Institute
(DNS) $0 $0 $0 $0 $0 $0 $0 $0 $0 0.00% $0 $0 0.00% 0.00% 0.00%
Cape Fear Community College (DNS) $0 $0 $0 $0 $0 $0 $0 $0 $0 0.00% $0 $0 0.00% 0.00% 0.00%
Carteret Community College (DNS) $0 $0 $0 $0 $0 $0 $0 $0 $0 0.00% $0 $0 0.00% 0.00% 0.00%
Catawba Valley Community College (DNS) $0 $0 $0 $0 $0 $0 $0 $0 $0 0.00% $0 $0 0.00% 0.00% 0.00%
Central Carolina Community College $0 $0 $0 $0 $0 $0 $0 $0 $0 0.00% $0 $0 0.00% 0.00% 0.00%
Central Piedmont Community College $0 $0 $0 $0 $0 $0 $0 $0 $0 0.00% $0 $0 0.00% 0.00% 0.00%
Cleveland Community College (DNS) $0 $0 $0 $0 $0 $0 $0 $0 $0 0.00% $0 $0 0.00% 0.00% 0.00%
Coastal Carolina Community College (DNS) $0 $0 $0 $0 $0 $0 $0 $0 $0 0.00% $0 $0 0.00% 0.00% 0.00%
College of The Albemarle (DNS) $0 $0 $0 $0 $0 $0 $0 $0 $0 0.00% $0 $0 0.00% 0.00% 0.00%
Craven Community College $0 $0 $0 $0 $0 $0 $0 $0 $0 0.00% $0 $0 0.00% 0.00% 0.00%
Davidson County Community College $0 $0 $0 $0 $0 $0 $0 $0 $0 0.00% $0 $0 0.00% 0.00% 0.00%
Durham Technical Community College (DNS) $0 $0 $0 $0 $0 $0 $0 $0 $0 0.00% $0 $0 0.00% 0.00% 0.00%
Edgecombe Community College (DNS) $0 $0 $0 $0 $0 $0 $0 $0 $0 0.00% $0 $0 0.00% 0.00% 0.00%
Fayetteville Technical Community College $0 $0 $0 $0 $0 $0 $0 $0 $0 0.00% $0 $0 0.00% 0.00% 0.00%
Forsyth Technical Community College $0 $0 $0 $0 $0 $0 $0 $0 $0 0.00% $4,970,875 $207,046 4.17% 0.49% 4.44%
Gaston College $1,347,911 $0 $0 $0 $0 $0 $0 $0 $0 0.00% $1,347,911 $0 0.00% 0.00% 0.00%
Guilford Technical Community College $411,924 $110,977 $0 $0 $0 $29,267 $0 $0 $140,244 34.05% $22,739,859 $3,310,066 14.56% 11.65% 20.07%
Halifax Community College $0 $0 $0 $0 $0 $0 $0 $0 $0 0.00% $0 $0 0.00% 0.00% 0.00%
Haywood Community College (DNS) $0 $0 $0 $0 $0 $0 $0 $0 $0 0.00% $0 $0 0.00% 0.00% 0.00%
Isothermal Community College (DNS) $0 $0 $0 $0 $0 $0 $0 $0 $0 0.00% $0 $0 0.00% 0.00% 0.00%
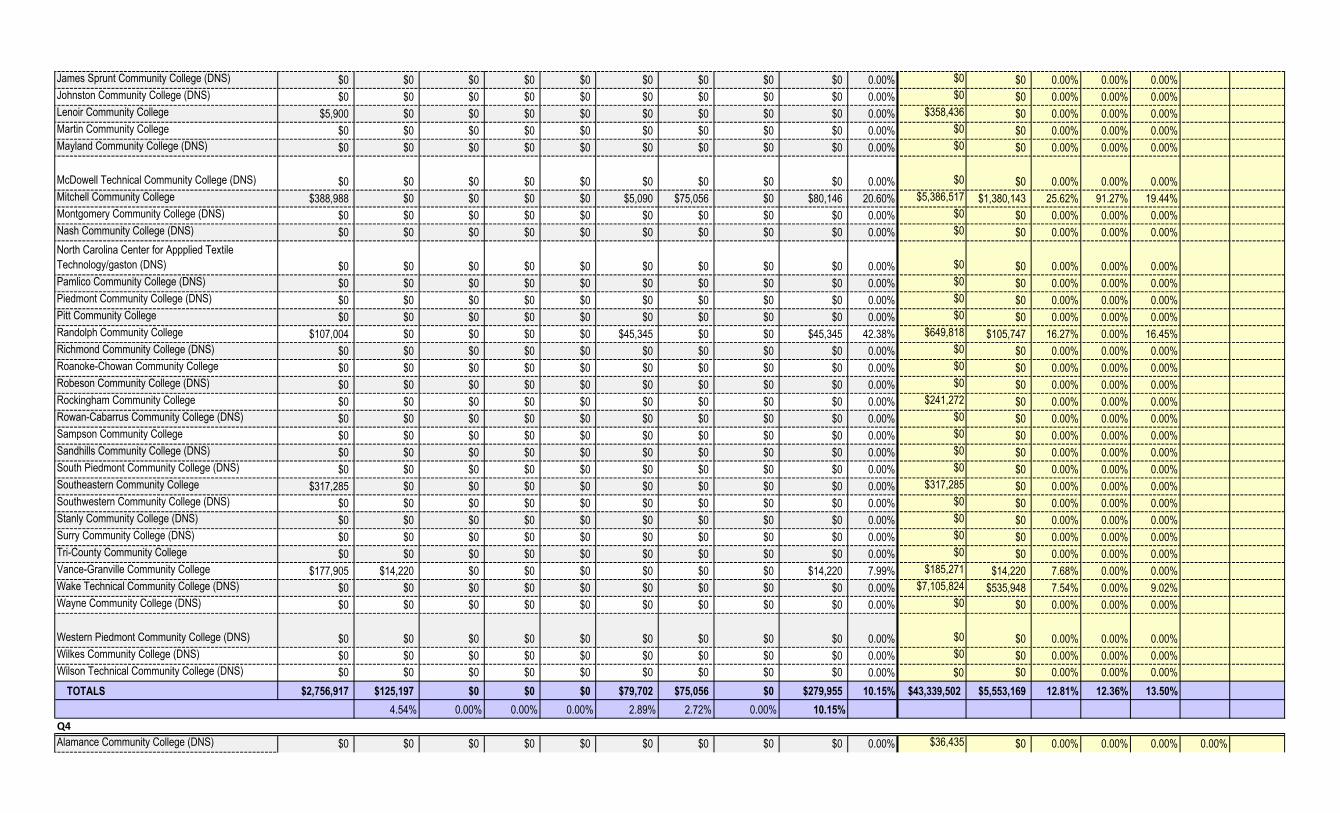
James Sprunt Community College (DNS) $0 $0 $0 $0 $0 $0 $0 $0 $0 0.00% $0 $0 0.00% 0.00% 0.00%
Johnston Community College (DNS) $0 $0 $0 $0 $0 $0 $0 $0 $0 0.00% $0 $0 0.00% 0.00% 0.00%
Lenoir Community College $5,900 $0 $0 $0 $0 $0 $0 $0 $0 0.00% $358,436 $0 0.00% 0.00% 0.00%
Martin Community College $0 $0 $0 $0 $0 $0 $0 $0 $0 0.00% $0 $0 0.00% 0.00% 0.00%
Mayland Community College (DNS) $0 $0 $0 $0 $0 $0 $0 $0 $0 0.00% $0 $0 0.00% 0.00% 0.00%
McDowell Technical Community College (DNS) $0 $0 $0 $0 $0 $0 $0 $0 $0 0.00% $0 $0 0.00% 0.00% 0.00%
Mitchell Community College $388,988 $0 $0 $0 $0 $5,090 $75,056 $0 $80,146 20.60% $5,386,517 $1,380,143 25.62% 91.27% 19.44%
Montgomery Community College (DNS) $0 $0 $0 $0 $0 $0 $0 $0 $0 0.00% $0 $0 0.00% 0.00% 0.00%
Nash Community College (DNS) $0 $0 $0 $0 $0 $0 $0 $0 $0 0.00% $0 $0 0.00% 0.00% 0.00%
North Carolina Center for Appplied Textile
Technology/gaston (DNS) $0 $0 $0 $0 $0 $0 $0 $0 $0 0.00% $0 $0 0.00% 0.00% 0.00%
Pamlico Community College (DNS) $0 $0 $0 $0 $0 $0 $0 $0 $0 0.00% $0 $0 0.00% 0.00% 0.00%
Piedmont Community College (DNS) $0 $0 $0 $0 $0 $0 $0 $0 $0 0.00% $0 $0 0.00% 0.00% 0.00%
Pitt Community College $0 $0 $0 $0 $0 $0 $0 $0 $0 0.00% $0 $0 0.00% 0.00% 0.00%
Randolph Community College $107,004 $0 $0 $0 $0 $45,345 $0 $0 $45,345 42.38% $649,818 $105,747 16.27% 0.00% 16.45%
Richmond Community College (DNS) $0 $0 $0 $0 $0 $0 $0 $0 $0 0.00% $0 $0 0.00% 0.00% 0.00%
Roanoke-Chowan Community College $0 $0 $0 $0 $0 $0 $0 $0 $0 0.00% $0 $0 0.00% 0.00% 0.00%
Robeson Community College (DNS) $0 $0 $0 $0 $0 $0 $0 $0 $0 0.00% $0 $0 0.00% 0.00% 0.00%
Rockingham Community College $0 $0 $0 $0 $0 $0 $0 $0 $0 0.00% $241,272 $0 0.00% 0.00% 0.00%
Rowan-Cabarrus Community College (DNS) $0 $0 $0 $0 $0 $0 $0 $0 $0 0.00% $0 $0 0.00% 0.00% 0.00%
Sampson Community College $0 $0 $0 $0 $0 $0 $0 $0 $0 0.00% $0 $0 0.00% 0.00% 0.00%
Sandhills Community College (DNS) $0 $0 $0 $0 $0 $0 $0 $0 $0 0.00% $0 $0 0.00% 0.00% 0.00%
South Piedmont Community College (DNS) $0 $0 $0 $0 $0 $0 $0 $0 $0 0.00% $0 $0 0.00% 0.00% 0.00%
Southeastern Community College $317,285 $0 $0 $0 $0 $0 $0 $0 $0 0.00% $317,285 $0 0.00% 0.00% 0.00%
Southwestern Community College (DNS) $0 $0 $0 $0 $0 $0 $0 $0 $0 0.00% $0 $0 0.00% 0.00% 0.00%
Stanly Community College (DNS) $0 $0 $0 $0 $0 $0 $0 $0 $0 0.00% $0 $0 0.00% 0.00% 0.00%
Surry Community College (DNS) $0 $0 $0 $0 $0 $0 $0 $0 $0 0.00% $0 $0 0.00% 0.00% 0.00%
Tri-County Community College $0 $0 $0 $0 $0 $0 $0 $0 $0 0.00% $0 $0 0.00% 0.00% 0.00%
Vance-Granville Community College $177,905 $14,220 $0 $0 $0 $0 $0 $0 $14,220 7.99% $185,271 $14,220 7.68% 0.00% 0.00%
Wake Technical Community College (DNS) $0 $0 $0 $0 $0 $0 $0 $0 $0 0.00% $7,105,824 $535,948 7.54% 0.00% 9.02%
Wayne Community College (DNS) $0 $0 $0 $0 $0 $0 $0 $0 $0 0.00% $0 $0 0.00% 0.00% 0.00%
Western Piedmont Community College (DNS) $0 $0 $0 $0 $0 $0 $0 $0 $0 0.00% $0 $0 0.00% 0.00% 0.00%
Wilkes Community College (DNS) $0 $0 $0 $0 $0 $0 $0 $0 $0 0.00% $0 $0 0.00% 0.00% 0.00%
Wilson Technical Community College (DNS) $0 $0 $0 $0 $0 $0 $0 $0 $0 0.00% $0 $0 0.00% 0.00% 0.00%
TOTALS $2,756,917 $125,197 $0 $0 $0 $79,702 $75,056 $0 $279,955 10.15% $43,339,502 $5,553,169 12.81% 12.36% 13.50%
4.54% 0.00% 0.00% 0.00% 2.89% 2.72% 0.00% 10.15%
Q4
Alamance Community College (DNS) $0 $0 $0 $0 $0 $0 $0 $0 $0 0.00% $36,435 $0 0.00% 0.00% 0.00% 0.00%
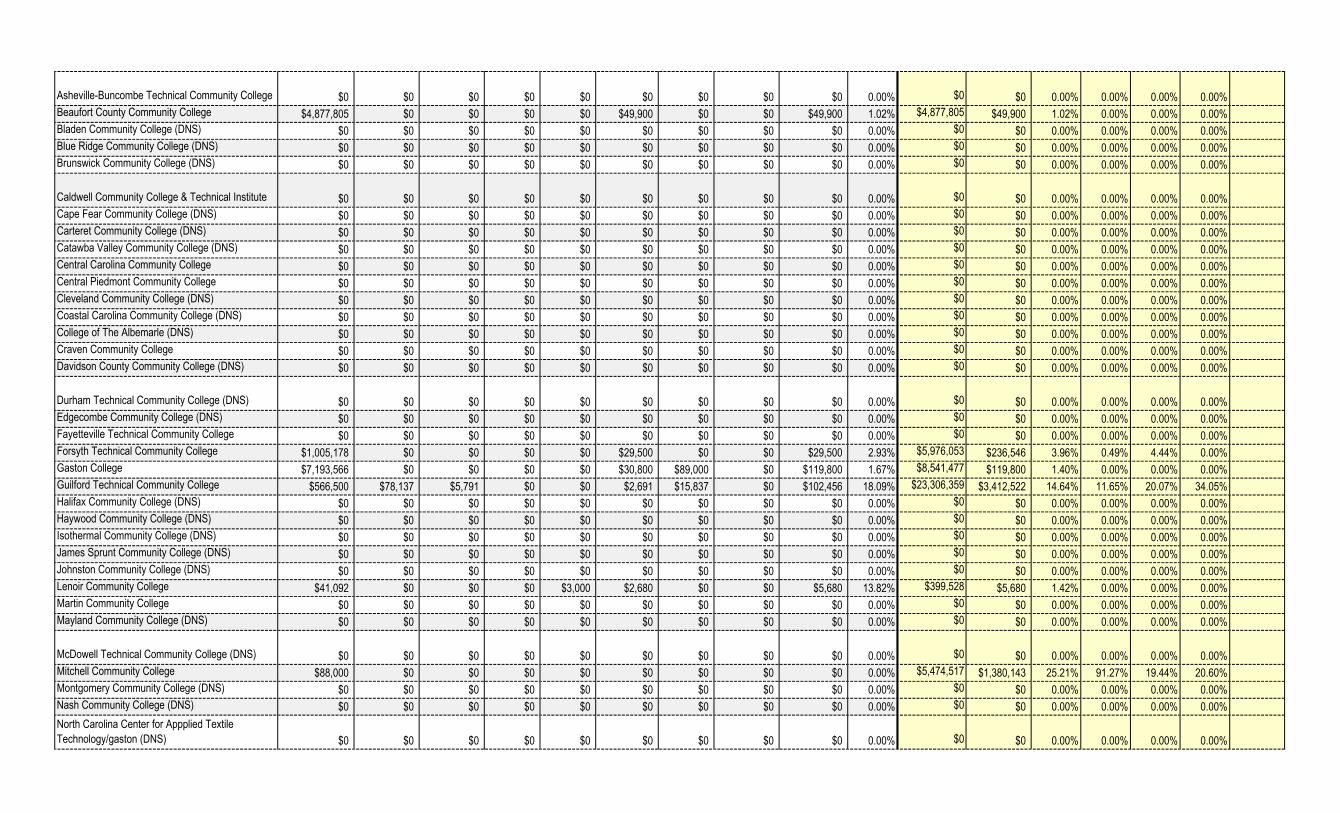
Asheville-Buncombe Technical Community College $0 $0 $0 $0 $0 $0 $0 $0 $0 0.00% $0 $0 0.00% 0.00% 0.00% 0.00%
Beaufort County Community College $4,877,805 $0 $0 $0 $0 $49,900 $0 $0 $49,900 1.02% $4,877,805 $49,900 1.02% 0.00% 0.00% 0.00%
Bladen Community College (DNS) $0 $0 $0 $0 $0 $0 $0 $0 $0 0.00% $0 $0 0.00% 0.00% 0.00% 0.00%
Blue Ridge Community College (DNS) $0 $0 $0 $0 $0 $0 $0 $0 $0 0.00% $0 $0 0.00% 0.00% 0.00% 0.00%
Brunswick Community College (DNS) $0 $0 $0 $0 $0 $0 $0 $0 $0 0.00% $0 $0 0.00% 0.00% 0.00% 0.00%
Caldwell Community College & Technical Institute $0 $0 $0 $0 $0 $0 $0 $0 $0 0.00% $0 $0 0.00% 0.00% 0.00% 0.00%
Cape Fear Community College (DNS) $0 $0 $0 $0 $0 $0 $0 $0 $0 0.00% $0 $0 0.00% 0.00% 0.00% 0.00%
Carteret Community College (DNS) $0 $0 $0 $0 $0 $0 $0 $0 $0 0.00% $0 $0 0.00% 0.00% 0.00% 0.00%
Catawba Valley Community College (DNS) $0 $0 $0 $0 $0 $0 $0 $0 $0 0.00% $0 $0 0.00% 0.00% 0.00% 0.00%
Central Carolina Community College $0 $0 $0 $0 $0 $0 $0 $0 $0 0.00% $0 $0 0.00% 0.00% 0.00% 0.00%
Central Piedmont Community College $0 $0 $0 $0 $0 $0 $0 $0 $0 0.00% $0 $0 0.00% 0.00% 0.00% 0.00%
Cleveland Community College (DNS) $0 $0 $0 $0 $0 $0 $0 $0 $0 0.00% $0 $0 0.00% 0.00% 0.00% 0.00%
Coastal Carolina Community College (DNS) $0 $0 $0 $0 $0 $0 $0 $0 $0 0.00% $0 $0 0.00% 0.00% 0.00% 0.00%
College of The Albemarle (DNS) $0 $0 $0 $0 $0 $0 $0 $0 $0 0.00% $0 $0 0.00% 0.00% 0.00% 0.00%
Craven Community College $0 $0 $0 $0 $0 $0 $0 $0 $0 0.00% $0 $0 0.00% 0.00% 0.00% 0.00%
Davidson County Community College (DNS) $0 $0 $0 $0 $0 $0 $0 $0 $0 0.00% $0 $0 0.00% 0.00% 0.00% 0.00%
Durham Technical Community College (DNS) $0 $0 $0 $0 $0 $0 $0 $0 $0 0.00% $0 $0 0.00% 0.00% 0.00% 0.00%
Edgecombe Community College (DNS) $0 $0 $0 $0 $0 $0 $0 $0 $0 0.00% $0 $0 0.00% 0.00% 0.00% 0.00%
Fayetteville Technical Community College $0 $0 $0 $0 $0 $0 $0 $0 $0 0.00% $0 $0 0.00% 0.00% 0.00% 0.00%
Forsyth Technical Community College $1,005,178 $0 $0 $0 $0 $29,500 $0 $0 $29,500 2.93% $5,976,053 $236,546 3.96% 0.49% 4.44% 0.00%
Gaston College $7,193,566 $0 $0 $0 $0 $30,800 $89,000 $0 $119,800 1.67% $8,541,477 $119,800 1.40% 0.00% 0.00% 0.00%
Guilford Technical Community College $566,500 $78,137 $5,791 $0 $0 $2,691 $15,837 $0 $102,456 18.09% $23,306,359 $3,412,522 14.64% 11.65% 20.07% 34.05%
Halifax Community College (DNS) $0 $0 $0 $0 $0 $0 $0 $0 $0 0.00% $0 $0 0.00% 0.00% 0.00% 0.00%
Haywood Community College (DNS) $0 $0 $0 $0 $0 $0 $0 $0 $0 0.00% $0 $0 0.00% 0.00% 0.00% 0.00%
Isothermal Community College (DNS) $0 $0 $0 $0 $0 $0 $0 $0 $0 0.00% $0 $0 0.00% 0.00% 0.00% 0.00%
James Sprunt Community College (DNS) $0 $0 $0 $0 $0 $0 $0 $0 $0 0.00% $0 $0 0.00% 0.00% 0.00% 0.00%
Johnston Community College (DNS) $0 $0 $0 $0 $0 $0 $0 $0 $0 0.00% $0 $0 0.00% 0.00% 0.00% 0.00%
Lenoir Community College $41,092 $0 $0 $0 $3,000 $2,680 $0 $0 $5,680 13.82% $399,528 $5,680 1.42% 0.00% 0.00% 0.00%
Martin Community College $0 $0 $0 $0 $0 $0 $0 $0 $0 0.00% $0 $0 0.00% 0.00% 0.00% 0.00%
Mayland Community College (DNS) $0 $0 $0 $0 $0 $0 $0 $0 $0 0.00% $0 $0 0.00% 0.00% 0.00% 0.00%
McDowell Technical Community College (DNS) $0 $0 $0 $0 $0 $0 $0 $0 $0 0.00% $0 $0 0.00% 0.00% 0.00% 0.00%
Mitchell Community College $88,000 $0 $0 $0 $0 $0 $0 $0 $0 0.00% $5,474,517 $1,380,143 25.21% 91.27% 19.44% 20.60%
Montgomery Community College (DNS) $0 $0 $0 $0 $0 $0 $0 $0 $0 0.00% $0 $0 0.00% 0.00% 0.00% 0.00%
Nash Community College (DNS) $0 $0 $0 $0 $0 $0 $0 $0 $0 0.00% $0 $0 0.00% 0.00% 0.00% 0.00%
North Carolina Center for Appplied Textile
Technology/gaston (DNS) $0 $0 $0 $0 $0 $0 $0 $0 $0 0.00% $0 $0 0.00% 0.00% 0.00% 0.00%

Pamlico Community College $0 $0 $0 $0 $0 $0 $0 $0 $0 0.00% $0 $0 0.00% 0.00% 0.00% 0.00%
Piedmont Community College (DNS) $0 $0 $0 $0 $0 $0 $0 $0 $0 0.00% $0 $0 0.00% 0.00% 0.00% 0.00%
Pitt Community College $0 $0 $0 $0 $0 $0 $0 $0 $0 0.00% $0 $0 0.00% 0.00% 0.00% 0.00%
Randolph Community College $0 $0 $0 $0 $0 $0 $0 $0 $0 0.00% $649,818 $105,747 16.27% 0.00% 16.45% 42.38%
Richmond Community College (DNS) $0 $0 $0 $0 $0 $0 $0 $0 $0 0.00% $0 $0 0.00% 0.00% 0.00% 0.00%
Roanoke-Chowan Community College $0 $0 $0 $0 $0 $0 $0 $0 $0 0.00% $0 $0 0.00% 0.00% 0.00% 0.00%
Robeson Community College $0 $0 $0 $0 $0 $0 $0 $0 $0 0.00% $0 $0 0.00% 0.00% 0.00% 0.00%
Rockingham Community College (DNS) $0 $0 $0 $0 $0 $0 $0 $0 $0 0.00% $241,272 $0 0.00% 0.00% 0.00% 0.00%
Rowan-Cabarrus Community College (DNS) $0 $0 $0 $0 $0 $0 $0 $0 $0 0.00% $0 $0 0.00% 0.00% 0.00% 0.00%
Sampson Community College $0 $0 $0 $0 $0 $0 $0 $0 $0 0.00% $0 $0 0.00% 0.00% 0.00% 0.00%
Sandhills Community College (DNS) $0 $0 $0 $0 $0 $0 $0 $0 $0 0.00% $0 $0 0.00% 0.00% 0.00% 0.00%
South Piedmont Community College (DNS) $0 $0 $0 $0 $0 $0 $0 $0 $0 0.00% $0 $0 0.00% 0.00% 0.00% 0.00%
Southeastern Community College (DNS) $0 $0 $0 $0 $0 $0 $0 $0 $0 0.00% $317,285 $0 0.00% 0.00% 0.00% 0.00%
Southwestern Community College (DNS) $0 $0 $0 $0 $0 $0 $0 $0 $0 0.00% $0 $0 0.00% 0.00% 0.00% 0.00%
Stanly Community College (DNS) $0 $0 $0 $0 $0 $0 $0 $0 $0 0.00% $0 $0 0.00% 0.00% 0.00% 0.00%
Surry Community College (DNS) $0 $0 $0 $0 $0 $0 $0 $0 $0 0.00% $0 $0 0.00% 0.00% 0.00% 0.00%
Tri-County Community College $0 $0 $0 $0 $0 $0 $0 $0 $0 0.00% $0 $0 0.00% 0.00% 0.00% 0.00%
Vance-Granville Community College $23,130 $0 $0 $0 $0 $0 $0 $0 $0 0.00% $208,401 $14,220 6.82% 0.00% 0.00% 7.99%
Wake Technical Community College $212,869 $0 $0 $0 $0 $0 $0 $0 $0 0.00% $7,318,693 $535,948 7.32% 0.00% 9.02% 0.00%
Wayne Community College (DNS) $0 $0 $0 $0 $0 $0 $0 $0 $0 0.00% $0 $0 0.00% 0.00% 0.00% 0.00%
Western Piedmont Community College (DNS) $0 $0 $0 $0 $0 $0 $0 $0 $0 0.00% $0 $0 0.00% 0.00% 0.00% 0.00%
Wilkes Community College (DNS) $0 $0 $0 $0 $0 $0 $0 $0 $0 0.00% $0 $0 0.00% 0.00% 0.00% 0.00%
Wilson Technical Community College (DNS) $0 $0 $0 $0 $0 $0 $0 $0 $0 0.00% $0 $0 0.00% 0.00% 0.00% 0.00%
TOTALS $14,008,141 $78,137 $5,791 $0 $3,000 $115,571 $104,837 $0 $307,336 2.19% $57,347,643 $5,860,505 10.22% 12.36% 13.50% 10.15%
0.56% 0.04% 0.00% 0.02% 0.83% 0.75% 0.00% 2.19%
B Black WF White Female
H Hipanic SE Socially and Economically Disadvantaged
AA Asian-American D Disabled
AI American Indian DNS Did Not Submit report
LEGEND

FY 2011-2012
(7/1/2011-6/30/2012)
COUNCIL OF
GOVERNMENT
To
tal
De
pt.
($)
B (
$)
H (
$)
AA
($
)
AI
($)
WF
($
)
SE
($
)
D (
$)
To
tal
HU
B
($)
To
tal
HU
B
(%)
YT
D T
ota
l ($
)
YT
D H
UB
($
)
YT
D H
UB
(%)
Q1
HU
B (
%)
Q2
HU
B (
%)
Q3
HU
B (
%)
Q4
HU
B (
%)
Land-of-Sky Regional Council $0 $0 $0 $0 $0 $0 $0 $0 $0 0.00% $0 $0 0.00% 0.00% 0.00% 0.00% 0.00%
TOTALS $0 $0 $0 $0 $0 $0 $0 $0 $0 0.00% $0 $0 0.00% 0.00% 0.00% 0.00% 0.00%
% of Total Purchasing 0.00% 0.00% 0.00% 0.00% 0.00% 0.00% 0.00% 0.00%
0.00% 0.00% 0.00% 0.00% 0.00% 0.00% 0.00% 0.00%
Q1
Land-of-Sky Regional Council $0 $0 $0 $0 $0 $0 $0 $0 $0 0.00%
TOTALS $0 $0 $0 $0 $0 $0 $0 $0 $0 0.00%
0.00% 0.00% 0.00% 0.00% 0.00% 0.00% 0.00%
Q2
Land-of-Sky Regional Council $0 $0 $0 $0 $0 $0 $0 $0 $0 0.00% $0 $0 0.00% 0.00%
TOTALS $0 $0 $0 $0 $0 $0 $0 $0 $0 0.00% $0 $0 0.00% 0.00%
0.00% 0.00% 0.00% 0.00% 0.00% 0.00% 0.00% 0.00%
Q3
Land-of-Sky Regional Council $0 $0 $0 $0 $0 $0 $0 $0 $0 0.00% $0 $0 0.00% 0.00% 0.00%
TOTALS $0 $0 $0 $0 $0 $0 $0 $0 $0 0.00% $0 $0 0.00% 0.00% 0.00%
0.00% 0.00% 0.00% 0.00% 0.00% 0.00% 0.00% 0.00%
Q4
Land-of-Sky Regional Council $0 $0 $0 $0 $0 $0 $0 $0 $0 0.00% $0 $0 0.00% 0.00% 0.00% 0.00%
TOTALS $0 $0 $0 $0 $0 $0 $0 $0 $0 0.00% $0 $0 0.00% 0.00% 0.00% 0.00%
0.00% 0.00% 0.00% 0.00% 0.00% 0.00% 0.00% 0.00%
B Black WF White Female
H Hipanic SE Socially and Economically Disadvantaged
AA Asian-American D Disabled
AI American Indian DNS Did Not Submit report
LEGEND
% of Minority Participation
YEAR-TO-DATE SUMMARY
NORTH CAROLINA DEPARTMENT OF ADMINISTRATION
OFFICE FOR HISTORICALLY UNDERUTILIZED BUSINESSES
HUB PARTICIPATION REPORT - CONSTRUCTION (Includes FORMAL
and INFORMAL Projects)
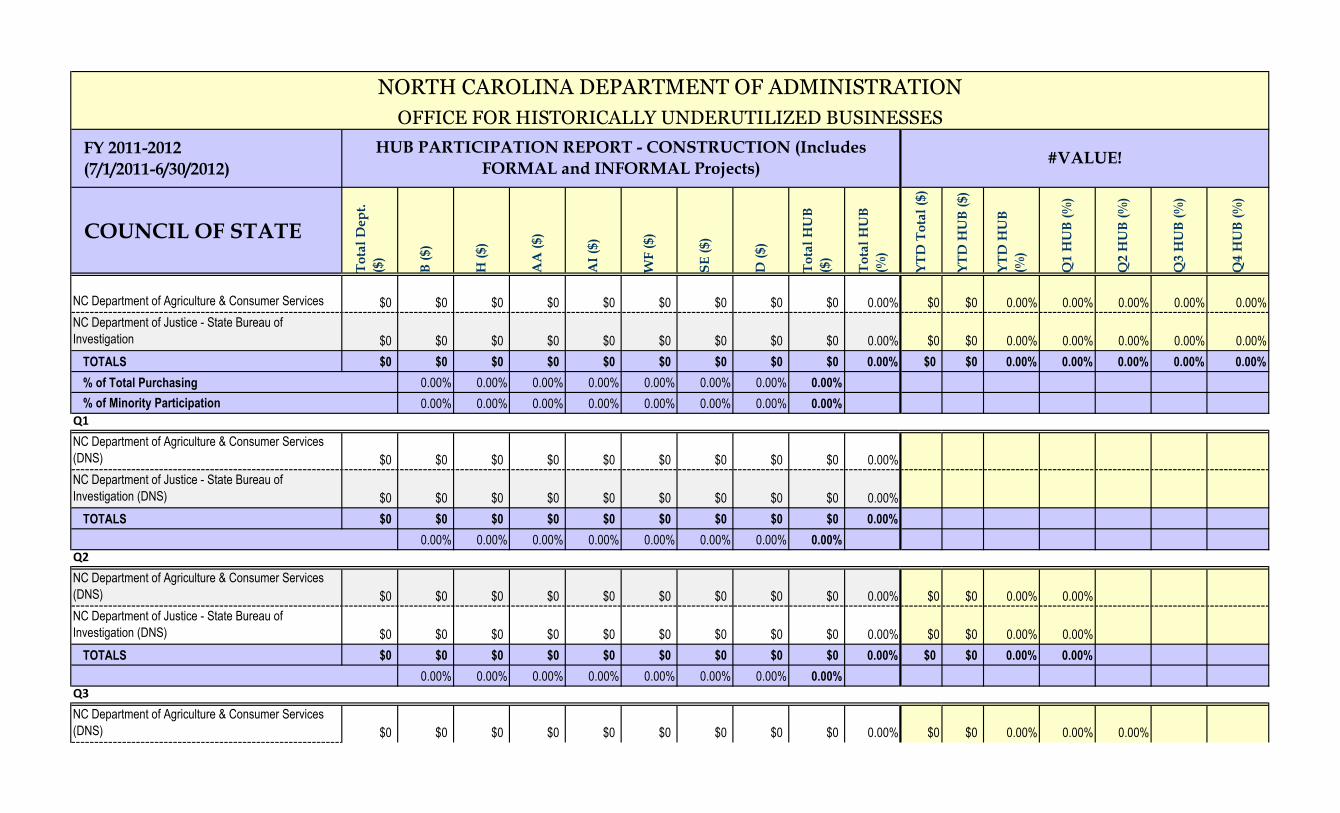
FY 2011-2012
(7/1/2011-6/30/2012)
COUNCIL OF STATE
To
tal
De
pt.
($)
B (
$)
H (
$)
AA
($
)
AI
($)
WF
($
)
SE
($
)
D (
$)
To
tal
HU
B
($)
To
tal
HU
B
(%)
YT
D T
ota
l ($
)
YT
D H
UB
($
)
YT
D H
UB
(%)
Q1
HU
B (
%)
Q2
HU
B (
%)
Q3
HU
B (
%)
Q4
HU
B (
%)
NC Department of Agriculture & Consumer Services $0 $0 $0 $0 $0 $0 $0 $0 $0 0.00% $0 $0 0.00% 0.00% 0.00% 0.00% 0.00%
NC Department of Justice - State Bureau of
Investigation $0 $0 $0 $0 $0 $0 $0 $0 $0 0.00% $0 $0 0.00% 0.00% 0.00% 0.00% 0.00%
TOTALS $0 $0 $0 $0 $0 $0 $0 $0 $0 0.00% $0 $0 0.00% 0.00% 0.00% 0.00% 0.00%
% of Total Purchasing 0.00% 0.00% 0.00% 0.00% 0.00% 0.00% 0.00% 0.00%
0.00% 0.00% 0.00% 0.00% 0.00% 0.00% 0.00% 0.00%
Q1
NC Department of Agriculture & Consumer Services
(DNS) $0 $0 $0 $0 $0 $0 $0 $0 $0 0.00%
NC Department of Justice - State Bureau of
Investigation (DNS) $0 $0 $0 $0 $0 $0 $0 $0 $0 0.00%
TOTALS $0 $0 $0 $0 $0 $0 $0 $0 $0 0.00%
0.00% 0.00% 0.00% 0.00% 0.00% 0.00% 0.00% 0.00%
Q2
NC Department of Agriculture & Consumer Services
(DNS) $0 $0 $0 $0 $0 $0 $0 $0 $0 0.00% $0 $0 0.00% 0.00%
NC Department of Justice - State Bureau of
Investigation (DNS) $0 $0 $0 $0 $0 $0 $0 $0 $0 0.00% $0 $0 0.00% 0.00%
TOTALS $0 $0 $0 $0 $0 $0 $0 $0 $0 0.00% $0 $0 0.00% 0.00%
0.00% 0.00% 0.00% 0.00% 0.00% 0.00% 0.00% 0.00%
Q3
NC Department of Agriculture & Consumer Services
(DNS) $0 $0 $0 $0 $0 $0 $0 $0 $0 0.00% $0 $0 0.00% 0.00% 0.00%
% of Minority Participation
HUB PARTICIPATION REPORT - CONSTRUCTION (Includes
FORMAL and INFORMAL Projects)#VALUE!
NORTH CAROLINA DEPARTMENT OF ADMINISTRATION
OFFICE FOR HISTORICALLY UNDERUTILIZED BUSINESSES

NC Department of Justice - State Bureau of
Investigation (DNS) $0 $0 $0 $0 $0 $0 $0 $0 $0 0.00% $0 $0 0.00% 0.00% 0.00%
TOTALS $0 $0 $0 $0 $0 $0 $0 $0 $0 0.00% $0 $0 0.00% 0.00% 0.00%
0.00% 0.00% 0.00% 0.00% 0.00% 0.00% 0.00% 0.00%
Q4
NC Department of Agriculture & Consumer Services
(DNS) $0 $0 $0 $0 $0 $0 $0 $0 $0 0.00% $0 $0 0.00% 0.00% 0.00% 0.00%
NC Department of Justice - State Bureau of
Investigation (DNS) $0 $0 $0 $0 $0 $0 $0 $0 $0 0.00% $0 $0 0.00% 0.00% 0.00% 0.00%
TOTALS $0 $0 $0 $0 $0 $0 $0 $0 $0 0.00% $0 $0 0.00% 0.00% 0.00% 0.00%
0.00% 0.00% 0.00% 0.00% 0.00% 0.00% 0.00% 0.00%
B Black WF White Female
H Hipanic SE Socially and Economically Disadvantaged
AA Asian-American D Disabled
AI American Indian DNS Did Not Submit report
LEGEND
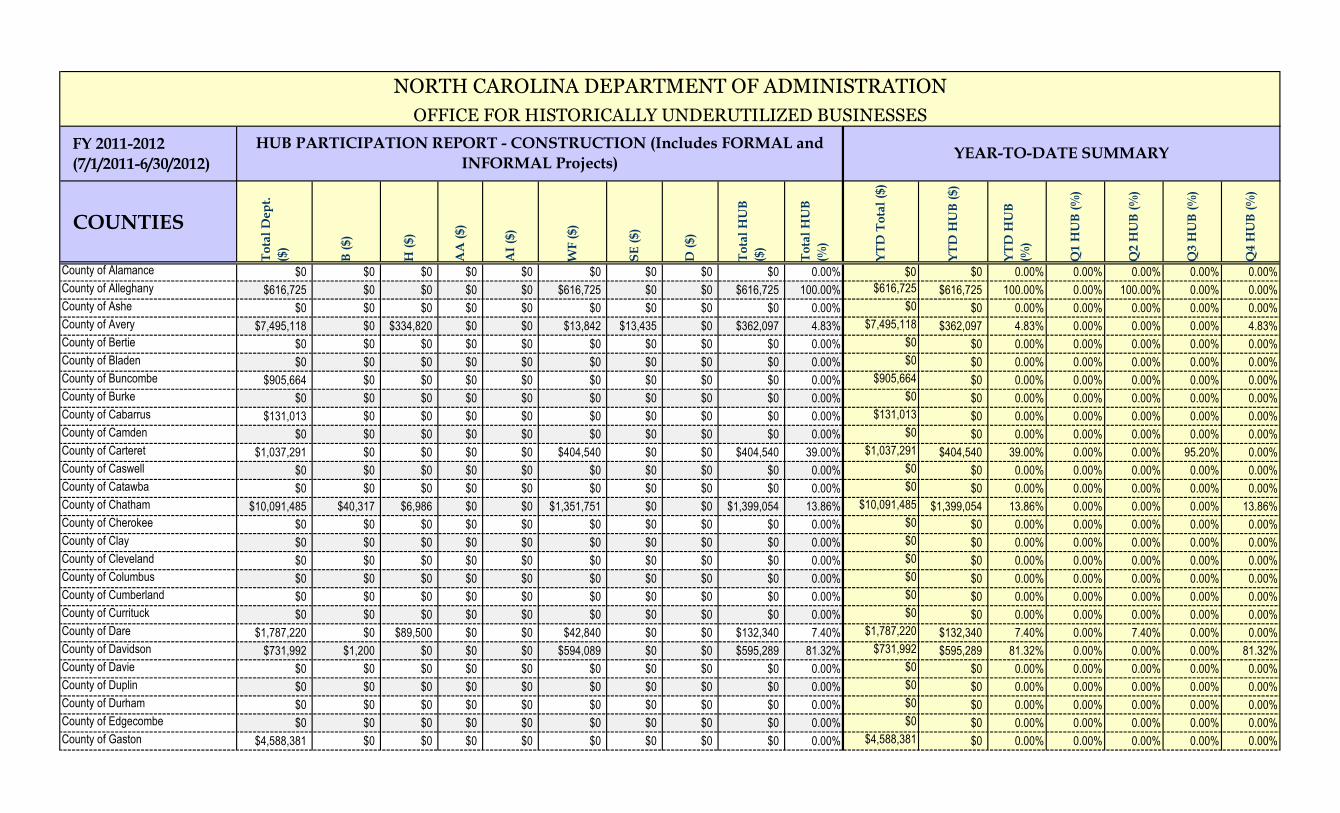
FY 2011-2012
(7/1/2011-6/30/2012)
COUNTIES
To
tal
Dep
t.
($)
B (
$)
H (
$)
AA
($)
AI
($)
WF
($)
SE
($)
D (
$)
To
tal
HU
B
($)
To
tal
HU
B
(%)
YT
D T
ota
l ($
)
YT
D H
UB
($)
YT
D H
UB
(%)
Q1 H
UB
(%
)
Q2 H
UB
(%
)
Q3 H
UB
(%
)
Q4 H
UB
(%
)
County of Alamance $0 $0 $0 $0 $0 $0 $0 $0 $0 0.00% $0 $0 0.00% 0.00% 0.00% 0.00% 0.00%
County of Alleghany $616,725 $0 $0 $0 $0 $616,725 $0 $0 $616,725 100.00% $616,725 $616,725 100.00% 0.00% 100.00% 0.00% 0.00%
County of Ashe $0 $0 $0 $0 $0 $0 $0 $0 $0 0.00% $0 $0 0.00% 0.00% 0.00% 0.00% 0.00%
County of Avery $7,495,118 $0 $334,820 $0 $0 $13,842 $13,435 $0 $362,097 4.83% $7,495,118 $362,097 4.83% 0.00% 0.00% 0.00% 4.83%
County of Bertie $0 $0 $0 $0 $0 $0 $0 $0 $0 0.00% $0 $0 0.00% 0.00% 0.00% 0.00% 0.00%
County of Bladen $0 $0 $0 $0 $0 $0 $0 $0 $0 0.00% $0 $0 0.00% 0.00% 0.00% 0.00% 0.00%
County of Buncombe $905,664 $0 $0 $0 $0 $0 $0 $0 $0 0.00% $905,664 $0 0.00% 0.00% 0.00% 0.00% 0.00%
County of Burke $0 $0 $0 $0 $0 $0 $0 $0 $0 0.00% $0 $0 0.00% 0.00% 0.00% 0.00% 0.00%
County of Cabarrus $131,013 $0 $0 $0 $0 $0 $0 $0 $0 0.00% $131,013 $0 0.00% 0.00% 0.00% 0.00% 0.00%
County of Camden $0 $0 $0 $0 $0 $0 $0 $0 $0 0.00% $0 $0 0.00% 0.00% 0.00% 0.00% 0.00%
County of Carteret $1,037,291 $0 $0 $0 $0 $404,540 $0 $0 $404,540 39.00% $1,037,291 $404,540 39.00% 0.00% 0.00% 95.20% 0.00%
County of Caswell $0 $0 $0 $0 $0 $0 $0 $0 $0 0.00% $0 $0 0.00% 0.00% 0.00% 0.00% 0.00%
County of Catawba $0 $0 $0 $0 $0 $0 $0 $0 $0 0.00% $0 $0 0.00% 0.00% 0.00% 0.00% 0.00%
County of Chatham $10,091,485 $40,317 $6,986 $0 $0 $1,351,751 $0 $0 $1,399,054 13.86% $10,091,485 $1,399,054 13.86% 0.00% 0.00% 0.00% 13.86%
County of Cherokee $0 $0 $0 $0 $0 $0 $0 $0 $0 0.00% $0 $0 0.00% 0.00% 0.00% 0.00% 0.00%
County of Clay $0 $0 $0 $0 $0 $0 $0 $0 $0 0.00% $0 $0 0.00% 0.00% 0.00% 0.00% 0.00%
County of Cleveland $0 $0 $0 $0 $0 $0 $0 $0 $0 0.00% $0 $0 0.00% 0.00% 0.00% 0.00% 0.00%
County of Columbus $0 $0 $0 $0 $0 $0 $0 $0 $0 0.00% $0 $0 0.00% 0.00% 0.00% 0.00% 0.00%
County of Cumberland $0 $0 $0 $0 $0 $0 $0 $0 $0 0.00% $0 $0 0.00% 0.00% 0.00% 0.00% 0.00%
County of Currituck $0 $0 $0 $0 $0 $0 $0 $0 $0 0.00% $0 $0 0.00% 0.00% 0.00% 0.00% 0.00%
County of Dare $1,787,220 $0 $89,500 $0 $0 $42,840 $0 $0 $132,340 7.40% $1,787,220 $132,340 7.40% 0.00% 7.40% 0.00% 0.00%
County of Davidson $731,992 $1,200 $0 $0 $0 $594,089 $0 $0 $595,289 81.32% $731,992 $595,289 81.32% 0.00% 0.00% 0.00% 81.32%
County of Davie $0 $0 $0 $0 $0 $0 $0 $0 $0 0.00% $0 $0 0.00% 0.00% 0.00% 0.00% 0.00%
County of Duplin $0 $0 $0 $0 $0 $0 $0 $0 $0 0.00% $0 $0 0.00% 0.00% 0.00% 0.00% 0.00%
County of Durham $0 $0 $0 $0 $0 $0 $0 $0 $0 0.00% $0 $0 0.00% 0.00% 0.00% 0.00% 0.00%
County of Edgecombe $0 $0 $0 $0 $0 $0 $0 $0 $0 0.00% $0 $0 0.00% 0.00% 0.00% 0.00% 0.00%
County of Gaston $4,588,381 $0 $0 $0 $0 $0 $0 $0 $0 0.00% $4,588,381 $0 0.00% 0.00% 0.00% 0.00% 0.00%
YEAR-TO-DATE SUMMARY
NORTH CAROLINA DEPARTMENT OF ADMINISTRATION
OFFICE FOR HISTORICALLY UNDERUTILIZED BUSINESSES
HUB PARTICIPATION REPORT - CONSTRUCTION (Includes FORMAL and
INFORMAL Projects)

County of Graham $0 $0 $0 $0 $0 $0 $0 $0 $0 0.00% $0 $0 0.00% 0.00% 0.00% 0.00% 0.00%
County of Granville $0 $0 $0 $0 $0 $0 $0 $0 $0 0.00% $0 $0 0.00% 0.00% 0.00% 0.00% 0.00%
County of Guilford $0 $0 $0 $0 $0 $0 $0 $0 $0 0.00% $0 $0 0.00% 0.00% 0.00% 0.00% 0.00%
County of Harnett $22,455,387 $2,045,154 $0 $0 $0 $3,765,716 $0 $0 $5,810,870 25.88% $22,455,387 $5,810,870 25.88% 0.00% 0.00% 0.00% 26.73%
County of Hoke $0 $0 $0 $0 $0 $0 $0 $0 $0 0.00% $0 $0 0.00% 0.00% 0.00% 0.00% 0.00%
County of Iredell $853,794 $0 $0 $0 $0 $95,615 $0 $0 $95,615 11.20% $853,794 $95,615 11.20% 0.00% 11.20% 0.00% 0.00%
County of Lee $0 $0 $0 $0 $0 $0 $0 $0 $0 0.00% $0 $0 0.00% 0.00% 0.00% 0.00% 0.00%
County of Lenoir $0 $0 $0 $0 $0 $0 $0 $0 $0 0.00% $0 $0 0.00% 0.00% 0.00% 0.00% 0.00%
County of Mecklenburg $0 $0 $0 $0 $0 $0 $0 $0 $0 0.00% $0 $0 0.00% 0.00% 0.00% 0.00% 0.00%
County of Moore $384,815 $0 $0 $0 $40,050 $0 $0 $0 $40,050 10.41% $384,815 $40,050 10.41% 0.00% 100.00% 0.00% 0.00%
County of Nash $0 $0 $0 $0 $0 $0 $0 $0 $0 0.00% $0 $0 0.00% 0.00% 0.00% 0.00% 0.00%
County of New Hanover $0 $0 $0 $0 $0 $0 $0 $0 $0 0.00% $0 $0 0.00% 0.00% 0.00% 0.00% 0.00%
County of Onslow $0 $0 $0 $0 $0 $0 $0 $0 $0 0.00% $0 $0 0.00% 0.00% 0.00% 0.00% 0.00%
County of Polk $0 $0 $0 $0 $0 $0 $0 $0 $0 0.00% $0 $0 0.00% 0.00% 0.00% 0.00% 0.00%
County of Randolph $0 $0 $0 $0 $0 $0 $0 $0 $0 0.00% $0 $0 0.00% 0.00% 0.00% 0.00% 0.00%
County of Rockingham $38,058,104 $26,864 $0 $0 $0 $8,524 $0 $0 $35,388 0.09% $38,058,104 $35,388 0.09% 0.09% 0.00% 0.00% 0.00%
County of Sampson $0 $0 $0 $0 $0 $0 $0 $0 $0 0.00% $0 $0 0.00% 0.00% 0.00% 0.00% 0.00%
County of Surry $0 $0 $0 $0 $0 $0 $0 $0 $0 0.00% $0 $0 0.00% 0.00% 0.00% 0.00% 0.00%
County of Transylvania $52,413 $0 $0 $0 $0 $0 $0 $0 $0 0.00% $52,413 $0 0.00% 0.00% 0.00% 0.00% 0.00%
County of Union $0 $0 $0 $0 $0 $0 $0 $0 $0 0.00% $0 $0 0.00% 0.00% 0.00% 0.00% 0.00%
County of Vance $0 $0 $0 $0 $0 $0 $0 $0 $0 0.00% $0 $0 0.00% 0.00% 0.00% 0.00% 0.00%
County of Wake $2,322,913 $0 $0 $0 $0 $155,536 $0 $0 $155,536 6.70% $2,322,913 $155,536 6.70% 0.00% 5.68% 0.00% 8.77%
County of Warren $0 $0 $0 $0 $0 $0 $0 $0 $0 0.00% $0 $0 0.00% 0.00% 0.00% 0.00% 0.00%
County of Washington $0 $0 $0 $0 $0 $0 $0 $0 $0 0.00% $0 $0 0.00% 0.00% 0.00% 0.00% 0.00%
County of Watauga $0 $0 $0 $0 $0 $0 $0 $0 $0 0.00% $0 $0 0.00% 0.00% 0.00% 0.00% 0.00%
County of Wilson $0 $0 $0 $0 $0 $0 $0 $0 $0 0.00% $0 $0 0.00% 0.00% 0.00% 0.00% 0.00%
TOTALS $91,512,315 $2,113,535 $431,306 $0 $40,050 $7,049,178 $13,435 $0 $9,647,504 10.54% $91,512,315 $9,647,504 10.54% 0.08% 17.77% 20.76% 19.86%
% of Total Purchasing 2.31% 0.47% 0.00% 0.04% 7.70% 0.01% 0.00% 10.54%
21.91% 4.47% 0.00% 0.42% 73.07% 0.14% 0.00% 100.00%
Q1
County of Alamance (DNS) $0 $0 $0 $0 $0 $0 $0 $0 $0 0.00%
County of Alleghany (DNS) $0 $0 $0 $0 $0 $0 $0 $0 $0 0.00%
County of Ashe (DNS) $0 $0 $0 $0 $0 $0 $0 $0 $0 0.00%
County of Avery (DNS) $0 $0 $0 $0 $0 $0 $0 $0 $0 0.00%
County of Bertie (DNS) $0 $0 $0 $0 $0 $0 $0 $0 $0 0.00%
County of Bladen $0 $0 $0 $0 $0 $0 $0 $0 $0 0.00%
County of Buncombe $569,709 $0 $0 $0 $0 $0 $0 $0 $0 0.00%
County of Burke (DNS) $0 $0 $0 $0 $0 $0 $0 $0 $0 0.00%
% of Minority Participation
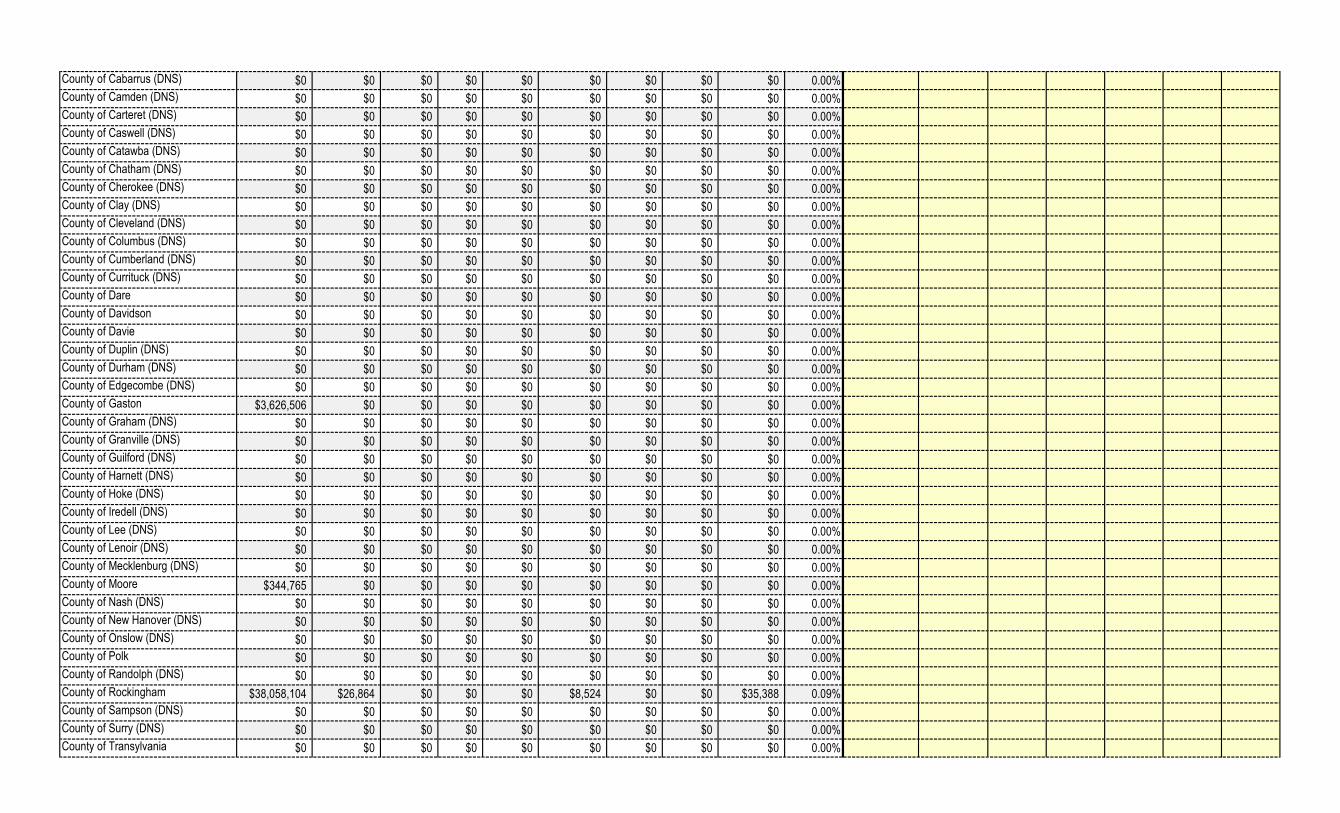
County of Cabarrus (DNS) $0 $0 $0 $0 $0 $0 $0 $0 $0 0.00%
County of Camden (DNS) $0 $0 $0 $0 $0 $0 $0 $0 $0 0.00%
County of Carteret (DNS) $0 $0 $0 $0 $0 $0 $0 $0 $0 0.00%
County of Caswell (DNS) $0 $0 $0 $0 $0 $0 $0 $0 $0 0.00%
County of Catawba (DNS) $0 $0 $0 $0 $0 $0 $0 $0 $0 0.00%
County of Chatham (DNS) $0 $0 $0 $0 $0 $0 $0 $0 $0 0.00%
County of Cherokee (DNS) $0 $0 $0 $0 $0 $0 $0 $0 $0 0.00%
County of Clay (DNS) $0 $0 $0 $0 $0 $0 $0 $0 $0 0.00%
County of Cleveland (DNS) $0 $0 $0 $0 $0 $0 $0 $0 $0 0.00%
County of Columbus (DNS) $0 $0 $0 $0 $0 $0 $0 $0 $0 0.00%
County of Cumberland (DNS) $0 $0 $0 $0 $0 $0 $0 $0 $0 0.00%
County of Currituck (DNS) $0 $0 $0 $0 $0 $0 $0 $0 $0 0.00%
County of Dare $0 $0 $0 $0 $0 $0 $0 $0 $0 0.00%
County of Davidson $0 $0 $0 $0 $0 $0 $0 $0 $0 0.00%
County of Davie $0 $0 $0 $0 $0 $0 $0 $0 $0 0.00%
County of Duplin (DNS) $0 $0 $0 $0 $0 $0 $0 $0 $0 0.00%
County of Durham (DNS) $0 $0 $0 $0 $0 $0 $0 $0 $0 0.00%
County of Edgecombe (DNS) $0 $0 $0 $0 $0 $0 $0 $0 $0 0.00%
County of Gaston $3,626,506 $0 $0 $0 $0 $0 $0 $0 $0 0.00%
County of Graham (DNS) $0 $0 $0 $0 $0 $0 $0 $0 $0 0.00%
County of Granville (DNS) $0 $0 $0 $0 $0 $0 $0 $0 $0 0.00%
County of Guilford (DNS) $0 $0 $0 $0 $0 $0 $0 $0 $0 0.00%
County of Harnett (DNS) $0 $0 $0 $0 $0 $0 $0 $0 $0 0.00%
County of Hoke (DNS) $0 $0 $0 $0 $0 $0 $0 $0 $0 0.00%
County of Iredell (DNS) $0 $0 $0 $0 $0 $0 $0 $0 $0 0.00%
County of Lee (DNS) $0 $0 $0 $0 $0 $0 $0 $0 $0 0.00%
County of Lenoir (DNS) $0 $0 $0 $0 $0 $0 $0 $0 $0 0.00%
County of Mecklenburg (DNS) $0 $0 $0 $0 $0 $0 $0 $0 $0 0.00%
County of Moore $344,765 $0 $0 $0 $0 $0 $0 $0 $0 0.00%
County of Nash (DNS) $0 $0 $0 $0 $0 $0 $0 $0 $0 0.00%
County of New Hanover (DNS) $0 $0 $0 $0 $0 $0 $0 $0 $0 0.00%
County of Onslow (DNS) $0 $0 $0 $0 $0 $0 $0 $0 $0 0.00%
County of Polk $0 $0 $0 $0 $0 $0 $0 $0 $0 0.00%
County of Randolph (DNS) $0 $0 $0 $0 $0 $0 $0 $0 $0 0.00%
County of Rockingham $38,058,104 $26,864 $0 $0 $0 $8,524 $0 $0 $35,388 0.09%
County of Sampson (DNS) $0 $0 $0 $0 $0 $0 $0 $0 $0 0.00%
County of Surry (DNS) $0 $0 $0 $0 $0 $0 $0 $0 $0 0.00%
County of Transylvania $0 $0 $0 $0 $0 $0 $0 $0 $0 0.00%

County of Union (DNS) $0 $0 $0 $0 $0 $0 $0 $0 $0 0.00%
County of Vance (DNS) $0 $0 $0 $0 $0 $0 $0 $0 $0 0.00%
County of Wake $57,931 $0 $0 $0 $0 $0 $0 $0 $0 0.00%
County of Warren (DNS) $0 $0 $0 $0 $0 $0 $0 $0 $0 0.00%
County of Washington $0 $0 $0 $0 $0 $0 $0 $0 $0 0.00%
County of Watauga (DNS) $0 $0 $0 $0 $0 $0 $0 $0 $0 0.00%
County of Wilson (DNS) $0 $0 $0 $0 $0 $0 $0 $0 $0 0.00%
TOTALS $42,657,015 $26,864 $0 $0 $0 $8,524 $0 $0 $35,388 0.08%
0.06% 0.00% 0.00% 0.00% 0.02% 0.00% 0.00% 0.08%
Q2
County of Alamance (DNS) $0 $0 $0 $0 $0 $0 $0 $0 $0 0.00% $0 $0 0.00% 0.00%
County of Alleghany $616,725 $0 $0 $0 $0 $616,725 $0 $0 $616,725 100.00% $616,725 $616,725 100.00% 0.00%
County of Ashe $0 $0 $0 $0 $0 $0 $0 $0 $0 0.00% $0 $0 0.00% 0.00%
County of Avery (DNS) $0 $0 $0 $0 $0 $0 $0 $0 $0 0.00% $0 $0 0.00% 0.00%
County of Bertie (DNS) $0 $0 $0 $0 $0 $0 $0 $0 $0 0.00% $0 $0 0.00% 0.00%
County of Bladen (DNS) $0 $0 $0 $0 $0 $0 $0 $0 $0 0.00% $0 $0 0.00% 0.00%
County of Buncombe (DNS) $0 $0 $0 $0 $0 $0 $0 $0 $0 0.00% $569,709 $0 0.00% 0.00%
County of Burke (DNS) $0 $0 $0 $0 $0 $0 $0 $0 $0 0.00% $0 $0 0.00% 0.00%
County of Cabarrus (DNS) $0 $0 $0 $0 $0 $0 $0 $0 $0 0.00% $0 $0 0.00% 0.00%
County of Camden (DNS) $0 $0 $0 $0 $0 $0 $0 $0 $0 0.00% $0 $0 0.00% 0.00%
County of Carteret $401,632 $0 $0 $0 $0 $0 $0 $0 $0 0.00% $401,632 $0 0.00% 0.00%
County of Caswell (DNS) $0 $0 $0 $0 $0 $0 $0 $0 $0 0.00% $0 $0 0.00% 0.00%
County of Catawba (DNS) $0 $0 $0 $0 $0 $0 $0 $0 $0 0.00% $0 $0 0.00% 0.00%
County of Chatham $0 $0 $0 $0 $0 $0 $0 $0 $0 0.00% $0 $0 0.00% 0.00%
County of Cherokee (DNS) $0 $0 $0 $0 $0 $0 $0 $0 $0 0.00% $0 $0 0.00% 0.00%
County of Clay (DNS) $0 $0 $0 $0 $0 $0 $0 $0 $0 0.00% $0 $0 0.00% 0.00%
County of Cleveland (DNS) $0 $0 $0 $0 $0 $0 $0 $0 $0 0.00% $0 $0 0.00% 0.00%
County of Columbus (DNS) $0 $0 $0 $0 $0 $0 $0 $0 $0 0.00% $0 $0 0.00% 0.00%
County of Cumberland (DNS) $0 $0 $0 $0 $0 $0 $0 $0 $0 0.00% $0 $0 0.00% 0.00%
County of Currituck (DNS) $0 $0 $0 $0 $0 $0 $0 $0 $0 0.00% $0 $0 0.00% 0.00%
County of Dare $1,787,220 $0 $89,500 $0 $0 $42,840 $0 $0 $132,340 7.40% $1,787,220 $132,340 7.40% 0.00%
County of Davidson $0 $0 $0 $0 $0 $0 $0 $0 $0 0.00% $0 $0 0.00% 0.00%
County of Davie $0 $0 $0 $0 $0 $0 $0 $0 $0 0.00% $0 $0 0.00% 0.00%
County of Duplin (DNS) $0 $0 $0 $0 $0 $0 $0 $0 $0 0.00% $0 $0 0.00% 0.00%
County of Durham (DNS) $0 $0 $0 $0 $0 $0 $0 $0 $0 0.00% $0 $0 0.00% 0.00%
County of Edgecombe (DNS) $0 $0 $0 $0 $0 $0 $0 $0 $0 0.00% $0 $0 0.00% 0.00%
County of Gaston (DNS) $0 $0 $0 $0 $0 $0 $0 $0 $0 0.00% $3,626,506 $0 0.00% 0.00%
County of Graham (DNS) $0 $0 $0 $0 $0 $0 $0 $0 $0 0.00% $0 $0 0.00% 0.00%
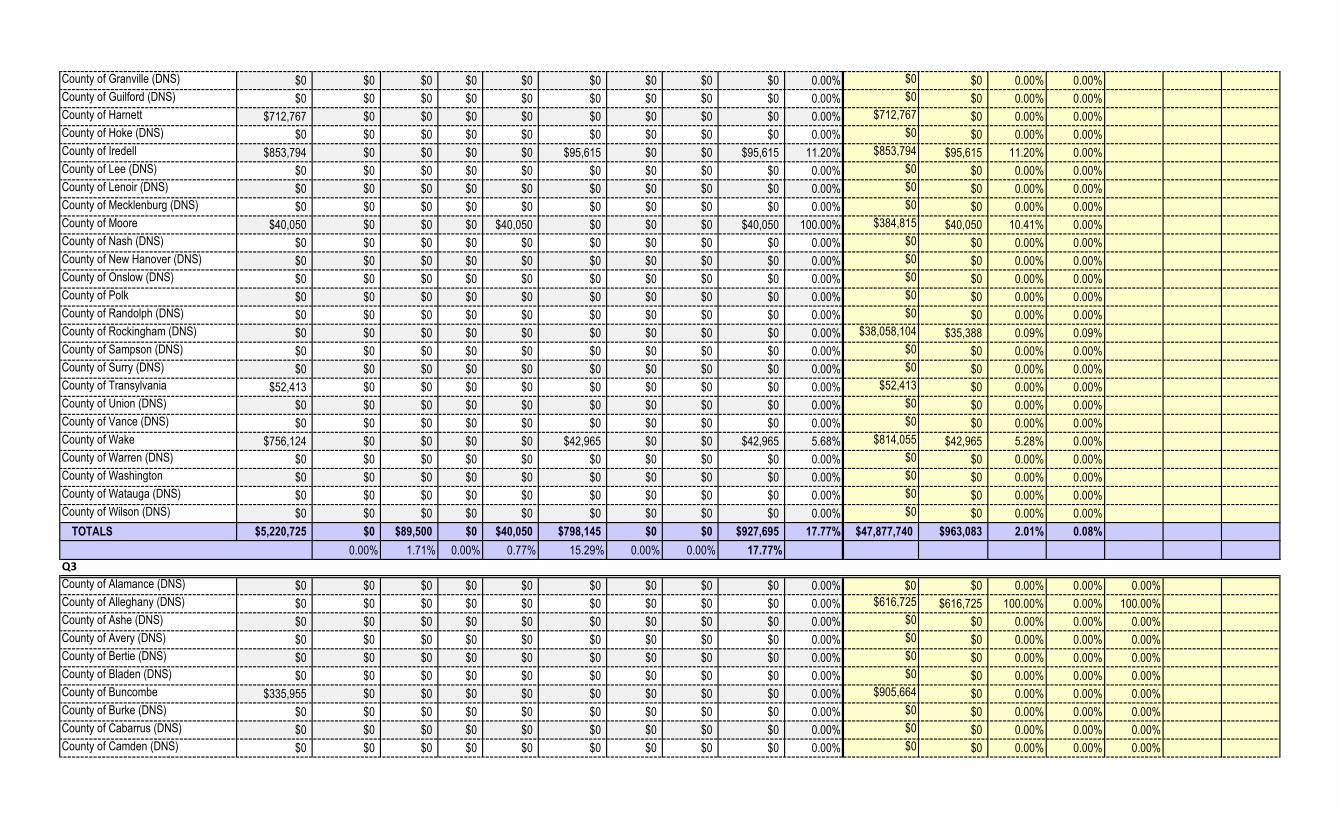
County of Granville (DNS) $0 $0 $0 $0 $0 $0 $0 $0 $0 0.00% $0 $0 0.00% 0.00%
County of Guilford (DNS) $0 $0 $0 $0 $0 $0 $0 $0 $0 0.00% $0 $0 0.00% 0.00%
County of Harnett $712,767 $0 $0 $0 $0 $0 $0 $0 $0 0.00% $712,767 $0 0.00% 0.00%
County of Hoke (DNS) $0 $0 $0 $0 $0 $0 $0 $0 $0 0.00% $0 $0 0.00% 0.00%
County of Iredell $853,794 $0 $0 $0 $0 $95,615 $0 $0 $95,615 11.20% $853,794 $95,615 11.20% 0.00%
County of Lee (DNS) $0 $0 $0 $0 $0 $0 $0 $0 $0 0.00% $0 $0 0.00% 0.00%
County of Lenoir (DNS) $0 $0 $0 $0 $0 $0 $0 $0 $0 0.00% $0 $0 0.00% 0.00%
County of Mecklenburg (DNS) $0 $0 $0 $0 $0 $0 $0 $0 $0 0.00% $0 $0 0.00% 0.00%
County of Moore $40,050 $0 $0 $0 $40,050 $0 $0 $0 $40,050 100.00% $384,815 $40,050 10.41% 0.00%
County of Nash (DNS) $0 $0 $0 $0 $0 $0 $0 $0 $0 0.00% $0 $0 0.00% 0.00%
County of New Hanover (DNS) $0 $0 $0 $0 $0 $0 $0 $0 $0 0.00% $0 $0 0.00% 0.00%
County of Onslow (DNS) $0 $0 $0 $0 $0 $0 $0 $0 $0 0.00% $0 $0 0.00% 0.00%
County of Polk $0 $0 $0 $0 $0 $0 $0 $0 $0 0.00% $0 $0 0.00% 0.00%
County of Randolph (DNS) $0 $0 $0 $0 $0 $0 $0 $0 $0 0.00% $0 $0 0.00% 0.00%
County of Rockingham (DNS) $0 $0 $0 $0 $0 $0 $0 $0 $0 0.00% $38,058,104 $35,388 0.09% 0.09%
County of Sampson (DNS) $0 $0 $0 $0 $0 $0 $0 $0 $0 0.00% $0 $0 0.00% 0.00%
County of Surry (DNS) $0 $0 $0 $0 $0 $0 $0 $0 $0 0.00% $0 $0 0.00% 0.00%
County of Transylvania $52,413 $0 $0 $0 $0 $0 $0 $0 $0 0.00% $52,413 $0 0.00% 0.00%
County of Union (DNS) $0 $0 $0 $0 $0 $0 $0 $0 $0 0.00% $0 $0 0.00% 0.00%
County of Vance (DNS) $0 $0 $0 $0 $0 $0 $0 $0 $0 0.00% $0 $0 0.00% 0.00%
County of Wake $756,124 $0 $0 $0 $0 $42,965 $0 $0 $42,965 5.68% $814,055 $42,965 5.28% 0.00%
County of Warren (DNS) $0 $0 $0 $0 $0 $0 $0 $0 $0 0.00% $0 $0 0.00% 0.00%
County of Washington $0 $0 $0 $0 $0 $0 $0 $0 $0 0.00% $0 $0 0.00% 0.00%
County of Watauga (DNS) $0 $0 $0 $0 $0 $0 $0 $0 $0 0.00% $0 $0 0.00% 0.00%
County of Wilson (DNS) $0 $0 $0 $0 $0 $0 $0 $0 $0 0.00% $0 $0 0.00% 0.00%
TOTALS $5,220,725 $0 $89,500 $0 $40,050 $798,145 $0 $0 $927,695 17.77% $47,877,740 $963,083 2.01% 0.08%
0.00% 1.71% 0.00% 0.77% 15.29% 0.00% 0.00% 17.77%
Q3
County of Alamance (DNS) $0 $0 $0 $0 $0 $0 $0 $0 $0 0.00% $0 $0 0.00% 0.00% 0.00%
County of Alleghany (DNS) $0 $0 $0 $0 $0 $0 $0 $0 $0 0.00% $616,725 $616,725 100.00% 0.00% 100.00%
County of Ashe (DNS) $0 $0 $0 $0 $0 $0 $0 $0 $0 0.00% $0 $0 0.00% 0.00% 0.00%
County of Avery (DNS) $0 $0 $0 $0 $0 $0 $0 $0 $0 0.00% $0 $0 0.00% 0.00% 0.00%
County of Bertie (DNS) $0 $0 $0 $0 $0 $0 $0 $0 $0 0.00% $0 $0 0.00% 0.00% 0.00%
County of Bladen (DNS) $0 $0 $0 $0 $0 $0 $0 $0 $0 0.00% $0 $0 0.00% 0.00% 0.00%
County of Buncombe $335,955 $0 $0 $0 $0 $0 $0 $0 $0 0.00% $905,664 $0 0.00% 0.00% 0.00%
County of Burke (DNS) $0 $0 $0 $0 $0 $0 $0 $0 $0 0.00% $0 $0 0.00% 0.00% 0.00%
County of Cabarrus (DNS) $0 $0 $0 $0 $0 $0 $0 $0 $0 0.00% $0 $0 0.00% 0.00% 0.00%
County of Camden (DNS) $0 $0 $0 $0 $0 $0 $0 $0 $0 0.00% $0 $0 0.00% 0.00% 0.00%
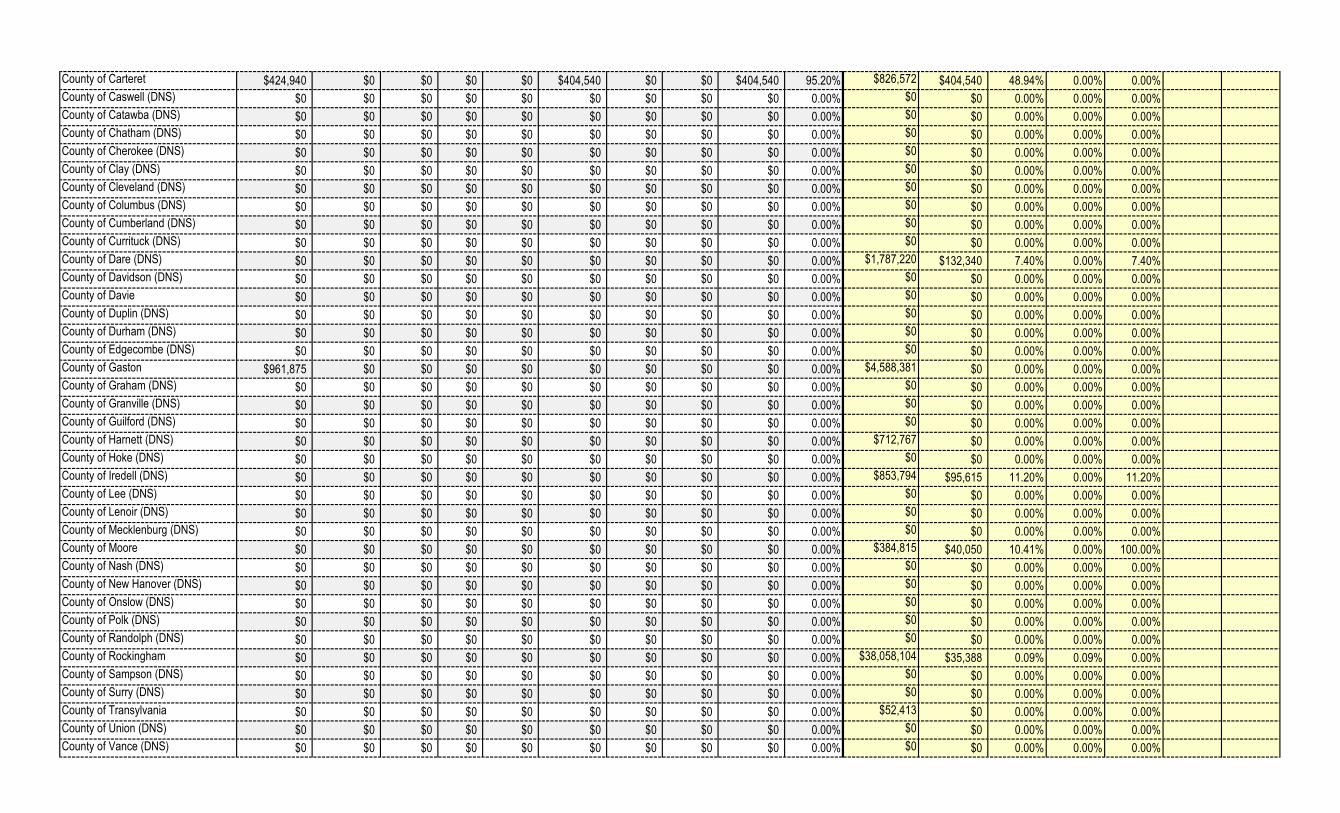
County of Carteret $424,940 $0 $0 $0 $0 $404,540 $0 $0 $404,540 95.20% $826,572 $404,540 48.94% 0.00% 0.00%
County of Caswell (DNS) $0 $0 $0 $0 $0 $0 $0 $0 $0 0.00% $0 $0 0.00% 0.00% 0.00%
County of Catawba (DNS) $0 $0 $0 $0 $0 $0 $0 $0 $0 0.00% $0 $0 0.00% 0.00% 0.00%
County of Chatham (DNS) $0 $0 $0 $0 $0 $0 $0 $0 $0 0.00% $0 $0 0.00% 0.00% 0.00%
County of Cherokee (DNS) $0 $0 $0 $0 $0 $0 $0 $0 $0 0.00% $0 $0 0.00% 0.00% 0.00%
County of Clay (DNS) $0 $0 $0 $0 $0 $0 $0 $0 $0 0.00% $0 $0 0.00% 0.00% 0.00%
County of Cleveland (DNS) $0 $0 $0 $0 $0 $0 $0 $0 $0 0.00% $0 $0 0.00% 0.00% 0.00%
County of Columbus (DNS) $0 $0 $0 $0 $0 $0 $0 $0 $0 0.00% $0 $0 0.00% 0.00% 0.00%
County of Cumberland (DNS) $0 $0 $0 $0 $0 $0 $0 $0 $0 0.00% $0 $0 0.00% 0.00% 0.00%
County of Currituck (DNS) $0 $0 $0 $0 $0 $0 $0 $0 $0 0.00% $0 $0 0.00% 0.00% 0.00%
County of Dare (DNS) $0 $0 $0 $0 $0 $0 $0 $0 $0 0.00% $1,787,220 $132,340 7.40% 0.00% 7.40%
County of Davidson (DNS) $0 $0 $0 $0 $0 $0 $0 $0 $0 0.00% $0 $0 0.00% 0.00% 0.00%
County of Davie $0 $0 $0 $0 $0 $0 $0 $0 $0 0.00% $0 $0 0.00% 0.00% 0.00%
County of Duplin (DNS) $0 $0 $0 $0 $0 $0 $0 $0 $0 0.00% $0 $0 0.00% 0.00% 0.00%
County of Durham (DNS) $0 $0 $0 $0 $0 $0 $0 $0 $0 0.00% $0 $0 0.00% 0.00% 0.00%
County of Edgecombe (DNS) $0 $0 $0 $0 $0 $0 $0 $0 $0 0.00% $0 $0 0.00% 0.00% 0.00%
County of Gaston $961,875 $0 $0 $0 $0 $0 $0 $0 $0 0.00% $4,588,381 $0 0.00% 0.00% 0.00%
County of Graham (DNS) $0 $0 $0 $0 $0 $0 $0 $0 $0 0.00% $0 $0 0.00% 0.00% 0.00%
County of Granville (DNS) $0 $0 $0 $0 $0 $0 $0 $0 $0 0.00% $0 $0 0.00% 0.00% 0.00%
County of Guilford (DNS) $0 $0 $0 $0 $0 $0 $0 $0 $0 0.00% $0 $0 0.00% 0.00% 0.00%
County of Harnett (DNS) $0 $0 $0 $0 $0 $0 $0 $0 $0 0.00% $712,767 $0 0.00% 0.00% 0.00%
County of Hoke (DNS) $0 $0 $0 $0 $0 $0 $0 $0 $0 0.00% $0 $0 0.00% 0.00% 0.00%
County of Iredell (DNS) $0 $0 $0 $0 $0 $0 $0 $0 $0 0.00% $853,794 $95,615 11.20% 0.00% 11.20%
County of Lee (DNS) $0 $0 $0 $0 $0 $0 $0 $0 $0 0.00% $0 $0 0.00% 0.00% 0.00%
County of Lenoir (DNS) $0 $0 $0 $0 $0 $0 $0 $0 $0 0.00% $0 $0 0.00% 0.00% 0.00%
County of Mecklenburg (DNS) $0 $0 $0 $0 $0 $0 $0 $0 $0 0.00% $0 $0 0.00% 0.00% 0.00%
County of Moore $0 $0 $0 $0 $0 $0 $0 $0 $0 0.00% $384,815 $40,050 10.41% 0.00% 100.00%
County of Nash (DNS) $0 $0 $0 $0 $0 $0 $0 $0 $0 0.00% $0 $0 0.00% 0.00% 0.00%
County of New Hanover (DNS) $0 $0 $0 $0 $0 $0 $0 $0 $0 0.00% $0 $0 0.00% 0.00% 0.00%
County of Onslow (DNS) $0 $0 $0 $0 $0 $0 $0 $0 $0 0.00% $0 $0 0.00% 0.00% 0.00%
County of Polk (DNS) $0 $0 $0 $0 $0 $0 $0 $0 $0 0.00% $0 $0 0.00% 0.00% 0.00%
County of Randolph (DNS) $0 $0 $0 $0 $0 $0 $0 $0 $0 0.00% $0 $0 0.00% 0.00% 0.00%
County of Rockingham $0 $0 $0 $0 $0 $0 $0 $0 $0 0.00% $38,058,104 $35,388 0.09% 0.09% 0.00%
County of Sampson (DNS) $0 $0 $0 $0 $0 $0 $0 $0 $0 0.00% $0 $0 0.00% 0.00% 0.00%
County of Surry (DNS) $0 $0 $0 $0 $0 $0 $0 $0 $0 0.00% $0 $0 0.00% 0.00% 0.00%
County of Transylvania $0 $0 $0 $0 $0 $0 $0 $0 $0 0.00% $52,413 $0 0.00% 0.00% 0.00%
County of Union (DNS) $0 $0 $0 $0 $0 $0 $0 $0 $0 0.00% $0 $0 0.00% 0.00% 0.00%
County of Vance (DNS) $0 $0 $0 $0 $0 $0 $0 $0 $0 0.00% $0 $0 0.00% 0.00% 0.00%

County of Wake $225,584 $0 $0 $0 $0 $0 $0 $0 $0 0.00% $1,039,639 $42,965 4.13% 0.00% 5.68%
County of Warren (DNS) $0 $0 $0 $0 $0 $0 $0 $0 $0 0.00% $0 $0 0.00% 0.00% 0.00%
County of Washington $0 $0 $0 $0 $0 $0 $0 $0 $0 0.00% $0 $0 0.00% 0.00% 0.00%
County of Watauga (DNS) $0 $0 $0 $0 $0 $0 $0 $0 $0 0.00% $0 $0 0.00% 0.00% 0.00%
County of Wilson (DNS) $0 $0 $0 $0 $0 $0 $0 $0 $0 0.00% $0 $0 0.00% 0.00% 0.00%
TOTALS $1,948,354 $0 $0 $0 $0 $404,540 $0 $0 $404,540 20.76% $49,826,094 $1,367,623 2.74% 0.08% 17.77%
0.00% 0.00% 0.00% 0.00% 20.76% 0.00% 0.00% 20.76% Q4
County of Alamance (DNS) $0 $0 $0 $0 $0 $0 $0 $0 $0 0.00% $0 $0 0.00% 0.00% 0.00% 0.00%
County of Alleghany $0 $0 $0 $0 $0 $0 $0 $0 $0 0.00% $616,725 $616,725 100.00% 0.00% 100.00% 0.00%
County of Ashe (DNS) $0 $0 $0 $0 $0 $0 $0 $0 $0 0.00% $0 $0 0.00% 0.00% 0.00% 0.00%
County of Avery $7,495,118 $0 $334,820 $0 $0 $13,842 $13,435 $0 $362,097 4.83% $7,495,118 $362,097 4.83% 0.00% 0.00% 0.00%
County of Bertie (DNS) $0 $0 $0 $0 $0 $0 $0 $0 $0 0.00% $0 $0 0.00% 0.00% 0.00% 0.00%
County of Bladen (DNS) $0 $0 $0 $0 $0 $0 $0 $0 $0 0.00% $0 $0 0.00% 0.00% 0.00% 0.00%
County of Buncombe (DNS) $0 $0 $0 $0 $0 $0 $0 $0 $0 0.00% $905,664 $0 0.00% 0.00% 0.00% 0.00%
County of Burke $0 $0 $0 $0 $0 $0 $0 $0 $0 0.00% $0 $0 0.00% 0.00% 0.00% 0.00%
County of Cabarrus $131,013 $0 $0 $0 $0 $0 $0 $0 $0 0.00% $131,013 $0 0.00% 0.00% 0.00% 0.00%
County of Camden (DNS) $0 $0 $0 $0 $0 $0 $0 $0 $0 0.00% $0 $0 0.00% 0.00% 0.00% 0.00%
County of Carteret $210,719 $0 $0 $0 $0 $0 $0 $0 $0 0.00% $1,037,291 $404,540 39.00% 0.00% 0.00% 95.20%
County of Caswell (DNS) $0 $0 $0 $0 $0 $0 $0 $0 $0 0.00% $0 $0 0.00% 0.00% 0.00% 0.00%
County of Catawba (DNS) $0 $0 $0 $0 $0 $0 $0 $0 $0 0.00% $0 $0 0.00% 0.00% 0.00% 0.00%
County of Chatham $10,091,485 $40,317 $6,986 $0 $0 $1,351,751 $0 $0 $1,399,054 13.86% $10,091,485 $1,399,054 13.86% 0.00% 0.00% 0.00%
County of Cherokee (DNS) $0 $0 $0 $0 $0 $0 $0 $0 $0 0.00% $0 $0 0.00% 0.00% 0.00% 0.00%
County of Clay (DNS) $0 $0 $0 $0 $0 $0 $0 $0 $0 0.00% $0 $0 0.00% 0.00% 0.00% 0.00%
County of Cleveland (DNS) $0 $0 $0 $0 $0 $0 $0 $0 $0 0.00% $0 $0 0.00% 0.00% 0.00% 0.00%
County of Columbus (DNS) $0 $0 $0 $0 $0 $0 $0 $0 $0 0.00% $0 $0 0.00% 0.00% 0.00% 0.00%
County of Cumberland (DNS) $0 $0 $0 $0 $0 $0 $0 $0 $0 0.00% $0 $0 0.00% 0.00% 0.00% 0.00%
County of Currituck (DNS) $0 $0 $0 $0 $0 $0 $0 $0 $0 0.00% $0 $0 0.00% 0.00% 0.00% 0.00%
County of Dare $0 $0 $0 $0 $0 $0 $0 $0 $0 0.00% $1,787,220 $132,340 7.40% 0.00% 7.40% 0.00%
County of Davidson $731,992 $1,200 $0 $0 $0 $594,089 $0 $0 $595,289 81.32% $731,992 $595,289 81.32% 0.00% 0.00% 0.00%
County of Davie $0 $0 $0 $0 $0 $0 $0 $0 $0 0.00% $0 $0 0.00% 0.00% 0.00% 0.00%
County of Duplin (DNS) $0 $0 $0 $0 $0 $0 $0 $0 $0 0.00% $0 $0 0.00% 0.00% 0.00% 0.00%
County of Durham (DNS) $0 $0 $0 $0 $0 $0 $0 $0 $0 0.00% $0 $0 0.00% 0.00% 0.00% 0.00%
County of Edgecombe (DNS) $0 $0 $0 $0 $0 $0 $0 $0 $0 0.00% $0 $0 0.00% 0.00% 0.00% 0.00%
County of Gaston (DNS) $0 $0 $0 $0 $0 $0 $0 $0 $0 0.00% $4,588,381 $0 0.00% 0.00% 0.00% 0.00%
County of Graham (DNS) $0 $0 $0 $0 $0 $0 $0 $0 $0 0.00% $0 $0 0.00% 0.00% 0.00% 0.00%
County of Granville (DNS) $0 $0 $0 $0 $0 $0 $0 $0 $0 0.00% $0 $0 0.00% 0.00% 0.00% 0.00%
County of Guilford (DNS) $0 $0 $0 $0 $0 $0 $0 $0 $0 0.00% $0 $0 0.00% 0.00% 0.00% 0.00%

County of Harnett $21,742,620 $2,045,154 $0 $0 $0 $3,765,716 $0 $0 $5,810,870 26.73% $22,455,387 $5,810,870 25.88% 0.00% 0.00% 0.00%
County of Hoke (DNS) $0 $0 $0 $0 $0 $0 $0 $0 $0 0.00% $0 $0 0.00% 0.00% 0.00% 0.00%
County of Iredell (DNS) $0 $0 $0 $0 $0 $0 $0 $0 $0 0.00% $853,794 $95,615 11.20% 0.00% 11.20% 0.00%
County of Lee (DNS) $0 $0 $0 $0 $0 $0 $0 $0 $0 0.00% $0 $0 0.00% 0.00% 0.00% 0.00%
County of Lenoir (DNS) $0 $0 $0 $0 $0 $0 $0 $0 $0 0.00% $0 $0 0.00% 0.00% 0.00% 0.00%
County of Mecklenburg (DNS) $0 $0 $0 $0 $0 $0 $0 $0 $0 0.00% $0 $0 0.00% 0.00% 0.00% 0.00%
County of Moore $0 $0 $0 $0 $0 $0 $0 $0 $0 0.00% $384,815 $40,050 10.41% 0.00% 100.00% 0.00%
County of Nash (DNS) $0 $0 $0 $0 $0 $0 $0 $0 $0 0.00% $0 $0 0.00% 0.00% 0.00% 0.00%
County of New Hanover (DNS) $0 $0 $0 $0 $0 $0 $0 $0 $0 0.00% $0 $0 0.00% 0.00% 0.00% 0.00%
County of Onslow (DNS) $0 $0 $0 $0 $0 $0 $0 $0 $0 0.00% $0 $0 0.00% 0.00% 0.00% 0.00%
County of Polk $0 $0 $0 $0 $0 $0 $0 $0 $0 0.00% $0 $0 0.00% 0.00% 0.00% 0.00%
County of Randolph (DNS) $0 $0 $0 $0 $0 $0 $0 $0 $0 0.00% $0 $0 0.00% 0.00% 0.00% 0.00%
County of Rockingham $0 $0 $0 $0 $0 $0 $0 $0 $0 0.00% $38,058,104 $35,388 0.09% 0.09% 0.00% 0.00%
County of Sampson (DNS) $0 $0 $0 $0 $0 $0 $0 $0 $0 0.00% $0 $0 0.00% 0.00% 0.00% 0.00%
County of Surry (DNS) $0 $0 $0 $0 $0 $0 $0 $0 $0 0.00% $0 $0 0.00% 0.00% 0.00% 0.00%
County of Transylvania $0 $0 $0 $0 $0 $0 $0 $0 $0 0.00% $52,413 $0 0.00% 0.00% 0.00% 0.00%
County of Union (DNS) $0 $0 $0 $0 $0 $0 $0 $0 $0 0.00% $0 $0 0.00% 0.00% 0.00% 0.00%
County of Vance (DNS) $0 $0 $0 $0 $0 $0 $0 $0 $0 0.00% $0 $0 0.00% 0.00% 0.00% 0.00%
County of Wake $1,283,274 $0 $0 $0 $0 $112,571 $0 $0 $112,571 8.77% $2,322,913 $155,536 6.70% 0.00% 5.68% 0.00%
County of Warren (DNS) $0 $0 $0 $0 $0 $0 $0 $0 $0 0.00% $0 $0 0.00% 0.00% 0.00% 0.00%
County of Washington $0 $0 $0 $0 $0 $0 $0 $0 $0 0.00% $0 $0 0.00% 0.00% 0.00% 0.00%
County of Watauga (DNS) $0 $0 $0 $0 $0 $0 $0 $0 $0 0.00% $0 $0 0.00% 0.00% 0.00% 0.00%
County of Wilson (DNS) $0 $0 $0 $0 $0 $0 $0 $0 $0 0.00% $0 $0 0.00% 0.00% 0.00% 0.00%
TOTALS $41,686,221 $2,086,671 $341,806 $0 $0 $5,837,969 $13,435 $0 $8,279,881 19.86% $91,512,315 $9,647,504 10.54% 0.08% 17.77% 20.76%
5.01% 0.82% 0.00% 0.00% 14.00% 0.03% 0.00% 19.86%
B Black WF White Female
H Hipanic SE Socially and Economically Disadvantaged
AA Asian-American D Disabled
AI American Indian DNS Did Not Submit report
LEGEND
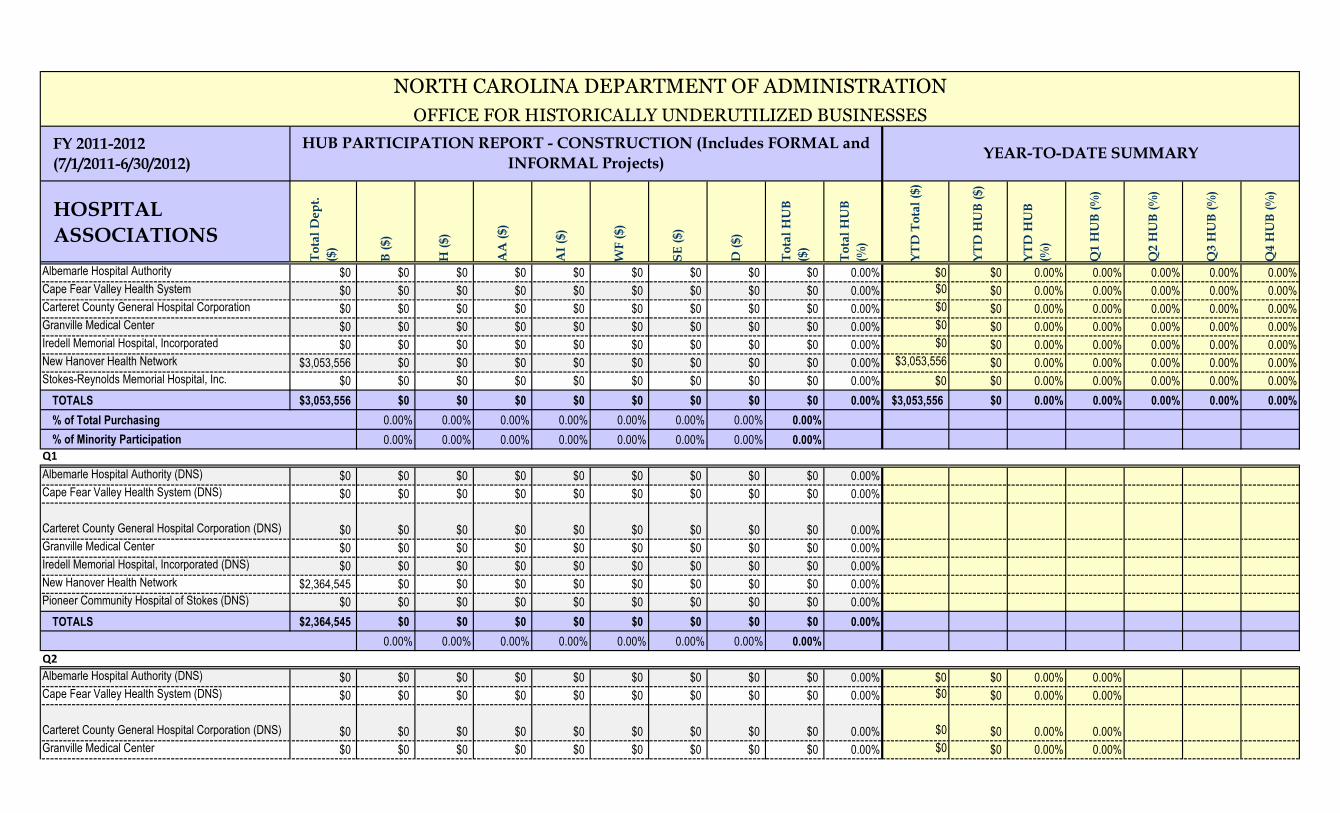
FY 2011-2012
(7/1/2011-6/30/2012)
HOSPITAL
ASSOCIATIONS
To
tal
Dep
t.
($)
B (
$)
H (
$)
AA
($)
AI
($)
WF
($)
SE
($)
D (
$)
To
tal
HU
B
($)
To
tal
HU
B
(%)
YT
D T
ota
l ($
)
YT
D H
UB
($)
YT
D H
UB
(%)
Q1 H
UB
(%
)
Q2 H
UB
(%
)
Q3 H
UB
(%
)
Q4 H
UB
(%
)
Albemarle Hospital Authority $0 $0 $0 $0 $0 $0 $0 $0 $0 0.00% $0 $0 0.00% 0.00% 0.00% 0.00% 0.00%
Cape Fear Valley Health System $0 $0 $0 $0 $0 $0 $0 $0 $0 0.00% $0 $0 0.00% 0.00% 0.00% 0.00% 0.00%
Carteret County General Hospital Corporation $0 $0 $0 $0 $0 $0 $0 $0 $0 0.00% $0 $0 0.00% 0.00% 0.00% 0.00% 0.00%
Granville Medical Center $0 $0 $0 $0 $0 $0 $0 $0 $0 0.00% $0 $0 0.00% 0.00% 0.00% 0.00% 0.00%
Iredell Memorial Hospital, Incorporated $0 $0 $0 $0 $0 $0 $0 $0 $0 0.00% $0 $0 0.00% 0.00% 0.00% 0.00% 0.00%
New Hanover Health Network $3,053,556 $0 $0 $0 $0 $0 $0 $0 $0 0.00% $3,053,556 $0 0.00% 0.00% 0.00% 0.00% 0.00%
Stokes-Reynolds Memorial Hospital, Inc. $0 $0 $0 $0 $0 $0 $0 $0 $0 0.00% $0 $0 0.00% 0.00% 0.00% 0.00% 0.00%
TOTALS $3,053,556 $0 $0 $0 $0 $0 $0 $0 $0 0.00% $3,053,556 $0 0.00% 0.00% 0.00% 0.00% 0.00%
% of Total Purchasing 0.00% 0.00% 0.00% 0.00% 0.00% 0.00% 0.00% 0.00%
0.00% 0.00% 0.00% 0.00% 0.00% 0.00% 0.00% 0.00%
Q1
Albemarle Hospital Authority (DNS) $0 $0 $0 $0 $0 $0 $0 $0 $0 0.00%
Cape Fear Valley Health System (DNS) $0 $0 $0 $0 $0 $0 $0 $0 $0 0.00%
Carteret County General Hospital Corporation (DNS) $0 $0 $0 $0 $0 $0 $0 $0 $0 0.00%
Granville Medical Center $0 $0 $0 $0 $0 $0 $0 $0 $0 0.00%
Iredell Memorial Hospital, Incorporated (DNS) $0 $0 $0 $0 $0 $0 $0 $0 $0 0.00%
New Hanover Health Network $2,364,545 $0 $0 $0 $0 $0 $0 $0 $0 0.00%
Pioneer Community Hospital of Stokes (DNS) $0 $0 $0 $0 $0 $0 $0 $0 $0 0.00%
TOTALS $2,364,545 $0 $0 $0 $0 $0 $0 $0 $0 0.00%
0.00% 0.00% 0.00% 0.00% 0.00% 0.00% 0.00% 0.00%
Q2
Albemarle Hospital Authority (DNS) $0 $0 $0 $0 $0 $0 $0 $0 $0 0.00% $0 $0 0.00% 0.00%
Cape Fear Valley Health System (DNS) $0 $0 $0 $0 $0 $0 $0 $0 $0 0.00% $0 $0 0.00% 0.00%
Carteret County General Hospital Corporation (DNS) $0 $0 $0 $0 $0 $0 $0 $0 $0 0.00% $0 $0 0.00% 0.00%
Granville Medical Center $0 $0 $0 $0 $0 $0 $0 $0 $0 0.00% $0 $0 0.00% 0.00%
% of Minority Participation
HUB PARTICIPATION REPORT - CONSTRUCTION (Includes FORMAL and
INFORMAL Projects)YEAR-TO-DATE SUMMARY
NORTH CAROLINA DEPARTMENT OF ADMINISTRATION
OFFICE FOR HISTORICALLY UNDERUTILIZED BUSINESSES
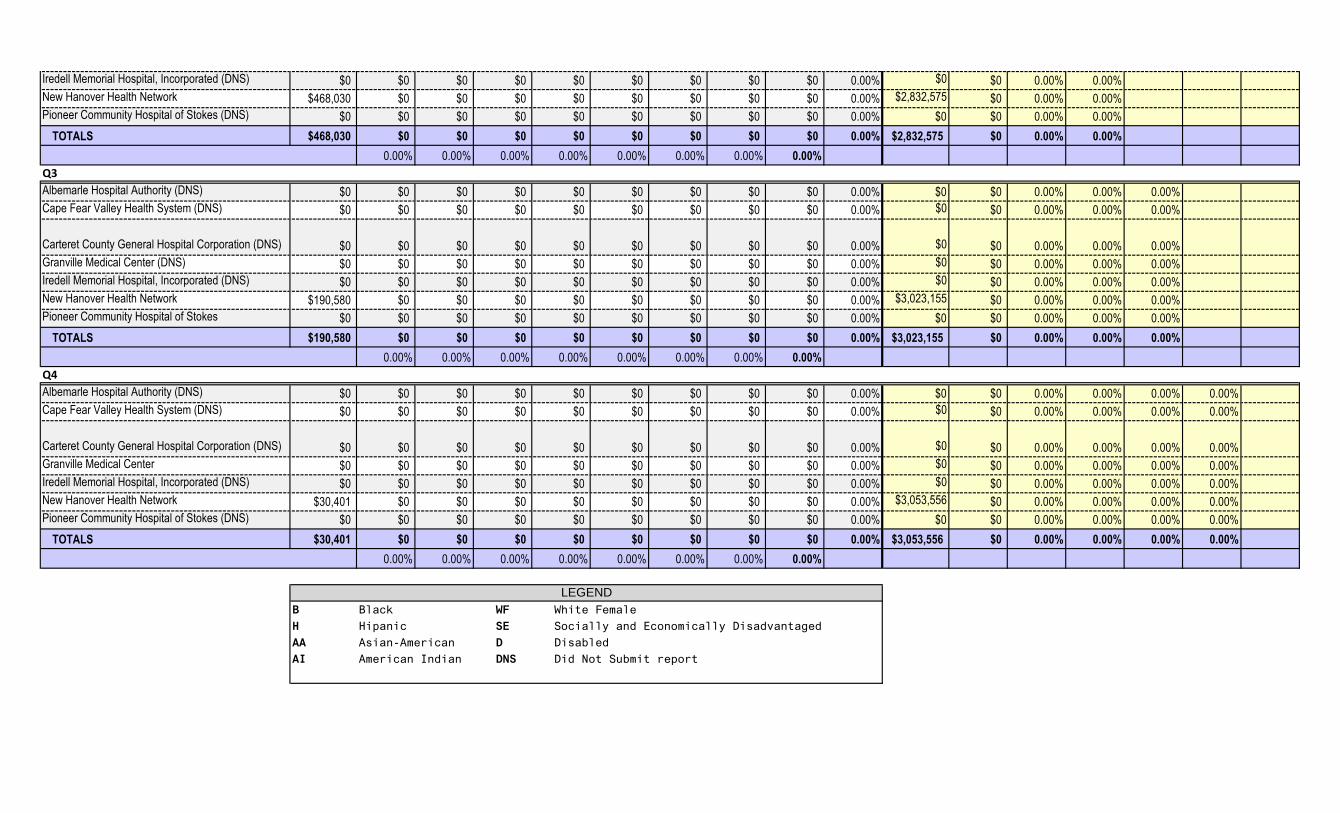
Iredell Memorial Hospital, Incorporated (DNS) $0 $0 $0 $0 $0 $0 $0 $0 $0 0.00% $0 $0 0.00% 0.00%
New Hanover Health Network $468,030 $0 $0 $0 $0 $0 $0 $0 $0 0.00% $2,832,575 $0 0.00% 0.00%
Pioneer Community Hospital of Stokes (DNS) $0 $0 $0 $0 $0 $0 $0 $0 $0 0.00% $0 $0 0.00% 0.00%
TOTALS $468,030 $0 $0 $0 $0 $0 $0 $0 $0 0.00% $2,832,575 $0 0.00% 0.00%
0.00% 0.00% 0.00% 0.00% 0.00% 0.00% 0.00% 0.00%
Q3
Albemarle Hospital Authority (DNS) $0 $0 $0 $0 $0 $0 $0 $0 $0 0.00% $0 $0 0.00% 0.00% 0.00%
Cape Fear Valley Health System (DNS) $0 $0 $0 $0 $0 $0 $0 $0 $0 0.00% $0 $0 0.00% 0.00% 0.00%
Carteret County General Hospital Corporation (DNS) $0 $0 $0 $0 $0 $0 $0 $0 $0 0.00% $0 $0 0.00% 0.00% 0.00%
Granville Medical Center (DNS) $0 $0 $0 $0 $0 $0 $0 $0 $0 0.00% $0 $0 0.00% 0.00% 0.00%
Iredell Memorial Hospital, Incorporated (DNS) $0 $0 $0 $0 $0 $0 $0 $0 $0 0.00% $0 $0 0.00% 0.00% 0.00%
New Hanover Health Network $190,580 $0 $0 $0 $0 $0 $0 $0 $0 0.00% $3,023,155 $0 0.00% 0.00% 0.00%
Pioneer Community Hospital of Stokes $0 $0 $0 $0 $0 $0 $0 $0 $0 0.00% $0 $0 0.00% 0.00% 0.00%
TOTALS $190,580 $0 $0 $0 $0 $0 $0 $0 $0 0.00% $3,023,155 $0 0.00% 0.00% 0.00%
0.00% 0.00% 0.00% 0.00% 0.00% 0.00% 0.00% 0.00%
Q4
Albemarle Hospital Authority (DNS) $0 $0 $0 $0 $0 $0 $0 $0 $0 0.00% $0 $0 0.00% 0.00% 0.00% 0.00%
Cape Fear Valley Health System (DNS) $0 $0 $0 $0 $0 $0 $0 $0 $0 0.00% $0 $0 0.00% 0.00% 0.00% 0.00%
Carteret County General Hospital Corporation (DNS) $0 $0 $0 $0 $0 $0 $0 $0 $0 0.00% $0 $0 0.00% 0.00% 0.00% 0.00%
Granville Medical Center $0 $0 $0 $0 $0 $0 $0 $0 $0 0.00% $0 $0 0.00% 0.00% 0.00% 0.00%
Iredell Memorial Hospital, Incorporated (DNS) $0 $0 $0 $0 $0 $0 $0 $0 $0 0.00% $0 $0 0.00% 0.00% 0.00% 0.00%
New Hanover Health Network $30,401 $0 $0 $0 $0 $0 $0 $0 $0 0.00% $3,053,556 $0 0.00% 0.00% 0.00% 0.00%
Pioneer Community Hospital of Stokes (DNS) $0 $0 $0 $0 $0 $0 $0 $0 $0 0.00% $0 $0 0.00% 0.00% 0.00% 0.00%
TOTALS $30,401 $0 $0 $0 $0 $0 $0 $0 $0 0.00% $3,053,556 $0 0.00% 0.00% 0.00% 0.00%
0.00% 0.00% 0.00% 0.00% 0.00% 0.00% 0.00% 0.00%
B Black WF White Female
H Hipanic SE Socially and Economically Disadvantaged
AA Asian-American D Disabled
AI American Indian DNS Did Not Submit report
LEGEND

FY 2011-2012
(7/1/2011-6/30/2012)
MUNICIPALITIES
To
tal
De
pt.
($)
B (
$)
H (
$)
AA
($
)
AI
($)
WF
($
)
SE
($
)
D (
$)
To
tal
HU
B
($)
To
tal
HU
B
(%)
YT
D T
ota
l ($
)
YT
D H
UB
($
)
YT
D H
UB
(%)
Q1
HU
B (
%)
Q2
HU
B (
%)
Q3
HU
B (
%)
Q4
HU
B (
%)
City of Albemarle $3,509,294 $371,618 $0 $0 $0 $328,087 $0 $0 $699,705 19.94% $3,509,294 $699,705 19.94% 0.00% 0.00% 19.94% 0.00%
City of Archdale $0 $0 $0 $0 $0 $0 $0 $0 $0 0.00% $0 $0 0.00% 0.00% 0.00% 0.00% 0.00%
City of Asheboro $0 $0 $0 $0 $0 $0 $0 $0 $0 0.00% $0 $0 0.00% 0.00% 0.00% 0.00% 0.00%
City of Asheville $210,532 $0 $0 $0 $0 $0 $0 $0 $0 0.00% $210,532 $0 0.00% 0.00% 0.00% 0.00% 0.00%
City of Charlotte $0 $0 $0 $0 $0 $0 $0 $0 $0 0.00% $0 $0 0.00% 0.00% 0.00% 0.00% 0.00%
City of Concord $0 $0 $0 $0 $0 $0 $0 $0 $0 0.00% $0 $0 0.00% 0.00% 0.00% 0.00% 0.00%
City of Durham $287,835 $0 $0 $0 $0 $63,800 $0 $0 $63,800 22.17% $287,835 $63,800 22.17% 22.17% 0.00% 0.00% 0.00%
City of Eden $406,470 $0 $0 $0 $0 $19,820 $0 $0 $19,820 4.88% $406,470 $19,820 4.88% 0.00% 4.88% 0.00% 0.00%
City of Elizabeth City $0 $0 $0 $0 $0 $0 $0 $0 $0 0.00% $0 $0 0.00% 0.00% 0.00% 0.00% 0.00%
City of Fayetteville $0 $0 $0 $0 $0 $0 $0 $0 $0 0.00% $0 $0 0.00% 0.00% 0.00% 0.00% 0.00%
City of Goldsboro $1,061,495 $4,494 $0 $0 $0 $151,071 $0 $0 $155,565 14.66% $1,061,495 $155,565 14.66% 68.24% 3.28% 0.00% 0.00%
City of Greenville $255,948 $0 $0 $0 $0 $0 $0 $0 $0 0.00% $255,948 $0 0.00% 0.00% 0.00% 0.00% 0.00%
City of Hickory $0 $0 $0 $0 $0 $0 $0 $0 $0 0.00% $0 $0 0.00% 0.00% 0.00% 0.00% 0.00%
City of High Point $0 $0 $0 $0 $0 $0 $0 $0 $0 0.00% $0 $0 0.00% 0.00% 0.00% 0.00% 0.00%
City of Jacksonville $2,190,317 $0 $114,658 $0 $0 $73,038 $0 $9,339 $197,035 9.00% $2,190,317 $197,035 9.00% 5.15% 40.86% 0.00% 100.00%
City of Kannapolis $0 $0 $0 $0 $0 $0 $0 $0 $0 0.00% $0 $0 0.00% 0.00% 0.00% 0.00% 0.00%
City of Kings Mountain $0 $0 $0 $0 $0 $0 $0 $0 $0 0.00% $0 $0 0.00% 0.00% 0.00% 0.00% 0.00%
City of Kinston $0 $0 $0 $0 $0 $0 $0 $0 $0 0.00% $0 $0 0.00% 0.00% 0.00% 0.00% 0.00%
City of Lexington $1,426,302 $0 $0 $0 $0 $0 $0 $0 $0 0.00% $1,426,302 $0 0.00% 0.00% 0.00% 0.00% 0.00%
City of Raleigh $0 $0 $0 $0 $0 $0 $0 $0 $0 0.00% $0 $0 0.00% 0.00% 0.00% 0.00% 0.00%
City of Reidsville $0 $0 $0 $0 $0 $0 $0 $0 $0 0.00% $0 $0 0.00% 0.00% 0.00% 0.00% 0.00%
City of Roanoke Rapids $0 $0 $0 $0 $0 $0 $0 $0 $0 0.00% $0 $0 0.00% 0.00% 0.00% 0.00% 0.00%
City of Rockingham $0 $0 $0 $0 $0 $0 $0 $0 $0 0.00% $0 $0 0.00% 0.00% 0.00% 0.00% 0.00%
City of Rocky Mount $1,038,953 $0 $0 $0 $0 $0 $0 $0 $0 0.00% $1,038,953 $0 0.00% 0.00% 0.00% 0.00% 0.00%
City of Salisbury $0 $0 $0 $0 $0 $0 $0 $0 $0 0.00% $0 $0 0.00% 0.00% 0.00% 0.00% 0.00%
City of Sanford $0 $0 $0 $0 $0 $0 $0 $0 $0 0.00% $0 $0 0.00% 0.00% 0.00% 0.00% 0.00%
City of Southport $0 $0 $0 $0 $0 $0 $0 $0 $0 0.00% $0 $0 0.00% 0.00% 0.00% 0.00% 0.00%
City of Statesville $3,677,738 $0 $25,500 $0 $0 $143,605 $0 $0 $169,105 4.60% $3,677,738 $169,105 4.60% 0.00% 0.00% 0.00% 4.60%
City of Thomasville $0 $0 $0 $0 $0 $0 $0 $0 $0 0.00% $0 $0 0.00% 0.00% 0.00% 0.00% 0.00%
City of Trinity $0 $0 $0 $0 $0 $0 $0 $0 $0 0.00% $0 $0 0.00% 0.00% 0.00% 0.00% 0.00%
HUB PARTICIPATION REPORT - CONSTRUCTION (Includes FORMAL and
INFORMAL Projects)YEAR-TO-DATE SUMMARY
NORTH CAROLINA DEPARTMENT OF ADMINISTRATION
OFFICE FOR HISTORICALLY UNDERUTILIZED BUSINESSES

City of Wilmington $0 $0 $0 $0 $0 $0 $0 $0 $0 0.00% $0 $0 0.00% 0.00% 0.00% 0.00% 0.00%
City of Wilson $276,037 $129,257 $0 $0 $0 $0 $0 $0 $129,257 46.83% $276,037 $129,257 46.83% 0.00% 0.00% 54.75% 0.00%
City of Winston-Salem $129,276,859 $1,862,439 $523,448 $531 $11,023 $6,600,951 $413,228 $0 $9,411,620 7.28% $129,276,859 $9,411,619 7.28% 15.51% 5.56% 26.43% 51.31%
Public Works Commission - Fayetteville $0 $0 $0 $0 $0 $0 $0 $0 $0 0.00% $0 $0 0.00% 0.00% 0.00% 0.00% 0.00%
Town of Beaufort $0 $0 $0 $0 $0 $0 $0 $0 $0 0.00% $0 $0 0.00% 0.00% 0.00% 0.00% 0.00%
Town of Blowing Rock $0 $0 $0 $0 $0 $0 $0 $0 $0 0.00% $0 $0 0.00% 0.00% 0.00% 0.00% 0.00%
Town of Bolivia $0 $0 $0 $0 $0 $0 $0 $0 $0 0.00% $0 $0 0.00% 0.00% 0.00% 0.00% 0.00%
Town of Bridgeton $0 $0 $0 $0 $0 $0 $0 $0 $0 0.00% $0 $0 0.00% 0.00% 0.00% 0.00% 0.00%
Town of Broadway $0 $0 $0 $0 $0 $0 $0 $0 $0 0.00% $0 $0 0.00% 0.00% 0.00% 0.00% 0.00%
Town of Calabash $0 $0 $0 $0 $0 $0 $0 $0 $0 0.00% $0 $0 0.00% 0.00% 0.00% 0.00% 0.00%
Town of Calypso $0 $0 $0 $0 $0 $0 $0 $0 $0 0.00% $0 $0 0.00% 0.00% 0.00% 0.00% 0.00%
Town of Cape Cateret $0 $0 $0 $0 $0 $0 $0 $0 $0 0.00% $0 $0 0.00% 0.00% 0.00% 0.00% 0.00%
Town of Carrboro $0 $0 $0 $0 $0 $0 $0 $0 $0 0.00% $0 $0 0.00% 0.00% 0.00% 0.00% 0.00%
Town of Chapel Hill $0 $0 $0 $0 $0 $0 $0 $0 $0 0.00% $0 $0 0.00% 0.00% 0.00% 0.00% 0.00%
Town of Clarkton $0 $0 $0 $0 $0 $0 $0 $0 $0 0.00% $0 $0 0.00% 0.00% 0.00% 0.00% 0.00%
Town of Conway $0 $0 $0 $0 $0 $0 $0 $0 $0 0.00% $0 $0 0.00% 0.00% 0.00% 0.00% 0.00%
Town of Dillsboro $0 $0 $0 $0 $0 $0 $0 $0 $0 0.00% $0 $0 0.00% 0.00% 0.00% 0.00% 0.00%
Town of Granite Falls $2,937,155 $0 $0 $0 $0 $238,472 $0 $0 $238,472 8.12% $2,937,155 $238,472 8.12% 0.00% 0.00% 0.00% 8.12%
Town of Harrells $0 $0 $0 $0 $0 $0 $0 $0 $0 0.00% $0 $0 0.00% 0.00% 0.00% 0.00% 0.00%
Town of Harrellsville $0 $0 $0 $0 $0 $0 $0 $0 $0 0.00% $0 $0 0.00% 0.00% 0.00% 0.00% 0.00%
Town of Hobgood $0 $0 $0 $0 $0 $0 $0 $0 $0 0.00% $0 $0 0.00% 0.00% 0.00% 0.00% 0.00%
Town of Hoffman $0 $0 $0 $0 $0 $0 $0 $0 $0 0.00% $0 $0 0.00% 0.00% 0.00% 0.00% 0.00%
Town of Holly Ridge $0 $0 $0 $0 $0 $0 $0 $0 $0 0.00% $0 $0 0.00% 0.00% 0.00% 0.00% 0.00%
Town of Huntersville $0 $0 $0 $0 $0 $0 $0 $0 $0 0.00% $0 $0 0.00% 0.00% 0.00% 0.00% 0.00%
Town of Kernersville $0 $0 $0 $0 $0 $0 $0 $0 $0 0.00% $0 $0 0.00% 0.00% 0.00% 0.00% 0.00%
Town of Kitty Hawk $0 $0 $0 $0 $0 $0 $0 $0 $0 0.00% $0 $0 0.00% 0.00% 0.00% 0.00% 0.00%
Town of Lewisville $0 $0 $0 $0 $0 $0 $0 $0 $0 0.00% $0 $0 0.00% 0.00% 0.00% 0.00% 0.00%
Town of Littleton $0 $0 $0 $0 $0 $0 $0 $0 $0 0.00% $0 $0 0.00% 0.00% 0.00% 0.00% 0.00%
Town of Mills River $0 $0 $0 $0 $0 $0 $0 $0 $0 0.00% $0 $0 0.00% 0.00% 0.00% 0.00% 0.00%
Town of Momeyer $0 $0 $0 $0 $0 $0 $0 $0 $0 0.00% $0 $0 0.00% 0.00% 0.00% 0.00% 0.00%
Town of Mt. Gilead $0 $0 $0 $0 $0 $0 $0 $0 $0 0.00% $0 $0 0.00% 0.00% 0.00% 0.00% 0.00%
Town of Pikeville $0 $0 $0 $0 $0 $0 $0 $0 $0 0.00% $0 $0 0.00% 0.00% 0.00% 0.00% 0.00%
Town of Pleasant Garden $0 $0 $0 $0 $0 $0 $0 $0 $0 0.00% $0 $0 0.00% 0.00% 0.00% 0.00% 0.00%
Town of Princeton $0 $0 $0 $0 $0 $0 $0 $0 $0 0.00% $0 $0 0.00% 0.00% 0.00% 0.00% 0.00%
Town of Rhodhiss $0 $0 $0 $0 $0 $0 $0 $0 $0 0.00% $0 $0 0.00% 0.00% 0.00% 0.00% 0.00%
Town of Richlands $0 $0 $0 $0 $0 $0 $0 $0 $0 0.00% $0 $0 0.00% 0.00% 0.00% 0.00% 0.00%
Town of Rosman $0 $0 $0 $0 $0 $0 $0 $0 $0 0.00% $0 $0 0.00% 0.00% 0.00% 0.00% 0.00%
Town of Salemburg $0 $0 $0 $0 $0 $0 $0 $0 $0 0.00% $0 $0 0.00% 0.00% 0.00% 0.00% 0.00%
Town of Saratoga $0 $0 $0 $0 $0 $0 $0 $0 $0 0.00% $0 $0 0.00% 0.00% 0.00% 0.00% 0.00%
Town of Saratoga $0 $0 $0 $0 $0 $0 $0 $0 $0 0.00% $0 $0 0.00% 0.00% 0.00% 0.00% 0.00%
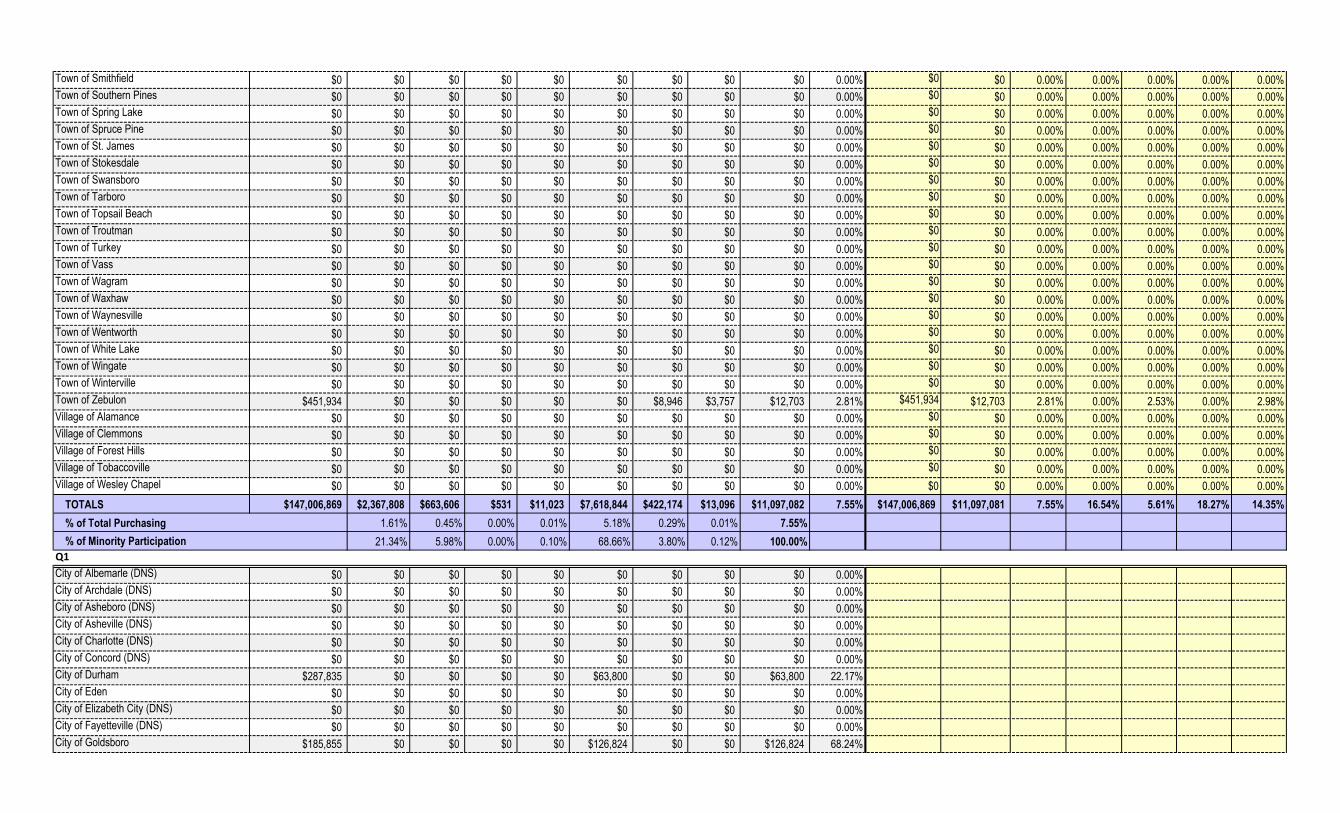
Town of Smithfield $0 $0 $0 $0 $0 $0 $0 $0 $0 0.00% $0 $0 0.00% 0.00% 0.00% 0.00% 0.00%
Town of Southern Pines $0 $0 $0 $0 $0 $0 $0 $0 $0 0.00% $0 $0 0.00% 0.00% 0.00% 0.00% 0.00%
Town of Spring Lake $0 $0 $0 $0 $0 $0 $0 $0 $0 0.00% $0 $0 0.00% 0.00% 0.00% 0.00% 0.00%
Town of Spruce Pine $0 $0 $0 $0 $0 $0 $0 $0 $0 0.00% $0 $0 0.00% 0.00% 0.00% 0.00% 0.00%
Town of St. James $0 $0 $0 $0 $0 $0 $0 $0 $0 0.00% $0 $0 0.00% 0.00% 0.00% 0.00% 0.00%
Town of Stokesdale $0 $0 $0 $0 $0 $0 $0 $0 $0 0.00% $0 $0 0.00% 0.00% 0.00% 0.00% 0.00%
Town of Swansboro $0 $0 $0 $0 $0 $0 $0 $0 $0 0.00% $0 $0 0.00% 0.00% 0.00% 0.00% 0.00%
Town of Tarboro $0 $0 $0 $0 $0 $0 $0 $0 $0 0.00% $0 $0 0.00% 0.00% 0.00% 0.00% 0.00%
Town of Topsail Beach $0 $0 $0 $0 $0 $0 $0 $0 $0 0.00% $0 $0 0.00% 0.00% 0.00% 0.00% 0.00%
Town of Troutman $0 $0 $0 $0 $0 $0 $0 $0 $0 0.00% $0 $0 0.00% 0.00% 0.00% 0.00% 0.00%
Town of Turkey $0 $0 $0 $0 $0 $0 $0 $0 $0 0.00% $0 $0 0.00% 0.00% 0.00% 0.00% 0.00%
Town of Vass $0 $0 $0 $0 $0 $0 $0 $0 $0 0.00% $0 $0 0.00% 0.00% 0.00% 0.00% 0.00%
Town of Wagram $0 $0 $0 $0 $0 $0 $0 $0 $0 0.00% $0 $0 0.00% 0.00% 0.00% 0.00% 0.00%
Town of Waxhaw $0 $0 $0 $0 $0 $0 $0 $0 $0 0.00% $0 $0 0.00% 0.00% 0.00% 0.00% 0.00%
Town of Waynesville $0 $0 $0 $0 $0 $0 $0 $0 $0 0.00% $0 $0 0.00% 0.00% 0.00% 0.00% 0.00%
Town of Wentworth $0 $0 $0 $0 $0 $0 $0 $0 $0 0.00% $0 $0 0.00% 0.00% 0.00% 0.00% 0.00%
Town of White Lake $0 $0 $0 $0 $0 $0 $0 $0 $0 0.00% $0 $0 0.00% 0.00% 0.00% 0.00% 0.00%
Town of Wingate $0 $0 $0 $0 $0 $0 $0 $0 $0 0.00% $0 $0 0.00% 0.00% 0.00% 0.00% 0.00%
Town of Winterville $0 $0 $0 $0 $0 $0 $0 $0 $0 0.00% $0 $0 0.00% 0.00% 0.00% 0.00% 0.00%
Town of Zebulon $451,934 $0 $0 $0 $0 $0 $8,946 $3,757 $12,703 2.81% $451,934 $12,703 2.81% 0.00% 2.53% 0.00% 2.98%
Village of Alamance $0 $0 $0 $0 $0 $0 $0 $0 $0 0.00% $0 $0 0.00% 0.00% 0.00% 0.00% 0.00%
Village of Clemmons $0 $0 $0 $0 $0 $0 $0 $0 $0 0.00% $0 $0 0.00% 0.00% 0.00% 0.00% 0.00%
Village of Forest Hills $0 $0 $0 $0 $0 $0 $0 $0 $0 0.00% $0 $0 0.00% 0.00% 0.00% 0.00% 0.00%
Village of Tobaccoville $0 $0 $0 $0 $0 $0 $0 $0 $0 0.00% $0 $0 0.00% 0.00% 0.00% 0.00% 0.00%
Village of Wesley Chapel $0 $0 $0 $0 $0 $0 $0 $0 $0 0.00% $0 $0 0.00% 0.00% 0.00% 0.00% 0.00%
TOTALS $147,006,869 $2,367,808 $663,606 $531 $11,023 $7,618,844 $422,174 $13,096 $11,097,082 7.55% $147,006,869 $11,097,081 7.55% 16.54% 5.61% 18.27% 14.35%
% of Total Purchasing 1.61% 0.45% 0.00% 0.01% 5.18% 0.29% 0.01% 7.55%
21.34% 5.98% 0.00% 0.10% 68.66% 3.80% 0.12% 100.00%
Q1
City of Albemarle (DNS) $0 $0 $0 $0 $0 $0 $0 $0 $0 0.00%
City of Archdale (DNS) $0 $0 $0 $0 $0 $0 $0 $0 $0 0.00%
City of Asheboro (DNS) $0 $0 $0 $0 $0 $0 $0 $0 $0 0.00%
City of Asheville (DNS) $0 $0 $0 $0 $0 $0 $0 $0 $0 0.00%
City of Charlotte (DNS) $0 $0 $0 $0 $0 $0 $0 $0 $0 0.00%
City of Concord (DNS) $0 $0 $0 $0 $0 $0 $0 $0 $0 0.00%
City of Durham $287,835 $0 $0 $0 $0 $63,800 $0 $0 $63,800 22.17%
City of Eden $0 $0 $0 $0 $0 $0 $0 $0 $0 0.00%
City of Elizabeth City (DNS) $0 $0 $0 $0 $0 $0 $0 $0 $0 0.00%
City of Fayetteville (DNS) $0 $0 $0 $0 $0 $0 $0 $0 $0 0.00%
City of Goldsboro $185,855 $0 $0 $0 $0 $126,824 $0 $0 $126,824 68.24%
% of Minority Participation
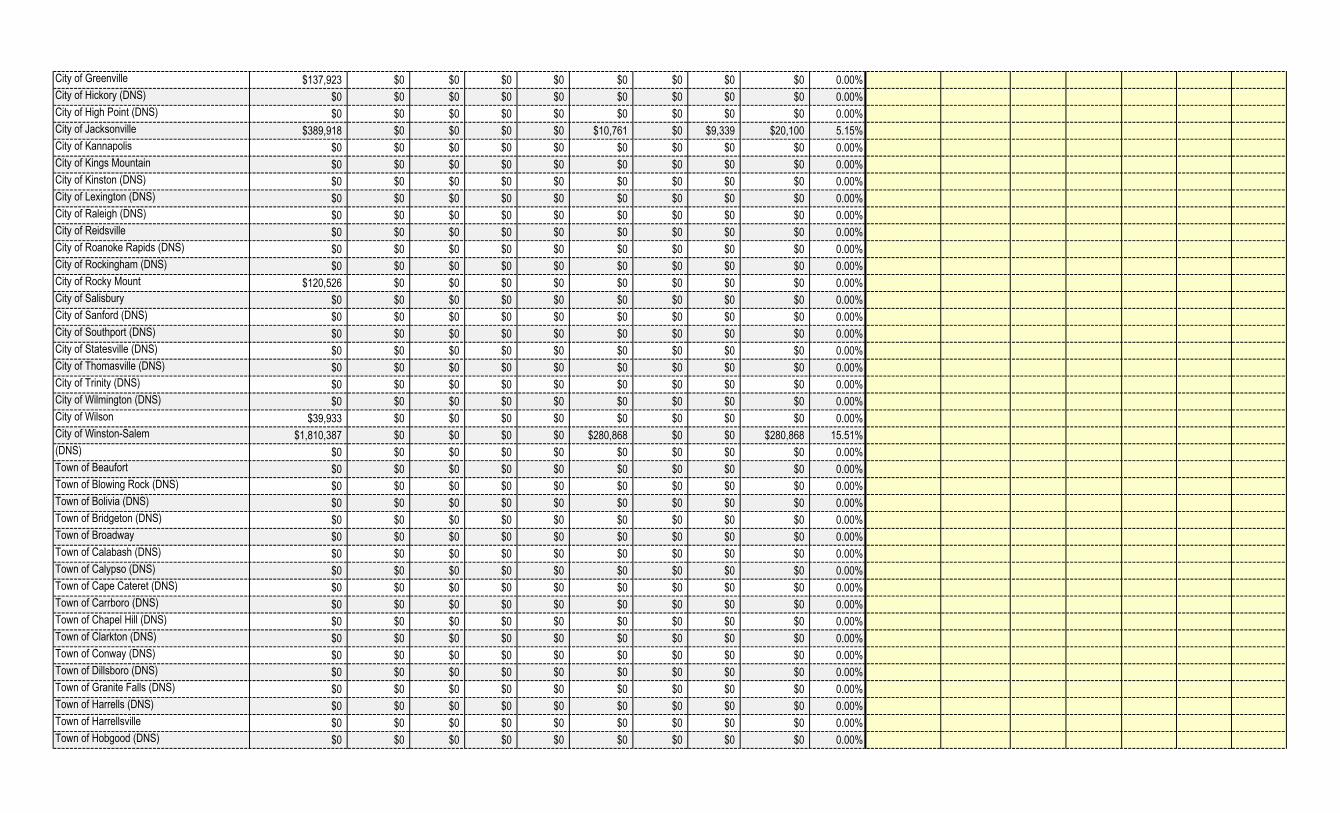
City of Greenville $137,923 $0 $0 $0 $0 $0 $0 $0 $0 0.00%
City of Hickory (DNS) $0 $0 $0 $0 $0 $0 $0 $0 $0 0.00%
City of High Point (DNS) $0 $0 $0 $0 $0 $0 $0 $0 $0 0.00%
City of Jacksonville $389,918 $0 $0 $0 $0 $10,761 $0 $9,339 $20,100 5.15%
City of Kannapolis $0 $0 $0 $0 $0 $0 $0 $0 $0 0.00%
City of Kings Mountain $0 $0 $0 $0 $0 $0 $0 $0 $0 0.00%
City of Kinston (DNS) $0 $0 $0 $0 $0 $0 $0 $0 $0 0.00%
City of Lexington (DNS) $0 $0 $0 $0 $0 $0 $0 $0 $0 0.00%
City of Raleigh (DNS) $0 $0 $0 $0 $0 $0 $0 $0 $0 0.00%
City of Reidsville $0 $0 $0 $0 $0 $0 $0 $0 $0 0.00%
City of Roanoke Rapids (DNS) $0 $0 $0 $0 $0 $0 $0 $0 $0 0.00%
City of Rockingham (DNS) $0 $0 $0 $0 $0 $0 $0 $0 $0 0.00%
City of Rocky Mount $120,526 $0 $0 $0 $0 $0 $0 $0 $0 0.00%
City of Salisbury $0 $0 $0 $0 $0 $0 $0 $0 $0 0.00%
City of Sanford (DNS) $0 $0 $0 $0 $0 $0 $0 $0 $0 0.00%
City of Southport (DNS) $0 $0 $0 $0 $0 $0 $0 $0 $0 0.00%
City of Statesville (DNS) $0 $0 $0 $0 $0 $0 $0 $0 $0 0.00%
City of Thomasville (DNS) $0 $0 $0 $0 $0 $0 $0 $0 $0 0.00%
City of Trinity (DNS) $0 $0 $0 $0 $0 $0 $0 $0 $0 0.00%
City of Wilmington (DNS) $0 $0 $0 $0 $0 $0 $0 $0 $0 0.00%
City of Wilson $39,933 $0 $0 $0 $0 $0 $0 $0 $0 0.00%
City of Winston-Salem $1,810,387 $0 $0 $0 $0 $280,868 $0 $0 $280,868 15.51%Public Works Commission - Fayetteville
(DNS) $0 $0 $0 $0 $0 $0 $0 $0 $0 0.00%
Town of Beaufort $0 $0 $0 $0 $0 $0 $0 $0 $0 0.00%
Town of Blowing Rock (DNS) $0 $0 $0 $0 $0 $0 $0 $0 $0 0.00%
Town of Bolivia (DNS) $0 $0 $0 $0 $0 $0 $0 $0 $0 0.00%
Town of Bridgeton (DNS) $0 $0 $0 $0 $0 $0 $0 $0 $0 0.00%
Town of Broadway $0 $0 $0 $0 $0 $0 $0 $0 $0 0.00%
Town of Calabash (DNS) $0 $0 $0 $0 $0 $0 $0 $0 $0 0.00%
Town of Calypso (DNS) $0 $0 $0 $0 $0 $0 $0 $0 $0 0.00%
Town of Cape Cateret (DNS) $0 $0 $0 $0 $0 $0 $0 $0 $0 0.00%
Town of Carrboro (DNS) $0 $0 $0 $0 $0 $0 $0 $0 $0 0.00%
Town of Chapel Hill (DNS) $0 $0 $0 $0 $0 $0 $0 $0 $0 0.00%
Town of Clarkton (DNS) $0 $0 $0 $0 $0 $0 $0 $0 $0 0.00%
Town of Conway (DNS) $0 $0 $0 $0 $0 $0 $0 $0 $0 0.00%
Town of Dillsboro (DNS) $0 $0 $0 $0 $0 $0 $0 $0 $0 0.00%
Town of Granite Falls (DNS) $0 $0 $0 $0 $0 $0 $0 $0 $0 0.00%
Town of Harrells (DNS) $0 $0 $0 $0 $0 $0 $0 $0 $0 0.00%
Town of Harrellsville $0 $0 $0 $0 $0 $0 $0 $0 $0 0.00%
Town of Hobgood (DNS) $0 $0 $0 $0 $0 $0 $0 $0 $0 0.00%

Town of Hoffman (DNS) $0 $0 $0 $0 $0 $0 $0 $0 $0 0.00%
Town of Holly Ridge $0 $0 $0 $0 $0 $0 $0 $0 $0 0.00%
Town of Huntersville (DNS) $0 $0 $0 $0 $0 $0 $0 $0 $0 0.00%
Town of Kernersville (DNS) $0 $0 $0 $0 $0 $0 $0 $0 $0 0.00%
Town of Kitty Hawk $0 $0 $0 $0 $0 $0 $0 $0 $0 0.00%
Town of Lewisville (DNS) $0 $0 $0 $0 $0 $0 $0 $0 $0 0.00%
Town of Littleton (DNS) $0 $0 $0 $0 $0 $0 $0 $0 $0 0.00%
Town of Mills River (DNS) $0 $0 $0 $0 $0 $0 $0 $0 $0 0.00%
Town of Momeyer $0 $0 $0 $0 $0 $0 $0 $0 $0 0.00%
Town of Mt. Gilead (DNS) $0 $0 $0 $0 $0 $0 $0 $0 $0 0.00%
Town of Pikeville $0 $0 $0 $0 $0 $0 $0 $0 $0 0.00%
Town of Pleasant Garden (DNS) $0 $0 $0 $0 $0 $0 $0 $0 $0 0.00%
Town of Princeton (DNS) $0 $0 $0 $0 $0 $0 $0 $0 $0 0.00%
Town of Rhodhiss $0 $0 $0 $0 $0 $0 $0 $0 $0 0.00%
Town of Richlands (DNS) $0 $0 $0 $0 $0 $0 $0 $0 $0 0.00%
Town of Rosman (DNS) $0 $0 $0 $0 $0 $0 $0 $0 $0 0.00%
Town of Salemburg $0 $0 $0 $0 $0 $0 $0 $0 $0 0.00%
Town of Saratoga (DNS) $0 $0 $0 $0 $0 $0 $0 $0 $0 0.00%
Town of Saratoga (DNS) $0 $0 $0 $0 $0 $0 $0 $0 $0 0.00%
Town of Smithfield (DNS) $0 $0 $0 $0 $0 $0 $0 $0 $0 0.00%
Town of Southern Pines $0 $0 $0 $0 $0 $0 $0 $0 $0 0.00%
Town of Spring Lake (DNS) $0 $0 $0 $0 $0 $0 $0 $0 $0 0.00%
Town of Spruce Pine $0 $0 $0 $0 $0 $0 $0 $0 $0 0.00%
Town of St. James (DNS) $0 $0 $0 $0 $0 $0 $0 $0 $0 0.00%
Town of Stokesdale $0 $0 $0 $0 $0 $0 $0 $0 $0 0.00%
Town of Swansboro (DNS) $0 $0 $0 $0 $0 $0 $0 $0 $0 0.00%
Town of Tarboro (DNS) $0 $0 $0 $0 $0 $0 $0 $0 $0 0.00%
Town of Topsail Beach (DNS) $0 $0 $0 $0 $0 $0 $0 $0 $0 0.00%
Town of Troutman (DNS) $0 $0 $0 $0 $0 $0 $0 $0 $0 0.00%
Town of Turkey $0 $0 $0 $0 $0 $0 $0 $0 $0 0.00%
Town of Vass (DNS) $0 $0 $0 $0 $0 $0 $0 $0 $0 0.00%
Town of Wagram (DNS) $0 $0 $0 $0 $0 $0 $0 $0 $0 0.00%
Town of Waxhaw $0 $0 $0 $0 $0 $0 $0 $0 $0 0.00%
Town of Waynesville $0 $0 $0 $0 $0 $0 $0 $0 $0 0.00%
Town of Wentworth (DNS) $0 $0 $0 $0 $0 $0 $0 $0 $0 0.00%
Town of White Lake (DNS) $0 $0 $0 $0 $0 $0 $0 $0 $0 0.00%
Town of Wingate (DNS) $0 $0 $0 $0 $0 $0 $0 $0 $0 0.00%
Town of Winterville (DNS) $0 $0 $0 $0 $0 $0 $0 $0 $0 0.00%
Town of Zebulon (DNS) $0 $0 $0 $0 $0 $0 $0 $0 $0 0.00%
Village of Alamance (DNS) $0 $0 $0 $0 $0 $0 $0 $0 $0 0.00%

Village of Clemmons (DNS) $0 $0 $0 $0 $0 $0 $0 $0 $0 0.00%
Village of Forest Hills $0 $0 $0 $0 $0 $0 $0 $0 $0 0.00%
Village of Tobaccoville $0 $0 $0 $0 $0 $0 $0 $0 $0 0.00%
Village of Wesley Chapel (DNS) $0 $0 $0 $0 $0 $0 $0 $0 $0 0.00%
TOTALS $2,972,377 $0 $0 $0 $0 $482,254 $0 $9,339 $491,593 16.54%
0.00% 0.00% 0.00% 0.00% 16.22% 0.00% 0.31% 16.54%
Q2
City of Albemarle $0 $0 $0 $0 $0 $0 $0 $0 $0 0.00% $0 $0 0.00% 0.00%
City of Archdale (DNS) $0 $0 $0 $0 $0 $0 $0 $0 $0 0.00% $0 $0 0.00% 0.00%
City of Asheboro (DNS) $0 $0 $0 $0 $0 $0 $0 $0 $0 0.00% $0 $0 0.00% 0.00%
City of Asheville (DNS) $0 $0 $0 $0 $0 $0 $0 $0 $0 0.00% $0 $0 0.00% 0.00%
City of Charlotte (DNS) $0 $0 $0 $0 $0 $0 $0 $0 $0 0.00% $0 $0 0.00% 0.00%
City of Concord (DNS) $0 $0 $0 $0 $0 $0 $0 $0 $0 0.00% $0 $0 0.00% 0.00%
City of Durham (DNS) $0 $0 $0 $0 $0 $0 $0 $0 $0 0.00% $287,835 $63,800 22.17% 22.17%
City of Eden $406,470 $0 $0 $0 $0 $19,820 $0 $0 $19,820 4.88% $406,470 $19,820 4.88% 0.00%
City of Elizabeth City (DNS) $0 $0 $0 $0 $0 $0 $0 $0 $0 0.00% $0 $0 0.00% 0.00%
City of Fayetteville (DNS) $0 $0 $0 $0 $0 $0 $0 $0 $0 0.00% $0 $0 0.00% 0.00%
City of Goldsboro $875,640 $4,494 $0 $0 $0 $24,247 $0 $0 $28,741 3.28% $1,061,495 $155,565 14.66% 68.24%
City of Greenville (DNS) $0 $0 $0 $0 $0 $0 $0 $0 $0 0.00% $137,923 $0 0.00% 0.00%
City of Hickory (DNS) $0 $0 $0 $0 $0 $0 $0 $0 $0 0.00% $0 $0 0.00% 0.00%
City of High Point (DNS) $0 $0 $0 $0 $0 $0 $0 $0 $0 0.00% $0 $0 0.00% 0.00%
City of Jacksonville $280,589 $0 $114,658 $0 $0 $0 $0 $0 $114,658 40.86% $670,507 $134,758 20.10% 5.15%
City of Kannapolis (DNS) $0 $0 $0 $0 $0 $0 $0 $0 $0 0.00% $0 $0 0.00% 0.00%
City of Kings Mountain $0 $0 $0 $0 $0 $0 $0 $0 $0 0.00% $0 $0 0.00% 0.00%
City of Kinston (DNS) $0 $0 $0 $0 $0 $0 $0 $0 $0 0.00% $0 $0 0.00% 0.00%
City of Lexington $176,899 $0 $0 $0 $0 $0 $0 $0 $0 0.00% $176,899 $0 0.00% 0.00%
City of Raleigh (DNS) $0 $0 $0 $0 $0 $0 $0 $0 $0 0.00% $0 $0 0.00% 0.00%
City of Reidsville $0 $0 $0 $0 $0 $0 $0 $0 $0 0.00% $0 $0 0.00% 0.00%
City of Roanoke Rapids (DNS) $0 $0 $0 $0 $0 $0 $0 $0 $0 0.00% $0 $0 0.00% 0.00%
City of Rockingham (DNS) $0 $0 $0 $0 $0 $0 $0 $0 $0 0.00% $0 $0 0.00% 0.00%
City of Rocky Mount $0 $0 $0 $0 $0 $0 $0 $0 $0 0.00% $120,526 $0 0.00% 0.00%
City of Salisbury $0 $0 $0 $0 $0 $0 $0 $0 $0 0.00% $0 $0 0.00% 0.00%
City of Sanford (DNS) $0 $0 $0 $0 $0 $0 $0 $0 $0 0.00% $0 $0 0.00% 0.00%
City of Southport (DNS) $0 $0 $0 $0 $0 $0 $0 $0 $0 0.00% $0 $0 0.00% 0.00%
City of Statesville (DNS) $0 $0 $0 $0 $0 $0 $0 $0 $0 0.00% $0 $0 0.00% 0.00%
City of Thomasville (DNS) $0 $0 $0 $0 $0 $0 $0 $0 $0 0.00% $0 $0 0.00% 0.00%
City of Trinity (DNS) $0 $0 $0 $0 $0 $0 $0 $0 $0 0.00% $0 $0 0.00% 0.00%
City of Wilmington $0 $0 $0 $0 $0 $0 $0 $0 $0 0.00% $0 $0 0.00% 0.00%
City of Wilson $0 $0 $0 $0 $0 $0 $0 $0 $0 0.00% $39,933 $0 0.00% 0.00%
City of Winston-Salem $119,445,661 $1,653,860 $285,580 $531 $0 $4,283,300 $413,228 $0 $6,636,498 5.56% $121,256,048 $6,917,366 5.70% 15.51%

Public Works Commission - Fayetteville
(DNS) $0 $0 $0 $0 $0 $0 $0 $0 $0 0.00% $0 $0 0.00% 0.00%
Town of Beaufort $0 $0 $0 $0 $0 $0 $0 $0 $0 0.00% $0 $0 0.00% 0.00%
Town of Blowing Rock (DNS) $0 $0 $0 $0 $0 $0 $0 $0 $0 0.00% $0 $0 0.00% 0.00%
Town of Bolivia (DNS) $0 $0 $0 $0 $0 $0 $0 $0 $0 0.00% $0 $0 0.00% 0.00%
Town of Bridgeton (DNS) $0 $0 $0 $0 $0 $0 $0 $0 $0 0.00% $0 $0 0.00% 0.00%
Town of Broadway $0 $0 $0 $0 $0 $0 $0 $0 $0 0.00% $0 $0 0.00% 0.00%
Town of Calabash (DNS) $0 $0 $0 $0 $0 $0 $0 $0 $0 0.00% $0 $0 0.00% 0.00%
Town of Calypso (DNS) $0 $0 $0 $0 $0 $0 $0 $0 $0 0.00% $0 $0 0.00% 0.00%
Town of Cape Cateret (DNS) $0 $0 $0 $0 $0 $0 $0 $0 $0 0.00% $0 $0 0.00% 0.00%
Town of Carrboro $0 $0 $0 $0 $0 $0 $0 $0 $0 0.00% $0 $0 0.00% 0.00%
Town of Chapel Hill (DNS) $0 $0 $0 $0 $0 $0 $0 $0 $0 0.00% $0 $0 0.00% 0.00%
Town of Clarkton (DNS) $0 $0 $0 $0 $0 $0 $0 $0 $0 0.00% $0 $0 0.00% 0.00%
Town of Conway (DNS) $0 $0 $0 $0 $0 $0 $0 $0 $0 0.00% $0 $0 0.00% 0.00%
Town of Dillsboro (DNS) $0 $0 $0 $0 $0 $0 $0 $0 $0 0.00% $0 $0 0.00% 0.00%
Town of Granite Falls (DNS) $0 $0 $0 $0 $0 $0 $0 $0 $0 0.00% $0 $0 0.00% 0.00%
Town of Harrells (DNS) $0 $0 $0 $0 $0 $0 $0 $0 $0 0.00% $0 $0 0.00% 0.00%
Town of Harrellsville $0 $0 $0 $0 $0 $0 $0 $0 $0 0.00% $0 $0 0.00% 0.00%
Town of Hobgood (DNS) $0 $0 $0 $0 $0 $0 $0 $0 $0 0.00% $0 $0 0.00% 0.00%
Town of Hoffman (DNS) $0 $0 $0 $0 $0 $0 $0 $0 $0 0.00% $0 $0 0.00% 0.00%
Town of Holly Ridge $0 $0 $0 $0 $0 $0 $0 $0 $0 0.00% $0 $0 0.00% 0.00%
Town of Huntersville (DNS) $0 $0 $0 $0 $0 $0 $0 $0 $0 0.00% $0 $0 0.00% 0.00%
Town of Kernersville (DNS) $0 $0 $0 $0 $0 $0 $0 $0 $0 0.00% $0 $0 0.00% 0.00%
Town of Kitty Hawk $0 $0 $0 $0 $0 $0 $0 $0 $0 0.00% $0 $0 0.00% 0.00%
Town of Lewisville (DNS) $0 $0 $0 $0 $0 $0 $0 $0 $0 0.00% $0 $0 0.00% 0.00%
Town of Littleton (DNS) $0 $0 $0 $0 $0 $0 $0 $0 $0 0.00% $0 $0 0.00% 0.00%
Town of Mills River (DNS) $0 $0 $0 $0 $0 $0 $0 $0 $0 0.00% $0 $0 0.00% 0.00%
Town of Momeyer $0 $0 $0 $0 $0 $0 $0 $0 $0 0.00% $0 $0 0.00% 0.00%
Town of Mt. Gilead (DNS) $0 $0 $0 $0 $0 $0 $0 $0 $0 0.00% $0 $0 0.00% 0.00%
Town of Pikeville $0 $0 $0 $0 $0 $0 $0 $0 $0 0.00% $0 $0 0.00% 0.00%
Town of Pleasant Garden $0 $0 $0 $0 $0 $0 $0 $0 $0 0.00% $0 $0 0.00% 0.00%
Town of Princeton (DNS) $0 $0 $0 $0 $0 $0 $0 $0 $0 0.00% $0 $0 0.00% 0.00%
Town of Rhodhiss $0 $0 $0 $0 $0 $0 $0 $0 $0 0.00% $0 $0 0.00% 0.00%
Town of Richlands (DNS) $0 $0 $0 $0 $0 $0 $0 $0 $0 0.00% $0 $0 0.00% 0.00%
Town of Rosman (DNS) $0 $0 $0 $0 $0 $0 $0 $0 $0 0.00% $0 $0 0.00% 0.00%
Town of Salemburg $0 $0 $0 $0 $0 $0 $0 $0 $0 0.00% $0 $0 0.00% 0.00%
Town of Saratoga (DNS) $0 $0 $0 $0 $0 $0 $0 $0 $0 0.00% $0 $0 0.00% 0.00%
Town of Saratoga (DNS) $0 $0 $0 $0 $0 $0 $0 $0 $0 0.00% $0 $0 0.00% 0.00%
Town of Smithfield (DNS) $0 $0 $0 $0 $0 $0 $0 $0 $0 0.00% $0 $0 0.00% 0.00%
Town of Southern Pines $0 $0 $0 $0 $0 $0 $0 $0 $0 0.00% $0 $0 0.00% 0.00%
Town of Spring Lake (DNS) $0 $0 $0 $0 $0 $0 $0 $0 $0 0.00% $0 $0 0.00% 0.00%
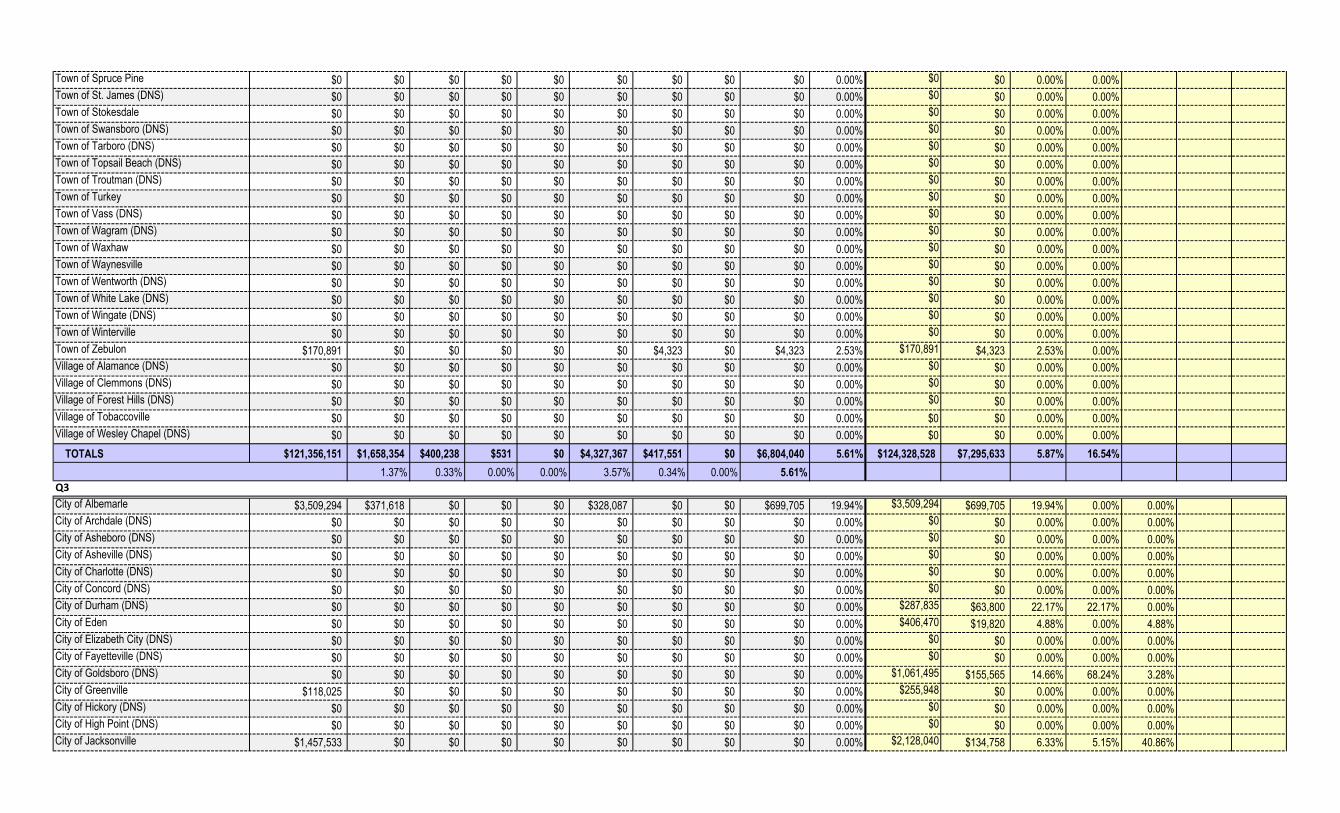
Town of Spruce Pine $0 $0 $0 $0 $0 $0 $0 $0 $0 0.00% $0 $0 0.00% 0.00%
Town of St. James (DNS) $0 $0 $0 $0 $0 $0 $0 $0 $0 0.00% $0 $0 0.00% 0.00%
Town of Stokesdale $0 $0 $0 $0 $0 $0 $0 $0 $0 0.00% $0 $0 0.00% 0.00%
Town of Swansboro (DNS) $0 $0 $0 $0 $0 $0 $0 $0 $0 0.00% $0 $0 0.00% 0.00%
Town of Tarboro (DNS) $0 $0 $0 $0 $0 $0 $0 $0 $0 0.00% $0 $0 0.00% 0.00%
Town of Topsail Beach (DNS) $0 $0 $0 $0 $0 $0 $0 $0 $0 0.00% $0 $0 0.00% 0.00%
Town of Troutman (DNS) $0 $0 $0 $0 $0 $0 $0 $0 $0 0.00% $0 $0 0.00% 0.00%
Town of Turkey $0 $0 $0 $0 $0 $0 $0 $0 $0 0.00% $0 $0 0.00% 0.00%
Town of Vass (DNS) $0 $0 $0 $0 $0 $0 $0 $0 $0 0.00% $0 $0 0.00% 0.00%
Town of Wagram (DNS) $0 $0 $0 $0 $0 $0 $0 $0 $0 0.00% $0 $0 0.00% 0.00%
Town of Waxhaw $0 $0 $0 $0 $0 $0 $0 $0 $0 0.00% $0 $0 0.00% 0.00%
Town of Waynesville $0 $0 $0 $0 $0 $0 $0 $0 $0 0.00% $0 $0 0.00% 0.00%
Town of Wentworth (DNS) $0 $0 $0 $0 $0 $0 $0 $0 $0 0.00% $0 $0 0.00% 0.00%
Town of White Lake (DNS) $0 $0 $0 $0 $0 $0 $0 $0 $0 0.00% $0 $0 0.00% 0.00%
Town of Wingate (DNS) $0 $0 $0 $0 $0 $0 $0 $0 $0 0.00% $0 $0 0.00% 0.00%
Town of Winterville $0 $0 $0 $0 $0 $0 $0 $0 $0 0.00% $0 $0 0.00% 0.00%
Town of Zebulon $170,891 $0 $0 $0 $0 $0 $4,323 $0 $4,323 2.53% $170,891 $4,323 2.53% 0.00%
Village of Alamance (DNS) $0 $0 $0 $0 $0 $0 $0 $0 $0 0.00% $0 $0 0.00% 0.00%
Village of Clemmons (DNS) $0 $0 $0 $0 $0 $0 $0 $0 $0 0.00% $0 $0 0.00% 0.00%
Village of Forest Hills (DNS) $0 $0 $0 $0 $0 $0 $0 $0 $0 0.00% $0 $0 0.00% 0.00%
Village of Tobaccoville $0 $0 $0 $0 $0 $0 $0 $0 $0 0.00% $0 $0 0.00% 0.00%
Village of Wesley Chapel (DNS) $0 $0 $0 $0 $0 $0 $0 $0 $0 0.00% $0 $0 0.00% 0.00%
TOTALS $121,356,151 $1,658,354 $400,238 $531 $0 $4,327,367 $417,551 $0 $6,804,040 5.61% $124,328,528 $7,295,633 5.87% 16.54%
1.37% 0.33% 0.00% 0.00% 3.57% 0.34% 0.00% 5.61%
Q3
City of Albemarle $3,509,294 $371,618 $0 $0 $0 $328,087 $0 $0 $699,705 19.94% $3,509,294 $699,705 19.94% 0.00% 0.00%
City of Archdale (DNS) $0 $0 $0 $0 $0 $0 $0 $0 $0 0.00% $0 $0 0.00% 0.00% 0.00%
City of Asheboro (DNS) $0 $0 $0 $0 $0 $0 $0 $0 $0 0.00% $0 $0 0.00% 0.00% 0.00%
City of Asheville (DNS) $0 $0 $0 $0 $0 $0 $0 $0 $0 0.00% $0 $0 0.00% 0.00% 0.00%
City of Charlotte (DNS) $0 $0 $0 $0 $0 $0 $0 $0 $0 0.00% $0 $0 0.00% 0.00% 0.00%
City of Concord (DNS) $0 $0 $0 $0 $0 $0 $0 $0 $0 0.00% $0 $0 0.00% 0.00% 0.00%
City of Durham (DNS) $0 $0 $0 $0 $0 $0 $0 $0 $0 0.00% $287,835 $63,800 22.17% 22.17% 0.00%
City of Eden $0 $0 $0 $0 $0 $0 $0 $0 $0 0.00% $406,470 $19,820 4.88% 0.00% 4.88%
City of Elizabeth City (DNS) $0 $0 $0 $0 $0 $0 $0 $0 $0 0.00% $0 $0 0.00% 0.00% 0.00%
City of Fayetteville (DNS) $0 $0 $0 $0 $0 $0 $0 $0 $0 0.00% $0 $0 0.00% 0.00% 0.00%
City of Goldsboro (DNS) $0 $0 $0 $0 $0 $0 $0 $0 $0 0.00% $1,061,495 $155,565 14.66% 68.24% 3.28%
City of Greenville $118,025 $0 $0 $0 $0 $0 $0 $0 $0 0.00% $255,948 $0 0.00% 0.00% 0.00%
City of Hickory (DNS) $0 $0 $0 $0 $0 $0 $0 $0 $0 0.00% $0 $0 0.00% 0.00% 0.00%
City of High Point (DNS) $0 $0 $0 $0 $0 $0 $0 $0 $0 0.00% $0 $0 0.00% 0.00% 0.00%
City of Jacksonville $1,457,533 $0 $0 $0 $0 $0 $0 $0 $0 0.00% $2,128,040 $134,758 6.33% 5.15% 40.86%

City of Kannapolis (DNS) $0 $0 $0 $0 $0 $0 $0 $0 $0 0.00% $0 $0 0.00% 0.00% 0.00%
City of Kings Mountain $0 $0 $0 $0 $0 $0 $0 $0 $0 0.00% $0 $0 0.00% 0.00% 0.00%
City of Kinston (DNS) $0 $0 $0 $0 $0 $0 $0 $0 $0 0.00% $0 $0 0.00% 0.00% 0.00%
City of Lexington $1,249,403 $0 $0 $0 $0 $0 $0 $0 $0 0.00% $1,426,302 $0 0.00% 0.00% 0.00%
City of Raleigh (DNS) $0 $0 $0 $0 $0 $0 $0 $0 $0 0.00% $0 $0 0.00% 0.00% 0.00%
City of Reidsville $0 $0 $0 $0 $0 $0 $0 $0 $0 0.00% $0 $0 0.00% 0.00% 0.00%
City of Roanoke Rapids (DNS) $0 $0 $0 $0 $0 $0 $0 $0 $0 0.00% $0 $0 0.00% 0.00% 0.00%
City of Rockingham (DNS) $0 $0 $0 $0 $0 $0 $0 $0 $0 0.00% $0 $0 0.00% 0.00% 0.00%
City of Rocky Mount $877,941 $0 $0 $0 $0 $0 $0 $0 $0 0.00% $998,467 $0 0.00% 0.00% 0.00%
City of Salisbury (DNS) $0 $0 $0 $0 $0 $0 $0 $0 $0 0.00% $0 $0 0.00% 0.00% 0.00%
City of Sanford (DNS) $0 $0 $0 $0 $0 $0 $0 $0 $0 0.00% $0 $0 0.00% 0.00% 0.00%
City of Southport (DNS) $0 $0 $0 $0 $0 $0 $0 $0 $0 0.00% $0 $0 0.00% 0.00% 0.00%
City of Statesville (DNS) $0 $0 $0 $0 $0 $0 $0 $0 $0 0.00% $0 $0 0.00% 0.00% 0.00%
City of Thomasville (DNS) $0 $0 $0 $0 $0 $0 $0 $0 $0 0.00% $0 $0 0.00% 0.00% 0.00%
City of Trinity (DNS) $0 $0 $0 $0 $0 $0 $0 $0 $0 0.00% $0 $0 0.00% 0.00% 0.00%
City of Wilmington $0 $0 $0 $0 $0 $0 $0 $0 $0 0.00% $0 $0 0.00% 0.00% 0.00%
City of Wilson $236,104 $129,257 $0 $0 $0 $0 $0 $0 $129,257 54.75% $276,037 $129,257 46.83% 0.00% 0.00%
City of Winston-Salem $6,516,741 $174,191 $229,563 $0 $0 $1,318,687 $0 $0 $1,722,441 26.43% $127,772,790 $8,639,807 6.76% 15.51% 5.56%Public Works Commission - Fayetteville
(DNS) $0 $0 $0 $0 $0 $0 $0 $0 $0 0.00% $0 $0 0.00% 0.00% 0.00%
Town of Beaufort $0 $0 $0 $0 $0 $0 $0 $0 $0 0.00% $0 $0 0.00% 0.00% 0.00%
Town of Blowing Rock (DNS) $0 $0 $0 $0 $0 $0 $0 $0 $0 0.00% $0 $0 0.00% 0.00% 0.00%
Town of Bolivia (DNS) $0 $0 $0 $0 $0 $0 $0 $0 $0 0.00% $0 $0 0.00% 0.00% 0.00%
Town of Bridgeton (DNS) $0 $0 $0 $0 $0 $0 $0 $0 $0 0.00% $0 $0 0.00% 0.00% 0.00%
Town of Broadway $0 $0 $0 $0 $0 $0 $0 $0 $0 0.00% $0 $0 0.00% 0.00% 0.00%
Town of Calabash (DNS) $0 $0 $0 $0 $0 $0 $0 $0 $0 0.00% $0 $0 0.00% 0.00% 0.00%
Town of Calypso (DNS) $0 $0 $0 $0 $0 $0 $0 $0 $0 0.00% $0 $0 0.00% 0.00% 0.00%
Town of Cape Cateret (DNS) $0 $0 $0 $0 $0 $0 $0 $0 $0 0.00% $0 $0 0.00% 0.00% 0.00%
Town of Carrboro $0 $0 $0 $0 $0 $0 $0 $0 $0 0.00% $0 $0 0.00% 0.00% 0.00%
Town of Chapel Hill (DNS) $0 $0 $0 $0 $0 $0 $0 $0 $0 0.00% $0 $0 0.00% 0.00% 0.00%
Town of Clarkton (DNS) $0 $0 $0 $0 $0 $0 $0 $0 $0 0.00% $0 $0 0.00% 0.00% 0.00%
Town of Conway (DNS) $0 $0 $0 $0 $0 $0 $0 $0 $0 0.00% $0 $0 0.00% 0.00% 0.00%
Town of Dillsboro (DNS) $0 $0 $0 $0 $0 $0 $0 $0 $0 0.00% $0 $0 0.00% 0.00% 0.00%
Town of Granite Falls (DNS) $0 $0 $0 $0 $0 $0 $0 $0 $0 0.00% $0 $0 0.00% 0.00% 0.00%
Town of Harrells (DNS) $0 $0 $0 $0 $0 $0 $0 $0 $0 0.00% $0 $0 0.00% 0.00% 0.00%
Town of Harrellsville $0 $0 $0 $0 $0 $0 $0 $0 $0 0.00% $0 $0 0.00% 0.00% 0.00%
Town of Hobgood (DNS) $0 $0 $0 $0 $0 $0 $0 $0 $0 0.00% $0 $0 0.00% 0.00% 0.00%
Town of Hoffman $0 $0 $0 $0 $0 $0 $0 $0 $0 0.00% $0 $0 0.00% 0.00% 0.00%
Town of Holly Ridge (DNS) $0 $0 $0 $0 $0 $0 $0 $0 $0 0.00% $0 $0 0.00% 0.00% 0.00%
Town of Huntersville (DNS) $0 $0 $0 $0 $0 $0 $0 $0 $0 0.00% $0 $0 0.00% 0.00% 0.00%
Town of Kernersville $0 $0 $0 $0 $0 $0 $0 $0 $0 0.00% $0 $0 0.00% 0.00% 0.00%
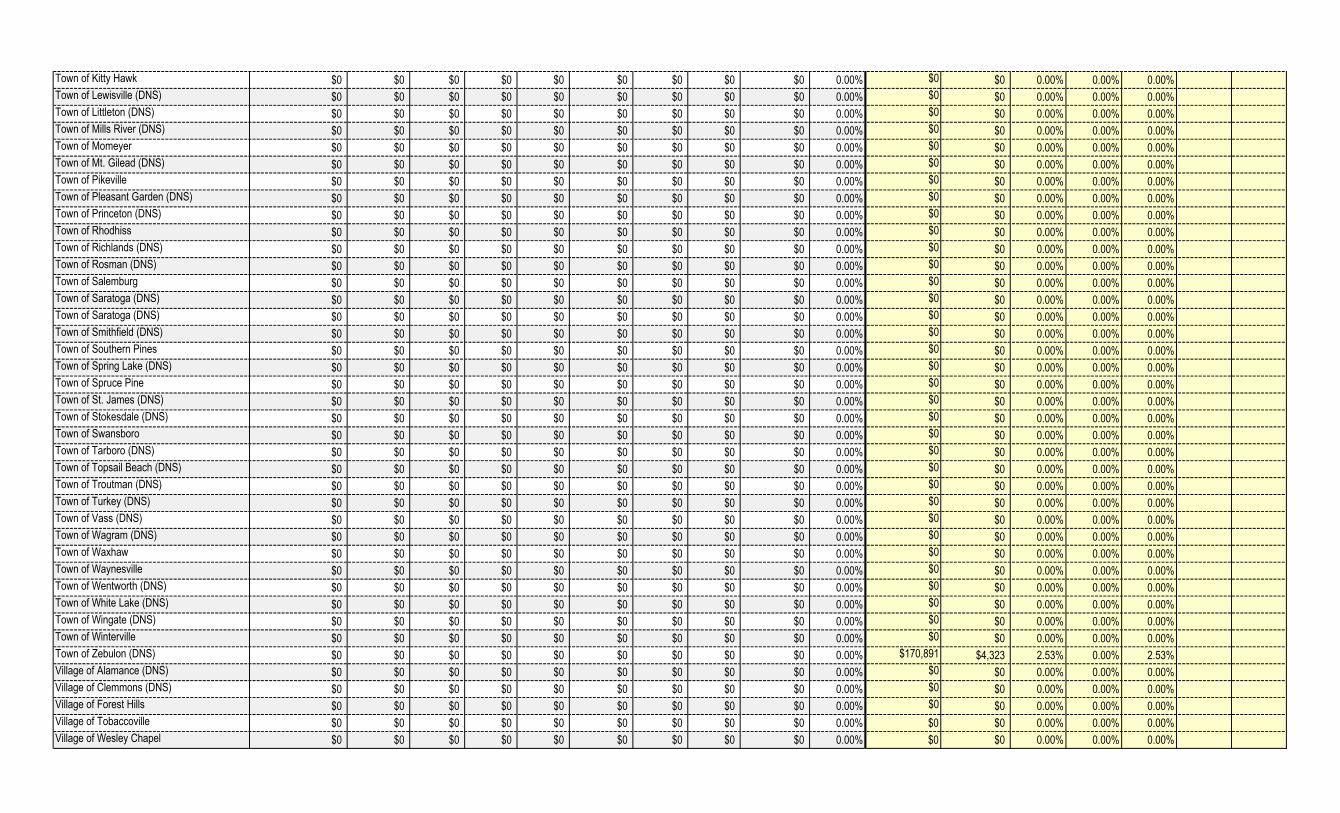
Town of Kitty Hawk $0 $0 $0 $0 $0 $0 $0 $0 $0 0.00% $0 $0 0.00% 0.00% 0.00%
Town of Lewisville (DNS) $0 $0 $0 $0 $0 $0 $0 $0 $0 0.00% $0 $0 0.00% 0.00% 0.00%
Town of Littleton (DNS) $0 $0 $0 $0 $0 $0 $0 $0 $0 0.00% $0 $0 0.00% 0.00% 0.00%
Town of Mills River (DNS) $0 $0 $0 $0 $0 $0 $0 $0 $0 0.00% $0 $0 0.00% 0.00% 0.00%
Town of Momeyer $0 $0 $0 $0 $0 $0 $0 $0 $0 0.00% $0 $0 0.00% 0.00% 0.00%
Town of Mt. Gilead (DNS) $0 $0 $0 $0 $0 $0 $0 $0 $0 0.00% $0 $0 0.00% 0.00% 0.00%
Town of Pikeville $0 $0 $0 $0 $0 $0 $0 $0 $0 0.00% $0 $0 0.00% 0.00% 0.00%
Town of Pleasant Garden (DNS) $0 $0 $0 $0 $0 $0 $0 $0 $0 0.00% $0 $0 0.00% 0.00% 0.00%
Town of Princeton (DNS) $0 $0 $0 $0 $0 $0 $0 $0 $0 0.00% $0 $0 0.00% 0.00% 0.00%
Town of Rhodhiss $0 $0 $0 $0 $0 $0 $0 $0 $0 0.00% $0 $0 0.00% 0.00% 0.00%
Town of Richlands (DNS) $0 $0 $0 $0 $0 $0 $0 $0 $0 0.00% $0 $0 0.00% 0.00% 0.00%
Town of Rosman (DNS) $0 $0 $0 $0 $0 $0 $0 $0 $0 0.00% $0 $0 0.00% 0.00% 0.00%
Town of Salemburg $0 $0 $0 $0 $0 $0 $0 $0 $0 0.00% $0 $0 0.00% 0.00% 0.00%
Town of Saratoga (DNS) $0 $0 $0 $0 $0 $0 $0 $0 $0 0.00% $0 $0 0.00% 0.00% 0.00%
Town of Saratoga (DNS) $0 $0 $0 $0 $0 $0 $0 $0 $0 0.00% $0 $0 0.00% 0.00% 0.00%
Town of Smithfield (DNS) $0 $0 $0 $0 $0 $0 $0 $0 $0 0.00% $0 $0 0.00% 0.00% 0.00%
Town of Southern Pines $0 $0 $0 $0 $0 $0 $0 $0 $0 0.00% $0 $0 0.00% 0.00% 0.00%
Town of Spring Lake (DNS) $0 $0 $0 $0 $0 $0 $0 $0 $0 0.00% $0 $0 0.00% 0.00% 0.00%
Town of Spruce Pine $0 $0 $0 $0 $0 $0 $0 $0 $0 0.00% $0 $0 0.00% 0.00% 0.00%
Town of St. James (DNS) $0 $0 $0 $0 $0 $0 $0 $0 $0 0.00% $0 $0 0.00% 0.00% 0.00%
Town of Stokesdale (DNS) $0 $0 $0 $0 $0 $0 $0 $0 $0 0.00% $0 $0 0.00% 0.00% 0.00%
Town of Swansboro $0 $0 $0 $0 $0 $0 $0 $0 $0 0.00% $0 $0 0.00% 0.00% 0.00%
Town of Tarboro (DNS) $0 $0 $0 $0 $0 $0 $0 $0 $0 0.00% $0 $0 0.00% 0.00% 0.00%
Town of Topsail Beach (DNS) $0 $0 $0 $0 $0 $0 $0 $0 $0 0.00% $0 $0 0.00% 0.00% 0.00%
Town of Troutman (DNS) $0 $0 $0 $0 $0 $0 $0 $0 $0 0.00% $0 $0 0.00% 0.00% 0.00%
Town of Turkey (DNS) $0 $0 $0 $0 $0 $0 $0 $0 $0 0.00% $0 $0 0.00% 0.00% 0.00%
Town of Vass (DNS) $0 $0 $0 $0 $0 $0 $0 $0 $0 0.00% $0 $0 0.00% 0.00% 0.00%
Town of Wagram (DNS) $0 $0 $0 $0 $0 $0 $0 $0 $0 0.00% $0 $0 0.00% 0.00% 0.00%
Town of Waxhaw $0 $0 $0 $0 $0 $0 $0 $0 $0 0.00% $0 $0 0.00% 0.00% 0.00%
Town of Waynesville $0 $0 $0 $0 $0 $0 $0 $0 $0 0.00% $0 $0 0.00% 0.00% 0.00%
Town of Wentworth (DNS) $0 $0 $0 $0 $0 $0 $0 $0 $0 0.00% $0 $0 0.00% 0.00% 0.00%
Town of White Lake (DNS) $0 $0 $0 $0 $0 $0 $0 $0 $0 0.00% $0 $0 0.00% 0.00% 0.00%
Town of Wingate (DNS) $0 $0 $0 $0 $0 $0 $0 $0 $0 0.00% $0 $0 0.00% 0.00% 0.00%
Town of Winterville $0 $0 $0 $0 $0 $0 $0 $0 $0 0.00% $0 $0 0.00% 0.00% 0.00%
Town of Zebulon (DNS) $0 $0 $0 $0 $0 $0 $0 $0 $0 0.00% $170,891 $4,323 2.53% 0.00% 2.53%
Village of Alamance (DNS) $0 $0 $0 $0 $0 $0 $0 $0 $0 0.00% $0 $0 0.00% 0.00% 0.00%
Village of Clemmons (DNS) $0 $0 $0 $0 $0 $0 $0 $0 $0 0.00% $0 $0 0.00% 0.00% 0.00%
Village of Forest Hills $0 $0 $0 $0 $0 $0 $0 $0 $0 0.00% $0 $0 0.00% 0.00% 0.00%
Village of Tobaccoville $0 $0 $0 $0 $0 $0 $0 $0 $0 0.00% $0 $0 0.00% 0.00% 0.00%
Village of Wesley Chapel $0 $0 $0 $0 $0 $0 $0 $0 $0 0.00% $0 $0 0.00% 0.00% 0.00%

TOTALS $13,965,041 $675,066 $229,563 $0 $0 $1,646,773 $0 $0 $2,551,402 18.27% $138,293,569 $9,847,035 7.12% 16.54% 5.61%
4.83% 1.64% 0.00% 0.00% 11.79% 0.00% 0.00% 18.27%
Q4
City of Albemarle $0 $0 $0 $0 $0 $0 $0 $0 $0 0.00% $3,509,294 $699,705 19.94% 0.00% 0.00% 19.94%
City of Archdale (DNS) $0 $0 $0 $0 $0 $0 $0 $0 $0 0.00% $0 $0 0.00% 0.00% 0.00% 0.00%
City of Asheboro (DNS) $0 $0 $0 $0 $0 $0 $0 $0 $0 0.00% $0 $0 0.00% 0.00% 0.00% 0.00%
City of Asheville $210,532 $0 $0 $0 $0 $0 $0 $0 $0 0.00% $210,532 $0 0.00% 0.00% 0.00% 0.00%
City of Charlotte (DNS) $0 $0 $0 $0 $0 $0 $0 $0 $0 0.00% $0 $0 0.00% 0.00% 0.00% 0.00%
City of Concord (DNS) $0 $0 $0 $0 $0 $0 $0 $0 $0 0.00% $0 $0 0.00% 0.00% 0.00% 0.00%
City of Durham $0 $0 $0 $0 $0 $0 $0 $0 $0 0.00% $287,835 $63,800 22.17% 22.17% 0.00% 0.00%
City of Eden (DNS) $0 $0 $0 $0 $0 $0 $0 $0 $0 0.00% $406,470 $19,820 4.88% 0.00% 4.88% 0.00%
City of Elizabeth City (DNS) $0 $0 $0 $0 $0 $0 $0 $0 $0 0.00% $0 $0 0.00% 0.00% 0.00% 0.00%
City of Fayetteville (DNS) $0 $0 $0 $0 $0 $0 $0 $0 $0 0.00% $0 $0 0.00% 0.00% 0.00% 0.00%
City of Goldsboro $0 $0 $0 $0 $0 $0 $0 $0 $0 0.00% $1,061,495 $155,565 14.66% 68.24% 3.28% 0.00%
City of Greenville (DNS) $0 $0 $0 $0 $0 $0 $0 $0 $0 0.00% $255,948 $0 0.00% 0.00% 0.00% 0.00%
City of Hickory (DNS) $0 $0 $0 $0 $0 $0 $0 $0 $0 0.00% $0 $0 0.00% 0.00% 0.00% 0.00%
City of High Point (DNS) $0 $0 $0 $0 $0 $0 $0 $0 $0 0.00% $0 $0 0.00% 0.00% 0.00% 0.00%
City of Jacksonville $62,277 $0 $0 $0 $0 $62,277 $0 $0 $62,277 100.00% $2,190,317 $197,035 9.00% 5.15% 40.86% 0.00%
City of Kannapolis (DNS) $0 $0 $0 $0 $0 $0 $0 $0 $0 0.00% $0 $0 0.00% 0.00% 0.00% 0.00%
City of Kings Mountain $0 $0 $0 $0 $0 $0 $0 $0 $0 0.00% $0 $0 0.00% 0.00% 0.00% 0.00%
City of Kinston (DNS) $0 $0 $0 $0 $0 $0 $0 $0 $0 0.00% $0 $0 0.00% 0.00% 0.00% 0.00%
City of Lexington (DNS) $0 $0 $0 $0 $0 $0 $0 $0 $0 0.00% $1,426,302 $0 0.00% 0.00% 0.00% 0.00%
City of Raleigh (DNS) $0 $0 $0 $0 $0 $0 $0 $0 $0 0.00% $0 $0 0.00% 0.00% 0.00% 0.00%
City of Reidsville $0 $0 $0 $0 $0 $0 $0 $0 $0 0.00% $0 $0 0.00% 0.00% 0.00% 0.00%
City of Roanoke Rapids (DNS) $0 $0 $0 $0 $0 $0 $0 $0 $0 0.00% $0 $0 0.00% 0.00% 0.00% 0.00%
City of Rockingham (DNS) $0 $0 $0 $0 $0 $0 $0 $0 $0 0.00% $0 $0 0.00% 0.00% 0.00% 0.00%
City of Rocky Mount $40,486 $0 $0 $0 $0 $0 $0 $0 $0 0.00% $1,038,953 $0 0.00% 0.00% 0.00% 0.00%
City of Salisbury (DNS) $0 $0 $0 $0 $0 $0 $0 $0 $0 0.00% $0 $0 0.00% 0.00% 0.00% 0.00%
City of Sanford (DNS) $0 $0 $0 $0 $0 $0 $0 $0 $0 0.00% $0 $0 0.00% 0.00% 0.00% 0.00%
City of Southport (DNS) $0 $0 $0 $0 $0 $0 $0 $0 $0 0.00% $0 $0 0.00% 0.00% 0.00% 0.00%
City of Statesville $3,677,738 $0 $25,500 $0 $0 $143,605 $0 $0 $169,105 4.60% $3,677,738 $169,105 4.60% 0.00% 0.00% 0.00%
City of Thomasville (DNS) $0 $0 $0 $0 $0 $0 $0 $0 $0 0.00% $0 $0 0.00% 0.00% 0.00% 0.00%
City of Trinity (DNS) $0 $0 $0 $0 $0 $0 $0 $0 $0 0.00% $0 $0 0.00% 0.00% 0.00% 0.00%
City of Wilmington $0 $0 $0 $0 $0 $0 $0 $0 $0 0.00% $0 $0 0.00% 0.00% 0.00% 0.00%
City of Wilson $0 $0 $0 $0 $0 $0 $0 $0 $0 0.00% $276,037 $129,257 46.83% 0.00% 0.00% 54.75%
City of Winston-Salem $1,504,070 $34,388 $8,305 $0 $11,023 $718,096 $0 $0 $771,812 51.31% $129,276,860 $9,411,619 7.28% 15.51% 5.56% 26.43%Public Works Commission - Fayetteville
(DNS) $0 $0 $0 $0 $0 $0 $0 $0 $0 0.00% $0 $0 0.00% 0.00% 0.00% 0.00%
Town of Beaufort (DNS) $0 $0 $0 $0 $0 $0 $0 $0 $0 0.00% $0 $0 0.00% 0.00% 0.00% 0.00%
Town of Blowing Rock (DNS) $0 $0 $0 $0 $0 $0 $0 $0 $0 0.00% $0 $0 0.00% 0.00% 0.00% 0.00%
Town of Bolivia (DNS) $0 $0 $0 $0 $0 $0 $0 $0 $0 0.00% $0 $0 0.00% 0.00% 0.00% 0.00%
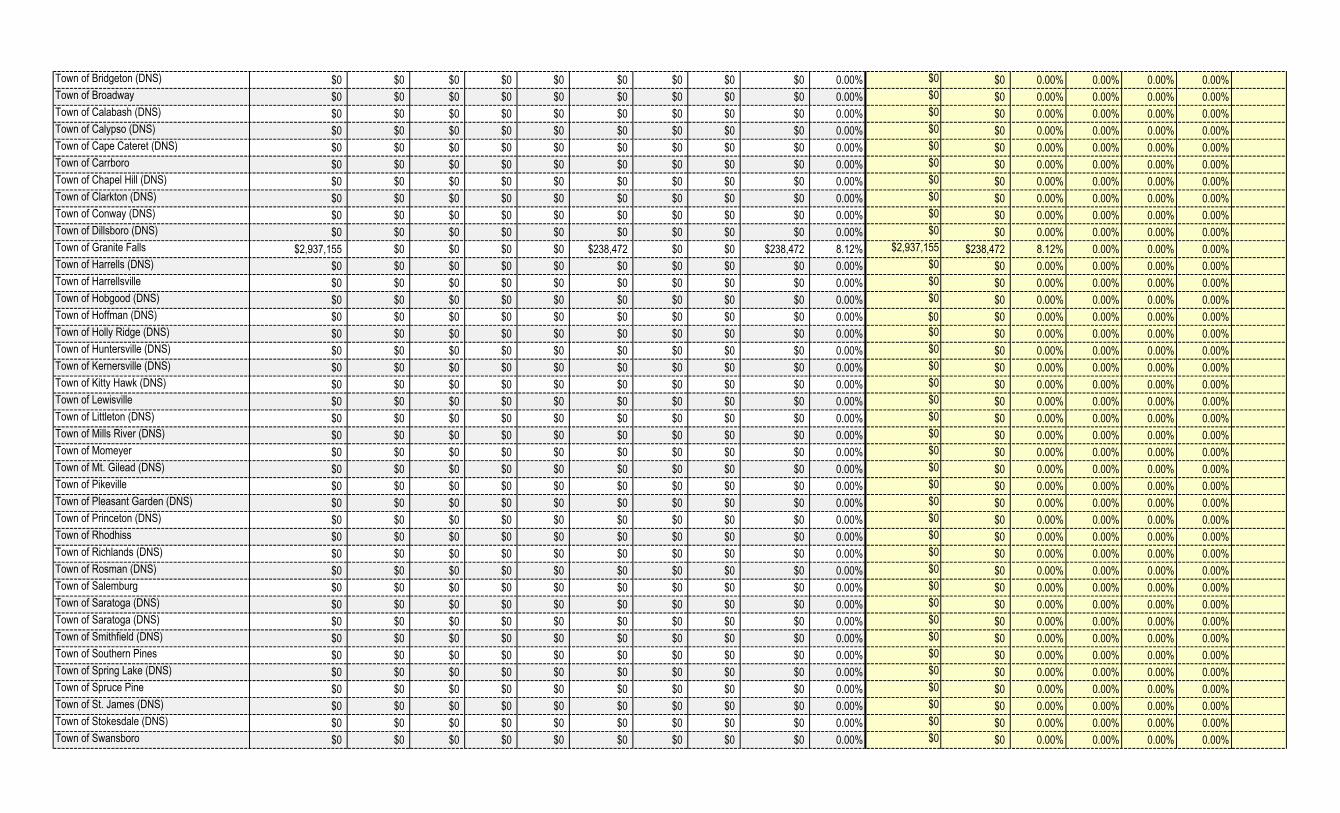
Town of Bridgeton (DNS) $0 $0 $0 $0 $0 $0 $0 $0 $0 0.00% $0 $0 0.00% 0.00% 0.00% 0.00%
Town of Broadway $0 $0 $0 $0 $0 $0 $0 $0 $0 0.00% $0 $0 0.00% 0.00% 0.00% 0.00%
Town of Calabash (DNS) $0 $0 $0 $0 $0 $0 $0 $0 $0 0.00% $0 $0 0.00% 0.00% 0.00% 0.00%
Town of Calypso (DNS) $0 $0 $0 $0 $0 $0 $0 $0 $0 0.00% $0 $0 0.00% 0.00% 0.00% 0.00%
Town of Cape Cateret (DNS) $0 $0 $0 $0 $0 $0 $0 $0 $0 0.00% $0 $0 0.00% 0.00% 0.00% 0.00%
Town of Carrboro $0 $0 $0 $0 $0 $0 $0 $0 $0 0.00% $0 $0 0.00% 0.00% 0.00% 0.00%
Town of Chapel Hill (DNS) $0 $0 $0 $0 $0 $0 $0 $0 $0 0.00% $0 $0 0.00% 0.00% 0.00% 0.00%
Town of Clarkton (DNS) $0 $0 $0 $0 $0 $0 $0 $0 $0 0.00% $0 $0 0.00% 0.00% 0.00% 0.00%
Town of Conway (DNS) $0 $0 $0 $0 $0 $0 $0 $0 $0 0.00% $0 $0 0.00% 0.00% 0.00% 0.00%
Town of Dillsboro (DNS) $0 $0 $0 $0 $0 $0 $0 $0 $0 0.00% $0 $0 0.00% 0.00% 0.00% 0.00%
Town of Granite Falls $2,937,155 $0 $0 $0 $0 $238,472 $0 $0 $238,472 8.12% $2,937,155 $238,472 8.12% 0.00% 0.00% 0.00%
Town of Harrells (DNS) $0 $0 $0 $0 $0 $0 $0 $0 $0 0.00% $0 $0 0.00% 0.00% 0.00% 0.00%
Town of Harrellsville $0 $0 $0 $0 $0 $0 $0 $0 $0 0.00% $0 $0 0.00% 0.00% 0.00% 0.00%
Town of Hobgood (DNS) $0 $0 $0 $0 $0 $0 $0 $0 $0 0.00% $0 $0 0.00% 0.00% 0.00% 0.00%
Town of Hoffman (DNS) $0 $0 $0 $0 $0 $0 $0 $0 $0 0.00% $0 $0 0.00% 0.00% 0.00% 0.00%
Town of Holly Ridge (DNS) $0 $0 $0 $0 $0 $0 $0 $0 $0 0.00% $0 $0 0.00% 0.00% 0.00% 0.00%
Town of Huntersville (DNS) $0 $0 $0 $0 $0 $0 $0 $0 $0 0.00% $0 $0 0.00% 0.00% 0.00% 0.00%
Town of Kernersville (DNS) $0 $0 $0 $0 $0 $0 $0 $0 $0 0.00% $0 $0 0.00% 0.00% 0.00% 0.00%
Town of Kitty Hawk (DNS) $0 $0 $0 $0 $0 $0 $0 $0 $0 0.00% $0 $0 0.00% 0.00% 0.00% 0.00%
Town of Lewisville $0 $0 $0 $0 $0 $0 $0 $0 $0 0.00% $0 $0 0.00% 0.00% 0.00% 0.00%
Town of Littleton (DNS) $0 $0 $0 $0 $0 $0 $0 $0 $0 0.00% $0 $0 0.00% 0.00% 0.00% 0.00%
Town of Mills River (DNS) $0 $0 $0 $0 $0 $0 $0 $0 $0 0.00% $0 $0 0.00% 0.00% 0.00% 0.00%
Town of Momeyer $0 $0 $0 $0 $0 $0 $0 $0 $0 0.00% $0 $0 0.00% 0.00% 0.00% 0.00%
Town of Mt. Gilead (DNS) $0 $0 $0 $0 $0 $0 $0 $0 $0 0.00% $0 $0 0.00% 0.00% 0.00% 0.00%
Town of Pikeville $0 $0 $0 $0 $0 $0 $0 $0 $0 0.00% $0 $0 0.00% 0.00% 0.00% 0.00%
Town of Pleasant Garden (DNS) $0 $0 $0 $0 $0 $0 $0 $0 $0 0.00% $0 $0 0.00% 0.00% 0.00% 0.00%
Town of Princeton (DNS) $0 $0 $0 $0 $0 $0 $0 $0 $0 0.00% $0 $0 0.00% 0.00% 0.00% 0.00%
Town of Rhodhiss $0 $0 $0 $0 $0 $0 $0 $0 $0 0.00% $0 $0 0.00% 0.00% 0.00% 0.00%
Town of Richlands (DNS) $0 $0 $0 $0 $0 $0 $0 $0 $0 0.00% $0 $0 0.00% 0.00% 0.00% 0.00%
Town of Rosman (DNS) $0 $0 $0 $0 $0 $0 $0 $0 $0 0.00% $0 $0 0.00% 0.00% 0.00% 0.00%
Town of Salemburg $0 $0 $0 $0 $0 $0 $0 $0 $0 0.00% $0 $0 0.00% 0.00% 0.00% 0.00%
Town of Saratoga (DNS) $0 $0 $0 $0 $0 $0 $0 $0 $0 0.00% $0 $0 0.00% 0.00% 0.00% 0.00%
Town of Saratoga (DNS) $0 $0 $0 $0 $0 $0 $0 $0 $0 0.00% $0 $0 0.00% 0.00% 0.00% 0.00%
Town of Smithfield (DNS) $0 $0 $0 $0 $0 $0 $0 $0 $0 0.00% $0 $0 0.00% 0.00% 0.00% 0.00%
Town of Southern Pines $0 $0 $0 $0 $0 $0 $0 $0 $0 0.00% $0 $0 0.00% 0.00% 0.00% 0.00%
Town of Spring Lake (DNS) $0 $0 $0 $0 $0 $0 $0 $0 $0 0.00% $0 $0 0.00% 0.00% 0.00% 0.00%
Town of Spruce Pine $0 $0 $0 $0 $0 $0 $0 $0 $0 0.00% $0 $0 0.00% 0.00% 0.00% 0.00%
Town of St. James (DNS) $0 $0 $0 $0 $0 $0 $0 $0 $0 0.00% $0 $0 0.00% 0.00% 0.00% 0.00%
Town of Stokesdale (DNS) $0 $0 $0 $0 $0 $0 $0 $0 $0 0.00% $0 $0 0.00% 0.00% 0.00% 0.00%
Town of Swansboro $0 $0 $0 $0 $0 $0 $0 $0 $0 0.00% $0 $0 0.00% 0.00% 0.00% 0.00%
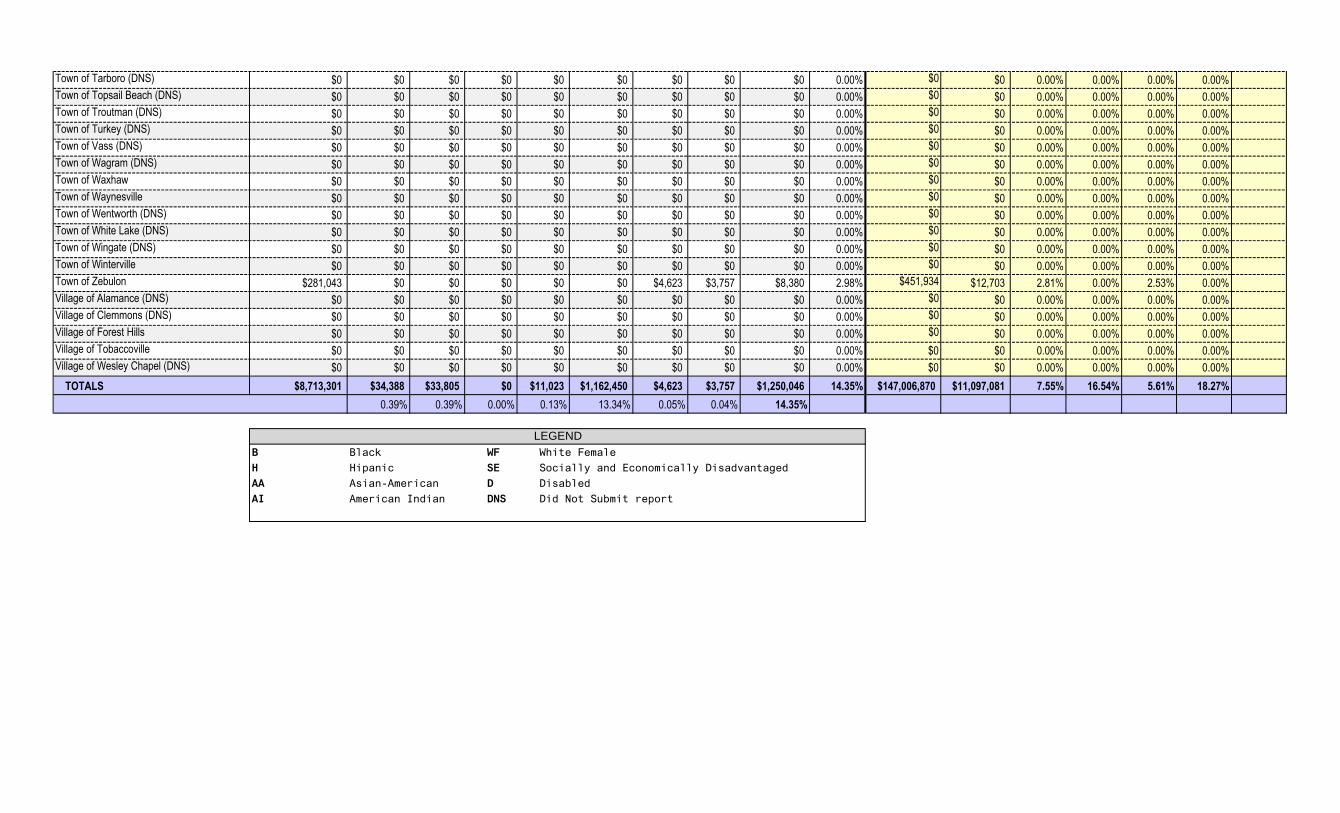
Town of Tarboro (DNS) $0 $0 $0 $0 $0 $0 $0 $0 $0 0.00% $0 $0 0.00% 0.00% 0.00% 0.00%
Town of Topsail Beach (DNS) $0 $0 $0 $0 $0 $0 $0 $0 $0 0.00% $0 $0 0.00% 0.00% 0.00% 0.00%
Town of Troutman (DNS) $0 $0 $0 $0 $0 $0 $0 $0 $0 0.00% $0 $0 0.00% 0.00% 0.00% 0.00%
Town of Turkey (DNS) $0 $0 $0 $0 $0 $0 $0 $0 $0 0.00% $0 $0 0.00% 0.00% 0.00% 0.00%
Town of Vass (DNS) $0 $0 $0 $0 $0 $0 $0 $0 $0 0.00% $0 $0 0.00% 0.00% 0.00% 0.00%
Town of Wagram (DNS) $0 $0 $0 $0 $0 $0 $0 $0 $0 0.00% $0 $0 0.00% 0.00% 0.00% 0.00%
Town of Waxhaw $0 $0 $0 $0 $0 $0 $0 $0 $0 0.00% $0 $0 0.00% 0.00% 0.00% 0.00%
Town of Waynesville $0 $0 $0 $0 $0 $0 $0 $0 $0 0.00% $0 $0 0.00% 0.00% 0.00% 0.00%
Town of Wentworth (DNS) $0 $0 $0 $0 $0 $0 $0 $0 $0 0.00% $0 $0 0.00% 0.00% 0.00% 0.00%
Town of White Lake (DNS) $0 $0 $0 $0 $0 $0 $0 $0 $0 0.00% $0 $0 0.00% 0.00% 0.00% 0.00%
Town of Wingate (DNS) $0 $0 $0 $0 $0 $0 $0 $0 $0 0.00% $0 $0 0.00% 0.00% 0.00% 0.00%
Town of Winterville $0 $0 $0 $0 $0 $0 $0 $0 $0 0.00% $0 $0 0.00% 0.00% 0.00% 0.00%
Town of Zebulon $281,043 $0 $0 $0 $0 $0 $4,623 $3,757 $8,380 2.98% $451,934 $12,703 2.81% 0.00% 2.53% 0.00%
Village of Alamance (DNS) $0 $0 $0 $0 $0 $0 $0 $0 $0 0.00% $0 $0 0.00% 0.00% 0.00% 0.00%
Village of Clemmons (DNS) $0 $0 $0 $0 $0 $0 $0 $0 $0 0.00% $0 $0 0.00% 0.00% 0.00% 0.00%
Village of Forest Hills $0 $0 $0 $0 $0 $0 $0 $0 $0 0.00% $0 $0 0.00% 0.00% 0.00% 0.00%
Village of Tobaccoville $0 $0 $0 $0 $0 $0 $0 $0 $0 0.00% $0 $0 0.00% 0.00% 0.00% 0.00%
Village of Wesley Chapel (DNS) $0 $0 $0 $0 $0 $0 $0 $0 $0 0.00% $0 $0 0.00% 0.00% 0.00% 0.00%
TOTALS $8,713,301 $34,388 $33,805 $0 $11,023 $1,162,450 $4,623 $3,757 $1,250,046 14.35% $147,006,870 $11,097,081 7.55% 16.54% 5.61% 18.27%
0.39% 0.39% 0.00% 0.13% 13.34% 0.05% 0.04% 14.35%
B Black WF White Female
H Hipanic SE Socially and Economically Disadvantaged
AA Asian-American D Disabled
AI American Indian DNS Did Not Submit report
LEGEND

FY 2011-2012
(7/1/2011-6/30/2012)
NON-STATE
AGENCIES
To
tal
De
pt.
($)
B (
$)
H (
$)
AA
($
)
AI
($)
WF
($
)
SE
($
)
D (
$)
To
tal
HU
B
($)
To
tal
HU
B
(%)
YT
D T
ota
l ($
)
YT
D H
UB
($
)
YT
D H
UB
(%)
Q1
HU
B (
%)
Q2
HU
B (
%)
Q3
HU
B (
%)
Q4
HU
B (
%)
Greenville Utilities $0 $0 $0 $0 $0 $0 $0 $0 $0 0.00% $0 $0 0.00% 0.00% 0.00% 0.00% 0.00%
Johnston County Public Utilities $0 $0 $0 $0 $0 $0 $0 $0 $0 0.00% $0 $0 0.00% 0.00% 0.00% 0.00% 0.00%
TOTALS $0 $0 $0 $0 $0 $0 $0 $0 $0 0.00% $0 $0 0.00% 0.00% 0.00% 0.00% 0.00%
% of Total Purchasing 0.00% 0.00% 0.00% 0.00% 0.00% 0.00% 0.00% 0.00%
0.00% 0.00% 0.00% 0.00% 0.00% 0.00% 0.00% 0.00%
Q1
Greenville Utilities (DNS) $0 $0 $0 $0 $0 $0 $0 $0 $0 0.00%
Johnston County Public Utilities $0 $0 $0 $0 $0 $0 $0 $0 $0 0.00%
TOTALS $0 $0 $0 $0 $0 $0 $0 $0 $0 0.00%
0.00% 0.00% 0.00% 0.00% 0.00% 0.00% 0.00% 0.00%
Q2
Greenville Utilities (DNS) $0 $0 $0 $0 $0 $0 $0 $0 $0 0.00% $0 $0 0.00% 0.00%
Johnston County Public Utilities $0 $0 $0 $0 $0 $0 $0 $0 $0 0.00% $0 $0 0.00% 0.00%
TOTALS $0 $0 $0 $0 $0 $0 $0 $0 $0 0.00% $0 $0 0.00% 0.00%
0.00% 0.00% 0.00% 0.00% 0.00% 0.00% 0.00% 0.00%
Q3
Greenville Utilities (DNS) $0 $0 $0 $0 $0 $0 $0 $0 $0 0.00% $0 $0 0.00% 0.00% 0.00%
Johnston County Public Utilities $0 $0 $0 $0 $0 $0 $0 $0 $0 0.00% $0 $0 0.00% 0.00% 0.00%
TOTALS $0 $0 $0 $0 $0 $0 $0 $0 $0 0.00% $0 $0 0.00% 0.00% 0.00%
0.00% 0.00% 0.00% 0.00% 0.00% 0.00% 0.00% 0.00%
Q4
Greenville Utilities (DNS) $0 $0 $0 $0 $0 $0 $0 $0 $0 0.00% $0 $0 0.00% 0.00% 0.00% 0.00%
Johnston County Public Utilities $0 $0 $0 $0 $0 $0 $0 $0 $0 0.00% $0 $0 0.00% 0.00% 0.00% 0.00%
TOTALS $0 $0 $0 $0 $0 $0 $0 $0 $0 0.00% $0 $0 0.00% 0.00% 0.00% 0.00%
% of Minority Participation
HUB PARTICIPATION REPORT - CONSTRUCTION (Includes
FORMAL and INFORMAL Projects)YEAR-TO-DATE SUMMARY
NORTH CAROLINA DEPARTMENT OF ADMINISTRATION
OFFICE FOR HISTORICALLY UNDERUTILIZED BUSINESSES
0.00% 0.00% 0.00% 0.00% 0.00% 0.00% 0.00% 0.00%
B Black WF White Female
H Hipanic SE Socially and Economically Disadvantaged
AA Asian-American D Disabled
AI American Indian DNS Did Not Submit report
LEGEND

FY 2011-2012
(7/1/2011-6/30/2012)
PUBLIC HOUSING
AUTHORITIES
To
tal
Dep
t. (
$)
B (
$)
H (
$)
AA
($)
AI
($)
WF
($)
SE
($)
D (
$)
To
tal
HU
B (
$)
To
tal
HU
B (
%)
YT
D T
ota
l ($
)
YT
D H
UB
($)
YT
D H
UB
(%
)
Q1 H
UB
(%
)
Q2 H
UB
(%
)
Q3 H
UB
(%
)
Q4 H
UB
(%
)
Burlington Housing Authority $0 $0 $0 $0 $0 $0 $0 $0 $0 0.00% $0 $0 0.00% 0.00% 0.00% 0.00% 0.00%
Dunn Housing Authority $0 $0 $0 $0 $0 $0 $0 $0 $0 0.00% $0 $0 0.00% 0.00% 0.00% 0.00% 0.00%
Forest City Housing Authority $0 $0 $0 $0 $0 $0 $0 $0 $0 0.00% $0 $0 0.00% 0.00% 0.00% 0.00% 0.00%
Hickory Public Housing Authority $0 $0 $0 $0 $0 $0 $0 $0 $0 0.00% $0 $0 0.00% 0.00% 0.00% 0.00% 0.00%
High Point Housing Authority $0 $0 $0 $0 $0 $0 $0 $0 $0 0.00% $0 $0 0.00% 0.00% 0.00% 0.00% 0.00%
Lexington Housing Authority $0 $0 $0 $0 $0 $0 $0 $0 $0 0.00% $0 $0 0.00% 0.00% 0.00% 0.00% 0.00%
Mooresville Housing Authority $0 $0 $0 $0 $0 $0 $0 $0 $0 0.00% $0 $0 0.00% 0.00% 0.00% 0.00% 0.00%
Mount Olive Housing Authority $0 $0 $0 $0 $0 $0 $0 $0 $0 0.00% $0 $0 0.00% 0.00% 0.00% 0.00% 0.00%
Northwestern Regional Housing Authority $0 $0 $0 $0 $0 $0 $0 $0 $0 0.00% $0 $0 0.00% 0.00% 0.00% 0.00% 0.00%
Pembroke Housing Authority $0 $0 $0 $0 $0 $0 $0 $0 $0 0.00% $0 $0 0.00% 0.00% 0.00% 0.00% 0.00%
Randleman Housing Authority $0 $0 $0 $0 $0 $0 $0 $0 $0 0.00% $0 $0 0.00% 0.00% 0.00% 0.00% 0.00%
Selma Housing Authority $0 $0 $0 $0 $0 $0 $0 $0 $0 0.00% $0 $0 0.00% 0.00% 0.00% 0.00% 0.00%
Smithfield Housing Authority $0 $0 $0 $0 $0 $0 $0 $0 $0 0.00% $0 $0 0.00% 0.00% 0.00% 0.00% 0.00%
TOTALS $0 $0 $0 $0 $0 $0 $0 $0 $0 0.00% $0 $0 0.00% 0.00% 0.00% 0.00% 0.00%
% of Total Purchasing 0.00% 0.00% 0.00% 0.00% 0.00% 0.00% 0.00% 0.00%
0.00% 0.00% 0.00% 0.00% 0.00% 0.00% 0.00% 0.00%
Q1
Burlington Housing Authority (DNS) $0 $0 $0 $0 $0 $0 $0 $0 $0 0.00%
Dunn Housing Authority (DNS) $0 $0 $0 $0 $0 $0 $0 $0 $0 0.00%
Forest City Housing Authority (DNS) $0 $0 $0 $0 $0 $0 $0 $0 $0 0.00%
Hickory Public Housing Authority (DNS) $0 $0 $0 $0 $0 $0 $0 $0 $0 0.00%
High Point Housing Authority (DNS) $0 $0 $0 $0 $0 $0 $0 $0 $0 0.00%
Lexington Housing Authority (DNS) $0 $0 $0 $0 $0 $0 $0 $0 $0 0.00%
Mooresville Housing Authority (DNS) $0 $0 $0 $0 $0 $0 $0 $0 $0 0.00%
Mount Olive Housing Authority (DNS) $0 $0 $0 $0 $0 $0 $0 $0 $0 0.00%
Northwestern Regional Housing Authority $0 $0 $0 $0 $0 $0 $0 $0 $0 0.00%
Pembroke Housing Authority (DNS) $0 $0 $0 $0 $0 $0 $0 $0 $0 0.00%
% of Minority Participation
HUB PARTICIPATION REPORT - CONSTRUCTION (Includes FORMAL and
INFORMAL Projects)YEAR-TO-DATE SUMMARY
NORTH CAROLINA DEPARTMENT OF ADMINISTRATIONOFFICE FOR HISTORICALLY UNDERUTILIZED BUSINESSES
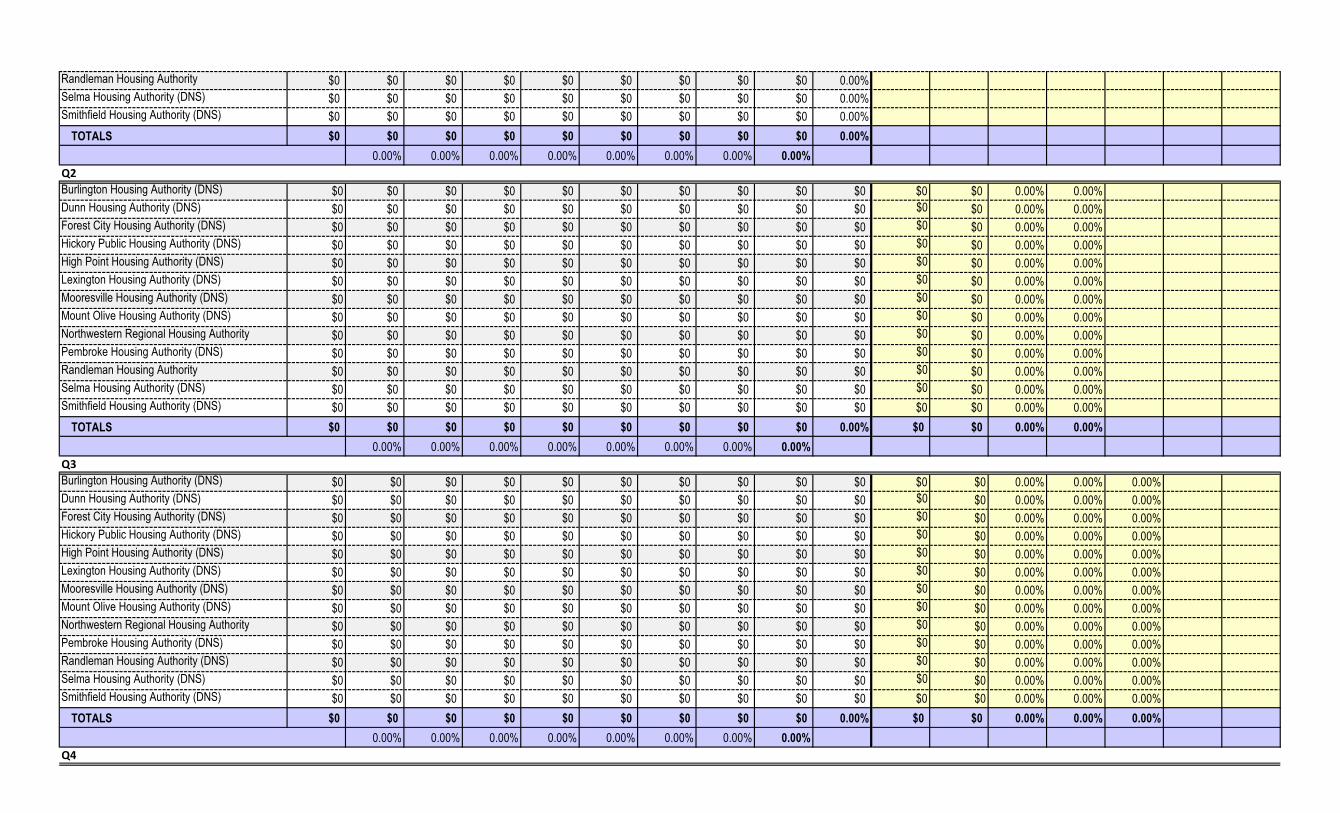
Randleman Housing Authority $0 $0 $0 $0 $0 $0 $0 $0 $0 0.00%
Selma Housing Authority (DNS) $0 $0 $0 $0 $0 $0 $0 $0 $0 0.00%
Smithfield Housing Authority (DNS) $0 $0 $0 $0 $0 $0 $0 $0 $0 0.00%
TOTALS $0 $0 $0 $0 $0 $0 $0 $0 $0 0.00%
0.00% 0.00% 0.00% 0.00% 0.00% 0.00% 0.00% 0.00%
Q2
Burlington Housing Authority (DNS) $0 $0 $0 $0 $0 $0 $0 $0 $0 $0 $0 $0 0.00% 0.00%
Dunn Housing Authority (DNS) $0 $0 $0 $0 $0 $0 $0 $0 $0 $0 $0 $0 0.00% 0.00%
Forest City Housing Authority (DNS) $0 $0 $0 $0 $0 $0 $0 $0 $0 $0 $0 $0 0.00% 0.00%
Hickory Public Housing Authority (DNS) $0 $0 $0 $0 $0 $0 $0 $0 $0 $0 $0 $0 0.00% 0.00%
High Point Housing Authority (DNS) $0 $0 $0 $0 $0 $0 $0 $0 $0 $0 $0 $0 0.00% 0.00%
Lexington Housing Authority (DNS) $0 $0 $0 $0 $0 $0 $0 $0 $0 $0 $0 $0 0.00% 0.00%
Mooresville Housing Authority (DNS) $0 $0 $0 $0 $0 $0 $0 $0 $0 $0 $0 $0 0.00% 0.00%
Mount Olive Housing Authority (DNS) $0 $0 $0 $0 $0 $0 $0 $0 $0 $0 $0 $0 0.00% 0.00%
Northwestern Regional Housing Authority $0 $0 $0 $0 $0 $0 $0 $0 $0 $0 $0 $0 0.00% 0.00%
Pembroke Housing Authority (DNS) $0 $0 $0 $0 $0 $0 $0 $0 $0 $0 $0 $0 0.00% 0.00%
Randleman Housing Authority $0 $0 $0 $0 $0 $0 $0 $0 $0 $0 $0 $0 0.00% 0.00%
Selma Housing Authority (DNS) $0 $0 $0 $0 $0 $0 $0 $0 $0 $0 $0 $0 0.00% 0.00%
Smithfield Housing Authority (DNS) $0 $0 $0 $0 $0 $0 $0 $0 $0 $0 $0 $0 0.00% 0.00%
TOTALS $0 $0 $0 $0 $0 $0 $0 $0 $0 0.00% $0 $0 0.00% 0.00%
0.00% 0.00% 0.00% 0.00% 0.00% 0.00% 0.00% 0.00%
Q3
Burlington Housing Authority (DNS) $0 $0 $0 $0 $0 $0 $0 $0 $0 $0 $0 $0 0.00% 0.00% 0.00%
Dunn Housing Authority (DNS) $0 $0 $0 $0 $0 $0 $0 $0 $0 $0 $0 $0 0.00% 0.00% 0.00%
Forest City Housing Authority (DNS) $0 $0 $0 $0 $0 $0 $0 $0 $0 $0 $0 $0 0.00% 0.00% 0.00%
Hickory Public Housing Authority (DNS) $0 $0 $0 $0 $0 $0 $0 $0 $0 $0 $0 $0 0.00% 0.00% 0.00%
High Point Housing Authority (DNS) $0 $0 $0 $0 $0 $0 $0 $0 $0 $0 $0 $0 0.00% 0.00% 0.00%
Lexington Housing Authority (DNS) $0 $0 $0 $0 $0 $0 $0 $0 $0 $0 $0 $0 0.00% 0.00% 0.00%
Mooresville Housing Authority (DNS) $0 $0 $0 $0 $0 $0 $0 $0 $0 $0 $0 $0 0.00% 0.00% 0.00%
Mount Olive Housing Authority (DNS) $0 $0 $0 $0 $0 $0 $0 $0 $0 $0 $0 $0 0.00% 0.00% 0.00%
Northwestern Regional Housing Authority $0 $0 $0 $0 $0 $0 $0 $0 $0 $0 $0 $0 0.00% 0.00% 0.00%
Pembroke Housing Authority (DNS) $0 $0 $0 $0 $0 $0 $0 $0 $0 $0 $0 $0 0.00% 0.00% 0.00%
Randleman Housing Authority (DNS) $0 $0 $0 $0 $0 $0 $0 $0 $0 $0 $0 $0 0.00% 0.00% 0.00%
Selma Housing Authority (DNS) $0 $0 $0 $0 $0 $0 $0 $0 $0 $0 $0 $0 0.00% 0.00% 0.00%
Smithfield Housing Authority (DNS) $0 $0 $0 $0 $0 $0 $0 $0 $0 $0 $0 $0 0.00% 0.00% 0.00%
TOTALS $0 $0 $0 $0 $0 $0 $0 $0 $0 0.00% $0 $0 0.00% 0.00% 0.00%
0.00% 0.00% 0.00% 0.00% 0.00% 0.00% 0.00% 0.00%
Q4

Burlington Housing Authority (DNS) $0 $0 0.00% $0 $0 $0 $0 $0 $0 $0 $0 $0 0.00% 0.00% 0.00% 0.00%
Dunn Housing Authority (DNS) $0 $0 0.00% $0 $0 $0 $0 $0 $0 $0 $0 $0 0.00% 0.00% 0.00% 0.00%
Forest City Housing Authority (DNS) $0 $0 0.00% $0 $0 $0 $0 $0 $0 $0 $0 $0 0.00% 0.00% 0.00% 0.00%
Hickory Public Housing Authority (DNS) $0 $0 0.00% $0 $0 $0 $0 $0 $0 $0 $0 $0 0.00% 0.00% 0.00% 0.00%
High Point Housing Authority (DNS) $0 $0 0.00% $0 $0 $0 $0 $0 $0 $0 $0 $0 0.00% 0.00% 0.00% 0.00%
Lexington Housing Authority (DNS) $0 $0 0.00% $0 $0 $0 $0 $0 $0 $0 $0 $0 0.00% 0.00% 0.00% 0.00%
Mooresville Housing Authority (DNS) $0 $0 0.00% $0 $0 $0 $0 $0 $0 $0 $0 $0 0.00% 0.00% 0.00% 0.00%
Mount Olive Housing Authority (DNS) $0 $0 0.00% $0 $0 $0 $0 $0 $0 $0 $0 $0 0.00% 0.00% 0.00% 0.00%
Northwestern Regional Housing Authority $0 $0 0.00% $0 $0 $0 $0 $0 $0 $0 $0 $0 0.00% 0.00% 0.00% 0.00%
Pembroke Housing Authority (DNS) $0 $0 0.00% $0 $0 $0 $0 $0 $0 $0 $0 $0 0.00% 0.00% 0.00% 0.00%
Randleman Housing Authority (DNS) $0 $0 0.00% $0 $0 $0 $0 $0 $0 $0 $0 $0 0.00% 0.00% 0.00% 0.00%
Selma Housing Authority (DNS) $0 $0 0.00% $0 $0 $0 $0 $0 $0 $0 $0 $0 0.00% 0.00% 0.00% 0.00%
Smithfield Housing Authority (DNS) $0 $0 0.00% $0 $0 $0 $0 $0 $0 $0 $0 $0 0.00% 0.00% 0.00% 0.00%
TOTALS $0 $0 $0 $0 $0 $0 $0 $0 $0 0.00% $0 $0 0.00% 0.00% 0.00% 0.00%
0.00% 0.00% 0.00% 0.00% 0.00% 0.00% 0.00% 0.00%
B Black WF White Female
H Hipanic SE Socially and Economically Disadvantaged
AA Asian-American D Disabled
AI American Indian DNS Did Not Submit report
LEGEND
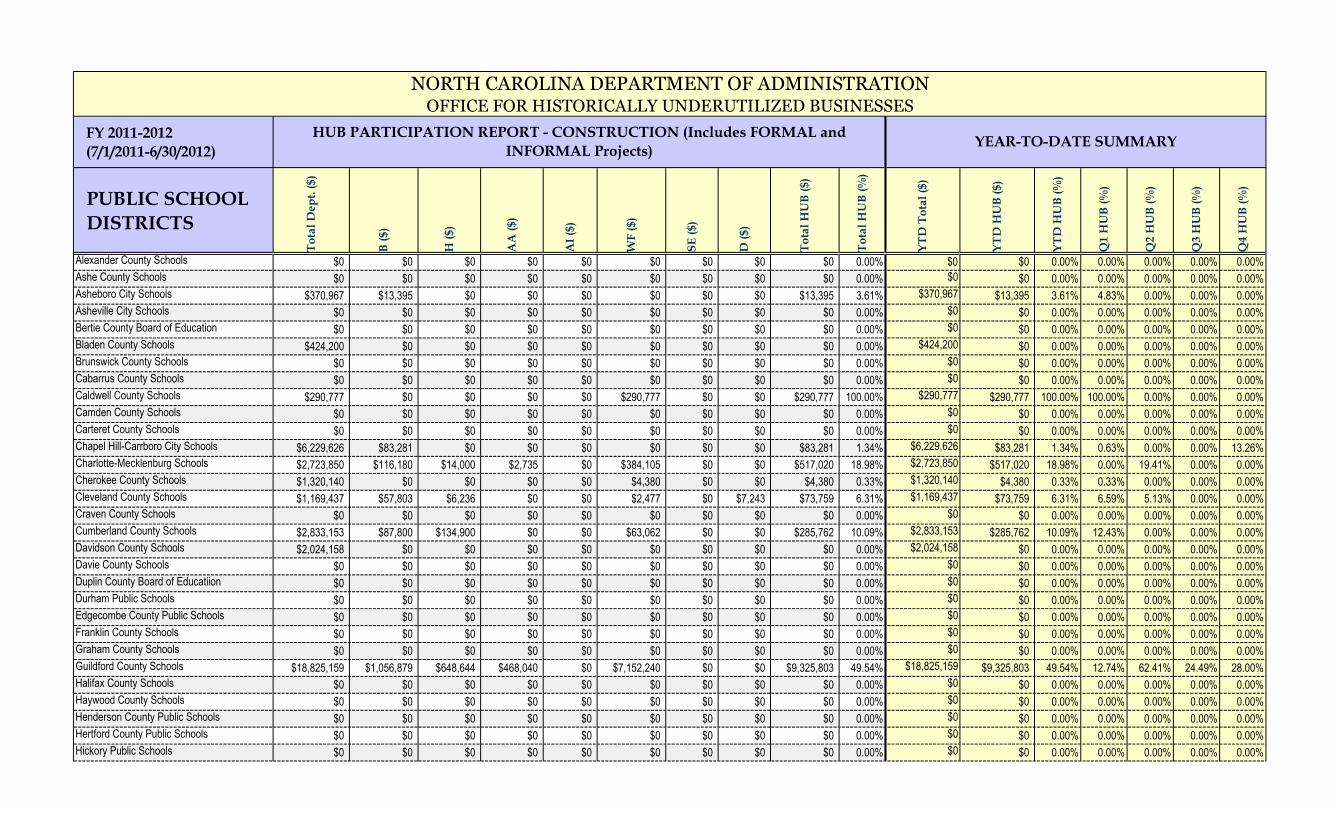
FY 2011-2012
(7/1/2011-6/30/2012)
PUBLIC SCHOOL
DISTRICTS
To
tal
De
pt.
($
)
B (
$)
H (
$)
AA
($
)
AI
($)
WF
($
)
SE
($
)
D (
$)
To
tal
HU
B (
$)
To
tal
HU
B (
%)
YT
D T
ota
l ($
)
YT
D H
UB
($
)
YT
D H
UB
(%
)
Q1
HU
B (
%)
Q2
HU
B (
%)
Q3
HU
B (
%)
Q4
HU
B (
%)
Alexander County Schools $0 $0 $0 $0 $0 $0 $0 $0 $0 0.00% $0 $0 0.00% 0.00% 0.00% 0.00% 0.00%
Ashe County Schools $0 $0 $0 $0 $0 $0 $0 $0 $0 0.00% $0 $0 0.00% 0.00% 0.00% 0.00% 0.00%
Asheboro City Schools $370,967 $13,395 $0 $0 $0 $0 $0 $0 $13,395 3.61% $370,967 $13,395 3.61% 4.83% 0.00% 0.00% 0.00%
Asheville City Schools $0 $0 $0 $0 $0 $0 $0 $0 $0 0.00% $0 $0 0.00% 0.00% 0.00% 0.00% 0.00%
Bertie County Board of Education $0 $0 $0 $0 $0 $0 $0 $0 $0 0.00% $0 $0 0.00% 0.00% 0.00% 0.00% 0.00%
Bladen County Schools $424,200 $0 $0 $0 $0 $0 $0 $0 $0 0.00% $424,200 $0 0.00% 0.00% 0.00% 0.00% 0.00%
Brunswick County Schools $0 $0 $0 $0 $0 $0 $0 $0 $0 0.00% $0 $0 0.00% 0.00% 0.00% 0.00% 0.00%
Cabarrus County Schools $0 $0 $0 $0 $0 $0 $0 $0 $0 0.00% $0 $0 0.00% 0.00% 0.00% 0.00% 0.00%
Caldwell County Schools $290,777 $0 $0 $0 $0 $290,777 $0 $0 $290,777 100.00% $290,777 $290,777 100.00% 100.00% 0.00% 0.00% 0.00%
Camden County Schools $0 $0 $0 $0 $0 $0 $0 $0 $0 0.00% $0 $0 0.00% 0.00% 0.00% 0.00% 0.00%
Carteret County Schools $0 $0 $0 $0 $0 $0 $0 $0 $0 0.00% $0 $0 0.00% 0.00% 0.00% 0.00% 0.00%
Chapel Hill-Carrboro City Schools $6,229,626 $83,281 $0 $0 $0 $0 $0 $0 $83,281 1.34% $6,229,626 $83,281 1.34% 0.63% 0.00% 0.00% 13.26%
Charlotte-Mecklenburg Schools $2,723,850 $116,180 $14,000 $2,735 $0 $384,105 $0 $0 $517,020 18.98% $2,723,850 $517,020 18.98% 0.00% 19.41% 0.00% 0.00%
Cherokee County Schools $1,320,140 $0 $0 $0 $0 $4,380 $0 $0 $4,380 0.33% $1,320,140 $4,380 0.33% 0.33% 0.00% 0.00% 0.00%
Cleveland County Schools $1,169,437 $57,803 $6,236 $0 $0 $2,477 $0 $7,243 $73,759 6.31% $1,169,437 $73,759 6.31% 6.59% 5.13% 0.00% 0.00%
Craven County Schools $0 $0 $0 $0 $0 $0 $0 $0 $0 0.00% $0 $0 0.00% 0.00% 0.00% 0.00% 0.00%
Cumberland County Schools $2,833,153 $87,800 $134,900 $0 $0 $63,062 $0 $0 $285,762 10.09% $2,833,153 $285,762 10.09% 12.43% 0.00% 0.00% 0.00%
Davidson County Schools $2,024,158 $0 $0 $0 $0 $0 $0 $0 $0 0.00% $2,024,158 $0 0.00% 0.00% 0.00% 0.00% 0.00%
Davie County Schools $0 $0 $0 $0 $0 $0 $0 $0 $0 0.00% $0 $0 0.00% 0.00% 0.00% 0.00% 0.00%
Duplin County Board of Educatiion $0 $0 $0 $0 $0 $0 $0 $0 $0 0.00% $0 $0 0.00% 0.00% 0.00% 0.00% 0.00%
Durham Public Schools $0 $0 $0 $0 $0 $0 $0 $0 $0 0.00% $0 $0 0.00% 0.00% 0.00% 0.00% 0.00%
Edgecombe County Public Schools $0 $0 $0 $0 $0 $0 $0 $0 $0 0.00% $0 $0 0.00% 0.00% 0.00% 0.00% 0.00%
Franklin County Schools $0 $0 $0 $0 $0 $0 $0 $0 $0 0.00% $0 $0 0.00% 0.00% 0.00% 0.00% 0.00%
Graham County Schools $0 $0 $0 $0 $0 $0 $0 $0 $0 0.00% $0 $0 0.00% 0.00% 0.00% 0.00% 0.00%
Guildford County Schools $18,825,159 $1,056,879 $648,644 $468,040 $0 $7,152,240 $0 $0 $9,325,803 49.54% $18,825,159 $9,325,803 49.54% 12.74% 62.41% 24.49% 28.00%
Halifax County Schools $0 $0 $0 $0 $0 $0 $0 $0 $0 0.00% $0 $0 0.00% 0.00% 0.00% 0.00% 0.00%
Haywood County Schools $0 $0 $0 $0 $0 $0 $0 $0 $0 0.00% $0 $0 0.00% 0.00% 0.00% 0.00% 0.00%
Henderson County Public Schools $0 $0 $0 $0 $0 $0 $0 $0 $0 0.00% $0 $0 0.00% 0.00% 0.00% 0.00% 0.00%
Hertford County Public Schools $0 $0 $0 $0 $0 $0 $0 $0 $0 0.00% $0 $0 0.00% 0.00% 0.00% 0.00% 0.00%
Hickory Public Schools $0 $0 $0 $0 $0 $0 $0 $0 $0 0.00% $0 $0 0.00% 0.00% 0.00% 0.00% 0.00%
HUB PARTICIPATION REPORT - CONSTRUCTION (Includes FORMAL and
INFORMAL Projects)YEAR-TO-DATE SUMMARY
NORTH CAROLINA DEPARTMENT OF ADMINISTRATIONOFFICE FOR HISTORICALLY UNDERUTILIZED BUSINESSES
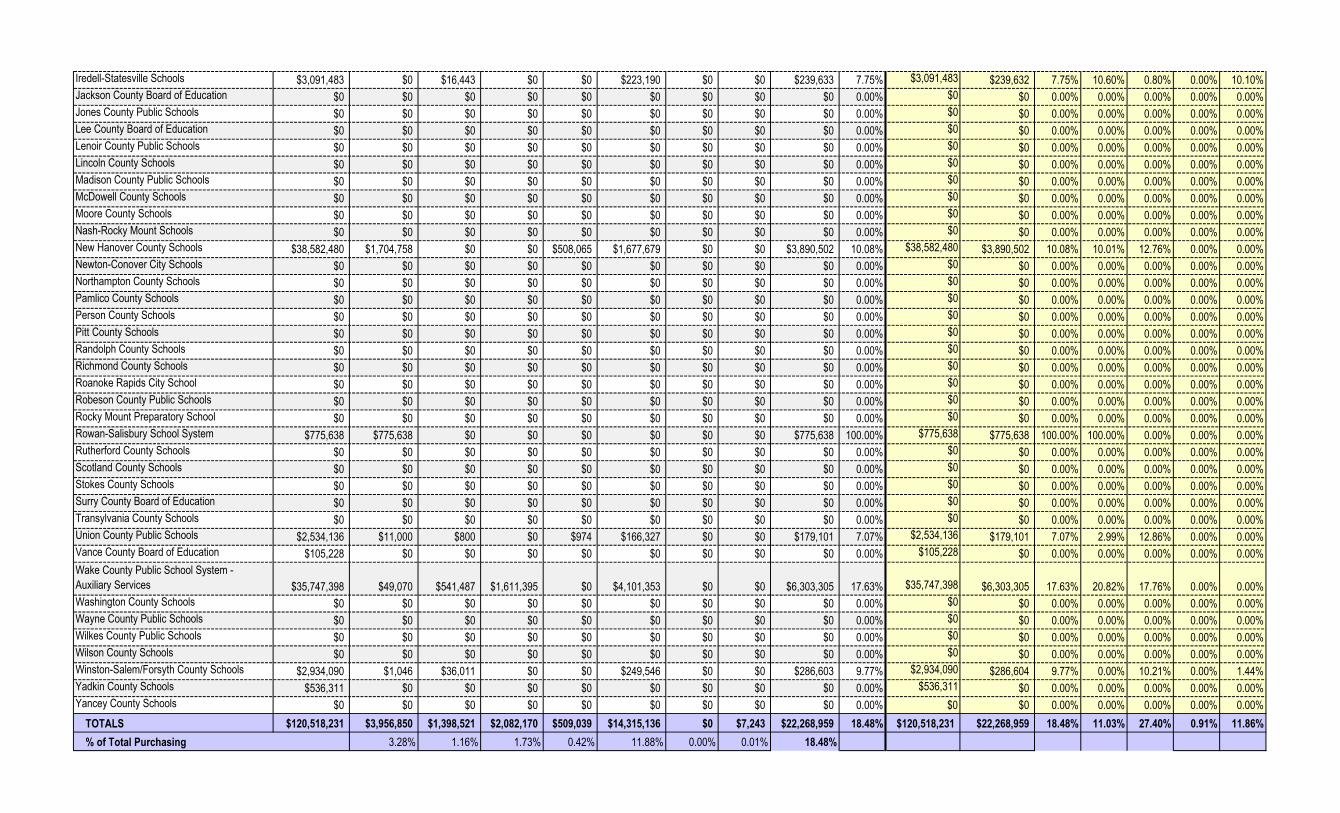
Iredell-Statesville Schools $3,091,483 $0 $16,443 $0 $0 $223,190 $0 $0 $239,633 7.75% $3,091,483 $239,632 7.75% 10.60% 0.80% 0.00% 10.10%
Jackson County Board of Education $0 $0 $0 $0 $0 $0 $0 $0 $0 0.00% $0 $0 0.00% 0.00% 0.00% 0.00% 0.00%
Jones County Public Schools $0 $0 $0 $0 $0 $0 $0 $0 $0 0.00% $0 $0 0.00% 0.00% 0.00% 0.00% 0.00%
Lee County Board of Education $0 $0 $0 $0 $0 $0 $0 $0 $0 0.00% $0 $0 0.00% 0.00% 0.00% 0.00% 0.00%
Lenoir County Public Schools $0 $0 $0 $0 $0 $0 $0 $0 $0 0.00% $0 $0 0.00% 0.00% 0.00% 0.00% 0.00%
Lincoln County Schools $0 $0 $0 $0 $0 $0 $0 $0 $0 0.00% $0 $0 0.00% 0.00% 0.00% 0.00% 0.00%
Madison County Public Schools $0 $0 $0 $0 $0 $0 $0 $0 $0 0.00% $0 $0 0.00% 0.00% 0.00% 0.00% 0.00%
McDowell County Schools $0 $0 $0 $0 $0 $0 $0 $0 $0 0.00% $0 $0 0.00% 0.00% 0.00% 0.00% 0.00%
Moore County Schools $0 $0 $0 $0 $0 $0 $0 $0 $0 0.00% $0 $0 0.00% 0.00% 0.00% 0.00% 0.00%
Nash-Rocky Mount Schools $0 $0 $0 $0 $0 $0 $0 $0 $0 0.00% $0 $0 0.00% 0.00% 0.00% 0.00% 0.00%
New Hanover County Schools $38,582,480 $1,704,758 $0 $0 $508,065 $1,677,679 $0 $0 $3,890,502 10.08% $38,582,480 $3,890,502 10.08% 10.01% 12.76% 0.00% 0.00%
Newton-Conover City Schools $0 $0 $0 $0 $0 $0 $0 $0 $0 0.00% $0 $0 0.00% 0.00% 0.00% 0.00% 0.00%
Northampton County Schools $0 $0 $0 $0 $0 $0 $0 $0 $0 0.00% $0 $0 0.00% 0.00% 0.00% 0.00% 0.00%
Pamlico County Schools $0 $0 $0 $0 $0 $0 $0 $0 $0 0.00% $0 $0 0.00% 0.00% 0.00% 0.00% 0.00%
Person County Schools $0 $0 $0 $0 $0 $0 $0 $0 $0 0.00% $0 $0 0.00% 0.00% 0.00% 0.00% 0.00%
Pitt County Schools $0 $0 $0 $0 $0 $0 $0 $0 $0 0.00% $0 $0 0.00% 0.00% 0.00% 0.00% 0.00%
Randolph County Schools $0 $0 $0 $0 $0 $0 $0 $0 $0 0.00% $0 $0 0.00% 0.00% 0.00% 0.00% 0.00%
Richmond County Schools $0 $0 $0 $0 $0 $0 $0 $0 $0 0.00% $0 $0 0.00% 0.00% 0.00% 0.00% 0.00%
Roanoke Rapids City School $0 $0 $0 $0 $0 $0 $0 $0 $0 0.00% $0 $0 0.00% 0.00% 0.00% 0.00% 0.00%
Robeson County Public Schools $0 $0 $0 $0 $0 $0 $0 $0 $0 0.00% $0 $0 0.00% 0.00% 0.00% 0.00% 0.00%
Rocky Mount Preparatory School $0 $0 $0 $0 $0 $0 $0 $0 $0 0.00% $0 $0 0.00% 0.00% 0.00% 0.00% 0.00%
Rowan-Salisbury School System $775,638 $775,638 $0 $0 $0 $0 $0 $0 $775,638 100.00% $775,638 $775,638 100.00% 100.00% 0.00% 0.00% 0.00%
Rutherford County Schools $0 $0 $0 $0 $0 $0 $0 $0 $0 0.00% $0 $0 0.00% 0.00% 0.00% 0.00% 0.00%
Scotland County Schools $0 $0 $0 $0 $0 $0 $0 $0 $0 0.00% $0 $0 0.00% 0.00% 0.00% 0.00% 0.00%
Stokes County Schools $0 $0 $0 $0 $0 $0 $0 $0 $0 0.00% $0 $0 0.00% 0.00% 0.00% 0.00% 0.00%
Surry County Board of Education $0 $0 $0 $0 $0 $0 $0 $0 $0 0.00% $0 $0 0.00% 0.00% 0.00% 0.00% 0.00%
Transylvania County Schools $0 $0 $0 $0 $0 $0 $0 $0 $0 0.00% $0 $0 0.00% 0.00% 0.00% 0.00% 0.00%
Union County Public Schools $2,534,136 $11,000 $800 $0 $974 $166,327 $0 $0 $179,101 7.07% $2,534,136 $179,101 7.07% 2.99% 12.86% 0.00% 0.00%
Vance County Board of Education $105,228 $0 $0 $0 $0 $0 $0 $0 $0 0.00% $105,228 $0 0.00% 0.00% 0.00% 0.00% 0.00%
Wake County Public School System -
Auxiliary Services $35,747,398 $49,070 $541,487 $1,611,395 $0 $4,101,353 $0 $0 $6,303,305 17.63% $35,747,398 $6,303,305 17.63% 20.82% 17.76% 0.00% 0.00%
Washington County Schools $0 $0 $0 $0 $0 $0 $0 $0 $0 0.00% $0 $0 0.00% 0.00% 0.00% 0.00% 0.00%
Wayne County Public Schools $0 $0 $0 $0 $0 $0 $0 $0 $0 0.00% $0 $0 0.00% 0.00% 0.00% 0.00% 0.00%
Wilkes County Public Schools $0 $0 $0 $0 $0 $0 $0 $0 $0 0.00% $0 $0 0.00% 0.00% 0.00% 0.00% 0.00%
Wilson County Schools $0 $0 $0 $0 $0 $0 $0 $0 $0 0.00% $0 $0 0.00% 0.00% 0.00% 0.00% 0.00%
Winston-Salem/Forsyth County Schools $2,934,090 $1,046 $36,011 $0 $0 $249,546 $0 $0 $286,603 9.77% $2,934,090 $286,604 9.77% 0.00% 10.21% 0.00% 1.44%
Yadkin County Schools $536,311 $0 $0 $0 $0 $0 $0 $0 $0 0.00% $536,311 $0 0.00% 0.00% 0.00% 0.00% 0.00%
Yancey County Schools $0 $0 $0 $0 $0 $0 $0 $0 $0 0.00% $0 $0 0.00% 0.00% 0.00% 0.00% 0.00%
TOTALS $120,518,231 $3,956,850 $1,398,521 $2,082,170 $509,039 $14,315,136 $0 $7,243 $22,268,959 18.48% $120,518,231 $22,268,959 18.48% 11.03% 27.40% 0.91% 11.86%
% of Total Purchasing 3.28% 1.16% 1.73% 0.42% 11.88% 0.00% 0.01% 18.48%
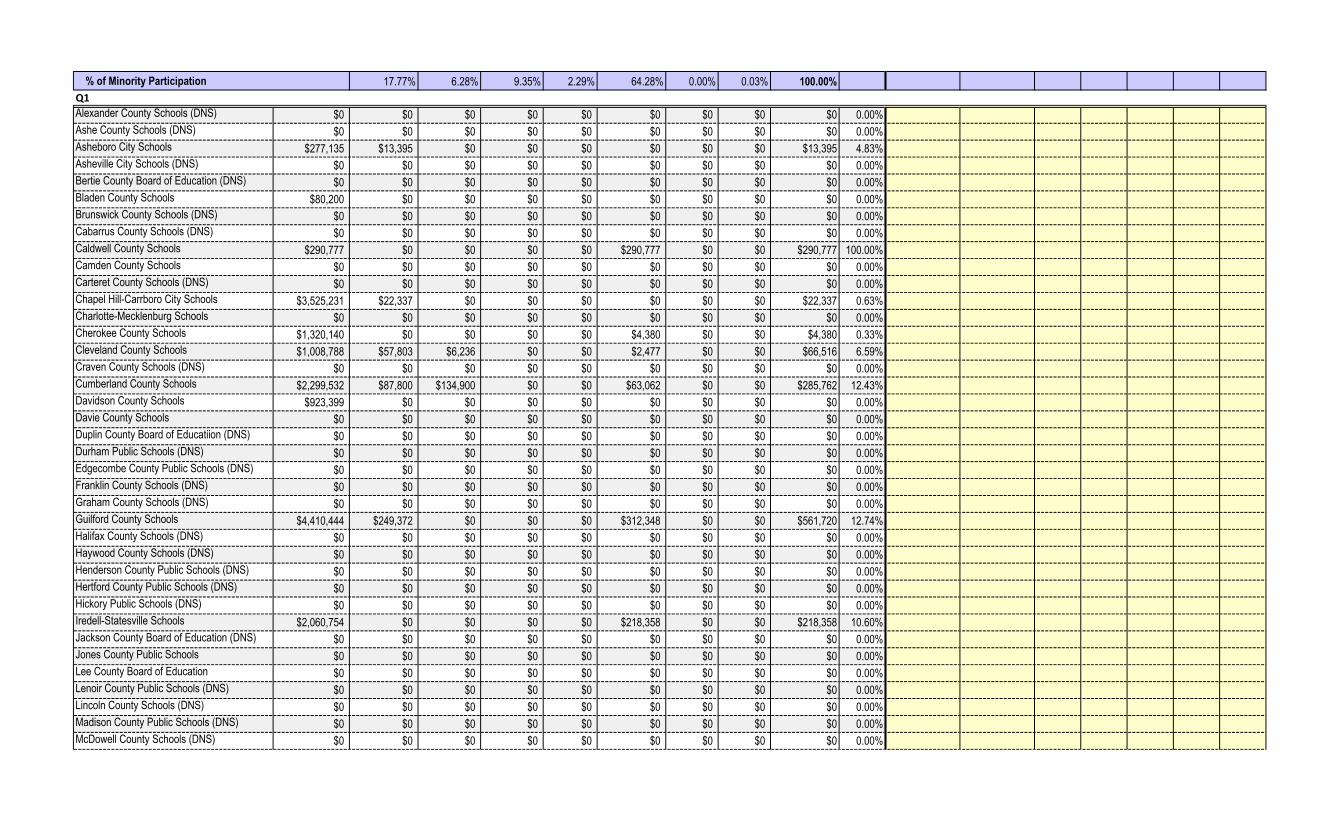
17.77% 6.28% 9.35% 2.29% 64.28% 0.00% 0.03% 100.00%
Q1
Alexander County Schools (DNS) $0 $0 $0 $0 $0 $0 $0 $0 $0 0.00%
Ashe County Schools (DNS) $0 $0 $0 $0 $0 $0 $0 $0 $0 0.00%
Asheboro City Schools $277,135 $13,395 $0 $0 $0 $0 $0 $0 $13,395 4.83%
Asheville City Schools (DNS) $0 $0 $0 $0 $0 $0 $0 $0 $0 0.00%
Bertie County Board of Education (DNS) $0 $0 $0 $0 $0 $0 $0 $0 $0 0.00%
Bladen County Schools $80,200 $0 $0 $0 $0 $0 $0 $0 $0 0.00%
Brunswick County Schools (DNS) $0 $0 $0 $0 $0 $0 $0 $0 $0 0.00%
Cabarrus County Schools (DNS) $0 $0 $0 $0 $0 $0 $0 $0 $0 0.00%
Caldwell County Schools $290,777 $0 $0 $0 $0 $290,777 $0 $0 $290,777 100.00%
Camden County Schools $0 $0 $0 $0 $0 $0 $0 $0 $0 0.00%
Carteret County Schools (DNS) $0 $0 $0 $0 $0 $0 $0 $0 $0 0.00%
Chapel Hill-Carrboro City Schools $3,525,231 $22,337 $0 $0 $0 $0 $0 $0 $22,337 0.63%
Charlotte-Mecklenburg Schools $0 $0 $0 $0 $0 $0 $0 $0 $0 0.00%
Cherokee County Schools $1,320,140 $0 $0 $0 $0 $4,380 $0 $0 $4,380 0.33%
Cleveland County Schools $1,008,788 $57,803 $6,236 $0 $0 $2,477 $0 $0 $66,516 6.59%
Craven County Schools (DNS) $0 $0 $0 $0 $0 $0 $0 $0 $0 0.00%
Cumberland County Schools $2,299,532 $87,800 $134,900 $0 $0 $63,062 $0 $0 $285,762 12.43%
Davidson County Schools $923,399 $0 $0 $0 $0 $0 $0 $0 $0 0.00%
Davie County Schools $0 $0 $0 $0 $0 $0 $0 $0 $0 0.00%
Duplin County Board of Educatiion (DNS) $0 $0 $0 $0 $0 $0 $0 $0 $0 0.00%
Durham Public Schools (DNS) $0 $0 $0 $0 $0 $0 $0 $0 $0 0.00%
Edgecombe County Public Schools (DNS) $0 $0 $0 $0 $0 $0 $0 $0 $0 0.00%
Franklin County Schools (DNS) $0 $0 $0 $0 $0 $0 $0 $0 $0 0.00%
Graham County Schools (DNS) $0 $0 $0 $0 $0 $0 $0 $0 $0 0.00%
Guilford County Schools $4,410,444 $249,372 $0 $0 $0 $312,348 $0 $0 $561,720 12.74%
Halifax County Schools (DNS) $0 $0 $0 $0 $0 $0 $0 $0 $0 0.00%
Haywood County Schools (DNS) $0 $0 $0 $0 $0 $0 $0 $0 $0 0.00%
Henderson County Public Schools (DNS) $0 $0 $0 $0 $0 $0 $0 $0 $0 0.00%
Hertford County Public Schools (DNS) $0 $0 $0 $0 $0 $0 $0 $0 $0 0.00%
Hickory Public Schools (DNS) $0 $0 $0 $0 $0 $0 $0 $0 $0 0.00%
Iredell-Statesville Schools $2,060,754 $0 $0 $0 $0 $218,358 $0 $0 $218,358 10.60%
Jackson County Board of Education (DNS) $0 $0 $0 $0 $0 $0 $0 $0 $0 0.00%
Jones County Public Schools $0 $0 $0 $0 $0 $0 $0 $0 $0 0.00%
Lee County Board of Education $0 $0 $0 $0 $0 $0 $0 $0 $0 0.00%
Lenoir County Public Schools (DNS) $0 $0 $0 $0 $0 $0 $0 $0 $0 0.00%
Lincoln County Schools (DNS) $0 $0 $0 $0 $0 $0 $0 $0 $0 0.00%
Madison County Public Schools (DNS) $0 $0 $0 $0 $0 $0 $0 $0 $0 0.00%
McDowell County Schools (DNS) $0 $0 $0 $0 $0 $0 $0 $0 $0 0.00%
% of Minority Participation

Moore County Schools (DNS) $0 $0 $0 $0 $0 $0 $0 $0 $0 0.00%
Nash-Rocky Mount Schools (DNS) $0 $0 $0 $0 $0 $0 $0 $0 $0 0.00%
New Hanover County Schools $37,565,308 $1,704,758 $0 $0 $508,065 $1,547,868 $0 $0 $3,760,691 10.01%
Newton-Conover City Schools $0 $0 $0 $0 $0 $0 $0 $0 $0 0.00%
Northampton County Schools (DNS) $0 $0 $0 $0 $0 $0 $0 $0 $0 0.00%
Pamlico County Schools $0 $0 $0 $0 $0 $0 $0 $0 $0 0.00%
Person County Schools (DNS) $0 $0 $0 $0 $0 $0 $0 $0 $0 0.00%
Pitt County Schools (DNS) $0 $0 $0 $0 $0 $0 $0 $0 $0 0.00%
Randolph County Schools $0 $0 $0 $0 $0 $0 $0 $0 $0 0.00%
Richmond County Schools (DNS) $0 $0 $0 $0 $0 $0 $0 $0 $0 0.00%
Roanoke Rapids City School (DNS) $0 $0 $0 $0 $0 $0 $0 $0 $0 0.00%
Robeson County Public Schools (DNS) $0 $0 $0 $0 $0 $0 $0 $0 $0 0.00%
Rocky Mount Preparatory School (DNS) $0 $0 $0 $0 $0 $0 $0 $0 $0 0.00%
Rowan-Salisbury School System $775,638 $775,638 $0 $0 $0 $0 $0 $0 $775,638 100.00%
Rutherford County Schools $0 $0 $0 $0 $0 $0 $0 $0 $0 0.00%
Scotland County Schools (DNS) $0 $0 $0 $0 $0 $0 $0 $0 $0 0.00%
Stokes County Schools (DNS) $0 $0 $0 $0 $0 $0 $0 $0 $0 0.00%
Surry County Board of Education $0 $0 $0 $0 $0 $0 $0 $0 $0 0.00%
Transylvania County Schools $0 $0 $0 $0 $0 $0 $0 $0 $0 0.00%
Union County Public Schools $394,994 $11,000 $800 $0 $0 $0 $0 $0 $11,800 2.99%
Vance County Board of Education $105,228 $0 $0 $0 $0 $0 $0 $0 $0 0.00%
Wake County Public School System -
Auxiliary Services $798,393 $0 $5,046 $0 $0 $161,179 $0 $0 $166,225 20.82%
Washington County Schools $0 $0 $0 $0 $0 $0 $0 $0 $0 0.00%
Wayne County Public Schools (DNS) $0 $0 $0 $0 $0 $0 $0 $0 $0 0.00%
Wilkes County Public Schools $0 $0 $0 $0 $0 $0 $0 $0 $0 0.00%
Wilson County Schools (DNS) $0 $0 $0 $0 $0 $0 $0 $0 $0 0.00%Winston-Salem/Forsyth County Schools
(DNS) $0 $0 $0 $0 $0 $0 $0 $0 $0 0.00%
Yadkin County Schools $151,272 $0 $0 $0 $0 $0 $0 $0 $0 0.00%
Yancey County Schools (DNS) $0 $0 $0 $0 $0 $0 $0 $0 $0 0.00%
TOTALS $55,987,233 $2,922,103 $146,982 $0 $508,065 $2,600,449 $0 $0 $6,177,599 11.03%
5.22% 0.26% 0.00% 0.91% 4.64% 0.00% 0.00% 11.03%
Q2
Alexander County Schools (DNS) $0 $0 $0 $0 $0 $0 $0 $0 $0 0.00% $0 $0 0.00% 0.00%
Ashe County Schools (DNS) $0 $0 $0 $0 $0 $0 $0 $0 $0 0.00% $0 $0 0.00% 0.00%
Asheboro City Schools $93,832 $0 $0 $0 $0 $0 $0 $0 $0 0.00% $370,967 $13,395 3.61% 4.83%
Asheville City Schools (DNS) $0 $0 $0 $0 $0 $0 $0 $0 $0 0.00% $0 $0 0.00% 0.00%
Bertie County Board of Education (DNS) $0 $0 $0 $0 $0 $0 $0 $0 $0 0.00% $0 $0 0.00% 0.00%
Bladen County Schools $189,000 $0 $0 $0 $0 $0 $0 $0 $0 0.00% $269,200 $0 0.00% 0.00%
Brunswick County Schools (DNS) $0 $0 $0 $0 $0 $0 $0 $0 $0 0.00% $0 $0 0.00% 0.00%
Cabarrus County Schools (DNS) $0 $0 $0 $0 $0 $0 $0 $0 $0 0.00% $0 $0 0.00% 0.00%
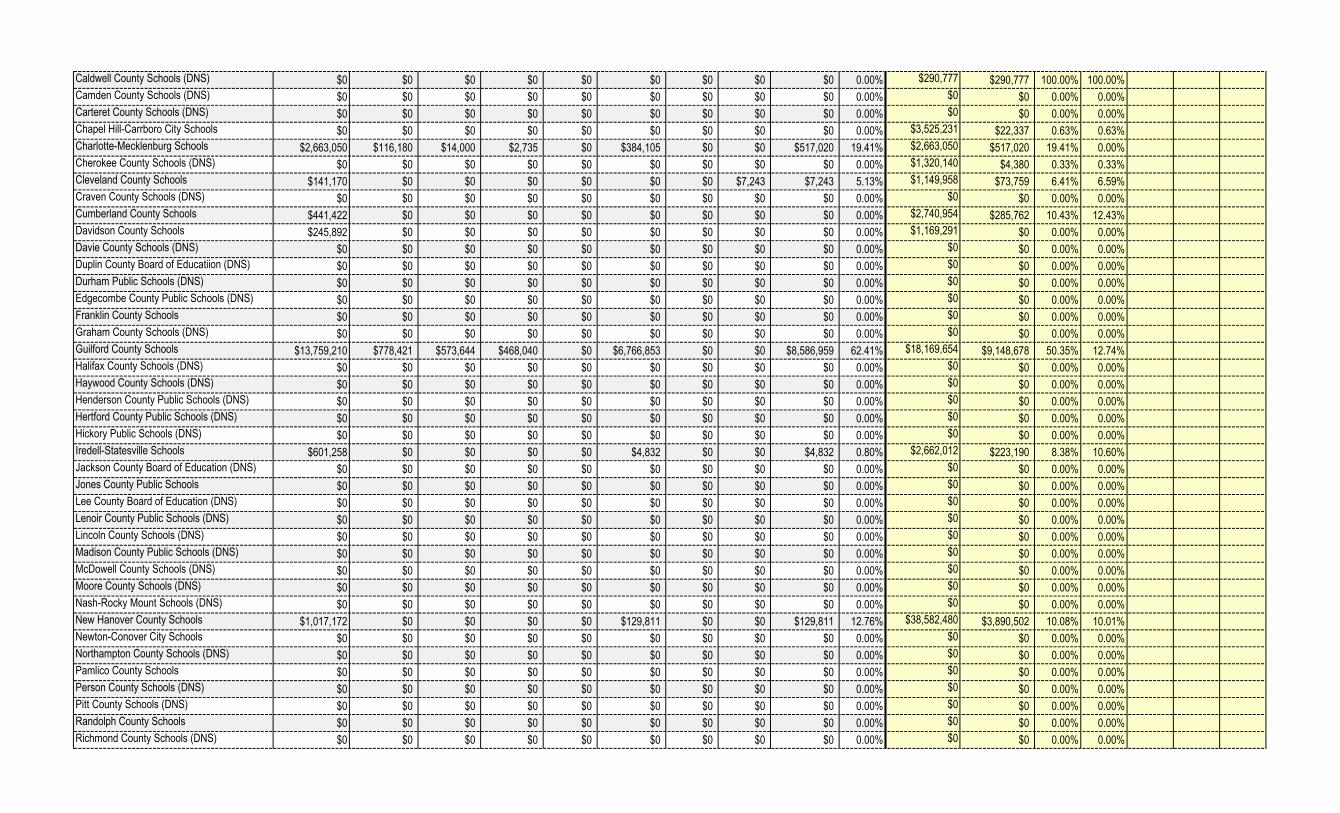
Caldwell County Schools (DNS) $0 $0 $0 $0 $0 $0 $0 $0 $0 0.00% $290,777 $290,777 100.00% 100.00%
Camden County Schools (DNS) $0 $0 $0 $0 $0 $0 $0 $0 $0 0.00% $0 $0 0.00% 0.00%
Carteret County Schools (DNS) $0 $0 $0 $0 $0 $0 $0 $0 $0 0.00% $0 $0 0.00% 0.00%
Chapel Hill-Carrboro City Schools $0 $0 $0 $0 $0 $0 $0 $0 $0 0.00% $3,525,231 $22,337 0.63% 0.63%
Charlotte-Mecklenburg Schools $2,663,050 $116,180 $14,000 $2,735 $0 $384,105 $0 $0 $517,020 19.41% $2,663,050 $517,020 19.41% 0.00%
Cherokee County Schools (DNS) $0 $0 $0 $0 $0 $0 $0 $0 $0 0.00% $1,320,140 $4,380 0.33% 0.33%
Cleveland County Schools $141,170 $0 $0 $0 $0 $0 $0 $7,243 $7,243 5.13% $1,149,958 $73,759 6.41% 6.59%
Craven County Schools (DNS) $0 $0 $0 $0 $0 $0 $0 $0 $0 0.00% $0 $0 0.00% 0.00%
Cumberland County Schools $441,422 $0 $0 $0 $0 $0 $0 $0 $0 0.00% $2,740,954 $285,762 10.43% 12.43%
Davidson County Schools $245,892 $0 $0 $0 $0 $0 $0 $0 $0 0.00% $1,169,291 $0 0.00% 0.00%
Davie County Schools (DNS) $0 $0 $0 $0 $0 $0 $0 $0 $0 0.00% $0 $0 0.00% 0.00%
Duplin County Board of Educatiion (DNS) $0 $0 $0 $0 $0 $0 $0 $0 $0 0.00% $0 $0 0.00% 0.00%
Durham Public Schools (DNS) $0 $0 $0 $0 $0 $0 $0 $0 $0 0.00% $0 $0 0.00% 0.00%
Edgecombe County Public Schools (DNS) $0 $0 $0 $0 $0 $0 $0 $0 $0 0.00% $0 $0 0.00% 0.00%
Franklin County Schools $0 $0 $0 $0 $0 $0 $0 $0 $0 0.00% $0 $0 0.00% 0.00%
Graham County Schools (DNS) $0 $0 $0 $0 $0 $0 $0 $0 $0 0.00% $0 $0 0.00% 0.00%
Guilford County Schools $13,759,210 $778,421 $573,644 $468,040 $0 $6,766,853 $0 $0 $8,586,959 62.41% $18,169,654 $9,148,678 50.35% 12.74%
Halifax County Schools (DNS) $0 $0 $0 $0 $0 $0 $0 $0 $0 0.00% $0 $0 0.00% 0.00%
Haywood County Schools (DNS) $0 $0 $0 $0 $0 $0 $0 $0 $0 0.00% $0 $0 0.00% 0.00%
Henderson County Public Schools (DNS) $0 $0 $0 $0 $0 $0 $0 $0 $0 0.00% $0 $0 0.00% 0.00%
Hertford County Public Schools (DNS) $0 $0 $0 $0 $0 $0 $0 $0 $0 0.00% $0 $0 0.00% 0.00%
Hickory Public Schools (DNS) $0 $0 $0 $0 $0 $0 $0 $0 $0 0.00% $0 $0 0.00% 0.00%
Iredell-Statesville Schools $601,258 $0 $0 $0 $0 $4,832 $0 $0 $4,832 0.80% $2,662,012 $223,190 8.38% 10.60%
Jackson County Board of Education (DNS) $0 $0 $0 $0 $0 $0 $0 $0 $0 0.00% $0 $0 0.00% 0.00%
Jones County Public Schools $0 $0 $0 $0 $0 $0 $0 $0 $0 0.00% $0 $0 0.00% 0.00%
Lee County Board of Education (DNS) $0 $0 $0 $0 $0 $0 $0 $0 $0 0.00% $0 $0 0.00% 0.00%
Lenoir County Public Schools (DNS) $0 $0 $0 $0 $0 $0 $0 $0 $0 0.00% $0 $0 0.00% 0.00%
Lincoln County Schools (DNS) $0 $0 $0 $0 $0 $0 $0 $0 $0 0.00% $0 $0 0.00% 0.00%
Madison County Public Schools (DNS) $0 $0 $0 $0 $0 $0 $0 $0 $0 0.00% $0 $0 0.00% 0.00%
McDowell County Schools (DNS) $0 $0 $0 $0 $0 $0 $0 $0 $0 0.00% $0 $0 0.00% 0.00%
Moore County Schools (DNS) $0 $0 $0 $0 $0 $0 $0 $0 $0 0.00% $0 $0 0.00% 0.00%
Nash-Rocky Mount Schools (DNS) $0 $0 $0 $0 $0 $0 $0 $0 $0 0.00% $0 $0 0.00% 0.00%
New Hanover County Schools $1,017,172 $0 $0 $0 $0 $129,811 $0 $0 $129,811 12.76% $38,582,480 $3,890,502 10.08% 10.01%
Newton-Conover City Schools $0 $0 $0 $0 $0 $0 $0 $0 $0 0.00% $0 $0 0.00% 0.00%
Northampton County Schools (DNS) $0 $0 $0 $0 $0 $0 $0 $0 $0 0.00% $0 $0 0.00% 0.00%
Pamlico County Schools $0 $0 $0 $0 $0 $0 $0 $0 $0 0.00% $0 $0 0.00% 0.00%
Person County Schools (DNS) $0 $0 $0 $0 $0 $0 $0 $0 $0 0.00% $0 $0 0.00% 0.00%
Pitt County Schools (DNS) $0 $0 $0 $0 $0 $0 $0 $0 $0 0.00% $0 $0 0.00% 0.00%
Randolph County Schools $0 $0 $0 $0 $0 $0 $0 $0 $0 0.00% $0 $0 0.00% 0.00%
Richmond County Schools (DNS) $0 $0 $0 $0 $0 $0 $0 $0 $0 0.00% $0 $0 0.00% 0.00%

Roanoke Rapids City School (DNS) $0 $0 $0 $0 $0 $0 $0 $0 $0 0.00% $0 $0 0.00% 0.00%
Robeson County Public Schools (DNS) $0 $0 $0 $0 $0 $0 $0 $0 $0 0.00% $0 $0 0.00% 0.00%
Rocky Mount Preparatory School (DNS) $0 $0 $0 $0 $0 $0 $0 $0 $0 0.00% $0 $0 0.00% 0.00%
Rowan-Salisbury School System $0 $0 $0 $0 $0 $0 $0 $0 $0 0.00% $775,638 $775,638 100.00% 100.00%
Rutherford County Schools $0 $0 $0 $0 $0 $0 $0 $0 $0 0.00% $0 $0 0.00% 0.00%
Scotland County Schools (DNS) $0 $0 $0 $0 $0 $0 $0 $0 $0 0.00% $0 $0 0.00% 0.00%
Stokes County Schools (DNS) $0 $0 $0 $0 $0 $0 $0 $0 $0 0.00% $0 $0 0.00% 0.00%
Surry County Board of Education (DNS) $0 $0 $0 $0 $0 $0 $0 $0 $0 0.00% $0 $0 0.00% 0.00%
Transylvania County Schools $0 $0 $0 $0 $0 $0 $0 $0 $0 0.00% $0 $0 0.00% 0.00%
Union County Public Schools $1,300,570 $0 $0 $0 $974 $166,327 $0 $0 $167,301 12.86% $1,695,564 $179,101 10.56% 2.99%
Vance County Board of Education (DNS) $0 $0 $0 $0 $0 $0 $0 $0 $0 0.00% $105,228 $0 0.00% 0.00%
Wake County Public School System -
Auxiliary Services $34,559,539 $49,070 $536,441 $1,611,395 $0 $3,940,174 $0 $0 $6,137,080 17.76% $35,357,932 $6,303,305 17.83% 20.82%
Washington County Schools $0 $0 $0 $0 $0 $0 $0 $0 $0 0.00% $0 $0 0.00% 0.00%
Wayne County Public Schools (DNS) $0 $0 $0 $0 $0 $0 $0 $0 $0 0.00% $0 $0 0.00% 0.00%
Wilkes County Public Schools $0 $0 $0 $0 $0 $0 $0 $0 $0 0.00% $0 $0 0.00% 0.00%
Wilson County Schools (DNS) $0 $0 $0 $0 $0 $0 $0 $0 $0 0.00% $0 $0 0.00% 0.00%
Winston-Salem/Forsyth County Schools $2,786,479 $0 $35,211 $0 $0 $249,268 $0 $0 $284,479 10.21% $2,786,479 $284,479 10.21% 0.00%
Yadkin County Schools $0 $0 $0 $0 $0 $0 $0 $0 $0 0.00% $151,272 $0 0.00% 0.00%
Yancey County Schools (DNS) $0 $0 $0 $0 $0 $0 $0 $0 $0 0.00% $0 $0 0.00% 0.00%
TOTALS $57,798,594 $943,671 $1,159,296 $2,082,170 $974 $11,641,370 $0 $7,243 $15,834,725 27.40% $113,785,827 $22,012,323 19.35% 11.03%
1.63% 2.01% 3.60% 0.00% 20.14% 0.00% 0.01% 27.40%
Q3
Alexander County Schools (DNS) $0 $0 $0 $0 $0 $0 $0 $0 $0 0.00% $0 $0 0.00% 0.00% 0.00%
Ashe County Schools (DNS) $0 $0 $0 $0 $0 $0 $0 $0 $0 0.00% $0 $0 0.00% 0.00% 0.00%
Asheboro City Schools $0 $0 $0 $0 $0 $0 $0 $0 $0 0.00% $370,967 $13,395 3.61% 4.83% 0.00%
Asheville City Schools (DNS) $0 $0 $0 $0 $0 $0 $0 $0 $0 0.00% $0 $0 0.00% 0.00% 0.00%
Bertie County Board of Education (DNS) $0 $0 $0 $0 $0 $0 $0 $0 $0 0.00% $0 $0 0.00% 0.00% 0.00%
Bladen County Schools (DNS) $0 $0 $0 $0 $0 $0 $0 $0 $0 0.00% $269,200 $0 0.00% 0.00% 0.00%
Brunswick County Schools (DNS) $0 $0 $0 $0 $0 $0 $0 $0 $0 0.00% $0 $0 0.00% 0.00% 0.00%
Cabarrus County Schools (DNS) $0 $0 $0 $0 $0 $0 $0 $0 $0 0.00% $0 $0 0.00% 0.00% 0.00%
Caldwell County Schools (DNS) $0 $0 $0 $0 $0 $0 $0 $0 $0 0.00% $290,777 $290,777 100.00% 100.00% 0.00%
Camden County Schools $0 $0 $0 $0 $0 $0 $0 $0 $0 0.00% $0 $0 0.00% 0.00% 0.00%
Carteret County Schools (DNS) $0 $0 $0 $0 $0 $0 $0 $0 $0 0.00% $0 $0 0.00% 0.00% 0.00%
Chapel Hill-Carrboro City Schools $2,244,881 $0 $0 $0 $0 $0 $0 $0 $0 0.00% $5,770,112 $22,337 0.39% 0.63% 0.00%
Charlotte-Mecklenburg Schools $60,800 $0 $0 $0 $0 $0 $0 $0 $0 0.00% $2,723,850 $517,020 18.98% 0.00% 19.41%
Cherokee County Schools $0 $0 $0 $0 $0 $0 $0 $0 $0 0.00% $1,320,140 $4,380 0.33% 0.33% 0.00%
Cleveland County Schools $19,479 $0 $0 $0 $0 $0 $0 $0 $0 0.00% $1,169,437 $73,759 6.31% 6.59% 5.13%
Craven County Schools (DNS) $0 $0 $0 $0 $0 $0 $0 $0 $0 0.00% $0 $0 0.00% 0.00% 0.00%
Cumberland County Schools $92,199 $0 $0 $0 $0 $0 $0 $0 $0 0.00% $2,833,153 $285,762 10.09% 12.43% 0.00%
Davidson County Schools $624,777 $0 $0 $0 $0 $0 $0 $0 $0 0.00% $1,794,068 $0 0.00% 0.00% 0.00%

Davie County Schools (DNS) $0 $0 $0 $0 $0 $0 $0 $0 $0 0.00% $0 $0 0.00% 0.00% 0.00%
Duplin County Board of Educatiion (DNS) $0 $0 $0 $0 $0 $0 $0 $0 $0 0.00% $0 $0 0.00% 0.00% 0.00%
Durham Public Schools (DNS) $0 $0 $0 $0 $0 $0 $0 $0 $0 0.00% $0 $0 0.00% 0.00% 0.00%
Edgecombe County Public Schools (DNS) $0 $0 $0 $0 $0 $0 $0 $0 $0 0.00% $0 $0 0.00% 0.00% 0.00%
Franklin County Schools $0 $0 $0 $0 $0 $0 $0 $0 $0 0.00% $0 $0 0.00% 0.00% 0.00%
Graham County Schools (DNS) $0 $0 $0 $0 $0 $0 $0 $0 $0 0.00% $0 $0 0.00% 0.00% 0.00%
Guilford County Schools $182,935 $2,000 $0 $0 $0 $42,800 $0 $0 $44,800 24.49% $18,352,589 $9,193,478 50.09% 12.74% 62.41%
Halifax County Schools (DNS) $0 $0 $0 $0 $0 $0 $0 $0 $0 0.00% $0 $0 0.00% 0.00% 0.00%
Haywood County Schools (DNS) $0 $0 $0 $0 $0 $0 $0 $0 $0 0.00% $0 $0 0.00% 0.00% 0.00%
Henderson County Public Schools (DNS) $0 $0 $0 $0 $0 $0 $0 $0 $0 0.00% $0 $0 0.00% 0.00% 0.00%
Hertford County Public Schools (DNS) $0 $0 $0 $0 $0 $0 $0 $0 $0 0.00% $0 $0 0.00% 0.00% 0.00%
Hickory Public Schools (DNS) $0 $0 $0 $0 $0 $0 $0 $0 $0 0.00% $0 $0 0.00% 0.00% 0.00%
Iredell-Statesville Schools $266,720 $0 $0 $0 $0 $0 $0 $0 $0 0.00% $2,928,732 $223,190 7.62% 10.60% 0.80%
Jackson County Board of Education (DNS) $0 $0 $0 $0 $0 $0 $0 $0 $0 0.00% $0 $0 0.00% 0.00% 0.00%
Jones County Public Schools $0 $0 $0 $0 $0 $0 $0 $0 $0 0.00% $0 $0 0.00% 0.00% 0.00%
Lee County Board of Education (DNS) $0 $0 $0 $0 $0 $0 $0 $0 $0 0.00% $0 $0 0.00% 0.00% 0.00%
Lenoir County Public Schools (DNS) $0 $0 $0 $0 $0 $0 $0 $0 $0 0.00% $0 $0 0.00% 0.00% 0.00%
Lincoln County Schools (DNS) $0 $0 $0 $0 $0 $0 $0 $0 $0 0.00% $0 $0 0.00% 0.00% 0.00%
Madison County Public Schools (DNS) $0 $0 $0 $0 $0 $0 $0 $0 $0 0.00% $0 $0 0.00% 0.00% 0.00%
McDowell County Schools (DNS) $0 $0 $0 $0 $0 $0 $0 $0 $0 0.00% $0 $0 0.00% 0.00% 0.00%
Moore County Schools $0 $0 $0 $0 $0 $0 $0 $0 $0 0.00% $0 $0 0.00% 0.00% 0.00%
Nash-Rocky Mount Schools (DNS) $0 $0 $0 $0 $0 $0 $0 $0 $0 0.00% $0 $0 0.00% 0.00% 0.00%
New Hanover County Schools (DNS) $0 $0 $0 $0 $0 $0 $0 $0 $0 0.00% $38,582,480 $3,890,502 10.08% 10.01% 12.76%
Newton-Conover City Schools (DNS) $0 $0 $0 $0 $0 $0 $0 $0 $0 0.00% $0 $0 0.00% 0.00% 0.00%
Northampton County Schools (DNS) $0 $0 $0 $0 $0 $0 $0 $0 $0 0.00% $0 $0 0.00% 0.00% 0.00%
Pamlico County Schools $0 $0 $0 $0 $0 $0 $0 $0 $0 0.00% $0 $0 0.00% 0.00% 0.00%
Person County Schools (DNS) $0 $0 $0 $0 $0 $0 $0 $0 $0 0.00% $0 $0 0.00% 0.00% 0.00%
Pitt County Schools (DNS) $0 $0 $0 $0 $0 $0 $0 $0 $0 0.00% $0 $0 0.00% 0.00% 0.00%
Randolph County Schools $0 $0 $0 $0 $0 $0 $0 $0 $0 0.00% $0 $0 0.00% 0.00% 0.00%
Richmond County Schools (DNS) $0 $0 $0 $0 $0 $0 $0 $0 $0 0.00% $0 $0 0.00% 0.00% 0.00%
Roanoke Rapids City School (DNS) $0 $0 $0 $0 $0 $0 $0 $0 $0 0.00% $0 $0 0.00% 0.00% 0.00%
Robeson County Public Schools $0 $0 $0 $0 $0 $0 $0 $0 $0 0.00% $0 $0 0.00% 0.00% 0.00%
Rocky Mount Preparatory School (DNS) $0 $0 $0 $0 $0 $0 $0 $0 $0 0.00% $0 $0 0.00% 0.00% 0.00%
Rowan-Salisbury School System $0 $0 $0 $0 $0 $0 $0 $0 $0 0.00% $775,638 $775,638 100.00% 100.00% 0.00%
Rutherford County Schools $0 $0 $0 $0 $0 $0 $0 $0 $0 0.00% $0 $0 0.00% 0.00% 0.00%
Scotland County Schools (DNS) $0 $0 $0 $0 $0 $0 $0 $0 $0 0.00% $0 $0 0.00% 0.00% 0.00%
Stokes County Schools (DNS) $0 $0 $0 $0 $0 $0 $0 $0 $0 0.00% $0 $0 0.00% 0.00% 0.00%
Surry County Board of Education $0 $0 $0 $0 $0 $0 $0 $0 $0 0.00% $0 $0 0.00% 0.00% 0.00%
Transylvania County Schools $0 $0 $0 $0 $0 $0 $0 $0 $0 0.00% $0 $0 0.00% 0.00% 0.00%
Union County Public Schools $679,262 $0 $0 $0 $0 $0 $0 $0 $0 0.00% $2,374,826 $179,101 7.54% 2.99% 12.86%
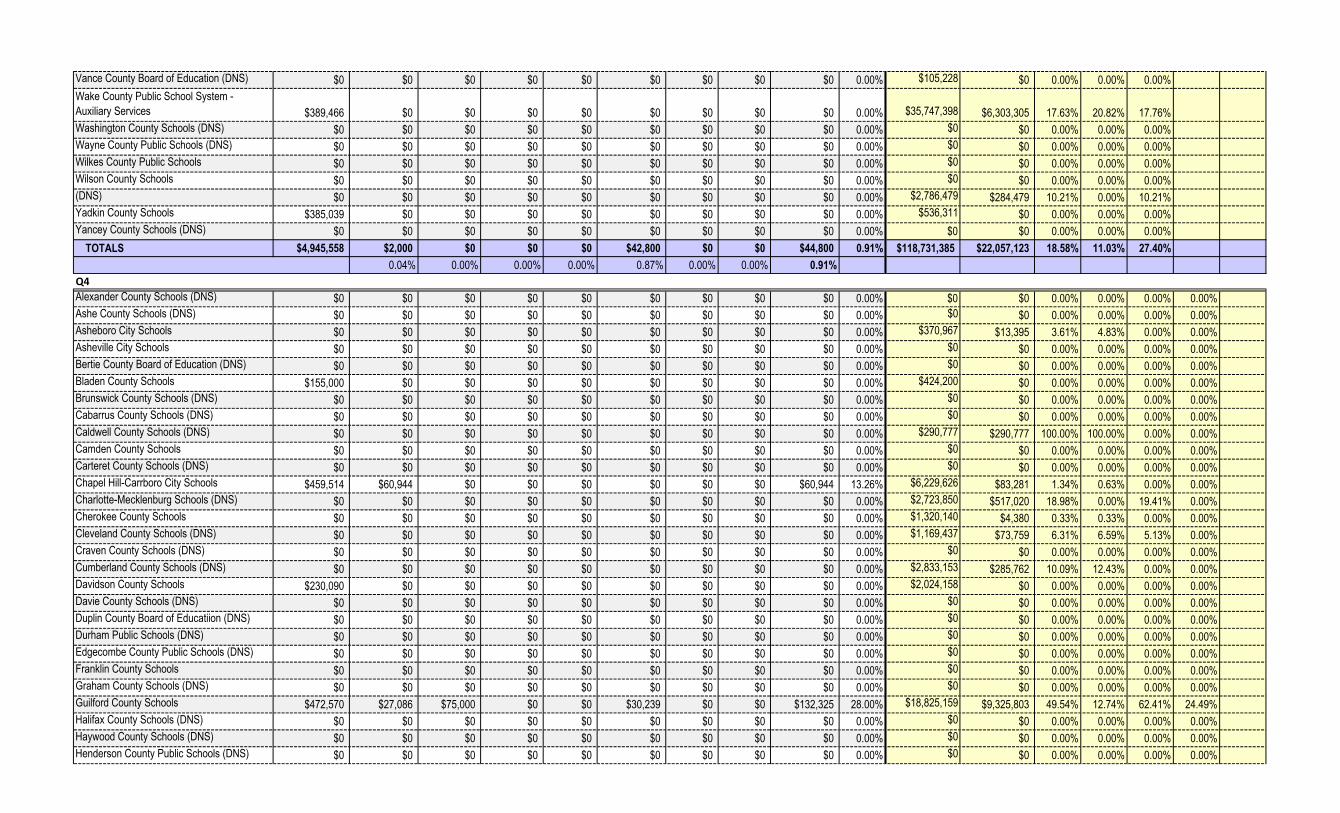
Vance County Board of Education (DNS) $0 $0 $0 $0 $0 $0 $0 $0 $0 0.00% $105,228 $0 0.00% 0.00% 0.00%
Wake County Public School System -
Auxiliary Services $389,466 $0 $0 $0 $0 $0 $0 $0 $0 0.00% $35,747,398 $6,303,305 17.63% 20.82% 17.76%
Washington County Schools (DNS) $0 $0 $0 $0 $0 $0 $0 $0 $0 0.00% $0 $0 0.00% 0.00% 0.00%
Wayne County Public Schools (DNS) $0 $0 $0 $0 $0 $0 $0 $0 $0 0.00% $0 $0 0.00% 0.00% 0.00%
Wilkes County Public Schools $0 $0 $0 $0 $0 $0 $0 $0 $0 0.00% $0 $0 0.00% 0.00% 0.00%
Wilson County Schools $0 $0 $0 $0 $0 $0 $0 $0 $0 0.00% $0 $0 0.00% 0.00% 0.00%Winston-Salem/Forsyth County Schools
(DNS) $0 $0 $0 $0 $0 $0 $0 $0 $0 0.00% $2,786,479 $284,479 10.21% 0.00% 10.21%
Yadkin County Schools $385,039 $0 $0 $0 $0 $0 $0 $0 $0 0.00% $536,311 $0 0.00% 0.00% 0.00%
Yancey County Schools (DNS) $0 $0 $0 $0 $0 $0 $0 $0 $0 0.00% $0 $0 0.00% 0.00% 0.00%
TOTALS $4,945,558 $2,000 $0 $0 $0 $42,800 $0 $0 $44,800 0.91% $118,731,385 $22,057,123 18.58% 11.03% 27.40%
0.04% 0.00% 0.00% 0.00% 0.87% 0.00% 0.00% 0.91%
Q4
Alexander County Schools (DNS) $0 $0 $0 $0 $0 $0 $0 $0 $0 0.00% $0 $0 0.00% 0.00% 0.00% 0.00%
Ashe County Schools (DNS) $0 $0 $0 $0 $0 $0 $0 $0 $0 0.00% $0 $0 0.00% 0.00% 0.00% 0.00%
Asheboro City Schools $0 $0 $0 $0 $0 $0 $0 $0 $0 0.00% $370,967 $13,395 3.61% 4.83% 0.00% 0.00%
Asheville City Schools $0 $0 $0 $0 $0 $0 $0 $0 $0 0.00% $0 $0 0.00% 0.00% 0.00% 0.00%
Bertie County Board of Education (DNS) $0 $0 $0 $0 $0 $0 $0 $0 $0 0.00% $0 $0 0.00% 0.00% 0.00% 0.00%
Bladen County Schools $155,000 $0 $0 $0 $0 $0 $0 $0 $0 0.00% $424,200 $0 0.00% 0.00% 0.00% 0.00%
Brunswick County Schools (DNS) $0 $0 $0 $0 $0 $0 $0 $0 $0 0.00% $0 $0 0.00% 0.00% 0.00% 0.00%
Cabarrus County Schools (DNS) $0 $0 $0 $0 $0 $0 $0 $0 $0 0.00% $0 $0 0.00% 0.00% 0.00% 0.00%
Caldwell County Schools (DNS) $0 $0 $0 $0 $0 $0 $0 $0 $0 0.00% $290,777 $290,777 100.00% 100.00% 0.00% 0.00%
Camden County Schools $0 $0 $0 $0 $0 $0 $0 $0 $0 0.00% $0 $0 0.00% 0.00% 0.00% 0.00%
Carteret County Schools (DNS) $0 $0 $0 $0 $0 $0 $0 $0 $0 0.00% $0 $0 0.00% 0.00% 0.00% 0.00%
Chapel Hill-Carrboro City Schools $459,514 $60,944 $0 $0 $0 $0 $0 $0 $60,944 13.26% $6,229,626 $83,281 1.34% 0.63% 0.00% 0.00%
Charlotte-Mecklenburg Schools (DNS) $0 $0 $0 $0 $0 $0 $0 $0 $0 0.00% $2,723,850 $517,020 18.98% 0.00% 19.41% 0.00%
Cherokee County Schools $0 $0 $0 $0 $0 $0 $0 $0 $0 0.00% $1,320,140 $4,380 0.33% 0.33% 0.00% 0.00%
Cleveland County Schools (DNS) $0 $0 $0 $0 $0 $0 $0 $0 $0 0.00% $1,169,437 $73,759 6.31% 6.59% 5.13% 0.00%
Craven County Schools (DNS) $0 $0 $0 $0 $0 $0 $0 $0 $0 0.00% $0 $0 0.00% 0.00% 0.00% 0.00%
Cumberland County Schools (DNS) $0 $0 $0 $0 $0 $0 $0 $0 $0 0.00% $2,833,153 $285,762 10.09% 12.43% 0.00% 0.00%
Davidson County Schools $230,090 $0 $0 $0 $0 $0 $0 $0 $0 0.00% $2,024,158 $0 0.00% 0.00% 0.00% 0.00%
Davie County Schools (DNS) $0 $0 $0 $0 $0 $0 $0 $0 $0 0.00% $0 $0 0.00% 0.00% 0.00% 0.00%
Duplin County Board of Educatiion (DNS) $0 $0 $0 $0 $0 $0 $0 $0 $0 0.00% $0 $0 0.00% 0.00% 0.00% 0.00%
Durham Public Schools (DNS) $0 $0 $0 $0 $0 $0 $0 $0 $0 0.00% $0 $0 0.00% 0.00% 0.00% 0.00%
Edgecombe County Public Schools (DNS) $0 $0 $0 $0 $0 $0 $0 $0 $0 0.00% $0 $0 0.00% 0.00% 0.00% 0.00%
Franklin County Schools $0 $0 $0 $0 $0 $0 $0 $0 $0 0.00% $0 $0 0.00% 0.00% 0.00% 0.00%
Graham County Schools (DNS) $0 $0 $0 $0 $0 $0 $0 $0 $0 0.00% $0 $0 0.00% 0.00% 0.00% 0.00%
Guilford County Schools $472,570 $27,086 $75,000 $0 $0 $30,239 $0 $0 $132,325 28.00% $18,825,159 $9,325,803 49.54% 12.74% 62.41% 24.49%
Halifax County Schools (DNS) $0 $0 $0 $0 $0 $0 $0 $0 $0 0.00% $0 $0 0.00% 0.00% 0.00% 0.00%
Haywood County Schools (DNS) $0 $0 $0 $0 $0 $0 $0 $0 $0 0.00% $0 $0 0.00% 0.00% 0.00% 0.00%
Henderson County Public Schools (DNS) $0 $0 $0 $0 $0 $0 $0 $0 $0 0.00% $0 $0 0.00% 0.00% 0.00% 0.00%

Hertford County Public Schools (DNS) $0 $0 $0 $0 $0 $0 $0 $0 $0 0.00% $0 $0 0.00% 0.00% 0.00% 0.00%
Hickory Public Schools (DNS) $0 $0 $0 $0 $0 $0 $0 $0 $0 0.00% $0 $0 0.00% 0.00% 0.00% 0.00%
Iredell-Statesville Schools $162,751 $0 $16,443 $0 $0 $0 $0 $0 $16,443 10.10% $3,091,483 $239,632 7.75% 10.60% 0.80% 0.00%
Jackson County Board of Education (DNS) $0 $0 $0 $0 $0 $0 $0 $0 $0 0.00% $0 $0 0.00% 0.00% 0.00% 0.00%
Jones County Public Schools $0 $0 $0 $0 $0 $0 $0 $0 $0 0.00% $0 $0 0.00% 0.00% 0.00% 0.00%
Lee County Board of Education (DNS) $0 $0 $0 $0 $0 $0 $0 $0 $0 0.00% $0 $0 0.00% 0.00% 0.00% 0.00%
Lenoir County Public Schools (DNS) $0 $0 $0 $0 $0 $0 $0 $0 $0 0.00% $0 $0 0.00% 0.00% 0.00% 0.00%
Lincoln County Schools (DNS) $0 $0 $0 $0 $0 $0 $0 $0 $0 0.00% $0 $0 0.00% 0.00% 0.00% 0.00%
Madison County Public Schools (DNS) $0 $0 $0 $0 $0 $0 $0 $0 $0 0.00% $0 $0 0.00% 0.00% 0.00% 0.00%
McDowell County Schools (DNS) $0 $0 $0 $0 $0 $0 $0 $0 $0 0.00% $0 $0 0.00% 0.00% 0.00% 0.00%
Moore County Schools (DNS) $0 $0 $0 $0 $0 $0 $0 $0 $0 0.00% $0 $0 0.00% 0.00% 0.00% 0.00%
Nash-Rocky Mount Schools (DNS) $0 $0 $0 $0 $0 $0 $0 $0 $0 0.00% $0 $0 0.00% 0.00% 0.00% 0.00%
New Hanover County Schools (DNS) $0 $0 $0 $0 $0 $0 $0 $0 $0 0.00% $38,582,480 $3,890,502 10.08% 10.01% 12.76% 0.00%
Newton-Conover City Schools (DNS) $0 $0 $0 $0 $0 $0 $0 $0 $0 0.00% $0 $0 0.00% 0.00% 0.00% 0.00%
Northampton County Schools (DNS) $0 $0 $0 $0 $0 $0 $0 $0 $0 0.00% $0 $0 0.00% 0.00% 0.00% 0.00%
Pamlico County Schools $0 $0 $0 $0 $0 $0 $0 $0 $0 0.00% $0 $0 0.00% 0.00% 0.00% 0.00%
Person County Schools (DNS) $0 $0 $0 $0 $0 $0 $0 $0 $0 0.00% $0 $0 0.00% 0.00% 0.00% 0.00%
Pitt County Schools (DNS) $0 $0 $0 $0 $0 $0 $0 $0 $0 0.00% $0 $0 0.00% 0.00% 0.00% 0.00%
Randolph County Schools $0 $0 $0 $0 $0 $0 $0 $0 $0 0.00% $0 $0 0.00% 0.00% 0.00% 0.00%
Richmond County Schools (DNS) $0 $0 $0 $0 $0 $0 $0 $0 $0 0.00% $0 $0 0.00% 0.00% 0.00% 0.00%
Roanoke Rapids City School (DNS) $0 $0 $0 $0 $0 $0 $0 $0 $0 0.00% $0 $0 0.00% 0.00% 0.00% 0.00%
Robeson County Public Schools (DNS) $0 $0 $0 $0 $0 $0 $0 $0 $0 0.00% $0 $0 0.00% 0.00% 0.00% 0.00%
Rocky Mount Preparatory School (DNS) $0 $0 $0 $0 $0 $0 $0 $0 $0 0.00% $0 $0 0.00% 0.00% 0.00% 0.00%
Rowan-Salisbury School System (DNS) $0 $0 $0 $0 $0 $0 $0 $0 $0 0.00% $775,638 $775,638 100.00% 100.00% 0.00% 0.00%
Rutherford County Schools $0 $0 $0 $0 $0 $0 $0 $0 $0 0.00% $0 $0 0.00% 0.00% 0.00% 0.00%
Scotland County Schools (DNS) $0 $0 $0 $0 $0 $0 $0 $0 $0 0.00% $0 $0 0.00% 0.00% 0.00% 0.00%
Stokes County Schools (DNS) $0 $0 $0 $0 $0 $0 $0 $0 $0 0.00% $0 $0 0.00% 0.00% 0.00% 0.00%
Surry County Board of Education (DNS) $0 $0 $0 $0 $0 $0 $0 $0 $0 0.00% $0 $0 0.00% 0.00% 0.00% 0.00%
Transylvania County Schools $0 $0 $0 $0 $0 $0 $0 $0 $0 0.00% $0 $0 0.00% 0.00% 0.00% 0.00%
Union County Public Schools $159,310 $0 $0 $0 $0 $0 $0 $0 $0 0.00% $2,534,136 $179,101 7.07% 2.99% 12.86% 0.00%
Vance County Board of Education (DNS) $0 $0 $0 $0 $0 $0 $0 $0 $0 0.00% $105,228 $0 0.00% 0.00% 0.00% 0.00%
Wake County Public School System -
Auxiliary Services (DNS) $0 $0 $0 $0 $0 $0 $0 $0 $0 0.00% $35,747,398 $6,303,305 17.63% 20.82% 17.76% 0.00%
Washington County Schools $0 $0 $0 $0 $0 $0 $0 $0 $0 0.00% $0 $0 0.00% 0.00% 0.00% 0.00%
Wayne County Public Schools (DNS) $0 $0 $0 $0 $0 $0 $0 $0 $0 0.00% $0 $0 0.00% 0.00% 0.00% 0.00%
Wilkes County Public Schools $0 $0 $0 $0 $0 $0 $0 $0 $0 0.00% $0 $0 0.00% 0.00% 0.00% 0.00%
Wilson County Schools (DNS) $0 $0 $0 $0 $0 $0 $0 $0 $0 0.00% $0 $0 0.00% 0.00% 0.00% 0.00%
Winston-Salem/Forsyth County Schools $147,611 $1,046 $800 $0 $0 $278 $0 $0 $2,124 1.44% $2,934,090 $286,604 9.77% 0.00% 10.21% 0.00%
Yadkin County Schools (DNS) $0 $0 $0 $0 $0 $0 $0 $0 $0 0.00% $536,311 $0 0.00% 0.00% 0.00% 0.00%
Yancey County Schools (DNS) $0 $0 $0 $0 $0 $0 $0 $0 $0 0.00% $0 $0 0.00% 0.00% 0.00% 0.00%
TOTALS $1,786,846 $89,076 $92,243 $0 $0 $30,517 $0 $0 $211,836 11.86% $120,518,231 $22,268,959 18.48% 11.03% 27.40% 0.91%

3.28% 1.16% 1.73% 0.42% 11.88% 0.00% 0.01% 18.48%
B Black WF White Female
H Hipanic SE Socially and Economically Disadvantaged
AA Asian-American D Disabled
AI American Indian DNS Did Not Submit report
LEGEND

FY 2011-2012
(7/1/2011-6/30/2012)
STATE
UNIVERSITIES
To
tal
De
pt.
($
)
B (
$)
H (
$)
AA
($
)
AI
($)
WF
($
)
SE
($
)
D (
$)
To
tal
HU
B (
$)
To
tal
HU
B (
%)
YT
D T
ota
l ($
)
YT
D H
UB
($
)
YT
D H
UB
(%
)
Q1
HU
B (
%)
Q2
HU
B (
%)
Q3
HU
B (
%)
Q4
HU
B (
%)
Appalachian State University $0 $0 $0 $0 $0 $0 $0 $0 $0 0.00% $0 $0 0.00% 0.00% 0.00% 0.00% 0.00%
East Carolina University $3,728,194 $148,042 $0 $0 $0 $477,669 $0 $0 $625,711 16.78% $3,728,194 $625,711 16.78% 17.00% 16.25% 0.00% 0.00%
Elizabeth City State University $435,385 $57,914 $0 $0 $0 $0 $0 $0 $57,914 13.30% $435,385 $57,914 13.30% 0.00% 13.30% 0.00% 0.00%
Fayetteville State University $327,200 $0 $0 $0 $327,200 $0 $0 $0 $327,200 100.00% $327,200 $327,200 100.00% 0.00% 0.00% 100.00% 0.00%
North Carolina A&T State University $0 $0 $0 $0 $0 $0 $0 $0 $0 0.00% $0 $0 0.00% 0.00% 0.00% 0.00% 0.00%
North Carolina Arboretum $0 $0 $0 $0 $0 $0 $0 $0 $0 0.00% $0 $0 0.00% 0.00% 0.00% 0.00% 0.00%
North Carolina Central University $0 $0 $0 $0 $0 $0 $0 $0 $0 0.00% $0 $0 0.00% 0.00% 0.00% 0.00% 0.00%
North Carolina School of Science and Math $176,754 $24,500 $17,449 $0 $0 $9,875 $0 $0 $51,824 29.32% $176,754 $51,824 29.32% 28.28% 0.00% 30.40% 0.00%
North Carolina School of the Arts $0 $0 $0 $0 $0 $0 $0 $0 $0 0.00% $0 $0 0.00% 0.00% 0.00% 0.00% 0.00%
North Carolina State University $7,677,843 $329,086 $5,715 $0 $5,405 $1,498,387 $0 $0 $1,838,593 23.95% $7,677,842 $1,838,592 23.95% 18.52% 28.08% 29.84% 14.35%
UNC Hospitals $0 $0 $0 $0 $0 $0 $0 $0 $0 0.00% $0 $0 0.00% 0.00% 0.00% 0.00% 0.00%
UNC-Asheville $0 $0 $0 $0 $0 $0 $0 $0 $0 0.00% $0 $0 0.00% 0.00% 0.00% 0.00% 0.00%
UNC-Chapel Hill $0 $0 $0 $0 $0 $0 $0 $0 $0 0.00% $0 $0 0.00% 0.00% 0.00% 0.00% 0.00%
UNC-Charlotte $26,195,400 $739,713 $272,252 $0 $190,759 $17,210,111 $0 $0 $18,412,835 70.29% $26,195,400 $18,412,835 70.29% 78.79% 23.10% 100.00% 70.31%
UNC-General Administration $0 $0 $0 $0 $0 $0 $0 $0 $0 0.00% $0 $0 0.00% 0.00% 0.00% 0.00% 0.00%
UNC-Greensboro $3,551,678 $967,457 $140,553 $27,750 $23,417 $415,259 $0 $73,820 $1,648,256 46.41% $3,551,679 $1,648,255 46.41% 72.88% 25.38% 49.45% 60.40%
UNC-Pembroke $0 $0 $0 $0 $0 $0 $0 $0 $0 0.00% $0 $0 0.00% 0.00% 0.00% 0.00% 0.00%
UNC-TV $0 $0 $0 $0 $0 $0 $0 $0 $0 0.00% $0 $0 0.00% 0.00% 0.00% 0.00% 0.00%
UNC-Wilmington $163,136 $0 $0 $0 $0 $0 $0 $0 $0 0.00% $163,136 $0 0.00% 0.00% 0.00% 0.00% 0.00%
Western Carolina University $62,724 $0 $0 $0 $0 $39,844 $0 $0 $39,844 63.52% $62,724 $39,844 63.52% 63.52% 0.00% 0.00% 0.00%
Winston-Salem State University $1,206,798 $77,955 $0 $112,120 $0 $220,180 $0 $0 $410,255 34.00% $1,206,798 $410,255 34.00% 32.07% 8.06% 21.53% 65.66%
TOTALS $43,525,112 $2,344,667 $435,969 $139,870 $546,781 $19,871,325 $0 $73,820 $23,412,432 53.79% $43,525,112 $23,412,430 53.79% 68.55% 23.92% 37.73% 45.06%
% of Total Purchasing 5.39% 1.00% 0.32% 1.26% 45.65% 0.00% 0.17% 53.79%
10.01% 1.86% 0.60% 2.34% 84.88% 0.00% 0.32% 100.00%
Q1
Appalachian State University (DNS) $0 $0 $0 $0 $0 $0 $0 $0 $0 0.00%
East Carolina University $2,643,092 $138,000 $0 $0 $0 $311,416 $0 $0 $449,416 17.00%
Elizabeth City State University (DNS) $0 $0 $0 $0 $0 $0 $0 $0 $0 0.00%
Fayetteville State University (DNS) $0 $0 $0 $0 $0 $0 $0 $0 $0 0.00%
HUB PARTICIPATION REPORT - CONSTRUCTION (Includes FORMAL and
INFORMAL Projects)YEAR-TO-DATE SUMMARY
NORTH CAROLINA DEPARTMENT OF ADMINISTRATIONOFFICE FOR HISTORICALLY UNDERUTILIZED BUSINESSES
% of Minority Participation
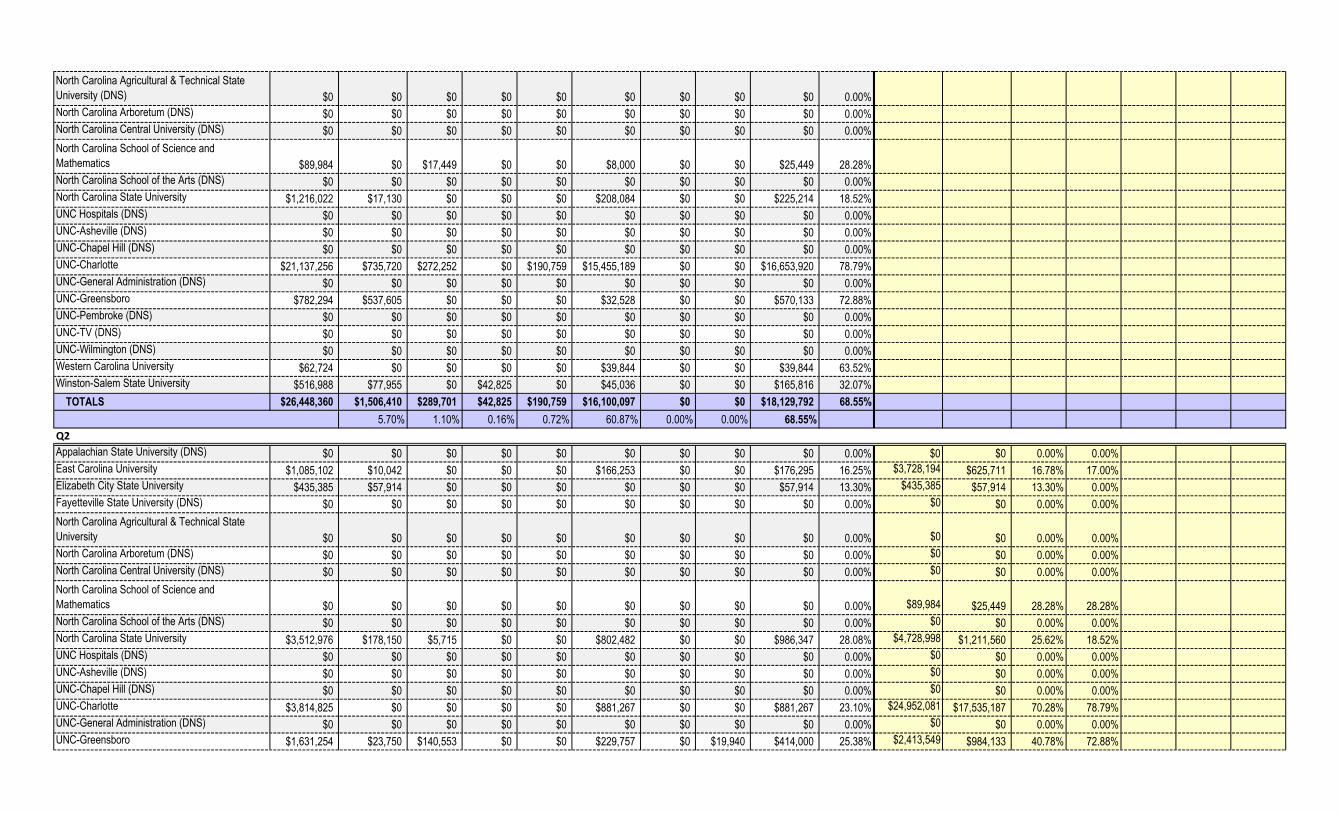
North Carolina Agricultural & Technical State
University (DNS) $0 $0 $0 $0 $0 $0 $0 $0 $0 0.00%
North Carolina Arboretum (DNS) $0 $0 $0 $0 $0 $0 $0 $0 $0 0.00%
North Carolina Central University (DNS) $0 $0 $0 $0 $0 $0 $0 $0 $0 0.00%
North Carolina School of Science and
Mathematics $89,984 $0 $17,449 $0 $0 $8,000 $0 $0 $25,449 28.28%
North Carolina School of the Arts (DNS) $0 $0 $0 $0 $0 $0 $0 $0 $0 0.00%
North Carolina State University $1,216,022 $17,130 $0 $0 $0 $208,084 $0 $0 $225,214 18.52%
UNC Hospitals (DNS) $0 $0 $0 $0 $0 $0 $0 $0 $0 0.00%
UNC-Asheville (DNS) $0 $0 $0 $0 $0 $0 $0 $0 $0 0.00%
UNC-Chapel Hill (DNS) $0 $0 $0 $0 $0 $0 $0 $0 $0 0.00%
UNC-Charlotte $21,137,256 $735,720 $272,252 $0 $190,759 $15,455,189 $0 $0 $16,653,920 78.79%
UNC-General Administration (DNS) $0 $0 $0 $0 $0 $0 $0 $0 $0 0.00%
UNC-Greensboro $782,294 $537,605 $0 $0 $0 $32,528 $0 $0 $570,133 72.88%
UNC-Pembroke (DNS) $0 $0 $0 $0 $0 $0 $0 $0 $0 0.00%
UNC-TV (DNS) $0 $0 $0 $0 $0 $0 $0 $0 $0 0.00%
UNC-Wilmington (DNS) $0 $0 $0 $0 $0 $0 $0 $0 $0 0.00%
Western Carolina University $62,724 $0 $0 $0 $0 $39,844 $0 $0 $39,844 63.52%
Winston-Salem State University $516,988 $77,955 $0 $42,825 $0 $45,036 $0 $0 $165,816 32.07%
TOTALS $26,448,360 $1,506,410 $289,701 $42,825 $190,759 $16,100,097 $0 $0 $18,129,792 68.55%
5.70% 1.10% 0.16% 0.72% 60.87% 0.00% 0.00% 68.55%
Q2
Appalachian State University (DNS) $0 $0 $0 $0 $0 $0 $0 $0 $0 0.00% $0 $0 0.00% 0.00%
East Carolina University $1,085,102 $10,042 $0 $0 $0 $166,253 $0 $0 $176,295 16.25% $3,728,194 $625,711 16.78% 17.00%
Elizabeth City State University $435,385 $57,914 $0 $0 $0 $0 $0 $0 $57,914 13.30% $435,385 $57,914 13.30% 0.00%
Fayetteville State University (DNS) $0 $0 $0 $0 $0 $0 $0 $0 $0 0.00% $0 $0 0.00% 0.00%
North Carolina Agricultural & Technical State
University $0 $0 $0 $0 $0 $0 $0 $0 $0 0.00% $0 $0 0.00% 0.00%
North Carolina Arboretum (DNS) $0 $0 $0 $0 $0 $0 $0 $0 $0 0.00% $0 $0 0.00% 0.00%
North Carolina Central University (DNS) $0 $0 $0 $0 $0 $0 $0 $0 $0 0.00% $0 $0 0.00% 0.00%
North Carolina School of Science and
Mathematics $0 $0 $0 $0 $0 $0 $0 $0 $0 0.00% $89,984 $25,449 28.28% 28.28%
North Carolina School of the Arts (DNS) $0 $0 $0 $0 $0 $0 $0 $0 $0 0.00% $0 $0 0.00% 0.00%
North Carolina State University $3,512,976 $178,150 $5,715 $0 $0 $802,482 $0 $0 $986,347 28.08% $4,728,998 $1,211,560 25.62% 18.52%
UNC Hospitals (DNS) $0 $0 $0 $0 $0 $0 $0 $0 $0 0.00% $0 $0 0.00% 0.00%
UNC-Asheville (DNS) $0 $0 $0 $0 $0 $0 $0 $0 $0 0.00% $0 $0 0.00% 0.00%
UNC-Chapel Hill (DNS) $0 $0 $0 $0 $0 $0 $0 $0 $0 0.00% $0 $0 0.00% 0.00%
UNC-Charlotte $3,814,825 $0 $0 $0 $0 $881,267 $0 $0 $881,267 23.10% $24,952,081 $17,535,187 70.28% 78.79%
UNC-General Administration (DNS) $0 $0 $0 $0 $0 $0 $0 $0 $0 0.00% $0 $0 0.00% 0.00%
UNC-Greensboro $1,631,254 $23,750 $140,553 $0 $0 $229,757 $0 $19,940 $414,000 25.38% $2,413,549 $984,133 40.78% 72.88%
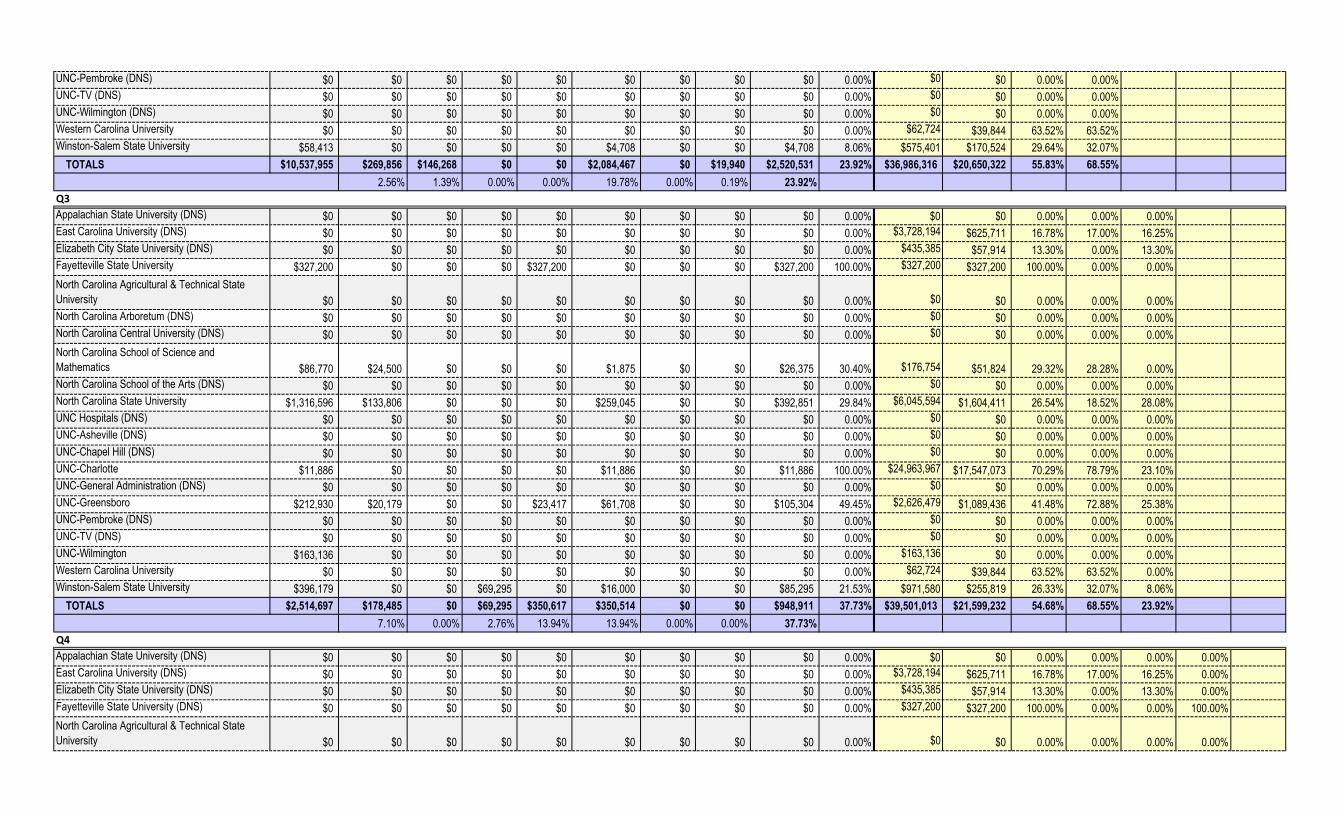
UNC-Pembroke (DNS) $0 $0 $0 $0 $0 $0 $0 $0 $0 0.00% $0 $0 0.00% 0.00%
UNC-TV (DNS) $0 $0 $0 $0 $0 $0 $0 $0 $0 0.00% $0 $0 0.00% 0.00%
UNC-Wilmington (DNS) $0 $0 $0 $0 $0 $0 $0 $0 $0 0.00% $0 $0 0.00% 0.00%
Western Carolina University $0 $0 $0 $0 $0 $0 $0 $0 $0 0.00% $62,724 $39,844 63.52% 63.52%
Winston-Salem State University $58,413 $0 $0 $0 $0 $4,708 $0 $0 $4,708 8.06% $575,401 $170,524 29.64% 32.07%
TOTALS $10,537,955 $269,856 $146,268 $0 $0 $2,084,467 $0 $19,940 $2,520,531 23.92% $36,986,316 $20,650,322 55.83% 68.55%
2.56% 1.39% 0.00% 0.00% 19.78% 0.00% 0.19% 23.92%
Q3
Appalachian State University (DNS) $0 $0 $0 $0 $0 $0 $0 $0 $0 0.00% $0 $0 0.00% 0.00% 0.00%
East Carolina University (DNS) $0 $0 $0 $0 $0 $0 $0 $0 $0 0.00% $3,728,194 $625,711 16.78% 17.00% 16.25%
Elizabeth City State University (DNS) $0 $0 $0 $0 $0 $0 $0 $0 $0 0.00% $435,385 $57,914 13.30% 0.00% 13.30%
Fayetteville State University $327,200 $0 $0 $0 $327,200 $0 $0 $0 $327,200 100.00% $327,200 $327,200 100.00% 0.00% 0.00%
North Carolina Agricultural & Technical State
University $0 $0 $0 $0 $0 $0 $0 $0 $0 0.00% $0 $0 0.00% 0.00% 0.00%
North Carolina Arboretum (DNS) $0 $0 $0 $0 $0 $0 $0 $0 $0 0.00% $0 $0 0.00% 0.00% 0.00%
North Carolina Central University (DNS) $0 $0 $0 $0 $0 $0 $0 $0 $0 0.00% $0 $0 0.00% 0.00% 0.00%
North Carolina School of Science and
Mathematics $86,770 $24,500 $0 $0 $0 $1,875 $0 $0 $26,375 30.40% $176,754 $51,824 29.32% 28.28% 0.00%
North Carolina School of the Arts (DNS) $0 $0 $0 $0 $0 $0 $0 $0 $0 0.00% $0 $0 0.00% 0.00% 0.00%
North Carolina State University $1,316,596 $133,806 $0 $0 $0 $259,045 $0 $0 $392,851 29.84% $6,045,594 $1,604,411 26.54% 18.52% 28.08%
UNC Hospitals (DNS) $0 $0 $0 $0 $0 $0 $0 $0 $0 0.00% $0 $0 0.00% 0.00% 0.00%
UNC-Asheville (DNS) $0 $0 $0 $0 $0 $0 $0 $0 $0 0.00% $0 $0 0.00% 0.00% 0.00%
UNC-Chapel Hill (DNS) $0 $0 $0 $0 $0 $0 $0 $0 $0 0.00% $0 $0 0.00% 0.00% 0.00%
UNC-Charlotte $11,886 $0 $0 $0 $0 $11,886 $0 $0 $11,886 100.00% $24,963,967 $17,547,073 70.29% 78.79% 23.10%
UNC-General Administration (DNS) $0 $0 $0 $0 $0 $0 $0 $0 $0 0.00% $0 $0 0.00% 0.00% 0.00%
UNC-Greensboro $212,930 $20,179 $0 $0 $23,417 $61,708 $0 $0 $105,304 49.45% $2,626,479 $1,089,436 41.48% 72.88% 25.38%
UNC-Pembroke (DNS) $0 $0 $0 $0 $0 $0 $0 $0 $0 0.00% $0 $0 0.00% 0.00% 0.00%
UNC-TV (DNS) $0 $0 $0 $0 $0 $0 $0 $0 $0 0.00% $0 $0 0.00% 0.00% 0.00%
UNC-Wilmington $163,136 $0 $0 $0 $0 $0 $0 $0 $0 0.00% $163,136 $0 0.00% 0.00% 0.00%
Western Carolina University $0 $0 $0 $0 $0 $0 $0 $0 $0 0.00% $62,724 $39,844 63.52% 63.52% 0.00%
Winston-Salem State University $396,179 $0 $0 $69,295 $0 $16,000 $0 $0 $85,295 21.53% $971,580 $255,819 26.33% 32.07% 8.06%
TOTALS $2,514,697 $178,485 $0 $69,295 $350,617 $350,514 $0 $0 $948,911 37.73% $39,501,013 $21,599,232 54.68% 68.55% 23.92%
7.10% 0.00% 2.76% 13.94% 13.94% 0.00% 0.00% 37.73%
Q4
Appalachian State University (DNS) $0 $0 $0 $0 $0 $0 $0 $0 $0 0.00% $0 $0 0.00% 0.00% 0.00% 0.00%
East Carolina University (DNS) $0 $0 $0 $0 $0 $0 $0 $0 $0 0.00% $3,728,194 $625,711 16.78% 17.00% 16.25% 0.00%
Elizabeth City State University (DNS) $0 $0 $0 $0 $0 $0 $0 $0 $0 0.00% $435,385 $57,914 13.30% 0.00% 13.30% 0.00%
Fayetteville State University (DNS) $0 $0 $0 $0 $0 $0 $0 $0 $0 0.00% $327,200 $327,200 100.00% 0.00% 0.00% 100.00%
North Carolina Agricultural & Technical State
University $0 $0 $0 $0 $0 $0 $0 $0 $0 0.00% $0 $0 0.00% 0.00% 0.00% 0.00%
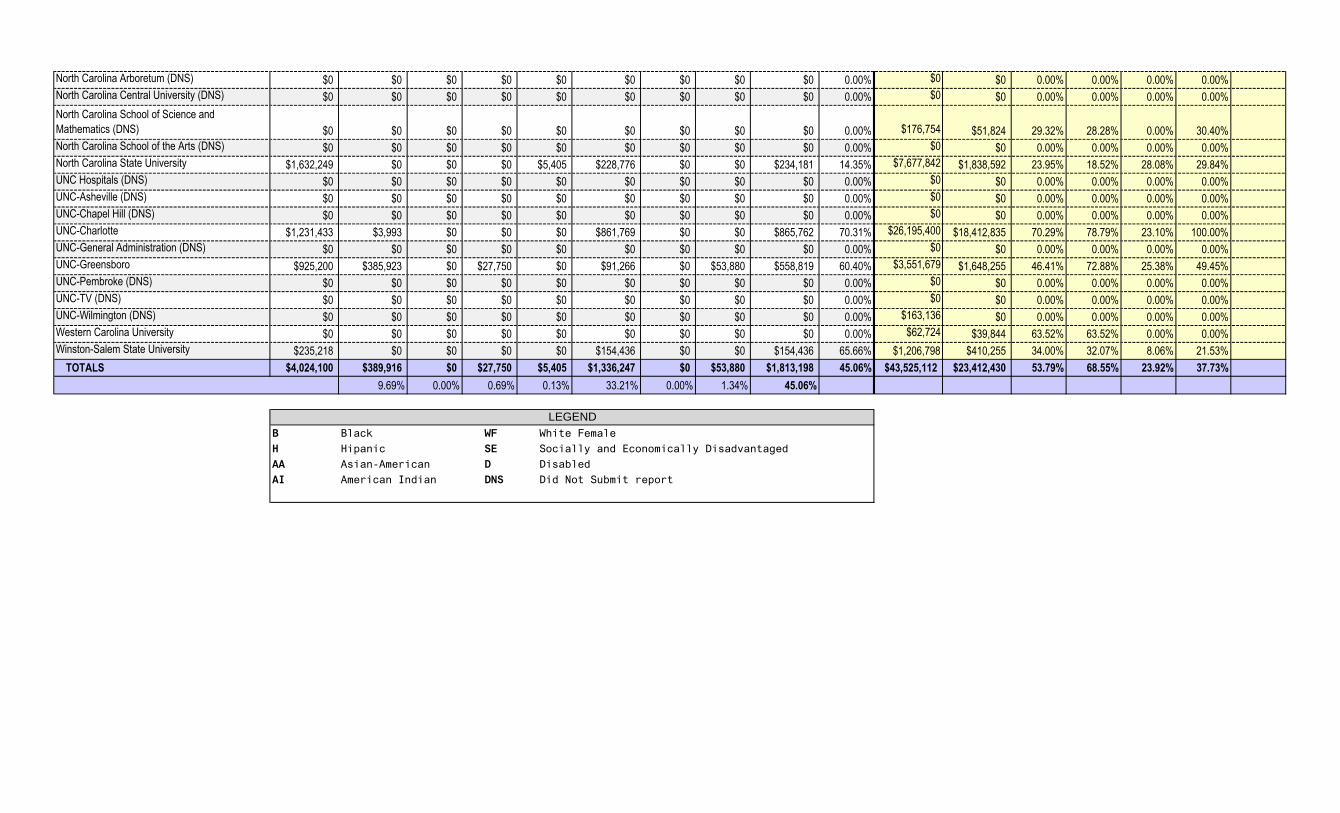
North Carolina Arboretum (DNS) $0 $0 $0 $0 $0 $0 $0 $0 $0 0.00% $0 $0 0.00% 0.00% 0.00% 0.00%
North Carolina Central University (DNS) $0 $0 $0 $0 $0 $0 $0 $0 $0 0.00% $0 $0 0.00% 0.00% 0.00% 0.00%
North Carolina School of Science and
Mathematics (DNS) $0 $0 $0 $0 $0 $0 $0 $0 $0 0.00% $176,754 $51,824 29.32% 28.28% 0.00% 30.40%
North Carolina School of the Arts (DNS) $0 $0 $0 $0 $0 $0 $0 $0 $0 0.00% $0 $0 0.00% 0.00% 0.00% 0.00%
North Carolina State University $1,632,249 $0 $0 $0 $5,405 $228,776 $0 $0 $234,181 14.35% $7,677,842 $1,838,592 23.95% 18.52% 28.08% 29.84%
UNC Hospitals (DNS) $0 $0 $0 $0 $0 $0 $0 $0 $0 0.00% $0 $0 0.00% 0.00% 0.00% 0.00%
UNC-Asheville (DNS) $0 $0 $0 $0 $0 $0 $0 $0 $0 0.00% $0 $0 0.00% 0.00% 0.00% 0.00%
UNC-Chapel Hill (DNS) $0 $0 $0 $0 $0 $0 $0 $0 $0 0.00% $0 $0 0.00% 0.00% 0.00% 0.00%
UNC-Charlotte $1,231,433 $3,993 $0 $0 $0 $861,769 $0 $0 $865,762 70.31% $26,195,400 $18,412,835 70.29% 78.79% 23.10% 100.00%
UNC-General Administration (DNS) $0 $0 $0 $0 $0 $0 $0 $0 $0 0.00% $0 $0 0.00% 0.00% 0.00% 0.00%
UNC-Greensboro $925,200 $385,923 $0 $27,750 $0 $91,266 $0 $53,880 $558,819 60.40% $3,551,679 $1,648,255 46.41% 72.88% 25.38% 49.45%
UNC-Pembroke (DNS) $0 $0 $0 $0 $0 $0 $0 $0 $0 0.00% $0 $0 0.00% 0.00% 0.00% 0.00%
UNC-TV (DNS) $0 $0 $0 $0 $0 $0 $0 $0 $0 0.00% $0 $0 0.00% 0.00% 0.00% 0.00%
UNC-Wilmington (DNS) $0 $0 $0 $0 $0 $0 $0 $0 $0 0.00% $163,136 $0 0.00% 0.00% 0.00% 0.00%
Western Carolina University $0 $0 $0 $0 $0 $0 $0 $0 $0 0.00% $62,724 $39,844 63.52% 63.52% 0.00% 0.00%
Winston-Salem State University $235,218 $0 $0 $0 $0 $154,436 $0 $0 $154,436 65.66% $1,206,798 $410,255 34.00% 32.07% 8.06% 21.53%
TOTALS $4,024,100 $389,916 $0 $27,750 $5,405 $1,336,247 $0 $53,880 $1,813,198 45.06% $43,525,112 $23,412,430 53.79% 68.55% 23.92% 37.73%
9.69% 0.00% 0.69% 0.13% 33.21% 0.00% 1.34% 45.06%
B Black WF White Female
H Hipanic SE Socially and Economically Disadvantaged
AA Asian-American D Disabled
AI American Indian DNS Did Not Submit report
LEGEND

FY 2011-2012
(7/1/2011-6/30/2012)
SUPPORTING
AGENCIES
To
tal
Dep
t. (
$)
B (
$)
H (
$)
AA
($)
AI
($)
WF
($)
SE
($)
D (
$)
To
tal
HU
B (
$)
To
tal
HU
B (
%)
YT
D T
ota
l ($
)
YT
D H
UB
($)
YT
D H
UB
(%
)
Q1 H
UB
(%
)
Q2 H
UB
(%
)
Q3 H
UB
(%
)
Q4 H
UB
(%
)
NC Office of Information Technology Services $0 $0 $0 $0 $0 $0 $0 $0 $0 0.00% $0 $0 0.00% 0.00% 0.00% 0.00% 0.00%
NCDENR - Wildlife Resources Commission $338,100 $0 $0 $0 $0 $0 $0 $0 $0 0.00% $338,100 $0 0.00% 0.00% 0.00% 0.00% 0.00%
North Carolina State Ports Authority $0 $0 $0 $0 $0 $0 $0 $0 $0 0.00% $0 $0 0.00% 0.00% 0.00% 0.00% 0.00%
TOTALS $338,100 $0 $0 $0 $0 $0 $0 $0 $0 0.00% $338,100 $0 0.00% 0.00% 0.00% 0.00% 0.00%
% of Total Purchasing 0.00% 0.00% 0.00% 0.00% 0.00% 0.00% 0.00% 0.00%
0.00% 0.00% 0.00% 0.00% 0.00% 0.00% 0.00% 0.00%
Q1
NC Office of Information Technology Services
(DNS) $0 $0 $0 $0 $0 $0 $0 $0 $0 0.00%
NCDENR - Wildlife Resources Commission
(DNS) $0 $0 $0 $0 $0 $0 $0 $0 $0 0.00%
North Carolina State Ports Authority $0 $0 $0 $0 $0 $0 $0 $0 $0 0.00%
TOTALS $0 $0 $0 $0 $0 $0 $0 $0 $0 0.00%
0.00% 0.00% 0.00% 0.00% 0.00% 0.00% 0.00% 0.00%
Q2
NC Office of Information Technology Services
(DNS) $0 $0 $0 $0 $0 $0 $0 $0 $0 0.00% $0 $0 0.00% 0.00%
NCDENR - Wildlife Resources Commission
(DNS) $0 $0 $0 $0 $0 $0 $0 $0 $0 0.00% $0 $0 0.00% 0.00%
North Carolina State Ports Authority $0 $0 $0 $0 $0 $0 $0 $0 $0 0.00% $0 $0 0.00% 0.00%
TOTALS $0 $0 $0 $0 $0 $0 $0 $0 $0 0.00% $0 $0 0.00% 0.00%
0.00% 0.00% 0.00% 0.00% 0.00% 0.00% 0.00% 0.00%
Q3
NC Office of Information Technology Services
(DNS) $0 $0 $0 $0 $0 $0 $0 $0 $0 0.00% $0 $0 0.00% 0.00% 0.00%
HUB PARTICIPATION REPORT - CONSTRUCTION (Includes FORMAL and
INFORMAL Projects)YEAR-TO-DATE SUMMARY
NORTH CAROLINA DEPARTMENT OF ADMINISTRATIONOFFICE FOR HISTORICALLY UNDERUTILIZED BUSINESSES
% of Minority Participation

NCDENR - Wildlife Resources Commission $0 $0 $0 $0 $0 $0 $0 $0 $0 0.00% $0 $0 0.00% 0.00% 0.00%
North Carolina State Ports Authority $0 $0 $0 $0 $0 $0 $0 $0 $0 0.00% $0 $0 0.00% 0.00% 0.00%
TOTALS $0 $0 $0 $0 $0 $0 $0 $0 $0 0.00% $0 $0 0.00% 0.00% 0.00%
0.00% 0.00% 0.00% 0.00% 0.00% 0.00% 0.00% 0.00%
Q4
NC Office of Information Technology Services
(DNS) $0 $0 $0 $0 $0 $0 $0 $0 $0 0.00% $0 $0 0.00% 0.00% 0.00% 0.00%
NCDENR - Wildlife Resources Commission $338,100 $0 $0 $0 $0 $0 $0 $0 $0 0.00% $338,100 $0 0.00% 0.00% 0.00% 0.00%
North Carolina State Ports Authority $0 $0 $0 $0 $0 $0 $0 $0 $0 0.00% $0 $0 0.00% 0.00% 0.00% 0.00%
TOTALS $338,100 $0 $0 $0 $0 $0 $0 $0 $0 0.00% $338,100 $0 0.00% 0.00% 0.00% 0.00%
0.00% 0.00% 0.00% 0.00% 0.00% 0.00% 0.00% 0.00%
B Black WF White Female
H Hipanic SE Socially and Economically Disadvantaged
AA Asian-American D Disabled
AI American Indian DNS Did Not Submit report
LEGEND

FY 2011-2012
(7/1/2011-6/30/2012)
WATER AND SEWER
AUTHORITIES
To
tal
De
pt.
($
)
B (
$)
H (
$)
AA
($
)
AI
($)
WF
($
)
SE
($
)
D (
$)
To
tal
HU
B (
$)
To
tal
HU
B (
%)
YT
D T
ota
l ($
)
YT
D H
UB
($
)
YT
D H
UB
(%
)
Q1
HU
B (
%)
Q2
HU
B (
%)
Q3
HU
B (
%)
Q4
HU
B (
%)
Onslow Water and Sewer Authority $2,451,693 $35,423 $0 $226,663 $0 $149,419 $0 $0 $411,505 16.78% $2,451,692 $411,505 16.78% 0.00% 20.96% 46.84% 2.26%
Piedmont Triad Regional Water Authority $0 $0 $0 $0 $0 $0 $0 $0 $0 0.00% $0 $0 0.00% 0.00% 0.00% 0.00% 0.00%
Sewerage District - Buncombe County Metropolitan $0 $0 $0 $0 $0 $0 $0 $0 $0 0.00% $0 $0 0.00% 0.00% 0.00% 0.00% 0.00%
Water and Sewer Authority - Cabarrus County $0 $0 $0 $0 $0 $0 $0 $0 $0 0.00% $0 $0 0.00% 0.00% 0.00% 0.00% 0.00%
Water and Sewer Authority - Orange County $0 $0 $0 $0 $0 $0 $0 $0 $0 0.00% $0 $0 0.00% 0.00% 0.00% 0.00% 0.00%
TOTALS $2,451,693 $35,423 $0 $226,663 $0 $149,419 $0 $0 $411,505 16.78% $2,451,692 $411,505 16.78% 0.00% 20.96% 46.84% 2.26%
% of Total Purchasing 1.44% 0.00% 9.25% 0.00% 6.09% 0.00% 0.00% 16.78%
8.61% 0.00% 55.08% 0.00% 36.31% 0.00% 0.00% 100.00%
Q1
Onslow Water and Sewer Authority $0 $0 $0 $0 $0 $0 $0 $0 $0 0.00%
Piedmont Triad Regional Water Authority (DNS) $0 $0 $0 $0 $0 $0 $0 $0 $0 0.00%
Sewerage District - Buncombe County Metropolitan $0 $0 $0 $0 $0 $0 $0 $0 $0 0.00%
Water and Sewer Authority - Cabarrus County (DNS) $0 $0 $0 $0 $0 $0 $0 $0 $0 0.00%
Water and Sewer Authority - Orange (DNS) $0 $0 $0 $0 $0 $0 $0 $0 $0 0.00%
TOTALS $0 $0 $0 $0 $0 $0 $0 $0 $0 0.00%
0.00% 0.00% 0.00% 0.00% 0.00% 0.00% 0.00% 0.00%
Q2
Onslow Water and Sewer Authority $396,370 $3,250 $0 $0 $0 $79,819 $0 $0 $83,069 20.96% $396,370 $83,069 20.96% 0.00%
Piedmont Triad Regional Water Authority (DNS) $0 $0 $0 $0 $0 $0 $0 $0 $0 0.00% $0 $0 0.00% 0.00%
Sewerage District - Buncombe County Metropolitan $0 $0 $0 $0 $0 $0 $0 $0 $0 0.00% $0 $0 0.00% 0.00%
Water and Sewer Authority - Cabarrus County (DNS) $0 $0 $0 $0 $0 $0 $0 $0 $0 0.00% $0 $0 0.00% 0.00%
Water and Sewer Authority - Orange $0 $0 $0 $0 $0 $0 $0 $0 $0 0.00% $0 $0 0.00% 0.00%
TOTALS $396,370 $3,250 $0 $0 $0 $79,819 $0 $0 $83,069 20.96% $396,370 $83,069 20.96% 0.00%
0.82% 0.00% 0.00% 0.00% 20.14% 0.00% 0.00% 20.96%
Q3
Onslow Water and Sewer Authority $632,433 $0 $0 $226,663 $0 $69,600 $0 $0 $296,263 46.84% $1,028,802 $379,332 36.87% 0.00% 20.96%
Piedmont Triad Regional Water Authority (DNS) $0 $0 $0 $0 $0 $0 $0 $0 $0 0.00% $0 $0 0.00% 0.00% 0.00%
Sewerage District - Buncombe County Metropolitan $0 $0 $0 $0 $0 $0 $0 $0 $0 0.00% $0 $0 0.00% 0.00% 0.00%
Water and Sewer Authority - Cabarrus County (DNS) $0 $0 $0 $0 $0 $0 $0 $0 $0 0.00% $0 $0 0.00% 0.00% 0.00%
HUB PARTICIPATION REPORT - CONSTRUCTION (Includes FORMAL and
INFORMAL Projects)#VALUE!
NORTH CAROLINA DEPARTMENT OF ADMINISTRATIONOFFICE FOR HISTORICALLY UNDERUTILIZED BUSINESSES
% of Minority Participation

Water and Sewer Authority - Orange (DNS) $0 $0 $0 $0 $0 $0 $0 $0 $0 0.00% $0 $0 0.00% 0.00% 0.00%
TOTALS $632,433 $0 $0 $226,663 $0 $69,600 $0 $0 $296,263 46.84% $1,028,802 $379,332 36.87% 0.00% 20.96%
0.00% 0.00% 35.84% 0.00% 11.01% 0.00% 0.00% 46.84%
Q4
Onslow Water and Sewer Authority $1,422,890 $32,173 $0 $0 $0 $0 $0 $0 $32,173 2.26% $2,451,692 $411,505 16.78% 0.00% 20.96% 46.84%
Piedmont Triad Regional Water Authority (DNS) $0 $0 $0 $0 $0 $0 $0 $0 $0 0.00% $0 $0 0.00% 0.00% 0.00% 0.00%
Sewerage District - Buncombe County Metropolitan $0 $0 $0 $0 $0 $0 $0 $0 $0 0.00% $0 $0 0.00% 0.00% 0.00% 0.00%
Water and Sewer Authority - Cabarrus County (DNS) $0 $0 $0 $0 $0 $0 $0 $0 $0 0.00% $0 $0 0.00% 0.00% 0.00% 0.00%
Water and Sewer Authority - Orange (DNS) $0 $0 $0 $0 $0 $0 $0 $0 $0 0.00% $0 $0 0.00% 0.00% 0.00% 0.00%
TOTALS $1,422,890 $32,173 $0 $0 $0 $0 $0 $0 $32,173 2.26% $2,451,692 $411,505 16.78% 0.00% 20.96% 46.84%
2.26% 0.00% 0.00% 0.00% 0.00% 0.00% 0.00% 2.26%
B Black WF White Female
H Hipanic SE Socially and Economically Disadvantaged
AA Asian-American D Disabled
AI American Indian DNS Did Not Submit report
LEGEND